Embed Size (px)
Citation preview

.' ..
PSYCHOPATHY AND DETECTION OF DECEPTION
IN A PRISON POPULATION
Report No. 75-1
Contract 75 NI 99-0001
Department of Psychology
University of Utah
Salt Lake City, Utah 84112
David C. Raskin, Ph.D.
Principal Investigator
June, 1975
I
If you have issues viewing or accessing this file contact us at NCJRS.gov.

Introduction
Although a number of investigators have conducted lie detection stud:tes
with criminals and ~rimina1 suspects (e.g., Bar1and, 1975; Bersh, 1969;
KugeJ,mass, Lieb1ich, Ben-Ishai, Opatowski., & Kaplan, 1968; Luria, 1932; Marston,
1921), only the Bar1and study dealt with the problem of the effectiveness of
detection of deception with psychopaths. It is well established that individuals
diagnosed as psychopathic (sociopathic) are relatively hypbreactive autonomically
(Hare, 1970, in press). On "the basis of such findings and the commonly-held
belief that psychopaths can successfully deceive almost anyone, there are
frequent claims that psychopaths can "beat" the polygraph test (Bar1and & Raskin,
1973; Ferguson & Miller, 1974, p. 215 ff.).
In the Bar1and (1975) study an attempt was made to determine if psycho-
paths were more difficult to detect in a situation where criminal suspects were
examined using field polygraph techniques. Individuals were referred by prosecut
oria1, law enforcement, and defense sources for examination concerning the crime
of which they were accused. From a sample of 77 such cases, psychopath and non
psychopath groups were identified using scores obtained from the Minnesota
Multiphasic Personality Inventory (MMPI), which was administered prior to the
polygraph test. The 15 subjects who scored highest in psychopathy were designated
as psychopaths, and the 15 lowest scorers were designated nonpsychopaths. There
was no difference in rate of deceptive outcome or magnitude of polygraph scores
for the two groups.
There are two important problems which arise in the interprtation of Bar1and's
results. First, the MMPI may nat be a very good instrument for diagnosing psycho-

2
pathy (Hare, 1972). Therefore, it is probably more accurate to identify
psychopaths by employing clinical diagnoses similar to those reported by
Hare (in press). Second, the Bar1and study was based on the results of field
polygraph examinations in which there was some uncertainty about whether or
not the sUbject was deceptive (grourtd truth). In o~der to obtain results
in which greater confidence can be placed, it is necessary to have certain
knowledge of ground truth as is provided in a laboratory experiment. The
present research employed both of the above approaches. Furthermore, field
polygraph techniques and a mock crime were utilized in an effort to simulate
the field situation .•
Method
Subjecto
Subjects were obtained from the inmate population of the Lower Mainland
Regional Correction Centre in Burnaby, British Columbia. A total of 54 male
inmates volunteered for a !llie detection" experiment in which they could win
a $20 bonus for successful performance. The subjects were divided into psycho
path and nonpsychopath groups on the basis of a clinical diagnosis similar to
that described by Hare and Quinn (1971).
Each potential subject's file was obtained from the records center at the
prison. The information consisted of reports by correction officers, parole
officers, physicians, psychiatrists, psychologists, and social workers as well
as copies of letters written by the inmate, background information sheets,
criminal records, court transcripts, law enforcement and inmate versions of the
offenses, parole applications, and daily log sheets. Using that information,
a trained and experienced researcher made a global assessment of the presence

3
or absence of psychopathy. That diagnosis of psychopathy was based upon
the presence of many of the following indicators and the absence of counter
indications:
1. Manipulative behavior -- threats of suicide, pseudo-attempts
of suicide, pseudo-remorse, playing people against each other,
lying, glibness, bogus physical complaints,. blaming others,
rationalizing own beh~vior, charming.
2. Impulsivity -- sensation-seeking, quick temper (assaults,
fights), low frustration tolerance, poor judgment, hedonism,
ability to delay gratification.
3. Lack of empathy -- crimes against people (fraud, armed robbery,
extortion, rape, false pretenses), inability to form stable
relationships with others, sexual promiscuity, contempt for
others, treats others as objects, parasitical, uses people.
4. Childhood -- parental protectiveness against punitive parent
or society, early delinquency (especially pre-adolescent),
flatness of affect) unable to learn from experi.ence.
5. Counter-indications -- genuine suicide attempts, crimes
mainly impersonal, stability of family relationships or
marriage, genuine remorse, subcultural delinquency, anxiety,
stable f~mployment history, concern for others, normal educational
history.

4
Of the 54 volunteers, 4 were discarded because of initial problems
with the instructions and questior structure, 1 was actively psychotic,
and 1 failed to conceal the $20 pruperly. The remaining subjects consisted
of 24 psychopaths (mean age = 23.1 years) and 24 nonpsychopaths (mean age=
26.5 years). Half of each group was randomly assigned to the "guilty"
condition, and half waS assigned to the "innocent" condition.
Procedure.
When a subject arrived for the experiment, he was met by an assistant
who explained the nature of the experiment and administered a number of psycho
logical tests. Then the assistant flipped a coin to determine whether the
subject would be in the "guilty" o~ "innocent" condition. If the subject was
in the "guilty" condition, he was 'old that there was a $20 bill in an envelope
in a drawer in a nearby room. Tha" room was normally off-limits to inmates,
and a prison guard was stationed ( . ":s:.de the door. The subj ect was instructed
to obtain the $20 bill from th~ envelope when no one was observing him and to
hide it in his pocket. He was informed that he would be taken to another room
and be given a lie detector test concerning the $20. He was instructed to deny
having taken the $20; and if he succeeded in being cleared by the polygraph test,
he would win the $20. The "innocent" subjects 'tV'ere informed about the "crime"
comIrtitted by the "guilty" subjects, and they were also instructed to deny having
taken the money. If they successfully demonstrated their truthfulness, they
also received a $20 bonus. Thus, all subjects were instructed to deny having
taken the money, and all subje~'ts who produced truthful polygraph charts received
a $20 bonus. The $20 represented a considerable sum of money to the subjects,
since they earned $. 75/day for working at a prison job and had no other obvious
sources of income.

5
The subject was then taken to the examination room, where a psycho
physiologist trained in fieldpolygrnph techniques ndminlstered 1\ cC'mtrol
question polygraph examination. The examin.er did not know whether the subject
was "guilty" or "innocent", or if he was psychopathic. The examination con
sisted of a pretest interview folloWE:;d by phy[;liological recordings obtained
during the test phase. During the pr(~test interview the examiner obtained
biographical information from the subject, reviewed the questions with the sub
ject, and explained the physiological measures to be obtained and the theory
underlying the use of the polygraph for detecting deception.
The polygraph test was a gederal government t}~e of control-question test
similar to that employed by Barland and Raskin (in press). It consisted of 10
questions including relevant questions at positions 5, 7, and 10 and control
questions at positions 4, 6, and 9. All oE the questions except the control
questions were the same for each subject. The control questions were adjusted
to fit each individual, and their wording was worked out with the subject prior
to administering the test. A typical question sequence was as follows:
1. Were you born in Canada?
2. Regarding that $20, do you intend to answer truthfully each
question about that?
3. Are you completely convinced I will not ask a question that
hasn't been reviewed?
4. Other than what you told me, before you were 18 did you ever
steal any money?
5. Did you take that $20?
6. Did you ever steal anything else from someone who trusted you? _
7. Did you take that $20 from the drawer?

8.
9.
10.
Is your last name ? ----Have YOti ever taken anything- of value from an employer?
Do you have that $20 now?
6
Prior to administering the polygraph test the subject was attached to
the polygraph, and a number tel3t was conducted in order to adjust the instru
ment and to demonstrate the effectiv,eness of the technique to the subject.
He was asked to choose a numbe7c between "3" and "6", and the number was
written on a card and taped on the wall directly in front of where he was
seated. He was then told that he would be asked about the number that he had
chosen and that he was to anwer "no" to all of the questions. During the test
the subject was seated facing away from the examiner and the polygraph, and
both subject and experimenter observed the card with the number on it. The
examiner then asked a series of questions about numbers from "1" to "7".
Following the number test, the subject was informed that everything was working
well, and that the results showed a large reaction to the number he had chosen
and very little reaction to the other numbers. The subject was then told that
the test indicated what his reactions looked like when he was lying and when he
was telling the truth, and he was told that he had nothing to worry about as
long as he truthfully answered every question on the polygraph test.
The polygraph test concerning the $20 was then administered. It consisted
of a minimum of thrlae charts obtained while the 10 questions were al3ked at a
rate of one every 25-35 sec. If the results were not obvious after the third
chart, additional charts were obtained up to a maximum of seven charts. If
more than three charts were obtained, the fourth chart was a silent answer test
in which. the subject was instxucted to answex silently to himself (Horvath &

7
Reid, 1972).
Following each chart, the examiner asked the subject if any questions
bothered him and if he would like to change the wording of any questions.
The attention of all subjects was directed toward the control questions,
and it was often necessary 'to modify the specific wording of one or more
control questions following admissions or expressions of concern by the sub
ject. The wording of the relevant questions was never modified. Prior to
each chart the subject was cautioned to tell the truth in ans'wering every
question. He was told that if he lied to any question, there would be reactions
on the chart. That procedure was designed to focus the concern of "innocent"
subjects on the contrcl questions and to enhance the concern of "guilty"
subjects with regard to the relevant questions. After the last chart had been
obtained, a field-type numerical evaluation of the charts was performed by
the examiner (Barland & Raskin, in press), and a decision was made on the basis
of that score as described below.
Apparatus.
A 'Beckman Type R Dynograph was used to record the physiological activity
at a chart speed of 2.5mm/sec. The amplitude of recordings was adjusted to
provide pen excursions of approximately 1.5 - 3 em in most cases. Thoracic
and abdominal respiration recordings were obtained from pneumatic tubes positioned
around the upper thorax and abdomen. Each pneumatic tube was attached to a
Grass PT5A Volumetric Pressure Transducer, and the signal from that was fed
into a Beckman 9853A Voltage/Pulse/Pressure coupler. Skin conductance (SC)
was obtained from electrodes placed on the thenar and hypothenar eminences of

8
the left hand and connected to & Beckman 9842 Galvanic Skin Response Coupler,
which imposed .5V across the electrodes. The recordings were made using a
22-sec time constant. Skin potential (SP) was obtained from an active electrode
placed on the thenar eminence of the right hand and an inactive electrode
positioned approximately 4 em below the elbow on the volar surface of the
forearm. The skin beneath the inactive site was vigorously rubbed with an
alcohol-dampened, coarse tissue until a local erythema was produced. A time
constant of 17 sec was utilized. Heart rate (HR) was obtained from electrodes
attached to the right wrist and left ankle (EKG Lead II) and connected to a
Beckman 9857 cardiotachometer Coupler. Due to equipment malfunction, c()n
siderable HR data were lost, and the HR data are not reported here. ALL of
the electrodes were Beckman Biopotential filled with .05M NaCl in a cornstarch
paste and attached wittr Beckman adliesive collars. Prior to electrode applic
ation each site was cleaned with 95% ethanol. Vasomotor activity was rH~corded
from the left thumb using a photoelectric plethysmography consisting of a
Fairchild FPA 104 transducer which consists of a light-emitting diode t~d a
phototransistor. the transducer was placed in an aluminum cyclinder and
attached by means of an adXiesive collar and masking tape. The signal was fed
into a Beckman 9874 Photocell Coupler. Finger pulse amplitude (FPA) was
obtained by recording the signal with a .l-sec time constant, and finger blood
volume (FBV) was recorded with a 20-sec time constant.
Quantification of the Data.
There were two types of evaluations made on the charts. .The '<first consisted
of an on-the-spot, numerical evaluation similar to that employed by the U.S.

9
Army Military Police School (Harland & Raskin, in press). The criteria
for responses were modified to include only those-which have been demonstrated
to discriminate between truth and deception in laboratory studies (Podlesny &
Raskin, 1975). Specifically, the following criteria were used in scoring
responses: Respiration-- sustained decreases in amplitude, slowing of rate,
increases in baseline, apnea; Skin Conductance -- increase in SC, multiple
responses, increased duration of response; Cardiovascular -- decrease in FHV,
decrease in FPA, slowing of HR.
Using the above criteria, the responses t r ' control and relevant questions
were compared for each type of measure (respiration, skin conductance, cardio
vascular) on each chart. The responses to adjacent pairs of control and relevant
questions (4-5, 6-7, 9-10) were compared, and a number ranging from +3 to -3
was assigned to each pair for each type of measure on each chart. The sign and
size of each such score was determined according to the relative magnitudes of
the responses to the control and relevant question in each pair. If the response
to the control question was larger, then a positive score was assigned; if the
response to the relevant question was larger, a negative score was assigned; and
a zero was assigned if there was no difference between the two responses.
Whether the response was assigned a value of 1, 2, or 3 was determined by criteria
used by USAMPS (1970). The total score was obtained by summing the scores over
all question pairs, charts, and measures. If the total score was +6 or higher,
the subject was judged to be truthful; if it was -6 or lower, the subject was
judged deceptive; and a score between ±6 was considered inconclusive.

10
The second type of analysis of the charts consisted of an objective
quantification of responses by a technician who had no knowledge of the
field evaluations or the treatments administered to the subjects. Measure
ments were made on the responses to each of the three control and three
relevant questions on the first three charts obtained from each subject,
since all subjects had at least three charts. The following scores were
obtained for each of those 18 observations:
1. Thoracic Respiration Amplitude (TRA). The amplitude in rom of the
first complete inspiration following the answer to the question was
subtracted from the amplitude of the last full inspiration preced
ing the beginning of the question. This provided an index of change
in RA, with positive scores indicating decreases in RA and negative
scores indicating increases in RA.
2. Abdominal Respiration Amplitude (ARA). Scores for this measure
were obtained from the abdominal tracing in the same manner as those
described for TRA.
3. Respiration Cycle Time (RCT). The distance in rom between the points
of maximum inspiration for the two respiration cycles following the
question was subtracted from the distance between the points of maximum
inspiration for the two cycles preceding the onset of the question.
This provided an index associated with cha~ge in rate of respiration,
with positive scores indicating speeding of respiration and negative
Scores indicating slowing.

11
4. Skin Conductance Response (SCR). The increase in mm was measured
from the onset of the first increase within 1 sec after the beginn
ing of the question to the highest point reached within 5 sec after
the answer. The scores were also converted to micromhos. Since
the scores expressed in mm yielded slightlY more reliable results,
they are the only 0nes reported here.
5. Skin Potential Response (SPR). The change in mv was measured for
the first wave which began within the period beginning 1 sec after
question onset and ending 5 sec after the answer. If the first wave
was a negative wave which was followed by a positive wave, then the
change in mv of the positive wave was measured f.rom the highest point
reached by the negative wave. Only waves which reached their peak
within 3 sec following their onset were considered to be positive waves.
That procedure was used to eliminate scoring as positive waves the
simple recovery toward baseline following a negative wave.
6. Finger Blood Volume (FBV).The decrease in mm of the diastolic level of
the tracing was measured from the highest point within the 4 sec follow
ing the onset of the question to the lowest point within 4-14 sec
following question onset. Since there was a very large range of gain
settings across subjects, all scores were corrected to a common gain.
7. Finger Pulse Amplitutde (FPA). The decrease in FPA was obtained by
calculating the difference in rom of the sum of the amplitudes of the
two largest adjacent pulses within 4 sec after the onset of the question
and the sum of the amplitude of the two smallest adjacent pulses within
4-14 sec after the onset of the question. These valaes were also
corrected to a common gain.

12
Results 1
Numerical Evaluations
Accuracy of decisions. Using the total score obtained for all of the charts
on each subject and an inconclu.< ive region of ±5 inclusive, 87.5% of the
subjects were correctly categorized, 4.2% were incorrectly categorized, and
8.3% were inconclusive. Excluding inconclusives, 95.5% were correctly cat-
egorized. Table 1 shows the breakdown of results for "guilty" and "innocent"
subjects and for psychopaths and nonpsychopaths.
TABLE I
EXAMINER DECISIONS BASED ON TOTAL NUMERICAL SCORES
Deceptive Truthful Inconclusive
"Guilty" 21 0 3
"Innocent" 2 21 1
Correct Wrong Inconclusive
Psychopaths 23 1 0
Nonpsychopaths 19 1 4
Combined 42 2 4
Although there were only 2 errors, both of them were false positives,
1. e., "innocent" subjects whose polygraph charts indicated deception. With
.regard to psychopathy, one of the errors occurred on a. psychopathic subject
and one on a nonpsychopath. It should be noted that no "guilti' subject .was
.1
The significance of all res~lts of statistical analyses was evaluated ust,ng a .05 rejection region.

13
able to produce a truthful result. There were no significant differences
in accuracy rates for psychopaths and nonpsychopaths.
A post facto manipulation of the cut-offs of the inconclusive region
was made for boundaries ranging from zero to ±12, and the results are shown
in Fig. 1 in terms of percent accuracy of decision and perc~nt inconclusives
for the "guilty" and "innocent" groups. When the inconclusive region was
limited to scores of zero, 96% of the "guilty" subjects and 88% of the
"innocent" subjects were correctly categorized, and there were no incon-
clusives. With boundaries of ±2 there was maximal accuracy. of decisions com
bined with a relatively low rate of inconclusives. As the boundaries of the
'inconclusive region were widened, there was no improvement in accuracy of
decisions and the percent of inconclusive cases eventually increased dramatically.
It appears that the optimal boundaries are somewhere in the region of ±2 to
±4. At any point in that region there were no false negatives, 9% false
positives, and 6% inconclusives.
Effectiveness of numerical scores. Since all subjects had at least three
charts, the total numerical scores for the first three charts were compared for
"guilty" and "innocent" for psychopaths and nonpsychopaths. The mean scores
for those groups are shown in Table 2.

100
90
80
70
60
50
~ ~ 40 p:j
ffl
30
20
10
0
~ " , • • • ~ " • • • GUILTY-DECE}PTIVE ___ ~______________ ~ INNOCENT-TRUTHFUL
o-__ ~ ~
·0
INNOCENT-INCONCLUSIVE
GUILTY-INJONCLUSlVE
+1 +2 ±3 +4 ±5 +6 +7 +8 ±9 +10 +11 +12
BOUNDARIES OF INCONCLUSIVE REGION
Fig. 1. ACCURACY OF DECISIONS AND PERCENT INCGNCLUSIVES FOR DIFFERENT INCONCLUSIVE REGIONS IN A CRIMINAL POPULATION.
I-' ~
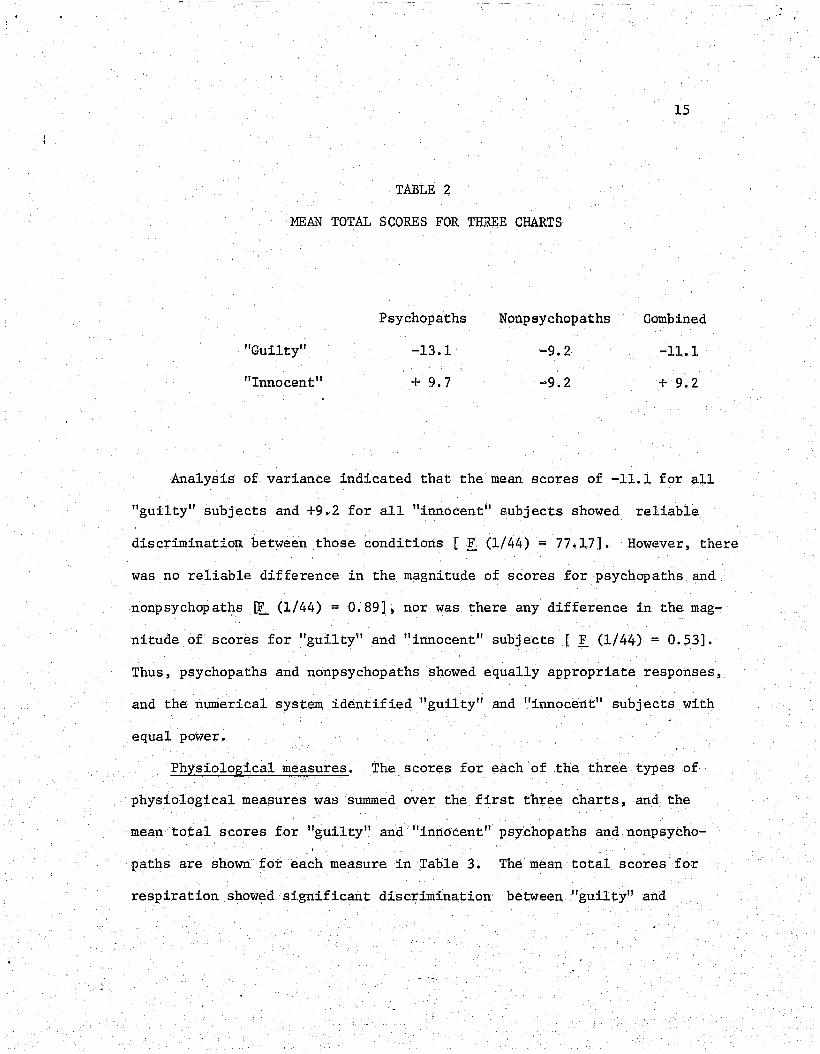
TABLE 2
MEAN TOTAL SCORES FOR THREE CHARTS
"Guilty"
"Innocent"
Psychopaths
-13.1
+ 9.7
Nonpsychopaths
.... 9.2
~9.2
15
Combined
-11.1
+ 9.2
Analysis of variance indicated that the mean scores of -11.1 for all
"guilty" subjects and +9.2 for all "innocent" subjects showed reliable
discrimination between those conditions [ E (1/44) = 77.17]. However, there
was no reliable difference in the magnitude of scores for psychopaths and
nonpsychopaths ~ (1/44) = 0.89], nor was there any difference in the mag
nitude of scores for "guilty" and "innocent" subjects [ F (1/44) = 0.53].
Thus, psychopaths and nonpsychopaths sh6wed equally appropriate responses,
and the numerical system identified "guilty" and "innocent" subjects with
equal power.
Physiological measures. The scores for each of the three types of
physiological measures was summed over the first three charts, and the
mean total scores for "guilty" and "innocent" psychopaths and nonpsycho
paths are shown for each measure in Table 3. The mean total scores for
respiration showed significant discrimination between "guilty" and

16
TABLE 3
MEAN T1IREE-CHART TOTALS FOR EACH MEASURE
Psychopaths Nonpsychopaths Combined
"Gu:l,lty" -2.5 -2.2 -2.3
Reapirs,ti¢n
"lnnocent" +4.5 +4.2 +4.3
"Guilty" -6.7 -4.9 -5.8
Skin Conductance
"Innocent'! +4.7 +2.9 +3.8
"Guilty" -3.9 -2.1 -3.0
CardioVllScular
"Innocent" +0.5 +2.1 +1.3
l1innocent fl Bubjects [ F (1/4 1.) "" 59.06], as did the mean total scores for
altin conductn~'lce [F (1/44) = 41. 26] and cardiovascular [F (1/44)= 22.74]. - -\1 1/
That'll was a Significant interaction between Guilty-Innocent and physio-
logicnl measures [ F (2/88) =5.06], and a Newman-Keu1s test showed that
the skin ci:>nductance measure produced ibetter discrimination bl.'!tween "guilty"
and lIinnOCel'lt" subjects than did the respiration and cardiovascular measures. @
Additional analyses showed that the means for each measure were significantly diff-
erent:front zero [t (1/44 >4.10]. l .. owever, the respiration measure identified
"innocentH subjects significantly better than "guilty" subjects [E. (1/44)=5.32J.
Xhere\\let'e no significant di£fet'ences between psychopaths and nonpsychopaths
on any measures. and there were no reliable differences across charts for any

17
measures.
Quantitative Analyses.
The first three polygraph charts for each subject were analyzed
using the procedures previously described. fuch of the dependent variables
generated in that manner was subjected to analysis of variance. Using the
contr01-question technique, discrimination between '~uilty'l and 'innocent"
• • \I . " subjects would be indicated by a significant 1nteract1on between Guilty-Innocent
and Question Type. That prediction is based on the principle that 'guilty ,I
subjects should slow larger responses to the relevant questions and 'innocent II
subjects should respond more strongly to control questions. The predicted
interactions were obtained in every dependent va~iable as described below.
Thoracic respiration amplitude (T~). The mean decrease in TRA is shown
in Table 4. As predicted, the "guiltyfl subjects showed larger reduction in
TABLE 4
MEAN DECREASE IN THORACIC RESPIRATION AMPLITUDE (TRA)
TO RELEVANT .AND CONTROL QUESTI.ONS FOR "GUILTY"
A...1\lD "INNOCENT" SUBJECTS
Control Relevant
"Guilty" .5 1.3
"Innocent" .3 - .6
TRA to the relevant than to the control questions, whereas, "innocent"
subjects showed larger responses to the control ~s compared to the relevant
questions [ ! (1/44) = 9.77]. The difference in mean responses to the control

18
and relevant questions was significant for both the "guilty" [!.(44) = 2.18]
and the llinrtoce.nt" subjects [~(44) = 2.l8J. Perhaps, even more important
Wl18 the finding that the "innocent" subjects responded in opposite directions
to the co.ntrol and relevant questions. "Innocent" subjects not only showed
a decrease in TRA in response to control questions, but they also showed an
increase in TAA following relevant questions. Thus, the TRA response in
"innocent" Bubjects Was one of suppression when they were deceptive and in-
creased amplitude of respiration when they were truthful. There was also an
overall difference in amount of suppression of TRA in the two groups
[.! (1/44) ". 6.49J. The "guilty" subjects produced a mean decrease of .9 in
IRA .averf.lged OVer both types of questions, and the "innocent" subjects showed
a mean increase of -.1 in TRA. Thus, the pattern of TRA responses in the two
grOups was characterized by suppression to both types of questions for the
"guilty" subjects and a differential response in "innocent" subjects consist-
ins of BUPP1:'ession to control questions and increased amplitude following
relevant questions. There were no meaningful effects associated with psycho
/ pathy or charts.
Abdominal respiration amplitude (ARA). The mean decrease in ARA is shown
:tn l'Llble 5. As predicted, the "guilty" subjects showed relatively greater
T.ABLE 5
~mAN DECREASE IN ABDOM!NAL RESPIRATION AMPLITUDE (ARA)
TO RELEVANT AND CONTROL QUESTIONS FOR l'GUILTY"
AND "INNOCENT" SUBJECTS
"Guilty"
"InnocencH
Control 1.3
1.2
Relevant 1.9
.1
19
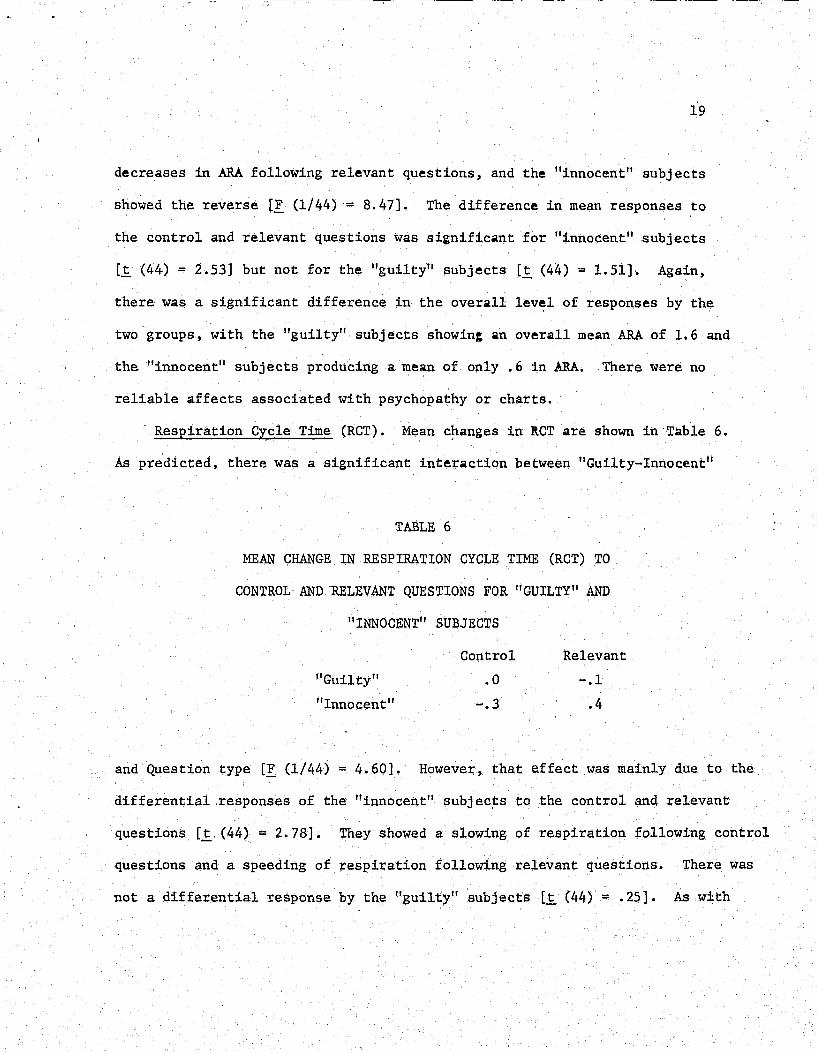
decreases in ARA following relevant questions, and the "innocent" subjects
showed the reverse [F (1/44) = 8.47]. The difference in mean responses to
the control and relevant questions was significant for "innocent" subjects
[t (44) = 2.53J but not for the "guilty" subjects [~ (44) = 1.51J. Again,
there was a significant difference in the overall 1ev~1 of responses by the
two groups, with the "guil ty" subj ects showin: an overall mean ARA of 1. 6 and
the "innocent" subjects producing a mean of only .6 in ARA. There were no
reliable affects associated with psychopathy or charts ..
. Respiration Cycle Time (RCT). Mean c~anges in RCT are shown in -,Table 6.
As predicted, there was a significant interaction between "Guilty-Innocent"
TABLE 6
MEAN CHANGE IN RESPIRATION CYCLE TIME (RCT) TO
CONTROL AND RELEVANT QUESTIONS FOR "GUILTY" AND
"INNOCENT" SUBJECTS
"Guilty"
"Innocent"
Control
.0
-.3
Relevant
-.1
.4
and Question type [F (1/44) = 4.60]. However, that affect was mainly due to the
differential responses of the "innocent" subjec~s to the control and relevant
questions [~ (44) = 2.78]. They showed a slowing of respiration follow~ng control
questions and a speeding of respiration following relevant questions. There was
not a differential response by the "guilty" subjects [~ (44) = .25]. As with

20
the 'l'RA measure, the "innocent" subjects responded in the opposite directions
of slowing of respil;ation following deception and speeding of respiration
following truthfulness. There were no reliable affects associated with psycho-
pathy and no meaningful changes across charts.
pkin Conductance Response (SCR). The mean SCRs to control and relevant
questions are presented in Table 7. As predicted, there was a significant
TABLE 7
MEAN SCR TO CONTROL AND RELEVANT QUESTIONS
FOR "GUILTY Ii AND "INNOCENT" SUBJECTS
Control Relevant
"Guilty"
"Innocent"
10.7
12.2
17.0
10.2
interaction between uGuilty-Innocent" and Question type [!. (1/44) = 34.52].
The "guilty'! subj ects showed significantly larger SCRs to the relevant questions
L!:. (44) t::r 6.34), and the "innocent" subjects showed significantly larger SCRs
to control questions (1. (44) == 1. 99). There was a significant overall effect
of Question type [F (1/44) = 9.40] which was accounted for by the disproportionately
large SCRs to .the relevant questions in the "guilty" subjects. There were no
reliable affects produced by psychopathy or charts.
Skin .Potential Response (SPR). The mel3.n negative and positive SPRs are
shown in Table 8~ As predicted, there w~re significant interactions. between
ItGu-;l.lty""'Xnnocent ll and Question Type for both negative SPR [F (1/44) = 12.01]

TABLE 8
MEAN POSITIVE AND NEGATIVE SPR TO CONTROL AND
RELEVANT QUESTIONS IN "GUILTY" AND "INNOCENT" SUBJECTS
Positive Negative
Control Relevant Control Relevant
"Guilty"
"Innocent"
4.2
5.7
6.2
5.5
4.8
6.3
8.0
7.1
21
and positive SPR [F (1/44) = 7.56]. In both measures, the effects were mainly
due to the relatively larger responses to the relevant questions by the "guilty"
subjects. The significant overall effects of Question Type for negative SPR
[F (1/44) = 8.04] and positive SPR [F (1/44) = 22.44] further demonstrated the
stronger e1jciting value of the relevant questions. In addition, there was a
significant interaction between Psychopathy and Question Type in the positive
SPR [F (1/44) = 5.98], which produced the disproportionately larger reactions
of the psychopaths to the relevant questions. ' The mean responses of psychopaths
and nonpsychopaths are shown in Table 9. It can be seen that the psychopaths
TABLE 9
MEAN POSITIVE SPR OF PSYCHOPATHS AND NONPSYCHOPATHS
TO CONTROL AND RELEVANT QUESTIONS .
Psychopath
Nonpsychopath
Control
6.2
4.9
~e1evant
9.2
5.8

22
showed significantly larger )?l'Jsitive SPRs to the relevant questions
[j;. (44) =: 5.081, whereas there was no reliable difference in response to
the two types of questions for the nonpsychopaths [E. (44) = 1. 62]. There
were alao significant decreases in positive S PR across charts [F (2/88) =24.49],
which were accounted fo~ by larger positive SPRs to the relevant as compared
to the control questions on th~ first chart [F (2/88) = 10.05].
Finger Blood Volume (FBV). Decreases in FBV produced the predicted inter
action between "GUilty.!. Innocent II and Question Type [F (1/44) = 4.15]. The mean
decrease in FBV is shot-ln in Table 10. The "guilty" subjects showed relatively
TABLE 10
HEAN DECREASE IN FBV TO CONTROL AND RELEVANT
QUESTIONS FOR IIGUILTY" AND "INNOCENT" SUBJECTS
"Guilty"
IIlnnocent"
Control
5.6
6.4
Relevant
6.7
5.8
Im:ger decreases in ]'BV to relevant questions, and the "innocent" subjE~cts
showed telntively larger responses to control questions. There '(vas also a
sisnific:nnt decrease in FBV reaponses across charts [F (2/88) = 8.87 J. There
were no effects associated with psych~athy.

23
Finger Pulse Amplitude (FPA). The decrease in FPA also produced the
predicted interaction between "Guilty -Innocent" and Question Type
[F (1/44) = 7.53] and an overall effect of Question Type [F (1/44) = 9.64J.
The mean responses are shown in Table 11.
TABLE 11
MEAN DECREASES IN FPA TO CONTROL AND
RELEVANT QUESTIONS FOR "GUILTY AND "INNOCENT" SUBJECTS
Control Relevant
"Guilty" 4.9 6.2
"Innocent" 3.8 3.9
The results were due to the differentially greater decrease in FPA to the
relevant as compared to control questions for the "guilty" subjects
[~ (44) = 4.14]. There was no differential response to the two types of
questions by the I'J.nnocent lfl subj ects [t (44) = .26]. and there were no reliable -- , effects associated with psychopathy or charts.
Discussion
The results of this study clearly demonstrate the effectiveness of the
control-question technique in detecting deception in a population of prison
inmates. Not only was there a 95.5% accuracy rate in decisions rendered, but
only 8.3% of the tests yielded inconclusive results. Furthermore, the results
strongly support the usefulness of the numerical scoring system developed and
used in field situations.

----~----~
24
The major predictions generated from the theory underlying control
question tests were all confirmed. Using the numerical scoring system, the
"guilty'l subjects showed reliably larger reactions to relevant ques~ions,
and the "innocent" subjects showed reliably larger reactions to control
questions. That was true for each of the three physiological systems, e.g.
respiration, skin conductanceJand cardiovascular. Those results are in
direct contradiction to the erroneous theoretical analysis presented by
Lykken (197 l,).
In his recent paper Lykken (1974) stated that control-question t~chniques
are designed to include control questions to which the subject answers truth
fully; if his responses to the control questions are equal to or greater than
the relevant questions, then the subject is judged to be truthful on the test.
He went on to argue that such a technique could not possibly work very well.
'Unfortunately, his description of the control questions is wrong with regard
to requiring a truthful answer by the subject, and he was also in error when
be l'3tated that a truthful result is obtained when responses to control and
relevant questions are of equal magnitude. In fact, the results of this study
clearly demonstrate the effectiveness of the control-question technique.
The major findings with regard to detectability of psychopaths clearly
refute the arguments that psychopaths can defeat the test. Not a single
IIguiltyUsubject, either psychopath or nonpsychopath, was a.ble to produce a
truthful t"esult. Furthermore, in contrast to the extensive literature reviewed
byaure (in press), psychopaths were at least as responsive as nonpsychopaths and
showed some indications of being more responsive in measures of skin potential.

------------------------------------~~----------------------~
25
Thus, the commonly-held belief that detection of deception techniques
are ineffective with psychopaths (Floch, 1950; Levitt, 1955) appears to
be unsupported by the evidence. If psychopaths have succeeded in "beating
the lie detector", they have probably succeeded in deceiving the examiner
rather than producing truthful results on the polygra.ph charts (Ferguson &
Miller, 1974, p. 217).
There is also a commonly-held belief among polygraph examiners that the
:f.nfrequent errors which do occur tend to favor guilty persons (Horvath &
Reid, 1971). However, the only ~rrors in this study we,re false positives,
1. e. errors of judging "innocent l1 subjects as deceptive. A similar pattern
of errors was found in a previous research (Bar1and, 1975; Barland & Raskin, in
press). On the basis of the available scientific data, it d.ppears that the
risk of error is greater with innocent rather than guilty persons. Thus,
Slomewhat greater caution should be exercised in interpreting deceptive results,
and somewhat greater confidence can be placed in the accuracy of results which
indicate truthfulness. An inspection of the size of scores required to make
a decision revealed that errors were minimized beyond scores of ±2 for the
j.nconclusive zone. Since false negatives (errors of calling an "innocent"
person deceptive) were reduced to zero and inconciusives were relatively low
up to scores of -5,optima1 results might be obtained with boundaries of the
inconclusive region set at +2 and -4.
The detailed analyses of the various physiological measures confirmed
the predictions from control-question theory, and they also provided som'e
interesting information about the usefulness of specific measures. Every
measure analyzed using either numerical scoring or quantitative measures showed

26
the predicted responses of "guilty" nnd "innocent" AlIb.lt.!{'ts. lIowever. the
power of different measures to discriminate "innocent" and "guilty" subjects
was variable.
Although all three physiological measures showed significant identification
of "guilt" and lIinnocent" subjects when numerical evaluation was used, skin
conductance responses provided better discrimination between the conditions
than did respiration and cardiovascular responses. However, the. respiration
scores identified "innocent" subjects significantly better than "guilty" subjects,
whereas the other. two measures showed no reliable differences in identification
of "guilty" and "innocent" subjects.
Further, detailed analyses of respiration amplitude and respiration cycle
time added additional information about the special usefulness of respiration
measures in identifying "innocent" subjects. Decreases in both thoracic and
abdominal respiration amplitude were greater to control questions in lIinnocent ll
subjects, but only thoracic measures showed reliably greater decreases to
relevant questions aTflong "guilty" subj ects. Even more striking was the find
ing that "innocent" subjects responded with thoracic respiration amplitude
changes in opposite directions for control and relevant questions. When they
were deceptive with regard .. to control questions, their thoracic respiration
showed suppressed amplitude; but when they were truthful with regard to relevant
questions, they showed increased amplitude of thoracic respiration. A similar
effect was not found with IIgui1ty" subjects nor with abdominal respiration
amplitude. Thus, it appears that thoracic respiration may be a more useful
measure, especially in identifying truthfulness.

27
Results obtained using respiration cycle time, were similar to those
obtained with respiration amplitude. Respiration cycle time successfully
differentiated truth and deception only for "innocent" subjects. Further
more, "innocent" subjects showed a differential response similar to that
obtained with thoracic respiration amplitude. They showed a slowing of
respiration following control questions and a speeding of respiratibn follow
ing respiration. Thus, deception by "innocent" subjects was accompanied by
slowed respiration, and truthfulness was accompanied by increased respiration
rate. The results obtained with thoracic respiration amplitude and respir
ation cycle time indicate a particular effectiveness of those measures with
"innocent" subjects and a·response which goes in one direction (suppression
and slowing) following deception and the opposite direction (increased amplitude
and speeding) following truthfulness. Those are the only measures which have
demonstrated specific characteristics which are specifically associated with
truthfulness and deception (Pod1~sny & Raskin, 1975).
All of the other measures showed reliable effects in the predicted directions.
However, the electrodermal measures (skin conductance and skin potential) and
decreases in finger pulse amplitude showed reliably larger- responses overall
to relevant questions. That finding raises some cautions for interpreting
those measures, since they were more effective with "guilty" than with "innocent"
subjects. In fact, th-e two "innocent" subj'ects who were erroneously judged
to be deceptiv2 showed almost all of their -inappt:opriate responses in the
electrodermal and cardiovascular measuresJand one of them showed truthfulness
in respiration measures. Thus, it appears that the small risk of error in

28
control-question tests seems to be associated with inappropriate electro
dermal and cardiovascular responses to relevant questions in "innocent"
subjects, and the presence of respiration responses in the truthful direction
should create the suspicion of a possible false positive.
Finally, it should be mentioned that there was little evidence of
systematic changes in the usefulness of various measures across successive
charts. Such a concept has been put forward by Backster (1969), who calls
it the "to ta1-chart-minutes " concept. Backster asserts that the three major
components are optimally useful at different times within a polygraph test,
with respiration being most useful in the earlier portion of the test, cardio
vascular during the middle portion, and skin resistance during the later
portions. The data from this study are in direct contradiction to Backster's
principal assertions, and there appears to be no evidence to support his
position.

" ..
29
References
Backster, C. Tri-Zone Polygraph. New York: Backster Research Foundation, 1969.
Barland, G. H. Det~ction of deception in criminal suspects. Unpublished
Doctoral Dissertation, University of Utah, 1975.
Barland, G. H. & Raskin, D. C. Detection of deception. In W. F. Prokasy
and D. C. Raskin (Eds.), Electrodermal activity in psychological
research. New York: Academic Press, 1973.
Barland, G. H. & Raskin, D. C. An evaluation of field techniques in detection
of deception. Psychophysiology, in press.
Bersh, P. J. A validation study of polygraph examiner judgments. Journal
of Applied Psychology, 1969, 53, 399-403.
Ferguson, R. J. & Miller, A. L. Polygraph for the defense. Springfield,
Illinois: Charles C. Thomas, 1974.
Floch, M. Limitations of the lie detector. Journal of Criminal Law
and Criminology, 1950, 40, 651-652.
Hare, R. D. Psychopathy. New York: Wiley, 1970.
Hare, R. D. Psychophysiological studies· of psychopathy. Paper presented
at the Ninth ~nual Conference on Current Concerns in Clinical Psychology,
University of Iowa, 1972.
Hare, R. D. Psychopathy. In P. H. Venables and M. J. Christie (Eds.),
Research in Psychophysiology, New York: Wiley, in press.
Hare, R. D. & Quinn, M. J. Psychopathy and autonomic conditioning.
Journal of Abnormal Psychology, 1971, 11., 223-235.

30
Horvath, 'E.S. and Reid, J.E. The reliability of polygraph examiner
diagnoses of truth and deception. Journal of Criminal Law, Criminology
and Police Science, 1971, &1, 276-281-
Horv(lth, F.S. and Reid, J.E. The polygraph silent answer test. Journal
.of Criminal Law, Criminology and Police Science, 1972, 63, 285-293.
l~igelmasB, S., Lieblich, I., Ben-~shai, Opatowski, A., & Kaplan, M.
Experime.ntal evaluation of galvanic skin response and blood pressure
change indices during criminal investigation. Journal of Criminal
Law, Criminology and Police Science, 1968, ~, 632-635.
l~evitt,E~ E. Scientific evaluation of the lIlie detector".
,towa Law Review, 1955, 40, 440-458.
Luria, A. R. The nature of human conflicts. New York: Liveright, 1932.
Lykken, D. T. Psychology and the lie detector industry. American
JJsychologist, 1974, 12, 724-739.
Ha.rston,W. M. Psychological possibilities in the deception tests.
dpurnal of Criminal Law and Criminology, 1921, 11, 551-570.
Podlesny, J. A. and Ral'lkin, D. C. Physiological Measures and the Detection
of Deception, submitted for publication", 1975.
,~ .' .
.. ..

;;;a. __
'.
7