Embed Size (px)
Citation preview
Supplemental Figure 1. Multiple plasma membrane proteins aggregate in pat3 cells.
Incidence rate quantification for accumulations formed by PIN1-GFP (A), PIN2-GFP (B),
PIP2a-GFP (C) and AUX1-YFP (D) in pat3 cells compared to the control plotted as the
percentage of cells having pronounced aggregations (1), punctate intracellular signals (2) and
no intracellular accumulations (3); for each of the marker lines 4 roots were examined of
which 15 cells were analyzed per root. To visualize the intracellular aggregations of PIN2-
GFP (B), PIP2a-GFP (C) and AUX1-YFP (D) dark treatment was used, for 3h for the first
two cargos and 8h, respectively.
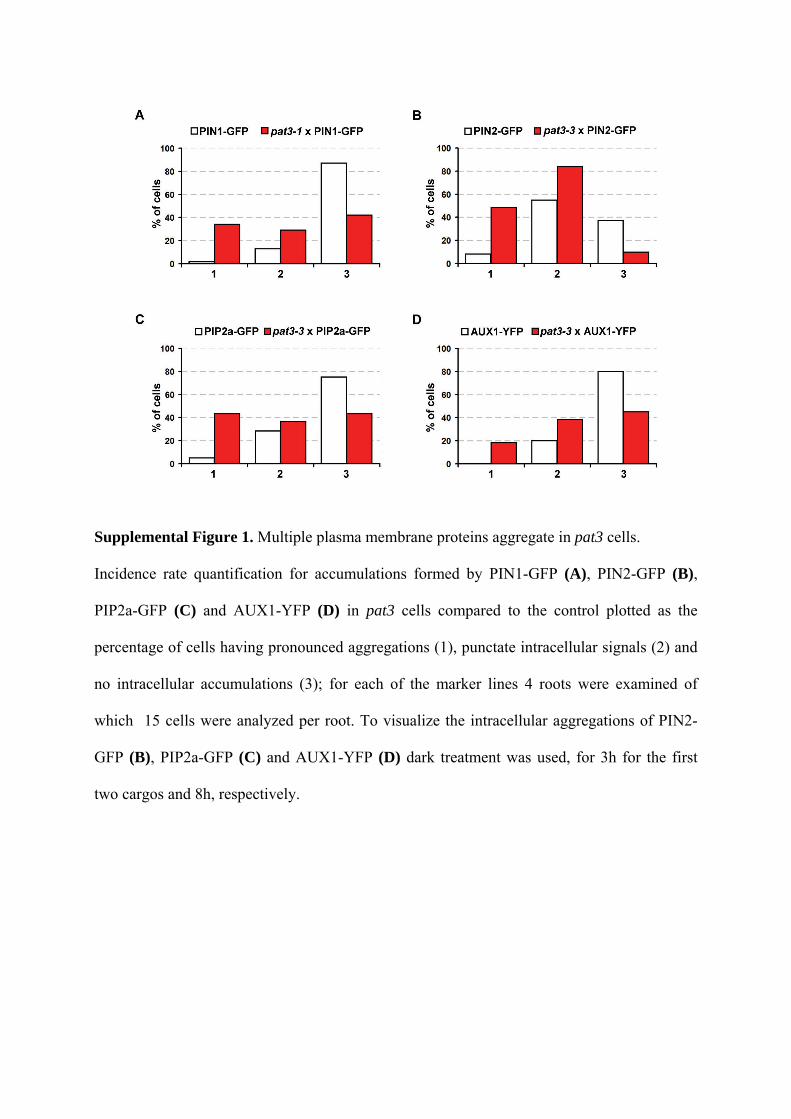
Supplemental Figure 2. pat3 mutants do not display altered levels of plasma membrane
localized components of auxin transport or auxin related phenotypes.
(A, B) Intensity line profile across multiple cells in PIN1-GFP and pat3-1 x PIN1-GFP (A) as
well as AUX1-YFP and pat3-3 x AUX1-YFP (B). The corresponding confocal images are
included for illustration. White dashed arrows in the confocal pictures indicate the area of
signal intensity assessment measured as pixel grey values. In figures (A, B) red arrowheads
indicate the plasma membrane signals in pat3 cells, while grey arrows indicate the
aggregations.
(G, H) pat3 does not show changes in auxin response patterns visualized by DR5rev::GFP.
(I) Root gravitropism circular histogram showing the response of WT (n = 51) and pat3-3 (n
= 50) after 90° gravity stimulation. Bars = 10 µm (A, B, C, D).

Supplemental Figure 3. pat3 mutants do not display strong morphological defects in
nutrient-saturated growth conditions.
(A, B) Root length analysis of 6-days old seedlings of pat3-3 and WT compared between 1%
sucrose supplemented (A) and sucrose free medium (B); values are the average of 2 biological
replicates (number of roots measured - n > 35 per each replicate). Error bars represent SEs 2
biological repeats.
(C) Frequencies of growth arrest of seedlings germinated on medium containing 1% sucrose
in WT control and pat3-3. Histogram shows the percentage of normal (1), arrested (2) and
non-germinated (3) seedlings; values are the average of 2 biological replicates (number of
seedlings - n > 120 per each replicate); error bars represent SEs 2 biological repeats.
(D) Adult plants of pat3-3 (right), pat3-2 and pat3-1 show similar morphological phenotypes
as WT (left). Bars = 1 cm (G).
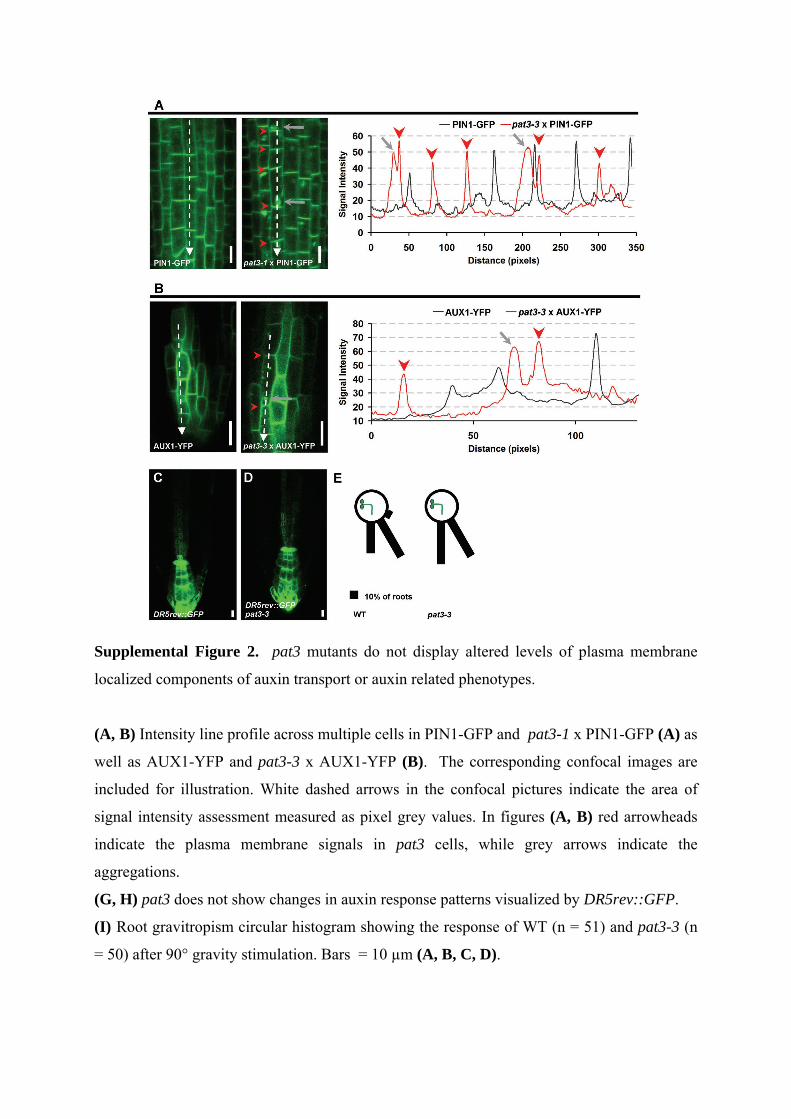
Supplemental Figure 4. pat3 mutant does not show any defects in early endocytic pathway.
(A-F) Early endocytosis is not affected in pat3. (A, B) Early time point (2 µM; 5 min) FM4-
64 uptake is not affected in pat3 mutant (A) in comparison to the WT control (B).
(C-F) Both early endocytic markers VHAa1-GFP (D) and SYP61-GFP (F) do not reveal
alterations when compared to the controls (C, E).
(G, H) Immunolabelling of Sec21 decorating Golgi and ER reveals a comparable pattern in
WT (G) and in pat3 (H). Bars = 10 µm.
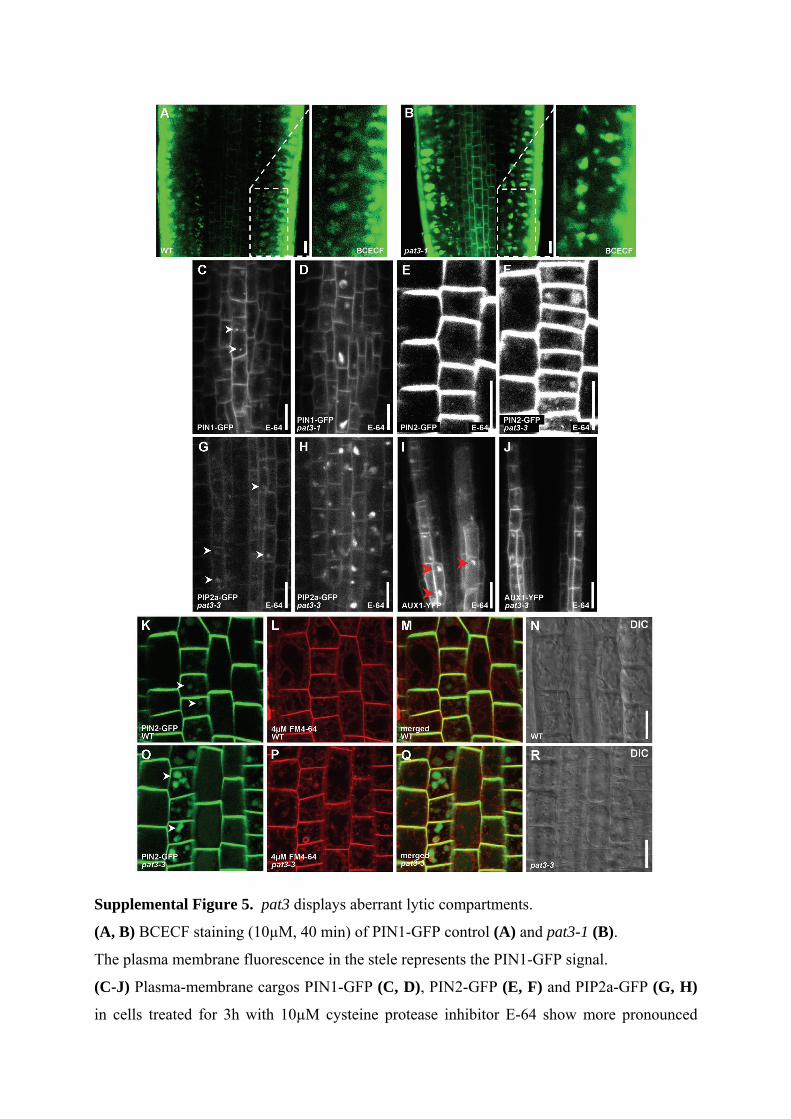
Supplemental Figure 5. pat3 displays aberrant lytic compartments.
(A, B) BCECF staining (10µM, 40 min) of PIN1-GFP control (A) and pat3-1 (B).
The plasma membrane fluorescence in the stele represents the PIN1-GFP signal.
(C-J) Plasma-membrane cargos PIN1-GFP (C, D), PIN2-GFP (E, F) and PIP2a-GFP (G, H)
in cells treated for 3h with 10µM cysteine protease inhibitor E-64 show more pronounced

intracellular aggregations in pat3 (D, F, H) in comparison to the control (C, E, G). In those
conditions AUX1-YFP (I, J) shows comparable aggregations in pat3 (J) and in the control (I)
as indicated by red arrowheads. White arrowheads indicate the small aggregations of PIN1-
GFP (C) and PIP2a-GFP (D) forming in wild-type after E-64 treatment.
(K-R) Increased levels of plasma membrane proteins accumulating in the lumen of pat3 (Q-
R) vacuoles labeled by PIN1-GFP (green, arrowheads) and outlined with FM4-64 (red; 4 µM)
after 3h of dye accumulation in darkness, also depicted as colocalization of both channels and
differential interference contrast picture (DIC); (K-N) corresponding pictures for the WT
control. Bars = 10 µm.
Supplemental Figure 6. Transmission electron microscopy micrographs visualize aberrant
vacuole-like structures with multiple inclusions in pat3 cells.
(A, B) Overview of the ultrastructure of pat3 cells reveals massive endomembrane structures
(arrowheads) with intralumenal inclusions (B) that are not present in the WT (A). Bars = 10
µm.

Supplemental Figure 7. Morphology of the vacuoles and hypocotyl gravitropic response are
not affected in pat3.
(A-F) Mature vacuole morphology visualized by fluorescence of SYP22-YFP (A-C) and σ-
TIP-GFP (D-F) does not reveal differences between the WT and pat3 but shows alternations
in pat2-2, a mutant of AP-3 β adaptor complex.
(G-I) Hypocotyl bending accordingly to the gravity vector. (G) Statistical analysis of
hypocotyl gravitropic response is summarized in the histogram showing averaged angle
measurements of 90° gravistimulated seedlings; values are the average of 2 biological
replicates (number of seedlings analyzed for each line - n > 38 per each replicate); error bars
represent SEs for 2 biological repeats. The difference in hypocotyl bending between WT and
pat2 is highly significant as indicated by a t-test (p-value < 0.01).
Phenotypes of 90° gravistimulated seedlings of pat3 (H) and pat2-2 (I); WT (left) and pat
mutants (right). Bars = 10 µm (A-F) and = 1 cm (H, I).

Supplemental Figure 8. Dilated PVCs in pat3 visualized by electron microscopy.
(A-C) Overview of the root cells after an 1-h treatment with 33 µM wortmannin, cells of both
pat3 alleles (B, C) show strongly dilated PVCs (arrowhead) with intraluminal inclusions
which are not so abundant in the WT (A). Bars = 10 µm.
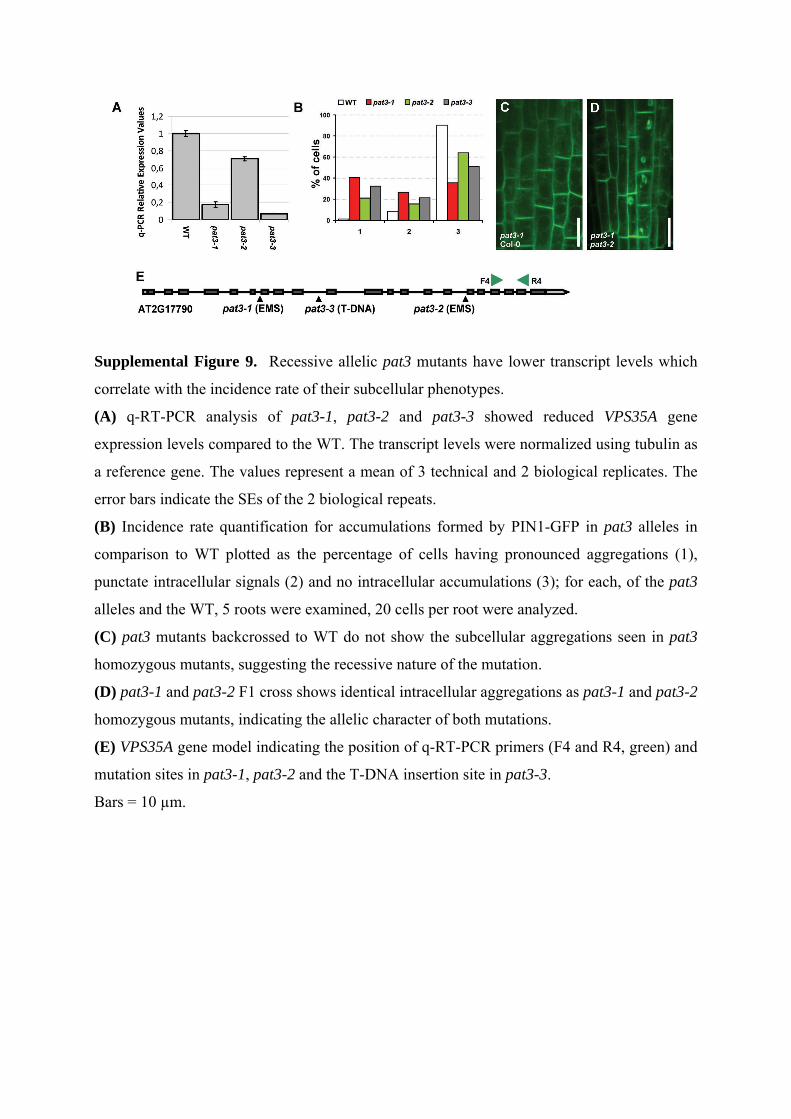
Supplemental Figure 9. Recessive allelic pat3 mutants have lower transcript levels which
correlate with the incidence rate of their subcellular phenotypes.
(A) q-RT-PCR analysis of pat3-1, pat3-2 and pat3-3 showed reduced VPS35A gene
expression levels compared to the WT. The transcript levels were normalized using tubulin as
a reference gene. The values represent a mean of 3 technical and 2 biological replicates. The
error bars indicate the SEs of the 2 biological repeats.
(B) Incidence rate quantification for accumulations formed by PIN1-GFP in pat3 alleles in
comparison to WT plotted as the percentage of cells having pronounced aggregations (1),
punctate intracellular signals (2) and no intracellular accumulations (3); for each, of the pat3
alleles and the WT, 5 roots were examined, 20 cells per root were analyzed.
(C) pat3 mutants backcrossed to WT do not show the subcellular aggregations seen in pat3
homozygous mutants, suggesting the recessive nature of the mutation.
(D) pat3-1 and pat3-2 F1 cross shows identical intracellular aggregations as pat3-1 and pat3-2
homozygous mutants, indicating the allelic character of both mutations.
(E) VPS35A gene model indicating the position of q-RT-PCR primers (F4 and R4, green) and
mutation sites in pat3-1, pat3-2 and the T-DNA insertion site in pat3-3.
Bars = 10 µm.
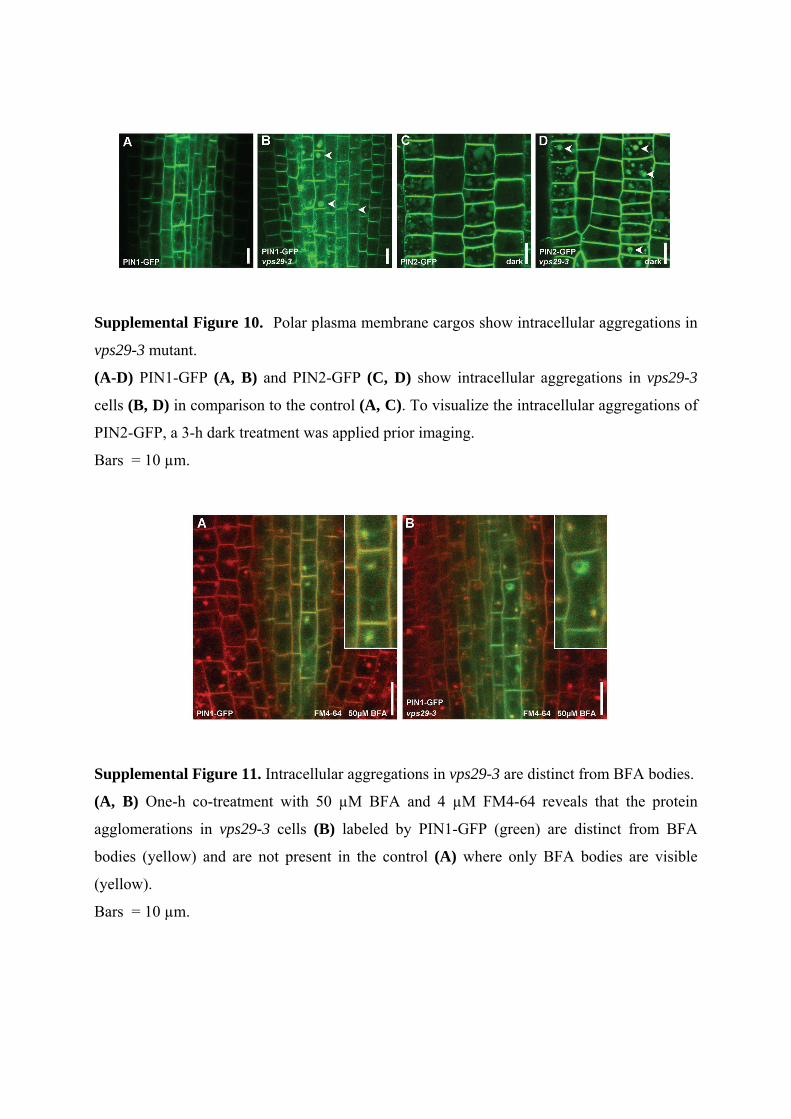
Supplemental Figure 10. Polar plasma membrane cargos show intracellular aggregations in
vps29-3 mutant.
(A-D) PIN1-GFP (A, B) and PIN2-GFP (C, D) show intracellular aggregations in vps29-3
cells (B, D) in comparison to the control (A, C). To visualize the intracellular aggregations of
PIN2-GFP, a 3-h dark treatment was applied prior imaging.
Bars = 10 µm.
Supplemental Figure 11. Intracellular aggregations in vps29-3 are distinct from BFA bodies.
(A, B) One-h co-treatment with 50 µM BFA and 4 µM FM4-64 reveals that the protein
agglomerations in vps29-3 cells (B) labeled by PIN1-GFP (green) are distinct from BFA
bodies (yellow) and are not present in the control (A) where only BFA bodies are visible
(yellow).
Bars = 10 µm.
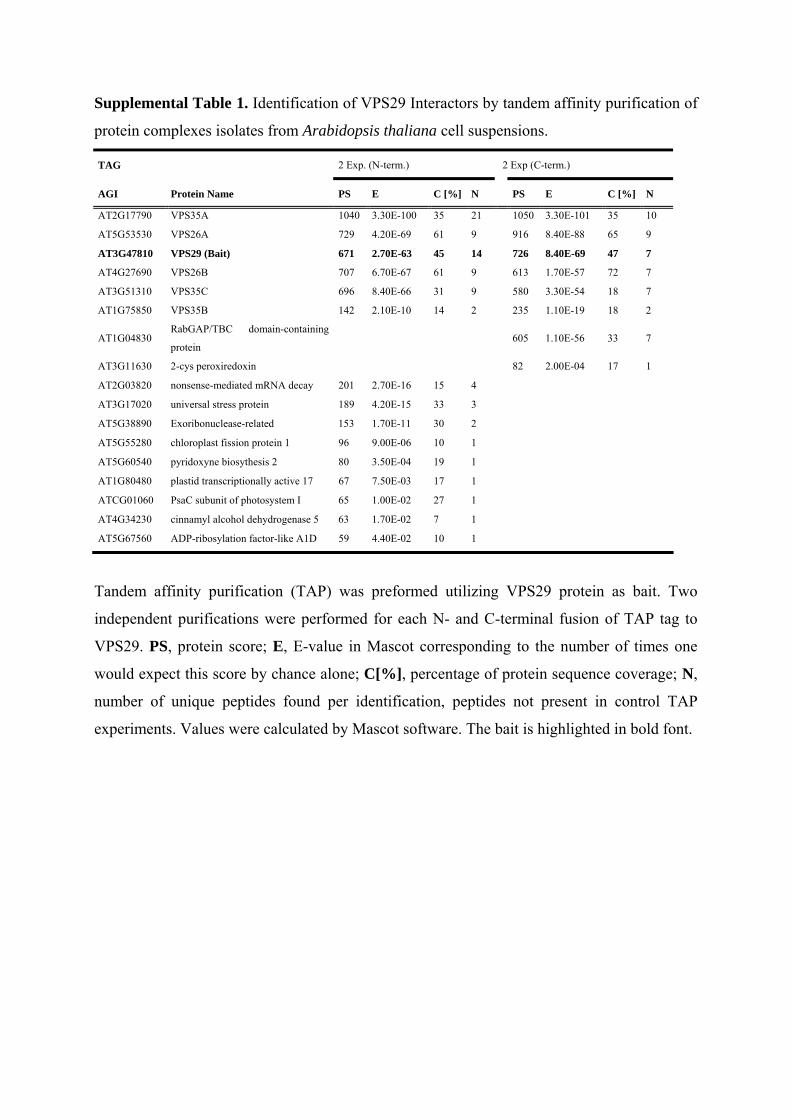
Supplemental Table 1. Identification of VPS29 Interactors by tandem affinity purification of
protein complexes isolates from Arabidopsis thaliana cell suspensions.
TAG 2 Exp. (N-term.) 2 Exp (C-term.)
AGI Protein Name PS E C [%] N PS E C [%] N
AT2G17790 VPS35A 1040 3.30E-100 35 21 1050 3.30E-101 35 10
AT5G53530 VPS26A 729 4.20E-69 61 9 916 8.40E-88 65 9
AT3G47810 VPS29 (Bait) 671 2.70E-63 45 14 726 8.40E-69 47 7
AT4G27690 VPS26B 707 6.70E-67 61 9 613 1.70E-57 72 7
AT3G51310 VPS35C 696 8.40E-66 31 9 580 3.30E-54 18 7
AT1G75850 VPS35B 142 2.10E-10 14 2 235 1.10E-19 18 2
AT1G04830 RabGAP/TBC domain-containing
protein 605 1.10E-56 33 7
AT3G11630 2-cys peroxiredoxin 82 2.00E-04 17 1
AT2G03820 nonsense-mediated mRNA decay 201 2.70E-16 15 4
AT3G17020 universal stress protein 189 4.20E-15 33 3
AT5G38890 Exoribonuclease-related 153 1.70E-11 30 2
AT5G55280 chloroplast fission protein 1 96 9.00E-06 10 1
AT5G60540 pyridoxyne biosythesis 2 80 3.50E-04 19 1
AT1G80480 plastid transcriptionally active 17 67 7.50E-03 17 1
ATCG01060 PsaC subunit of photosystem I 65 1.00E-02 27 1
AT4G34230 cinnamyl alcohol dehydrogenase 5 63 1.70E-02 7 1
AT5G67560 ADP-ribosylation factor-like A1D 59 4.40E-02 10 1
Tandem affinity purification (TAP) was preformed utilizing VPS29 protein as bait. Two
independent purifications were performed for each N- and C-terminal fusion of TAP tag to
VPS29. PS, protein score; E, E-value in Mascot corresponding to the number of times one
would expect this score by chance alone; C[%], percentage of protein sequence coverage; N,
number of unique peptides found per identification, peptides not present in control TAP
experiments. Values were calculated by Mascot software. The bait is highlighted in bold font.

Supplemental Table 2. Extended table containing detailed information on the VPS29
interactors identified by tandem affinity purification of protein complexes form Arabidopsis
thaliana cell suspensions (available on line).

Supplemental Table 3. List of Arabidopsis maker lines, T-DNA insertion lines and crosses.
No. Line Accession number Resistance
1 pat3-1 (EMS mutant) At2g17790
2 pat3-2 (EMS mutant) At2g17790
3 pat3-3
At2g17790/SALK_
125271/N625271
Kan.
resistance
silenced
4 vps29-3
At3g47810/N5101
06
5 AUX1pro:AUX1-YFP At2g38120 Kan.
6 35Spro:PIP2a-GFP AT3g53420 Kan.
7 PIN1pro:PIN1-GFP At1g73590 Kan.
8 PIN2pro:PIN2-GFP At5g57090
9 SYP22pro:SYP22-YFP U88045 Kan.
10 SYP61pro:SYP61-CFP At1g28490 Kan.
11 35Spro:EGFP-δTIP U39485
12 VHAa1pro:VHAa1-GFP At2g28520 Kan.
13 pat3-3xAUX1pro:AUX1-YFP
14 pat3-3X35Spro:PIP2a-GFP
15 pat3-3xPIN1pro:PIN1-GFP
16 pat3-3xPIN2pro:PIN2-GFP
17 pat3-3xSYP22pro:SYP22-YFP
18 pat3-3xSYP61pro:SYP61-GFP
19 pat3-3xVHAa1pro:VHA1a-GFP
20 pat3-3xδ-TIPpro:δ-TIP-GFP
21 pat2-2x SYP22pro:SYP22-YFP
22 pat2-2xδ-TIPpro:δ-TIP-GFP
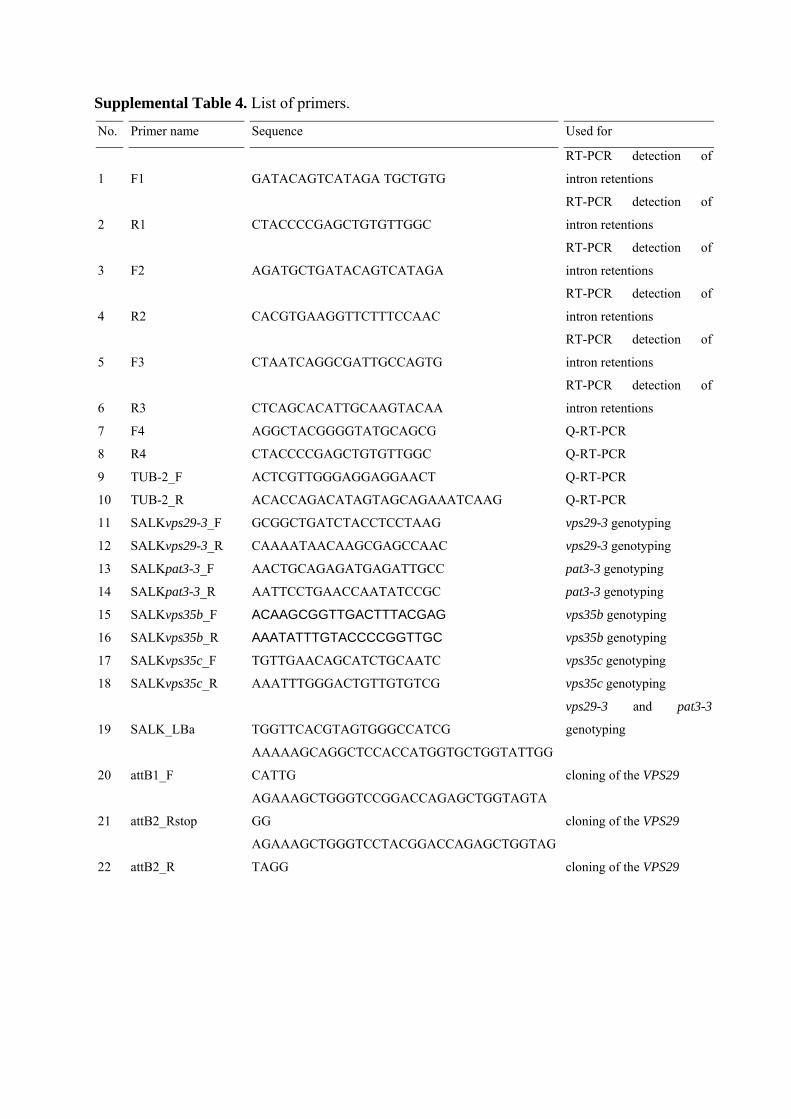
Supplemental Table 4. List of primers.
No. Primer name Sequence Used for
1 F1 GATACAGTCATAGA TGCTGTG
RT-PCR detection of
intron retentions
2 R1 CTACCCCGAGCTGTGTTGGC
RT-PCR detection of
intron retentions
3 F2 AGATGCTGATACAGTCATAGA
RT-PCR detection of
intron retentions
4 R2 CACGTGAAGGTTCTTTCCAAC
RT-PCR detection of
intron retentions
5 F3 CTAATCAGGCGATTGCCAGTG
RT-PCR detection of
intron retentions
6 R3 CTCAGCACATTGCAAGTACAA
RT-PCR detection of
intron retentions
7 F4 AGGCTACGGGGTATGCAGCG Q-RT-PCR
8 R4 CTACCCCGAGCTGTGTTGGC Q-RT-PCR
9 TUB-2_F ACTCGTTGGGAGGAGGAACT Q-RT-PCR
10 TUB-2_R ACACCAGACATAGTAGCAGAAATCAAG Q-RT-PCR
11 SALKvps29-3_F GCGGCTGATCTACCTCCTAAG vps29-3 genotyping
12 SALKvps29-3_R CAAAATAACAAGCGAGCCAAC vps29-3 genotyping
13 SALKpat3-3_F AACTGCAGAGATGAGATTGCC pat3-3 genotyping
14 SALKpat3-3_R AATTCCTGAACCAATATCCGC pat3-3 genotyping
15 SALKvps35b_F ACAAGCGGTTGACTTTACGAG vps35b genotyping
16 SALKvps35b_R AAATATTTGTACCCCGGTTGC vps35b genotyping
17 SALKvps35c_F TGTTGAACAGCATCTGCAATC vps35c genotyping
18 SALKvps35c_R AAATTTGGGACTGTTGTGTCG vps35c genotyping
19 SALK_LBa TGGTTCACGTAGTGGGCCATCG
vps29-3 and pat3-3
genotyping
20 attB1_F
AAAAAGCAGGCTCCACCATGGTGCTGGTATTGG
CATTG cloning of the VPS29
21 attB2_Rstop
AGAAAGCTGGGTCCGGACCAGAGCTGGTAGTA
GG cloning of the VPS29
22 attB2_R
AGAAAGCTGGGTCCTACGGACCAGAGCTGGTAG
TAGG cloning of the VPS29
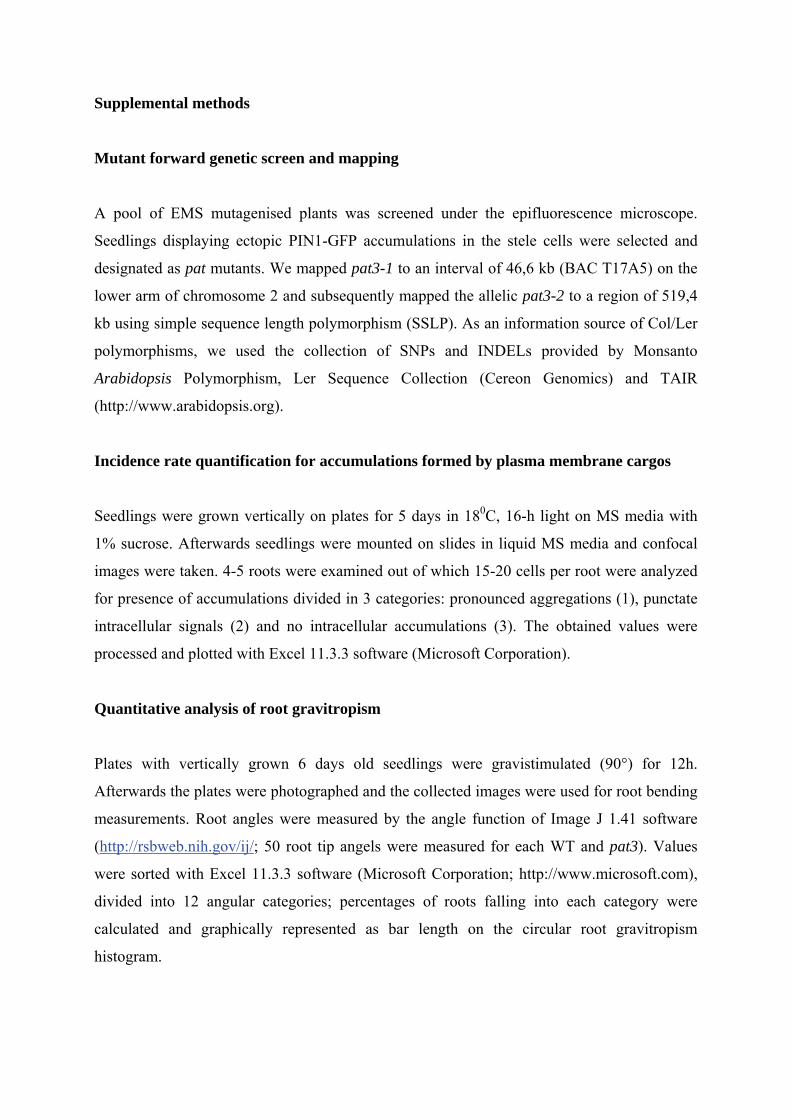
Supplemental methods
Mutant forward genetic screen and mapping
A pool of EMS mutagenised plants was screened under the epifluorescence microscope.
Seedlings displaying ectopic PIN1-GFP accumulations in the stele cells were selected and
designated as pat mutants. We mapped pat3-1 to an interval of 46,6 kb (BAC T17A5) on the
lower arm of chromosome 2 and subsequently mapped the allelic pat3-2 to a region of 519,4
kb using simple sequence length polymorphism (SSLP). As an information source of Col/Ler
polymorphisms, we used the collection of SNPs and INDELs provided by Monsanto
Arabidopsis Polymorphism, Ler Sequence Collection (Cereon Genomics) and TAIR
(http://www.arabidopsis.org).
Incidence rate quantification for accumulations formed by plasma membrane cargos
Seedlings were grown vertically on plates for 5 days in 180C, 16-h light on MS media with
1% sucrose. Afterwards seedlings were mounted on slides in liquid MS media and confocal
images were taken. 4-5 roots were examined out of which 15-20 cells per root were analyzed
for presence of accumulations divided in 3 categories: pronounced aggregations (1), punctate
intracellular signals (2) and no intracellular accumulations (3). The obtained values were
processed and plotted with Excel 11.3.3 software (Microsoft Corporation).
Quantitative analysis of root gravitropism
Plates with vertically grown 6 days old seedlings were gravistimulated (90°) for 12h.
Afterwards the plates were photographed and the collected images were used for root bending
measurements. Root angles were measured by the angle function of Image J 1.41 software
(http://rsbweb.nih.gov/ij/; 50 root tip angels were measured for each WT and pat3). Values
were sorted with Excel 11.3.3 software (Microsoft Corporation; http://www.microsoft.com),
divided into 12 angular categories; percentages of roots falling into each category were
calculated and graphically represented as bar length on the circular root gravitropism
histogram.

Quantitative analysis of root length
Seedlings were grown vertically in plates for 6 days on MS media with or without sucrose as
indicated. Afterwards plates were photographed and root length was measured by Image J
1.41 software (http://rsbweb.nih.gov/ij/). The obtained values were processed and plotted with
Excel 11.3.3 software (Microsoft Corporation).
Quantitative analysis of hypocotyl gravitropic response
Plates with 2 days vernalized seeds were first illuminated for 8h, then transferred to dark. The
seedlings were grown 72h vertically and subsequently gravistimulated (90°) for 48h. The
plates were photographed and the collected images were used for angle measurements. The
hypocotyl gravitropic response of 38 seedlings from each line was measured by the angle
function of Image J 1.41 software (http://rsbweb.nih.gov/ij/). The obtained values were
processed with Excel 11.3.3 software (Microsoft Corporation) and converted to degrees of
bending.
RT-PCR
Total RNA was extracted from 2 weeks old seedlings with the RNeasy Kit (Qiagen;
http://www.qiagen.com) according to the manufacturer’s instructions. The cDNA was
synthesized with the Superscript III reverse transcriptase kit (Invitrogen;
http://www.invitrogen.com/site/us/en/home) according to the manufacturer’s instructions. In
order to detect intron retentions a transcript of 2217 bp downstream of ATG and small
transcripts flanking the corresponding splice sites of the 6th and 15th intron were amplified.
Primer sequences are listed in Table S3.
q-RT-PCR
Preparation of the material of q-RT-PCR was done in the same way as for the RT-PCR.
Transcript quantification was performed using LightCycler 480 apparatus (Roche
Diagnostics) with the SYBR Green I Master kit (Roche Diagnostics), according to the
manufacturer’s instructions. For every sample three technical and two biological repeats were
done. Transcript levels were normalized using beta-tubulin as a reference. Data were analyzed
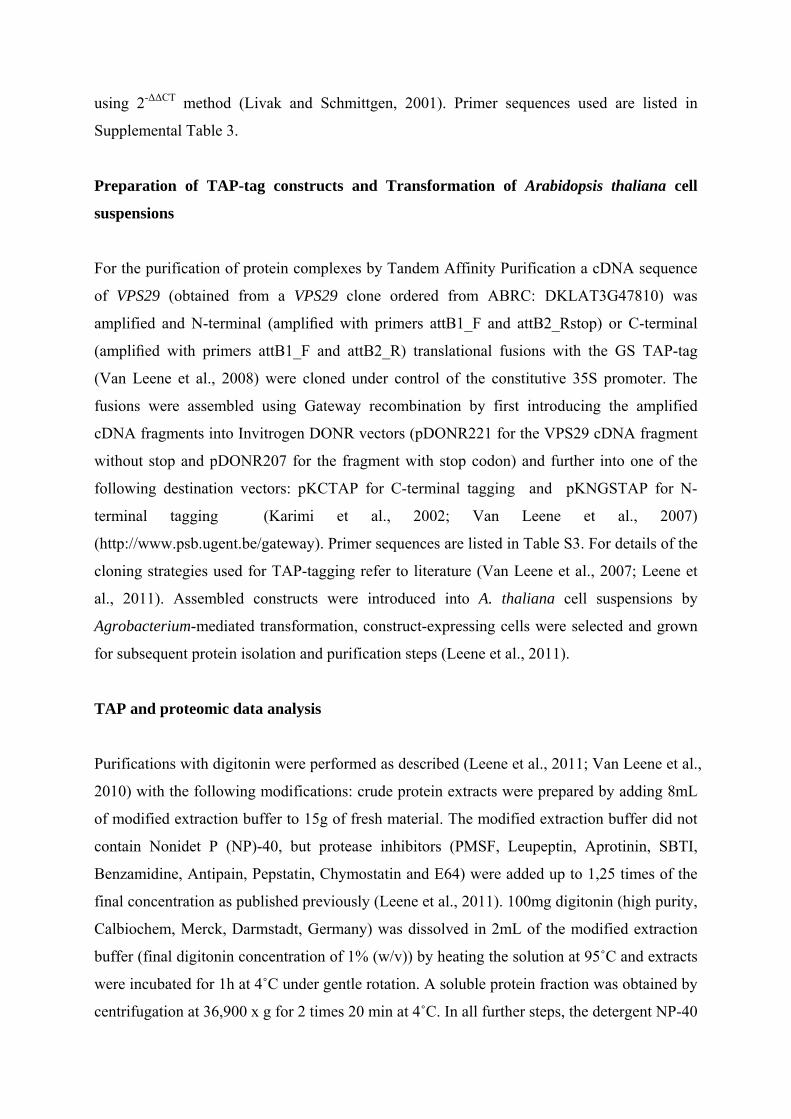
using 2-ΔΔCT method (Livak and Schmittgen, 2001). Primer sequences used are listed in
Supplemental Table 3.
Preparation of TAP-tag constructs and Transformation of Arabidopsis thaliana cell
suspensions
For the purification of protein complexes by Tandem Affinity Purification a cDNA sequence
of VPS29 (obtained from a VPS29 clone ordered from ABRC: DKLAT3G47810) was
amplified and N-terminal (amplified with primers attB1_F and attB2_Rstop) or C-terminal
(amplified with primers attB1_F and attB2_R) translational fusions with the GS TAP-tag
(Van Leene et al., 2008) were cloned under control of the constitutive 35S promoter. The
fusions were assembled using Gateway recombination by first introducing the amplified
cDNA fragments into Invitrogen DONR vectors (pDONR221 for the VPS29 cDNA fragment
without stop and pDONR207 for the fragment with stop codon) and further into one of the
following destination vectors: pKCTAP for C-terminal tagging and pKNGSTAP for N-
terminal tagging (Karimi et al., 2002; Van Leene et al., 2007)
(http://www.psb.ugent.be/gateway). Primer sequences are listed in Table S3. For details of the
cloning strategies used for TAP-tagging refer to literature (Van Leene et al., 2007; Leene et
al., 2011). Assembled constructs were introduced into A. thaliana cell suspensions by
Agrobacterium-mediated transformation, construct-expressing cells were selected and grown
for subsequent protein isolation and purification steps (Leene et al., 2011).
TAP and proteomic data analysis
Purifications with digitonin were performed as described (Leene et al., 2011; Van Leene et al.,
2010) with the following modifications: crude protein extracts were prepared by adding 8mL
of modified extraction buffer to 15g of fresh material. The modified extraction buffer did not
contain Nonidet P (NP)-40, but protease inhibitors (PMSF, Leupeptin, Aprotinin, SBTI,
Benzamidine, Antipain, Pepstatin, Chymostatin and E64) were added up to 1,25 times of the
final concentration as published previously (Leene et al., 2011). 100mg digitonin (high purity,
Calbiochem, Merck, Darmstadt, Germany) was dissolved in 2mL of the modified extraction
buffer (final digitonin concentration of 1% (w/v)) by heating the solution at 95˚C and extracts
were incubated for 1h at 4˚C under gentle rotation. A soluble protein fraction was obtained by
centrifugation at 36,900 x g for 2 times 20 min at 4˚C. In all further steps, the detergent NP-40

was replaced by 0.2% (w/v) digitonin. For detailed information about Tandem Affinity
Purification procedure and mass spectrometry data analysis of purified complexes view
published material (Van Leene et al., 2007; Van Leene et al., 2010).
The images were collected using Leica SP2 or Carl Zeiss 710 and 780 confocal microscopes.
Figures were processed and assembled in Photoshop CS4 (Adobe System).