Embed Size (px)
Citation preview
Anclote River System Recommended
Minimum Flows and Levels February 2010 Final
Prepared by: Southwest Florida Water Management District Pursuant to 373.042 F.S.
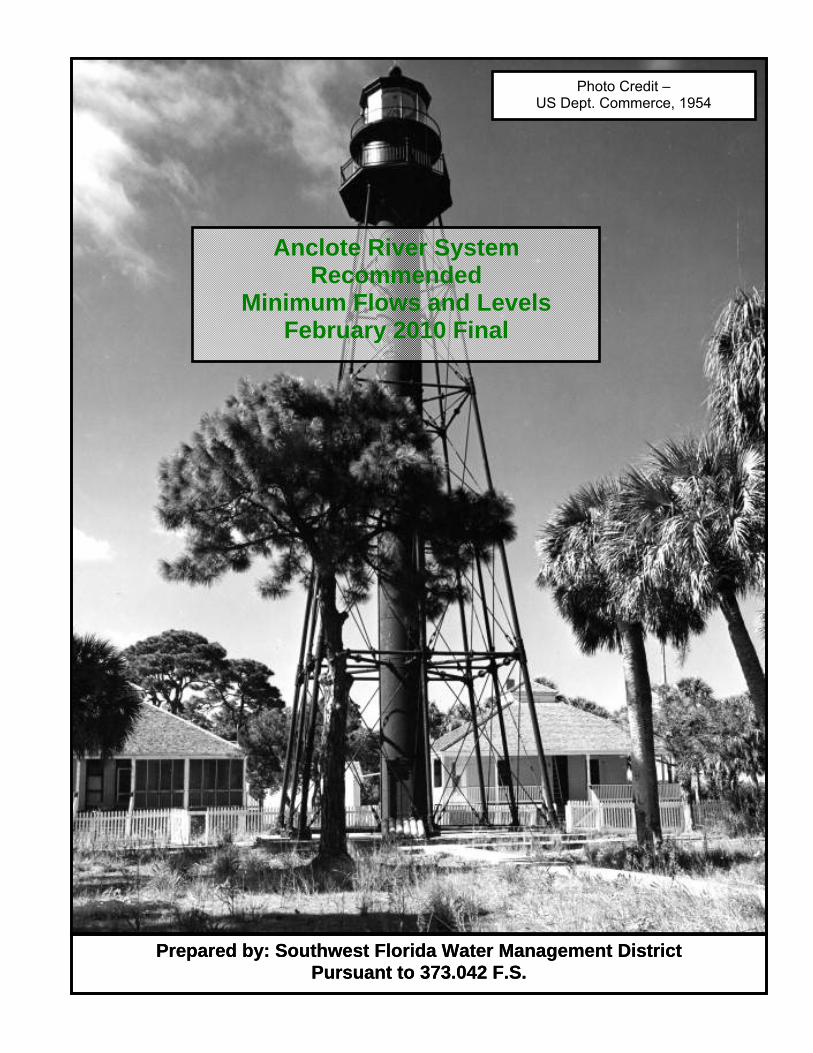
Photo Credit – US Dept. Commerce, 1954
Anclote River System Recommended
Minimum Flows and Levels February 2010 Final
Prepared by: Southwest Florida Water Management District Pursuant to 373.042 F.S.
Photo Credit – US Dept. Commerce, 1954

Back of Front Cover
D:\Anclote\Report\Final\Anclote_MFL_Final.doc Last Save : 2/22/2010 11:02 AM
________________________________________________________________________________________________________ Proposed Minimum Flows and Levels for Anclote River System i
Anclote River System Recommended Minimum Flows and Levels February 2010 Ecologic Evaluation Section Resource Projects Department Southwest Florida Water Management District Brooksville, Florida 34604-6899 Michael G. Heyl, M.S. Chief Environmental Scientist Adam B. Munson, Ph.D. Senior Environmental Scientist Jason Hood, M.S. Environmental Scientist Jonathan Morales, Ph.D. Staff Environmental Scientist Marty Kelly, Ph.D. Director, Minimum Flows and Levels Program The Southwest Florida Water Management District (District) does not discriminate on the basis of disability. This nondiscrimination policy involves every aspect of the District's functions, including access to and participation in the District's programs and activities. Anyone requiring reasonable accommodation as provided for in the Americans with Disabilities Act should contact the District's Human Resources Director, 2379 Broad Street, Brooksville, Florida 34604-6899; telephone (352) 796-7211, ext. 4702 or 1-800-423-1476 (FL only), ext. 4702; TDD (FL only) 1-800-231-6103; or email to [email protected].
D:\Anclote\Report\Final\Anclote_MFL_Final.doc Last Save : 2/22/2010 11:02 AM
________________________________________________________________________________________________________ Proposed Minimum Flows and Levels for Anclote River System ii
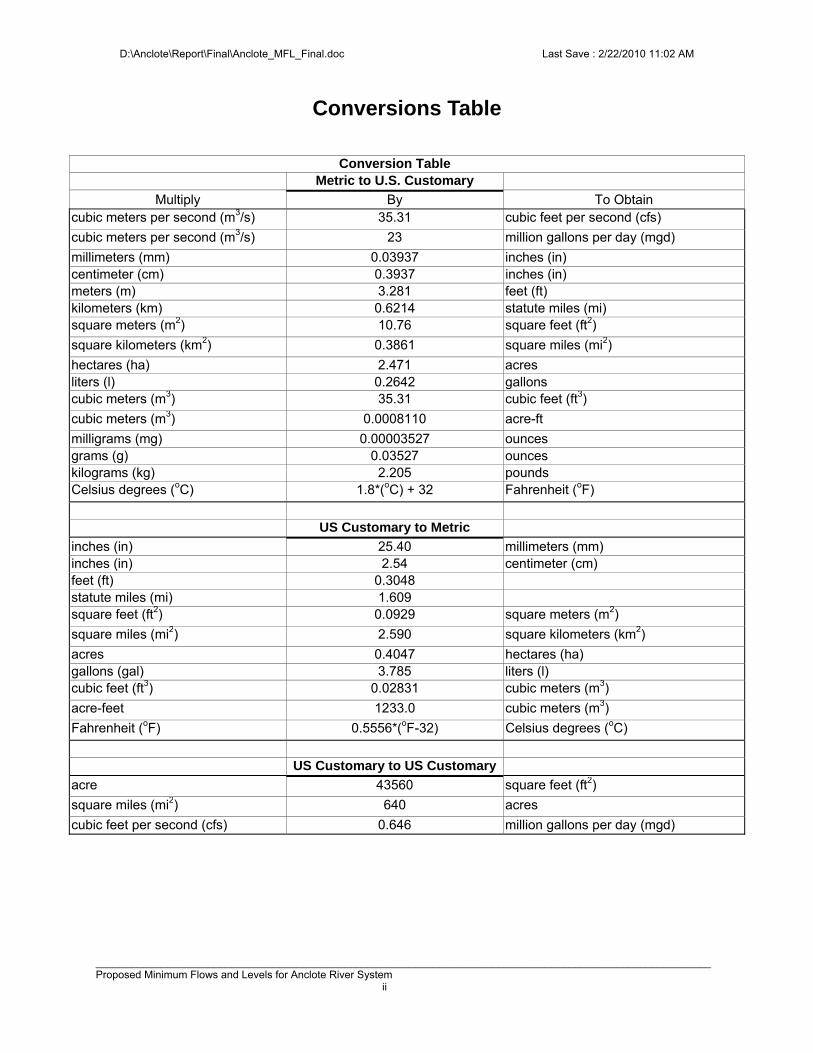
Conversions Table
Conversion Table Metric to U.S. Customary
Multiply By To Obtain cubic meters per second (m3/s) 35.31 cubic feet per second (cfs)
cubic meters per second (m3/s) 23 million gallons per day (mgd)
millimeters (mm) 0.03937 inches (in) centimeter (cm) 0.3937 inches (in) meters (m) 3.281 feet (ft) kilometers (km) 0.6214 statute miles (mi) square meters (m2) 10.76 square feet (ft2)
square kilometers (km2) 0.3861 square miles (mi2)
hectares (ha) 2.471 acres liters (l) 0.2642 gallons cubic meters (m3) 35.31 cubic feet (ft3)
cubic meters (m3) 0.0008110 acre-ft
milligrams (mg) 0.00003527 ounces grams (g) 0.03527 ounces kilograms (kg) 2.205 pounds Celsius degrees (oC) 1.8*(oC) + 32 Fahrenheit (oF)
US Customary to Metric
inches (in) 25.40 millimeters (mm) inches (in) 2.54 centimeter (cm) feet (ft) 0.3048 statute miles (mi) 1.609 square feet (ft2) 0.0929 square meters (m2)
square miles (mi2) 2.590 square kilometers (km2)
acres 0.4047 hectares (ha) gallons (gal) 3.785 liters (l) cubic feet (ft3) 0.02831 cubic meters (m3)
acre-feet 1233.0 cubic meters (m3)
Fahrenheit (oF) 0.5556*(oF-32) Celsius degrees (oC)
US Customary to US Customary
acre 43560 square feet (ft2)
square miles (mi2) 640 acres
cubic feet per second (cfs) 0.646 million gallons per day (mgd)
D:\Anclote\Report\Final\Anclote_MFL_Final.doc Last Save : 2/22/2010 11:02 AM
________________________________________________________________________________________________________ Proposed Minimum Flows and Levels for Anclote River System iii
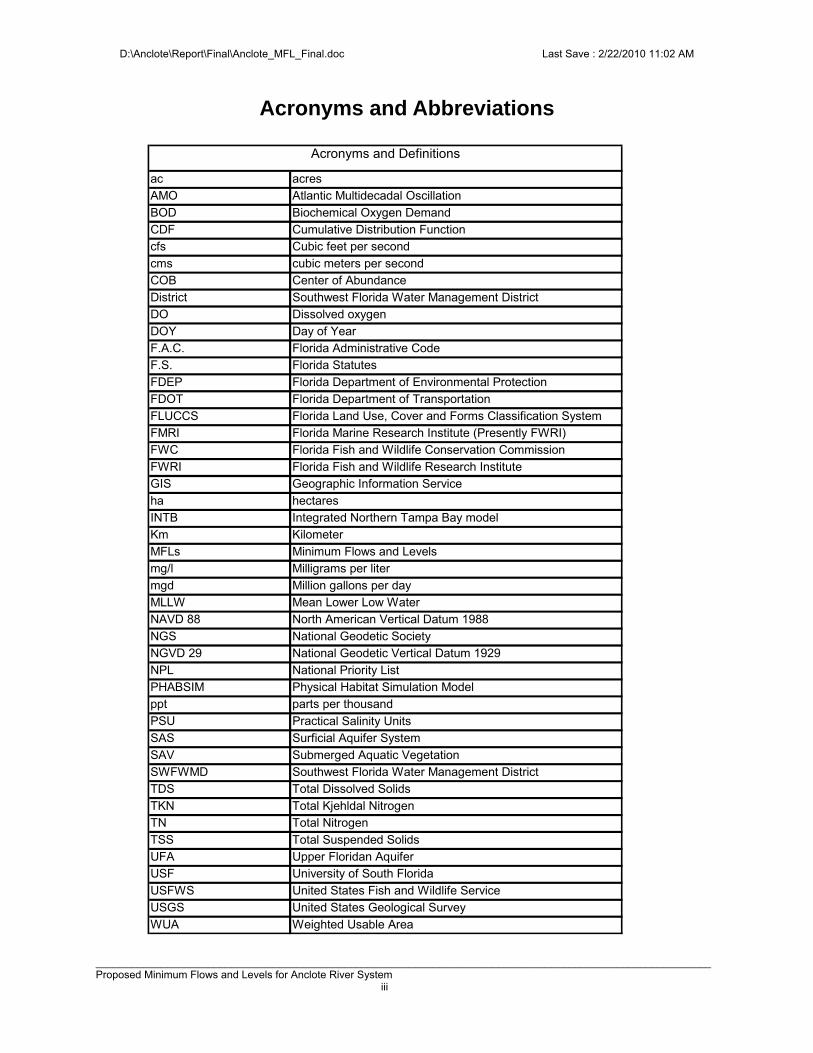
Acronyms and Abbreviations
ac acres
AMO Atlantic Multidecadal Oscillation
BOD Biochemical Oxygen Demand
CDF Cumulative Distribution Function
cfs Cubic feet per second
cms cubic meters per second
COB Center of Abundance
District Southwest Florida Water Management District
DO Dissolved oxygen
DOY Day of Year
F.A.C. Florida Administrative Code
F.S. Florida Statutes
FDEP Florida Department of Environmental Protection
FDOT Florida Department of Transportation
FLUCCS Florida Land Use, Cover and Forms Classification System
FMRI Florida Marine Research Institute (Presently FWRI)
FWC Florida Fish and Wildlife Conservation Commission
FWRI Florida Fish and Wildlife Research Institute
GIS Geographic Information Service
ha hectares
INTB Integrated Northern Tampa Bay model
Km Kilometer
MFLs Minimum Flows and Levels
mg/l Milligrams per liter
mgd Million gallons per day
MLLW Mean Lower Low Water
NAVD 88 North American Vertical Datum 1988
NGS National Geodetic Society
NGVD 29 National Geodetic Vertical Datum 1929
NPL National Priority List
PHABSIM Physical Habitat Simulation Model
ppt parts per thousand
PSU Practical Salinity Units
SAS Surficial Aquifer System
SAV Submerged Aquatic Vegetation
SWFWMD Southwest Florida Water Management District
TDS Total Dissolved Solids
TKN Total Kjehldal Nitrogen
TN Total Nitrogen
TSS Total Suspended Solids
UFA Upper Floridan Aquifer
USF University of South Florida
USFWS United States Fish and Wildlife Service
USGS United States Geological Survey
WUA Weighted Usable Area
Acronyms and Definitions
D:\Anclote\Report\Final\Anclote_MFL_Final.doc Last Save : 2/22/2010 11:02 AM
________________________________________________________________________________________________________ Proposed Minimum Flows and Levels for Anclote River System iv
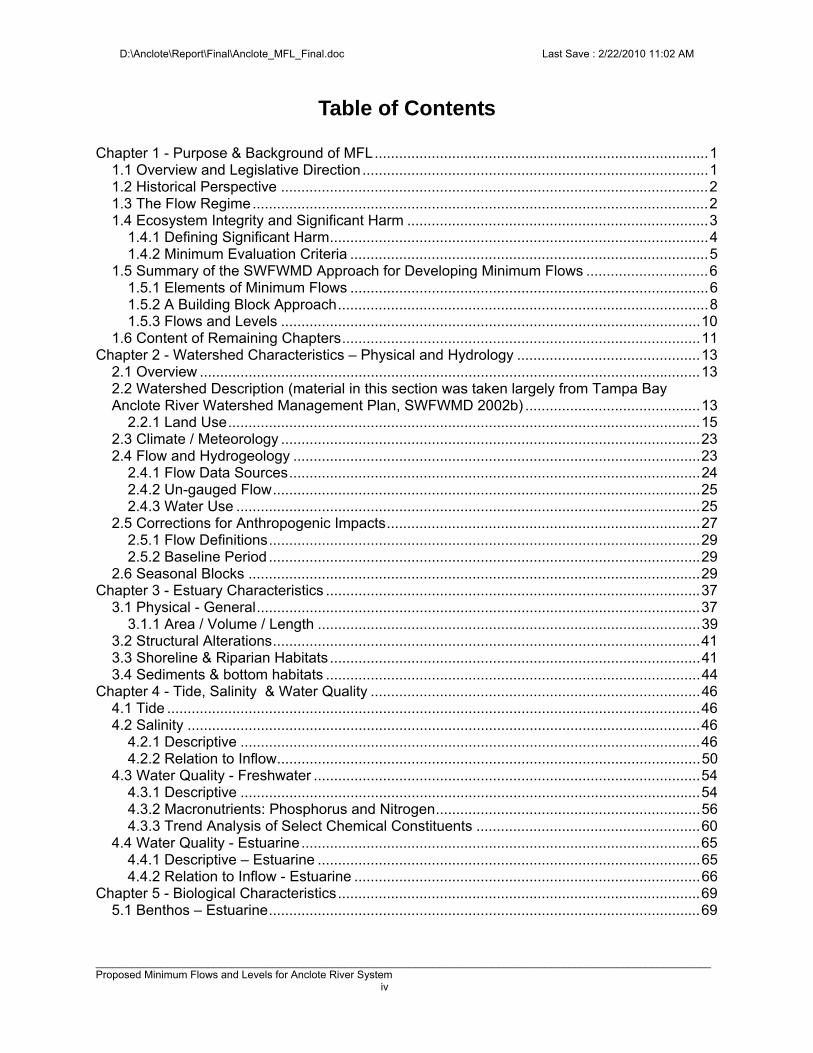
Table of Contents
Chapter 1 - Purpose & Background of MFL .................................................................................. 1 1.1 Overview and Legislative Direction ..................................................................................... 1 1.2 Historical Perspective ......................................................................................................... 2 1.3 The Flow Regime ................................................................................................................ 2 1.4 Ecosystem Integrity and Significant Harm .......................................................................... 3
1.4.1 Defining Significant Harm ............................................................................................. 4 1.4.2 Minimum Evaluation Criteria ........................................................................................ 5
1.5 Summary of the SWFWMD Approach for Developing Minimum Flows .............................. 6 1.5.1 Elements of Minimum Flows ........................................................................................ 6 1.5.2 A Building Block Approach ........................................................................................... 8 1.5.3 Flows and Levels ....................................................................................................... 10
1.6 Content of Remaining Chapters ........................................................................................ 11 Chapter 2 - Watershed Characteristics – Physical and Hydrology ............................................. 13
2.1 Overview ........................................................................................................................... 13 2.2 Watershed Description (material in this section was taken largely from Tampa Bay Anclote River Watershed Management Plan, SWFWMD 2002b) ........................................... 13
2.2.1 Land Use .................................................................................................................... 15 2.3 Climate / Meteorology ....................................................................................................... 23 2.4 Flow and Hydrogeology .................................................................................................... 23
2.4.1 Flow Data Sources ..................................................................................................... 24 2.4.2 Un-gauged Flow ......................................................................................................... 25 2.4.3 Water Use .................................................................................................................. 25
2.5 Corrections for Anthropogenic Impacts ............................................................................. 27 2.5.1 Flow Definitions .......................................................................................................... 29 2.5.2 Baseline Period .......................................................................................................... 29
2.6 Seasonal Blocks ............................................................................................................... 29 Chapter 3 - Estuary Characteristics ............................................................................................ 37
3.1 Physical - General ............................................................................................................. 37 3.1.1 Area / Volume / Length .............................................................................................. 39
3.2 Structural Alterations ......................................................................................................... 41 3.3 Shoreline & Riparian Habitats ........................................................................................... 41 3.4 Sediments & bottom habitats ............................................................................................ 44
Chapter 4 - Tide, Salinity & Water Quality ................................................................................. 46 4.1 Tide ................................................................................................................................... 46 4.2 Salinity .............................................................................................................................. 46
4.2.1 Descriptive ................................................................................................................. 46 4.2.2 Relation to Inflow ........................................................................................................ 50
4.3 Water Quality - Freshwater ............................................................................................... 54 4.3.1 Descriptive ................................................................................................................. 54 4.3.2 Macronutrients: Phosphorus and Nitrogen ................................................................. 56 4.3.3 Trend Analysis of Select Chemical Constituents ....................................................... 60
4.4 Water Quality - Estuarine .................................................................................................. 65 4.4.1 Descriptive – Estuarine .............................................................................................. 65 4.4.2 Relation to Inflow - Estuarine ..................................................................................... 66
Chapter 5 - Biological Characteristics ......................................................................................... 69 5.1 Benthos – Estuarine .......................................................................................................... 69
D:\Anclote\Report\Final\Anclote_MFL_Final.doc Last Save : 2/22/2010 11:02 AM
________________________________________________________________________________________________________ Proposed Minimum Flows and Levels for Anclote River System v
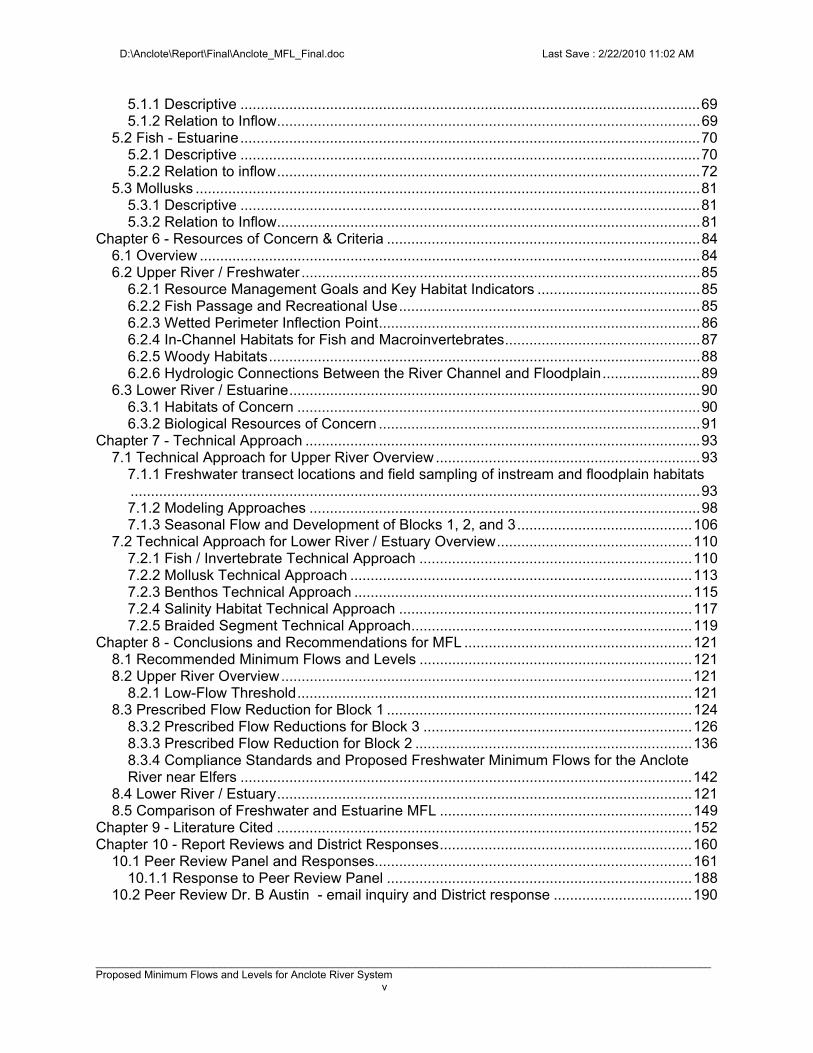
5.1.1 Descriptive ................................................................................................................. 69 5.1.2 Relation to Inflow ........................................................................................................ 69
5.2 Fish - Estuarine ................................................................................................................. 70 5.2.1 Descriptive ................................................................................................................. 70 5.2.2 Relation to inflow ........................................................................................................ 72
5.3 Mollusks ............................................................................................................................ 81 5.3.1 Descriptive ................................................................................................................. 81 5.3.2 Relation to Inflow ........................................................................................................ 81
Chapter 6 - Resources of Concern & Criteria ............................................................................. 84 6.1 Overview ........................................................................................................................... 84 6.2 Upper River / Freshwater .................................................................................................. 85
6.2.1 Resource Management Goals and Key Habitat Indicators ........................................ 85 6.2.2 Fish Passage and Recreational Use .......................................................................... 85 6.2.3 Wetted Perimeter Inflection Point ............................................................................... 86 6.2.4 In-Channel Habitats for Fish and Macroinvertebrates ................................................ 87 6.2.5 Woody Habitats .......................................................................................................... 88 6.2.6 Hydrologic Connections Between the River Channel and Floodplain ........................ 89
6.3 Lower River / Estuarine ..................................................................................................... 90 6.3.1 Habitats of Concern ................................................................................................... 90 6.3.2 Biological Resources of Concern ............................................................................... 91
Chapter 7 - Technical Approach ................................................................................................. 93 7.1 Technical Approach for Upper River Overview ................................................................. 93
7.1.1 Freshwater transect locations and field sampling of instream and floodplain habitats ............................................................................................................................................ 93 7.1.2 Modeling Approaches ................................................................................................ 98 7.1.3 Seasonal Flow and Development of Blocks 1, 2, and 3 ........................................... 106
7.2 Technical Approach for Lower River / Estuary Overview ................................................ 110 7.2.1 Fish / Invertebrate Technical Approach ................................................................... 110 7.2.2 Mollusk Technical Approach .................................................................................... 113 7.2.3 Benthos Technical Approach ................................................................................... 115 7.2.4 Salinity Habitat Technical Approach ........................................................................ 117 7.2.5 Braided Segment Technical Approach ..................................................................... 119
Chapter 8 - Conclusions and Recommendations for MFL ........................................................ 121 8.1 Recommended Minimum Flows and Levels ................................................................... 121 8.2 Upper River Overview ..................................................................................................... 121
8.2.1 Low-Flow Threshold ................................................................................................. 121 8.3 Prescribed Flow Reduction for Block 1 ........................................................................... 124
8.3.2 Prescribed Flow Reductions for Block 3 .................................................................. 126 8.3.3 Prescribed Flow Reduction for Block 2 .................................................................... 136 8.3.4 Compliance Standards and Proposed Freshwater Minimum Flows for the Anclote River near Elfers ............................................................................................................... 142
8.4 Lower River / Estuary ...................................................................................................... 121 8.5 Comparison of Freshwater and Estuarine MFL .............................................................. 149
Chapter 9 - Literature Cited ...................................................................................................... 152 Chapter 10 - Report Reviews and District Responses .............................................................. 160
10.1 Peer Review Panel and Responses.............................................................................. 161 10.1.1 Response to Peer Review Panel ........................................................................... 188
10.2 Peer Review Dr. B Austin - email inquiry and District response .................................. 190
D:\Anclote\Report\Final\Anclote_MFL_Final.doc Last Save : 2/22/2010 11:02 AM
________________________________________________________________________________________________________ Proposed Minimum Flows and Levels for Anclote River System vi
10.3 Review Comments from Florida Department of Environmental Protection and District Response. ............................................................................................................................. 194 10.4 Comments from Tampa Bay Water ............................................................................... 201
Chapter 11 - Appendices [Bound Separately] ........................................................................... 161 11.1 Anclote Land Use Maps ................................................................................................ 207 11.2 Basso, R. 2009. Technical Memorandum: Predicted groundwater withdrawal impacts to the Anclote River based on numerical model results. ........................................................... 207 11.3 Heyl, M. 2008. Technical Memorandum: Adjustments to Flow Record for Groundwater Impacts. ................................................................................................................................ 207 11.4 Water Quality Station Metadata .................................................................................... 207 11.5 Grabe, S and T. Janicki. 2007 Analysis of Benthic Community Structure and Its Relationship to Freshwater Inflows in the Anclote River. ...................................................... 207 11.6 Greenwood et al. 2006. Freshwater Inflow Effects on Fishes and Invertebrates in the Anclote River Estuary............................................................................................................ 207 11.7 Estevez, E. and B.D Robbins. Lettter Report on Anclote River Mollusk and Vegetation Survey. .................................................................................................................................. 207 11.8 Montagna, P. 2006 A Multivariate Statistical Analysis of Relationships between Freshwater Inflows and Mollusk Distributions in Tidal Rivers in Southwest Florida. ............. 207 11.9 Wetted Perimeter Graphs for the Anclote River Study Corridor .................................... 207 11.10 Elevation and Vegetation Profiles for the Anclote River Study Corridor ..................... 207 11.11 PHABSIM Evaluation – Dr. James Gore ..................................................................... 207 11.12 Protocol for Development of Long-term Flow Expectations ....................................... 207
D:\Anclote\Report\Final\Anclote_MFL_Final.doc Last Save : 2/22/2010 11:02 AM
________________________________________________________________________________________________________ Proposed Minimum Flows and Levels for Anclote River System vii
List of Figures Figure 1-1 Example of ecological 'break point' ............................................................................. 5 Figure 1-2. Median daily flows reported for the USGS gauge 023100 - Anclote River near Elfers.
Arranged by seasonal blocks. ............................................................................................. 10 Figure 2-1. Location of Anclote River .......................................................................................... 13 Figure 2-2. Map of Anclote River Watershed showing the Anclote River main-stem and
tributaries, sub-basins and long-term USGS gauge site locations ...................................... 14 Figure 2-3. Location of Anclote River sub-basins. ...................................................................... 16 Figure 2-4. 1990 and 1995 Land use / cover maps of the Anclote River watershed, Florida ..... 19 Figure 2-5. 2004 Land use / cover maps of the Anclote River watershed, Florida ..................... 20 Figure 2-6. Land use changes (1990 - 2004) for Anclote watershed, Anclote mainstem, South
Branch and Duck Slough. ................................................................................................... 21 Figure 2-7. Land use changes (1990 – 2004) for Hollin Creek, Cross Cypress Branch, Sandy
Branch and Lake Ann Outlet. .............................................................................................. 22 Figure 2-8. Average total monthly rainfall for Tarpon Springs. ................................................... 23 Figure 2-9. Proximity of public supply well fields to Anclote River. ............................................. 26 Figure 2-10. Groundwater withdrawals history from five well fields within, or near the Anclote
River basin. ......................................................................................................................... 26 Figure 2-11. Groundwater grid for INTB Model ........................................................................... 28 Figure 2-12. Historical annual average flow of Anclote River near Elfers (1955-2007) .............. 30 Figure 2-13. Historical and baseline annual average flow of Anclote River near Elfers (1955-
2007) ................................................................................................................................... 31 Figure 2-14. Historical and baseline median monthly average flow of Anclote River near Elfers
(1955-2007) ......................................................................................................................... 32 Figure 2-15. Flow duration curves for daily historical and baseline flow of the Anclote River near
Elfers (1955-2007) .............................................................................................................. 33 Figure 2-16. Median daily baseline flow of Anclote River near Elfers (1955-2007) .................... 35 Figure 2-17. Median daily historical flow of Anclote River near Elfers (1955 - 2007) ................. 36 Figure 3-1. Anclote Key, Anchorage and Lower River ............................................................... 37 Figure 3-2. 2004 SAV coverage, Anclote Anchorage. Black cross hatch = patchy, orange stipple
= dense. .............................................................................................................................. 39 Figure 3-3. Anclote River kilometer system. ............................................................................... 40 Figure 3-4. Anclote River cumulative volume and bottom area. ................................................ 40 Figure 3-5. Distribution of shoreline length by river kilometer ..................................................... 42 Figure 3-6 Location of shoreline types (FLUCCS Level 4.). ....................................................... 42 Figure 3-7. Distribution of major shoreline types (FLUCCS Level 1). ......................................... 43 Figure 3-8. Distribution of urban land use (FLUCCS Level 2). ................................................... 43 Figure 3-9. Distribution of wetland land use (FLUCCS Level 3) ................................................. 44 Figure 3-10. Percent Silt/Clay and percent organics by river kilometer ...................................... 44 Figure 3-11. Sediment characteristics of the Anclote River compared to other Florida tidal rivers.
............................................................................................................................................ 45 Figure 4-1. Near-surface Anclote River salinity measured during synoptic surveys between 1984
- 1986 and 2004 - 2006. ...................................................................................................... 47 Figure 4-2. Near-bottom Anclote River salinity measured during synoptic surveys between
1984-1986 and 2004 - 2006. ............................................................................................... 47 Figure 4-3. Salinity stratification (near-bottom minus near-surface) measured during synoptic
surveys between 1984- 1986 and 2004 - 2006. .................................................................. 48
D:\Anclote\Report\Final\Anclote_MFL_Final.doc Last Save : 2/22/2010 11:02 AM
________________________________________________________________________________________________________ Proposed Minimum Flows and Levels for Anclote River System viii
Figure 4-4. Influence of flow on salinity stratification during synoptic surveys between 1984 - 1986 and 2004 - 2006. (Truncated to < 300 cfs. Three values not plotted.) ....................... 49
Figure 4-5. Lower Anclote River salinity reported in STORET (1962 - 2006). ............................ 50 Figure 4-6. Potentiometric surface map for the Floridan aquifer around Seven Springs. ........... 56 Figure 4-7. Trend of phosphorus for Anclote River near Elfers, Fl. ............................................ 58 Figure 4-8. Trend analysis of nitrate / nitrite for Anclote River near Elfers, Fl. ............................ 59 Figure 4-9. Trend analysis of conductivity for Anclote River near Elfers, Fl. ............................... 61 Figure 4-10. Trend analysis of sodium for Anclote River near Elfers, Fl. .................................... 62 Figure 4-11. Trend analysis of chloride for Anclote River near Elfers, Fl. ................................... 63 Figure 4-12. Trend analysis of potassium for Anclote River near Elfers, Fl. ............................... 64 Figure 4-13. Concentration of dissolved oxygen measured at depths less than 1.5 meters in the
Anclote River (2003-2005). ................................................................................................. 66 Figure 4-14. Concentration of dissolved oxygen measured at depths greater than 1.5 meters in
the Anclote River (2003 - 2006) .......................................................................................... 67 Figure 4-15. Concentration of near-bottom dissolved oxygen measured along the lower Anclote
River (2003 - 2006). ............................................................................................................ 68 Figure 4-16. Relationship between near-bottom dissolved oxygen and measurement depth, ... 68 Figure 5-1. Benthos diversity in the Anclote River estuary as function of salinity (n = total
number of taxa) ................................................................................................................... 70 Figure 5-2. Sample day flows compared to day of year flows 1955-2007, expressed as
percentile rank. Example : Flow on May 23, 2005 is 75th percentile rank for all May 23 values between 1955-2007. ................................................................................................ 75
Figure 5-3. Abundance response of Spot to flow. ...................................................................... 79 Figure 5-4. Abundance response of bay anchovy to flow. .......................................................... 79 Figure 5-5. Regional response models of mollusk abundance to salinity at capture for
representative taxa found in the Anclote River estuary. ...................................................... 83 Figure 6-1. Example of low flow in a riffle or shoal area. Many potential in-stream habitats such
as lime rock (foreground), snags, sandbars, and exposed roots are not inundated under low flow conditions. ............................................................................................................. 86
Figure 6-2. Meanders and islands between Rkm 5 and 12 ........................................................ 91 Figure 7-1. Location of the Anclote River freshwater study corridor in Pasco County, Florida. .. 94 Figure 7-2 HEC RAS cross sections ........................................................................................... 94 Figure 7-3. Vegetation transect location and NWI vegetation communities along the Anclote
River study corridor. ............................................................................................................ 97 Figure 7-4. Weighted usable area (WUA) versus discharge for three life history stages (fry,
juvenile, adult) and spawning activity of Bluegill sunfish at the Elfers PHABSIM site in the Anclote River. .................................................................................................................... 101
Figure 7-5. Example plot of habitat gain/loss relative to flow reductions of 10, 20, 30, and 40%. Habitat loss is shown for spotted sunfish adults at the Elfers site in the Anclote River based on historic flow records from wet AMO Years (1955 – 1969 plus 1995 – 2006). .............. 102
Figure 7-6. Percent-of-flow reductions that result in a 15% reduction in the number of days that flows on the Alafia, middle Peace, and Myakka rivers are reached. Horizontal lines represent the flow reduction standards identified by the District for specific flow ranges in each river. Graphs are adapted from Kelly et al. 2005a, b, and c. .................................... 105
Figure 7-7. Wetted perimeter versus discharge at HEC-RAS transect number 44.9 in the Anclote River. Wetted perimeter values for modeled flows up to 25 cfs are shown and the lowest wetted perimeter inflection point for this cross section is identified. ...................... 107
Figure 7-8. Estimation of flow reduction resulting in 15% loss of estuary volume upstream of 2 ppt isohaline. ..................................................................................................................... 118
D:\Anclote\Report\Final\Anclote_MFL_Final.doc Last Save : 2/22/2010 11:02 AM
________________________________________________________________________________________________________ Proposed Minimum Flows and Levels for Anclote River System ix
Figure 8-1. Plot of flow required at the Anclote River at Elfers gauge to inundate the deepest part of the channel at 16 HEC-RAS cross sections in the Anclote River to a depth of 0.6 ft. Note that the scale of the x-axis is not linear. ................................................................... 122
Figure 8-2. Plot of local flow at the Anclote River at Elfers gauge required to inundate the lowest wetted perimeter inflection point at sixteen HEC-RAS cross sections in the Anclote River. Note that the scale of the x-axis is not linear. ................................................................... 123
Figure 8-3. Summary results for the "Abandon" PHABSIM site for April through July. Box and whisker plots represent the median, 25, 75 percentile, minimum, maximum observations for all flow reductions less than 40% which resulted in a 15% loss of available habitat. ........ 125
Figure 8-4. Elevation (feet above NGVD) profile for floodplain vegetation/soils cross section (transect 4). Distances (cumulative length) are shown centered on the middle of the river channel. ............................................................................................................................. 127
Figure 8-5. Floodplain wetted perimeter versus elevation at floodplain vegetation/soils cross section (Transect) 4. Vertical bars indicate mean elevations of two floodplain vegetation classes observed at the site. ............................................................................................. 129
Figure 8-6. Median elevations of vegetation classes at floodplain vegetation/soils in transects along the Anclote River. .................................................................................................... 131
Figure 8-7. Percent-of-flow reductions that result in a 15% reduction in the number of days flow are achieved, based on period of record (1955-2006) flow records from the USGS Anclote River near Elfers gauge. ................................................................................................... 135
Figure 8-8. Summary results for the upper Anclote River PHABSIM site for October through April. Box and Whisker plots represent the median, 25, and 75 percentile and maximum and minimum observation for all flow reduction less than 40%, which resulted in a 15% of available habitat reduction. ............................................................................................... 137
Figure 8-9. Percent dominance of instream habitats based on linear extent of the habitats along twelve cross sections on the Anclote River. ...................................................................... 138
Figure 8-10. Mean elevations of instream habitats at twelve cross section sites on the Anclote River. ................................................................................................................................. 139
Figure 8-11 Median daily flow at the USGS Anclote River near Elfers plotted with freshwater MFL superimposed. Median daily flow at the USGS Anclote River near Elfers gauge site plotted as days beginning April 12 with short-term compliance standards for Blocks 1, 2 and, 3. The orange line is the natural flow (USGS flow corrected for withdrawals). The blue line represents the natural flow, reduced by the maximum allowable withdrawal, without violating the proposed MFLs. The upper red line (138 cfs) is the high-flow step above which withdrawals are limited to 8% and below which they are seasonally specific. The lower red line (12 cfs) is the low-flow threshold below which surface water withdrawals are not permitted ........................................................................................................................... 143
Figure 8-12 Summary of mean annual and block 1 and block 3 flows after applying freshwater MFL to naturalized flow. .................................................................................................... 144
Figure 8-13. Percentile rank of annual and long-term flow statistics......................................... 145 Figure 8-14. Estuarine MFL Results - Block 1 .......................................................................... 148 Figure 8-15. Estuarine MFL Results - Block 3 .......................................................................... 148 Figure 8-16. Median day of year flow (cfs) for baseline and after imposing the recommended
freshwater MFL and estuarine MFL .................................................................................. 149 Figure 8-17. Allowable withdrawals (relative to unimpacted baseline flows measured at Elfers
gauge) for recommended freshwater and estuarine MFLs ............................................... 150
D:\Anclote\Report\Final\Anclote_MFL_Final.doc Last Save : 2/22/2010 11:02 AM
________________________________________________________________________________________________________ Proposed Minimum Flows and Levels for Anclote River System x
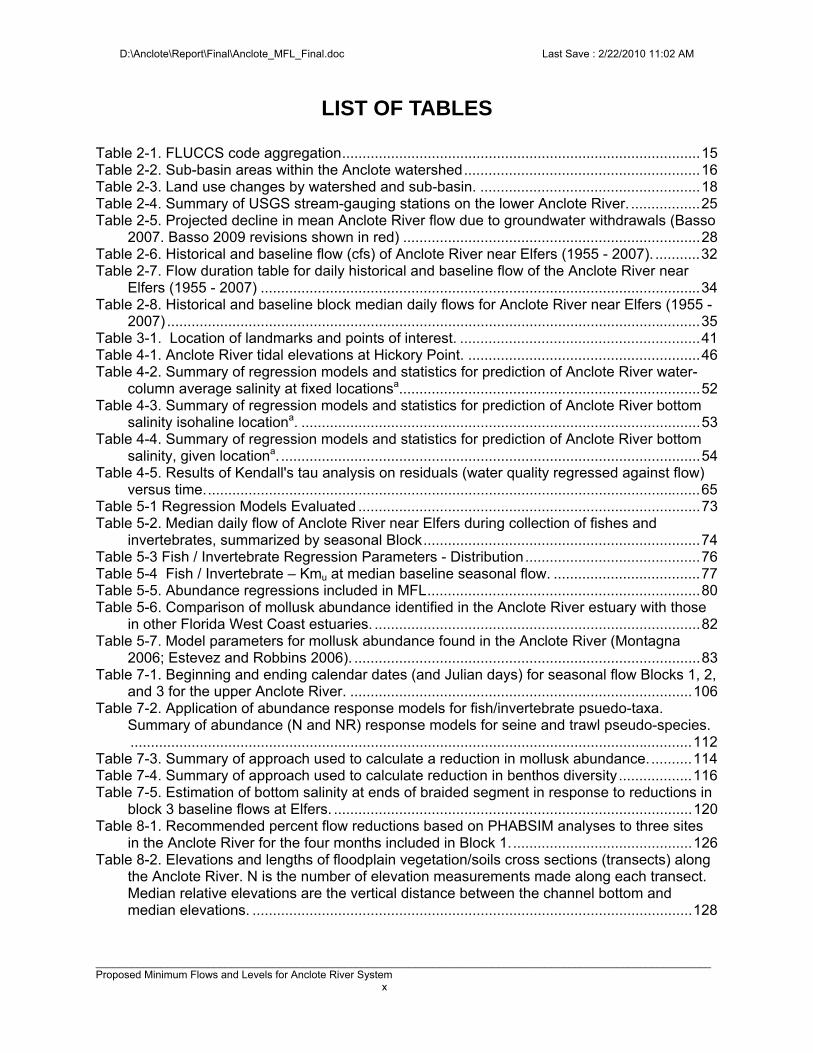
LIST OF TABLES Table 2-1. FLUCCS code aggregation ........................................................................................ 15 Table 2-2. Sub-basin areas within the Anclote watershed .......................................................... 16 Table 2-3. Land use changes by watershed and sub-basin. ...................................................... 18 Table 2-4. Summary of USGS stream-gauging stations on the lower Anclote River. ................. 25 Table 2-5. Projected decline in mean Anclote River flow due to groundwater withdrawals (Basso
2007. Basso 2009 revisions shown in red) ......................................................................... 28 Table 2-6. Historical and baseline flow (cfs) of Anclote River near Elfers (1955 - 2007). ........... 32 Table 2-7. Flow duration table for daily historical and baseline flow of the Anclote River near
Elfers (1955 - 2007) ............................................................................................................ 34 Table 2-8. Historical and baseline block median daily flows for Anclote River near Elfers (1955 -
2007) ................................................................................................................................... 35 Table 3-1. Location of landmarks and points of interest. ........................................................... 41 Table 4-1. Anclote River tidal elevations at Hickory Point. ......................................................... 46 Table 4-2. Summary of regression models and statistics for prediction of Anclote River water-
column average salinity at fixed locationsa. ......................................................................... 52 Table 4-3. Summary of regression models and statistics for prediction of Anclote River bottom
salinity isohaline locationa. .................................................................................................. 53 Table 4-4. Summary of regression models and statistics for prediction of Anclote River bottom
salinity, given locationa. ....................................................................................................... 54 Table 4-5. Results of Kendall's tau analysis on residuals (water quality regressed against flow)
versus time. ......................................................................................................................... 65 Table 5-1 Regression Models Evaluated .................................................................................... 73 Table 5-2. Median daily flow of Anclote River near Elfers during collection of fishes and
invertebrates, summarized by seasonal Block .................................................................... 74 Table 5-3 Fish / Invertebrate Regression Parameters - Distribution ........................................... 76 Table 5-4 Fish / Invertebrate – Kmu at median baseline seasonal flow. .................................... 77 Table 5-5. Abundance regressions included in MFL ................................................................... 80 Table 5-6. Comparison of mollusk abundance identified in the Anclote River estuary with those
in other Florida West Coast estuaries. ................................................................................ 82 Table 5-7. Model parameters for mollusk abundance found in the Anclote River (Montagna
2006; Estevez and Robbins 2006). ..................................................................................... 83 Table 7-1. Beginning and ending calendar dates (and Julian days) for seasonal flow Blocks 1, 2,
and 3 for the upper Anclote River. .................................................................................... 106 Table 7-2. Application of abundance response models for fish/invertebrate psuedo-taxa.
Summary of abundance (N and NR) response models for seine and trawl pseudo-species. .......................................................................................................................................... 112
Table 7-3. Summary of approach used to calculate a reduction in mollusk abundance. .......... 114 Table 7-4. Summary of approach used to calculate reduction in benthos diversity .................. 116 Table 7-5. Estimation of bottom salinity at ends of braided segment in response to reductions in
block 3 baseline flows at Elfers. ........................................................................................ 120 Table 8-1. Recommended percent flow reductions based on PHABSIM analyses to three sites
in the Anclote River for the four months included in Block 1. ............................................ 126 Table 8-2. Elevations and lengths of floodplain vegetation/soils cross sections (transects) along
the Anclote River. N is the number of elevation measurements made along each transect. Median relative elevations are the vertical distance between the channel bottom and median elevations. ............................................................................................................ 128
D:\Anclote\Report\Final\Anclote_MFL_Final.doc Last Save : 2/22/2010 11:02 AM
________________________________________________________________________________________________________ Proposed Minimum Flows and Levels for Anclote River System xi
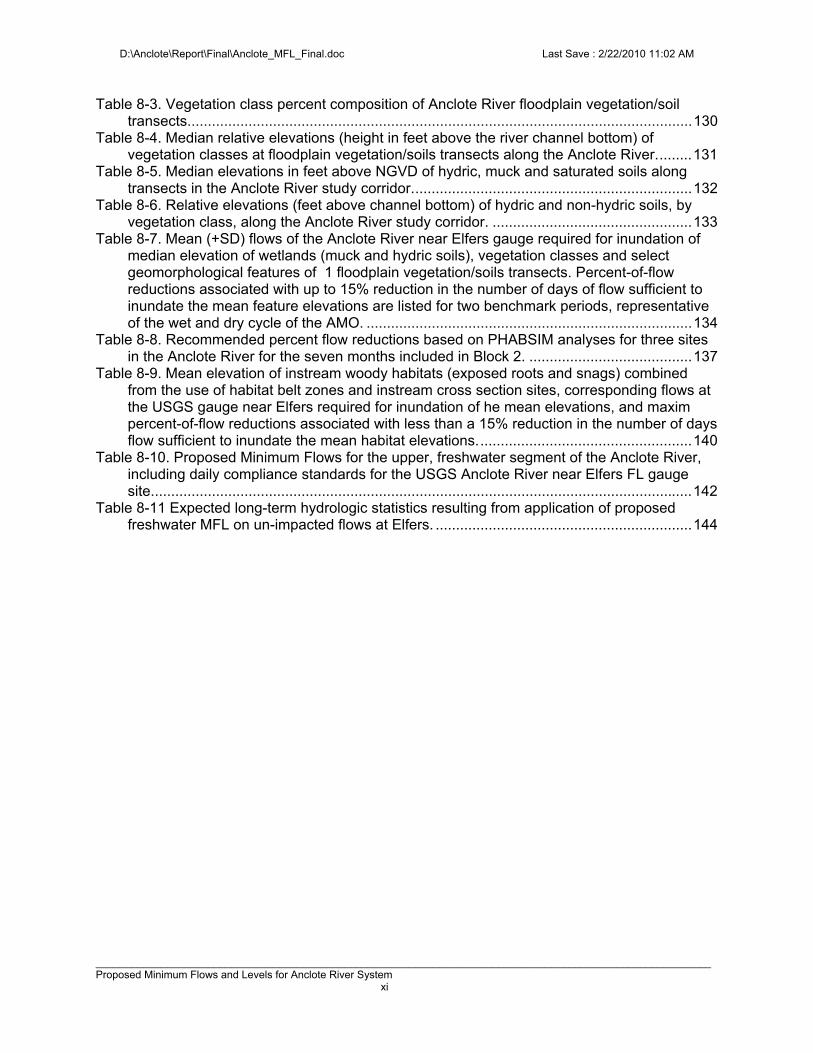
Table 8-3. Vegetation class percent composition of Anclote River floodplain vegetation/soil transects. ........................................................................................................................... 130
Table 8-4. Median relative elevations (height in feet above the river channel bottom) of vegetation classes at floodplain vegetation/soils transects along the Anclote River. ........ 131
Table 8-5. Median elevations in feet above NGVD of hydric, muck and saturated soils along transects in the Anclote River study corridor. .................................................................... 132
Table 8-6. Relative elevations (feet above channel bottom) of hydric and non-hydric soils, by vegetation class, along the Anclote River study corridor. ................................................. 133
Table 8-7. Mean (+SD) flows of the Anclote River near Elfers gauge required for inundation of median elevation of wetlands (muck and hydric soils), vegetation classes and select geomorphological features of 1 floodplain vegetation/soils transects. Percent-of-flow reductions associated with up to 15% reduction in the number of days of flow sufficient to inundate the mean feature elevations are listed for two benchmark periods, representative of the wet and dry cycle of the AMO. ................................................................................ 134
Table 8-8. Recommended percent flow reductions based on PHABSIM analyses for three sites in the Anclote River for the seven months included in Block 2. ........................................ 137
Table 8-9. Mean elevation of instream woody habitats (exposed roots and snags) combined from the use of habitat belt zones and instream cross section sites, corresponding flows at the USGS gauge near Elfers required for inundation of he mean elevations, and maxim percent-of-flow reductions associated with less than a 15% reduction in the number of days flow sufficient to inundate the mean habitat elevations. .................................................... 140
Table 8-10. Proposed Minimum Flows for the upper, freshwater segment of the Anclote River, including daily compliance standards for the USGS Anclote River near Elfers FL gauge site. .................................................................................................................................... 142
Table 8-11 Expected long-term hydrologic statistics resulting from application of proposed freshwater MFL on un-impacted flows at Elfers. ............................................................... 144
D:\Anclote\Report\Final\Anclote_MFL_Final.doc Last Save : 2/22/2010 11:02 AM
________________________________________________________________________________________________________ Proposed Minimum Flows and Levels for Anclote River System xii
Preface
Data collection for the purpose of developing the Anclote River MFL took place during 2004 through 2007. Analysis of the data began in 2005 with development of a long-term flow record free of anthropogenic impacts that are largely the result of groundwater withdrawals in the headwater of the river. At that time, the existing data suggested that the river was experiencing a loss of 18 cfs due to groundwater pumpage. As development of the MFL continued and by the time the internal draft of the report was completed, it became clear that the estimated groundwater impacts exceeded the proposed MFL and that a recovery plan required by F.S. 373.0421 would be necessary. In actuality, the recovery plan, known as the Northern Tampa Bay New Water Supply and Ground Water Withdrawal Reduction Agreement (Rule 40D-80.073(3), F.A.C.) was already in place, having been enacted in 1998 as the Regulatory Portion of Recovery Strategy for Pasco, Northern Hillsborough and Pinellas Counties. The plan calls for a reduction of regional groundwater pumpage from 158 mgd in 1998 to 90 mgd in 2009. A June 2009 re-evaluation of pumpage impacts on the Anclote River suggests that if the 2008 pumpage levels and well rotation schedule can be sustained, then flow in the Anclote will recover to levels within the approved MFL. Monitoring and reporting required by the recovery rule will be used to verify recovery. Given the apparent transition period of recovery, some of this report continues to reflect conditions prior to 2008. In particular, section 2.6 has not been updated and reflects the state of knowledge that existed when the original analyses were completed. On the other hand, Section 2.5 has been updated and additional text introduced to reflect the more recent data regarding recovery. Finally, the concluding section (8.5) has been updated accordingly.
D:\Anclote\Report\Final\Anclote_MFL_Final.doc Last Save : 2/22/2010 11:02 AM
________________________________________________________________________________________________________ Proposed Minimum Flows and Levels for Anclote River System xiii
Acknowledgements
I would like to thank my colleagues for their contributions and useful suggestions. In particular, I would like to acknowledge Ron Basso for his contribution in estimating the anthropogenic impacts to flow. I am indebted to Michelle Dachsteiner and Everett Eldridge for their field efforts and to Barbara Matrone for her assistance in document production. Sid Flannery provided historical datasets and valuable knowledge about prior District projects related to the Anclote River. Keith Kolas and Kristen Kaufman provided GIS coverage and much insight about the SAV community in the Anclote Anchorage. My co-authors, Adam Munson, Jason Hood and Marty Kelly not only provided the freshwater MFL analysis and contributed significant background material for the report, Marty Kelly also provided a much appreciated review of the initial draft document. Finally, I would like to thank the many District contractors that contributed to this report. The staff of HSW, Inc (Dean Mades, Leiu Yang and Ken Watson in particular) prepared the bulk of the estuarine analysis and much of the report writing. Ernst Peebles (and his staff and students at USF) and Tim MacDonald and his colleagues at Florida Fish and Wildlife Conservation Commission collected and analyzed the fish and invertebrate data. Ernie Estevez of Mote Marine Lab conducted the mollusk surveys and Brad Robbins (also from Mote) provided the shoreline vegetation analysis. The staff at Janicki Environmental conducted the sampling and interpretation of the benthic community. The cost of outside support is approximately $187,500, which was provided by the Pinellas Anclote Basin Board and the District Governing Board.
D:\Anclote\Report\Final\Anclote_MFL_Final.doc Last Save : 2/22/2010 11:02 AM
________________________________________________________________________________________________________ Proposed Minimum Flows and Levels for Anclote River System xiv
Executive Summary Minimum Flows and Levels (MFL) – Anclote River
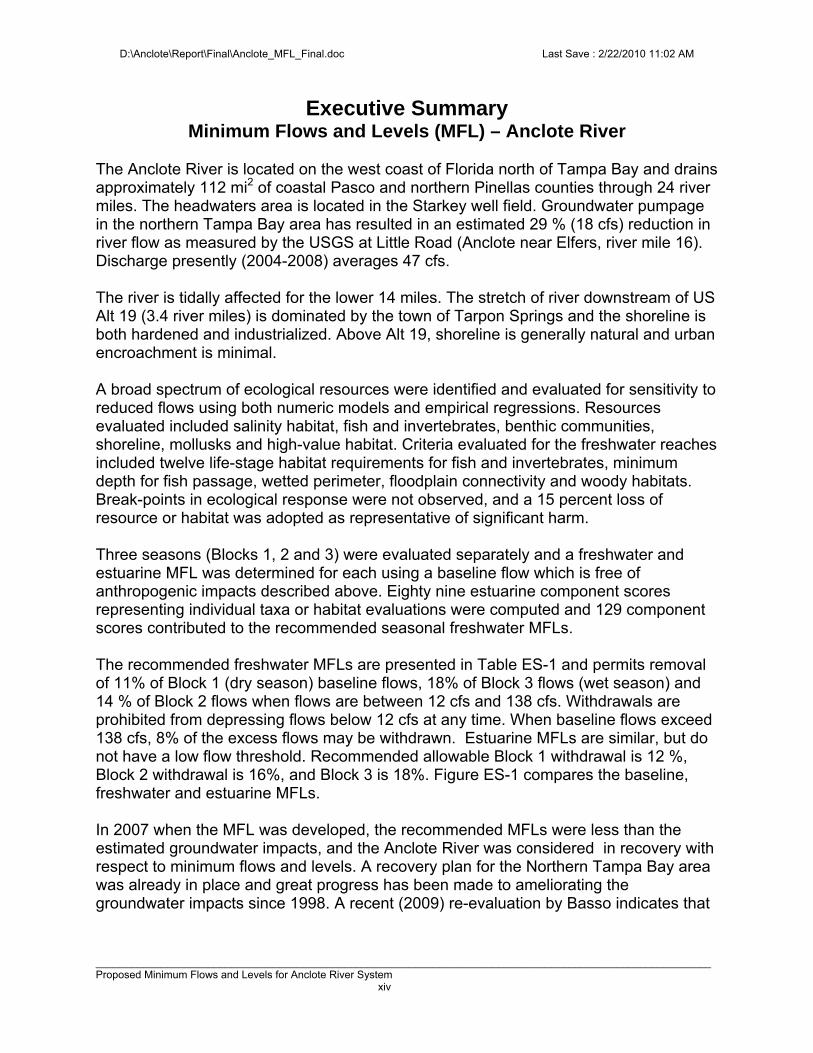
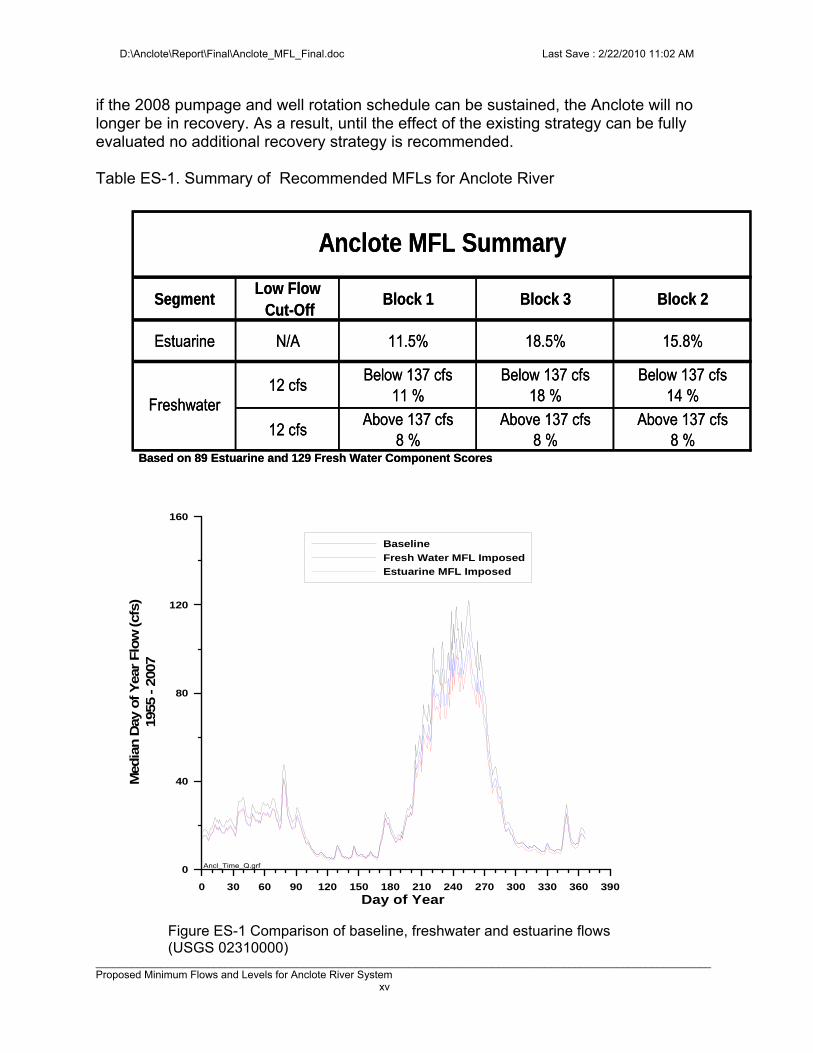
The Anclote River is located on the west coast of Florida north of Tampa Bay and drains approximately 112 mi2 of coastal Pasco and northern Pinellas counties through 24 river miles. The headwaters area is located in the Starkey well field. Groundwater pumpage in the northern Tampa Bay area has resulted in an estimated 29 % (18 cfs) reduction in river flow as measured by the USGS at Little Road (Anclote near Elfers, river mile 16). Discharge presently (2004-2008) averages 47 cfs. The river is tidally affected for the lower 14 miles. The stretch of river downstream of US Alt 19 (3.4 river miles) is dominated by the town of Tarpon Springs and the shoreline is both hardened and industrialized. Above Alt 19, shoreline is generally natural and urban encroachment is minimal. A broad spectrum of ecological resources were identified and evaluated for sensitivity to reduced flows using both numeric models and empirical regressions. Resources evaluated included salinity habitat, fish and invertebrates, benthic communities, shoreline, mollusks and high-value habitat. Criteria evaluated for the freshwater reaches included twelve life-stage habitat requirements for fish and invertebrates, minimum depth for fish passage, wetted perimeter, floodplain connectivity and woody habitats. Break-points in ecological response were not observed, and a 15 percent loss of resource or habitat was adopted as representative of significant harm. Three seasons (Blocks 1, 2 and 3) were evaluated separately and a freshwater and estuarine MFL was determined for each using a baseline flow which is free of anthropogenic impacts described above. Eighty nine estuarine component scores representing individual taxa or habitat evaluations were computed and 129 component scores contributed to the recommended seasonal freshwater MFLs. The recommended freshwater MFLs are presented in Table ES-1 and permits removal of 11% of Block 1 (dry season) baseline flows, 18% of Block 3 flows (wet season) and 14 % of Block 2 flows when flows are between 12 cfs and 138 cfs. Withdrawals are prohibited from depressing flows below 12 cfs at any time. When baseline flows exceed 138 cfs, 8% of the excess flows may be withdrawn. Estuarine MFLs are similar, but do not have a low flow threshold. Recommended allowable Block 1 withdrawal is 12 %, Block 2 withdrawal is 16%, and Block 3 is 18%. Figure ES-1 compares the baseline, freshwater and estuarine MFLs. In 2007 when the MFL was developed, the recommended MFLs were less than the estimated groundwater impacts, and the Anclote River was considered in recovery with respect to minimum flows and levels. A recovery plan for the Northern Tampa Bay area was already in place and great progress has been made to ameliorating the groundwater impacts since 1998. A recent (2009) re-evaluation by Basso indicates that
D:\Anclote\Report\Final\Anclote_MFL_Final.doc Last Save : 2/22/2010 11:02 AM
________________________________________________________________________________________________________ Proposed Minimum Flows and Levels for Anclote River System xv
if the 2008 pumpage and well rotation schedule can be sustained, the Anclote will no longer be in recovery. As a result, until the effect of the existing strategy can be fully evaluated no additional recovery strategy is recommended. Table ES-1. Summary of Recommended MFLs for Anclote River
SegmentLow Flow Cut-Off
Block 1 Block 3 Block 2
Estuarine N/A 11.5% 18.5% 15.8%
12 cfsBelow 137 cfs
11 %Below 137 cfs
18 %Below 137 cfs
14 %
12 cfsAbove 137 cfs
8 %Above 137 cfs
8 %Above 137 cfs
8 %
Anclote MFL Summary
Freshwater
Based on 89 Estuarine and 129 Fresh Water Component Scores
SegmentLow Flow Cut-Off
Block 1 Block 3 Block 2
Estuarine N/A 11.5% 18.5% 15.8%
12 cfsBelow 137 cfs
11 %Below 137 cfs
18 %Below 137 cfs
14 %
12 cfsAbove 137 cfs
8 %Above 137 cfs
8 %Above 137 cfs
8 %
Anclote MFL Summary
Freshwater
Based on 89 Estuarine and 129 Fresh Water Component Scores
0 30 60 90 120 150 180 210 240 270 300 330 360 390
Day of Year
0
40
80
120
160
Med
ian D
ay o
f Y
ear
Flo
w (cf
s)19
55 - 2
007
Baseline
Fresh Water MFL Imposed
Estuarine MFL Imposed
Ancl_Time_Q.grf
Figure ES-1 Comparison of baseline, freshwater and estuarine flows (USGS 02310000)
D:\Anclote\Report\Final\Anclote_MFL_Final.doc Last Save : 02/22/10 11:02
____________________________________________________________________________________________________ Proposed Minimum Flows and Levels for Anclote River System Purpose and Background of MFL Page 1 of 207
CHAPTER 1 - PURPOSE & BACKGROUND OF MFL
1.1 Overview and Legislative Direction The Southwest Florida Water Management District (District or SWFWMD), by virtue of its responsibility to permit the consumptive use of water and a legislative mandate to protect water resources from “significant harm”, has been directed to establish minimum flows and levels (MFLs) for streams and rivers within its boundaries (Section 373.042, Florida Statutes). As currently defined by statute, “the minimum flow for a given watercourse shall be the limit at which further withdrawals would be significantly harmful to the water resources or ecology of the area.” Mere development or adoption of a minimum flow, of course, does not protect a water body from significant harm; however, protection, recovery or regulatory compliance can be gauged once a standard has been established. The District's purpose in establishing MFLs is to create a yardstick against which permitting and/or planning decisions regarding water withdrawals, either surface or groundwater, can be made. Should an amount of withdrawal requested cause “significant harm” then a permit cannot be issued. If, when developing MFLs, it is determined that a system is already significantly harmed as a result of existing withdrawals, then a recovery plan is developed and implemented. According to state law, minimum flows and levels are to be established based upon the best information available (Section 373.042, F.S), and shall be developed with consideration of “...changes and structural alterations to watersheds, surface waters and aquifers and the effects such changes or alterations have had, and the constraints such changes or alterations have placed, on the hydrology of the affected watershed, surface water, or aquifer...” (Section 373.0421, F.S.). Changes, alterations and constraints associated with water withdrawals are not to be considered when developing minimum flows and levels. Because minimum flows are used for long-range planning and since the setting of minimum flows can potentially affect (restrict) the use and allocation of water, establishment of minimum flows will not go unnoticed or unchallenged. As indicated by the quote that follows, there is no universally accepted method to setting an MFL. Instream Flow Council (2002) Therefore, the science upon which a minimum flow is based, the assumptions made, and the policy used must be clearly defined as each minimum flow is developed.
"There is no universally accepted method or combination of methods that is appropriate for establishing instream flow regimes on all rivers or streams. Rather, the combination or adaptation of methods should be determined on a case-by-case basis; . . . In a sense, there are few bad methods – only improper applications of methods. In fact, most . . . assessment tools . . . can afford adequate instream flow protection for all of a river's needs when they are used in conjunction with other techniques in ways that provide reasonable answers to specific questions asked for individual rivers and river segments. Therefore, whether a particular method 'works' is not based on its acceptance by all parties but whether it is based on sound science, basic ecological principles, and documented logic that address a specific need" (Instream Flow Council 2002).
D:\Anclote\Report\Final\Anclote_MFL_Final.doc Last Save : 02/22/10 11:02
____________________________________________________________________________________________________ Proposed Minimum Flows and Levels for Anclote River System Purpose and Background of MFL Page 2 of 207
1.2 Historical Perspective For freshwater streams and rivers, the development of instream flow legislation can be traced to the work of fisheries biologists. Major advances in instream flow methods have been rather recent, dating back not much more than 35 to 40 years. A survey completed in 1986 (Reiser et al. 1989) indicated that at that time only 15 states had legislation explicitly recognizing that fish and other aquatic resources required a certain level of instream flow for their protection. Nine of the 15 states were western states “where the concept for and impetus behind the preservation of instream flows for fish and wildlife had its origins” (Reiser et al. 1989). Stalnaker et al. (1995) have summarized the minimum flows approach as one of standards development, stating that, “[f]ollowing the large reservoir and water development era of the mid-twentieth century in North America, resource agencies became concerned over the loss of many miles of riverine fish and wildlife resources in the arid western United States. Consequently, several western states began issuing rules for protecting existing stream resources from future depletions caused by accelerated water development. Many assessment methods appeared during the 1960's and early 1970's. These techniques were based on hydrologic analysis of the water supply and hydraulic considerations of critical stream channel segments, coupled with empirical observations of habitat quality and an understanding of riverine fish ecology . . . Application of these methods usually resulted in a single threshold or ‘minimum’ flow value for a specified stream reach.”
1.3 The Flow Regime The idea that a single minimum flow is not satisfactory for maintaining a river ecosystem was most emphatically stated by Stalnaker (1990) who declared “minimum flow is a myth”. The purpose of his paper was to argue that “multiple flow regimes are needed to maintain biotic and abiotic resources within a river ecosystem” (Hill et al. 1991). The logic is that “maintenance of stream ecosystems rests on stream flow management practices that protect physical processes which, in turn, influence biological systems.” Hill et al. (1991) identified four types of flows that should be considered when examining river flow requirements, including:
1) flood flows that determine the boundaries of and shape floodplain and valley features;
2) overbank flows that maintain riparian habitats; 3) in-channel flows that keep immediate streambanks and channels functioning; and 4) in-stream flows that meet critical fish requirements.
As emphasized by Hill et al. (1991), minimum flows methodologies should involve more than a consideration of immediate fish needs or the absolute minimum required to sustain a particular species or population of animals, and should take into consideration “how stream flows affect channels, transport sediments, and influence vegetation.” Although, not always appreciated, it should also be noted “that the full range of natural intra- and inter-annual variation of hydrologic regimes is necessary to [fully] sustain the native biodiversity” (Richter et al. 1996). Successful completion of the life cycle of many aquatic species is dependant upon a range of flows, and alterations to the flow regime may negatively affect these organisms as a result of changes in physical, chemical and biological factors associated with particular flow conditions.
D:\Anclote\Report\Final\Anclote_MFL_Final.doc Last Save : 02/22/10 11:02
____________________________________________________________________________________________________ Proposed Minimum Flows and Levels for Anclote River System Purpose and Background of MFL Page 3 of 207
Recently, South African researchers, as cited by Postel and Richter (2003), listed eight general principles for managing river flows:
1) "A modified flow regime should mimic the natural one, so that the natural timing of different kinds of flows is preserved.
2) A river's natural perenniality or nonperenniality should be retained. 3) Most water should be harvested from a river during wet months; little should be taken
during the dry months. 4) The seasonal pattern of higher base flows in wet season should be retained. 5) Floods should be present during the natural wet season. 6) The duration of floods could be shortened, but within limits. 7) It is better to retain certain floods at full magnitude and to eliminate others entirely
than to preserve all or most floods at diminished levels. 8) The first flood (or one of the first) of the wet season should be fully retained."
Common to this list and the flow requirements identified by Hill et al. (1991) is the recognition that in-stream flows and out of bank flows are important and that seasonal variability of flows should be maintained. Based on these concepts, the preconception that minimum flows (and levels) are a single value or the absolute minimum required to maintain ecologic health in most systems has been abandoned in recognition of the important ecologic and hydrologic functions of streams and rivers that are maintained by different ranges of flow. Moreover, while the term “minimum flows” is still used, the concept has evolved to one that recognizes the need to maintain a “minimum flow regime”. In Florida, for example, the St. Johns River Water Management District (SJRWMD) typically develops multiple flows requirements when establishing minimum flows and levels (Chapter 40-C8, F.A.C). For the Wekiva River SJRWMD noted that, “[s]etting multiple minimum levels and flows, rather than a single minimum level and flow, recognizes that lotic [running water] systems are inherently dynamic” (Hupalo et al. 1994). An alternate approach that also maintains a flow regime is to develop MFLs using a 'percentage of flow' as discussed in Flannery et al. (2002) and has been incorporated into several SWFWMD surface water use permits.
1.4 Ecosystem Integrity and Significant Harm “A goal of ecosystem management is to sustain ecosystem integrity by protecting native biodiversity and the ecological (and evolutionary) processes that create and maintain that diversity. Faced with the complexity inherent in natural systems, achieving that goal will require that resource managers explicitly describe desired ecosystem structure, function, and variability; characterize differences between current and desired conditions; define ecologically meaningful and measurable indicators that can mark progress toward ecosystem management and restoration goals; and incorporate adaptive strategies into resource management plans” (Richter et al. 1996). Although it is clear that multiple flows are needed to maintain the ecological systems that encompass streams, riparian zones and valleys, much of the fundamental research needed to quantify the ecological links between the instream and out of bank resources, because of expense and complexity, remains to be done. This research is needed to develop more refined methodologies, and will require a multi-disciplinary approach involving hydrologists, geomorphologists, aquatic and terrestrial biologists, and botanists (Hill et al. 1991).
D:\Anclote\Report\Final\Anclote_MFL_Final.doc Last Save : 02/22/10 11:02
____________________________________________________________________________________________________ Proposed Minimum Flows and Levels for Anclote River System Purpose and Background of MFL Page 4 of 207
To justify adoption of a minimum flow for purposes of maintaining ecologic integrity, it is necessary to demonstrate with site-specific information the ecological effects associated with flow alterations and to identify thresholds for determining whether these effects constitute significant harm. As described in Florida’s legislative requirement to develop minimum flows, the minimum flow is to prevent “significant harm” to the state’s rivers and streams. Not only must “significant harm” be defined so that it can be measured, it is also implicit that some deviation from the purely natural or existing long-term hydrologic regime may occur before significant harm occurs. The goal of a minimum flow is not to preserve a hydrologic regime without modification, but rather to establish the threshold(s) at which modifications to the regime begin to affect the aquatic resource and cause significant harm. If recent changes have already “significantly harmed” the resource, or are expected to do so in the next twenty years, it will be necessary to develop a recovery or prevention plan.
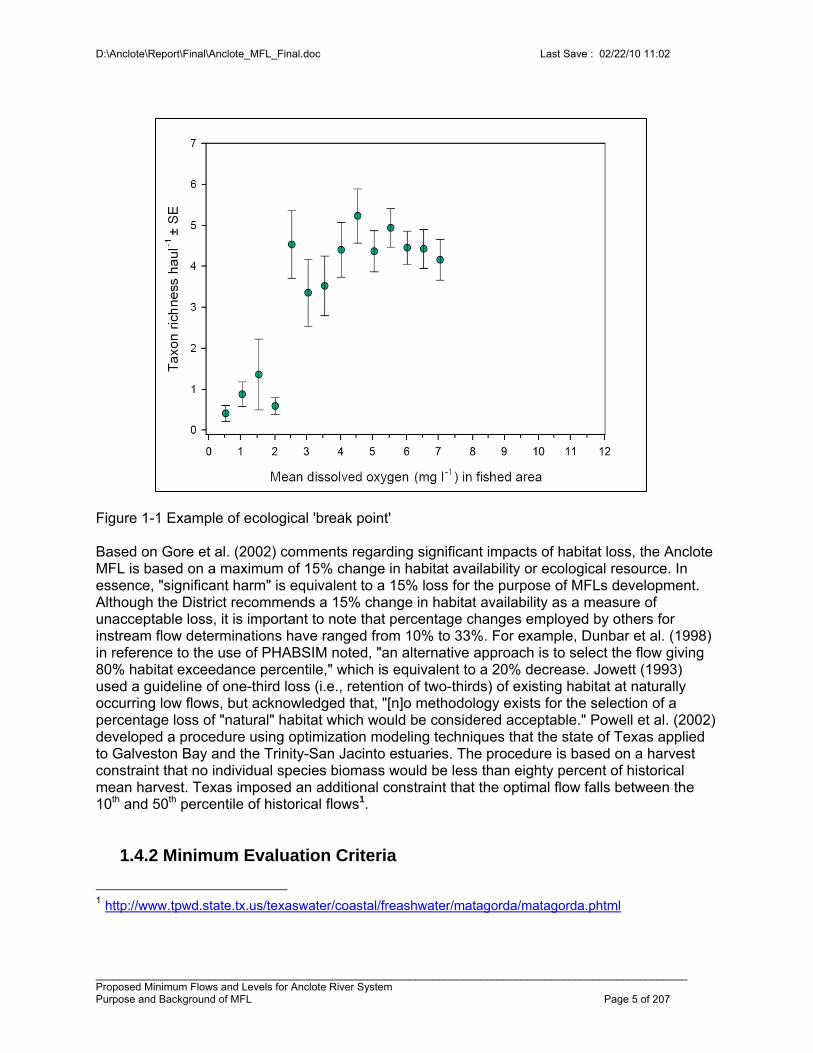
1.4.1 Defining Significant Harm The goal of an MFL determination is to protect the resource from significant harm due to withdrawals and was broadly defined in the enacting legislation as "the limit at which further withdrawals would be significantly harmful to the water resources or ecology of the area." What constitutes "significant harm" was not defined. For flowing freshwater systems the District has identified loss of flows associated with fish passage and maximization of stream bottom habitat with the least amount of flow as significantly harmful to river ecosystems. For estuarine systems, the connections between freshwater, salt water and biological resources are less well defined and the District's approach is largely based on protection of habitats associated with a range of salinities. Also, based upon consideration of a recommendation of the peer review panel for the upper Peace River MFLs (Gore et al. 2002), significant harm in many cases can be defined as quantifiable reductions in habitat. Ideally, there will be a clear 'break point' that identifies significant harm. Figure 1-1 provides a rare example of how dissolved oxygen relates to abundance of fish. Unfortunately, more often in nature there is simply a monotonic continuum with a changing rate of response, but one that does not provide an easily identifiable break-point. Little guidance is found in the literature, and the definition of 'significant harm' often becomes a policy decision rather than a technical decision. In their peer review report on the upper Peace River, Gore et al. (2002) stated, "[i]n general, instream flow analysts consider a loss of more than 15% habitat, as compared to undisturbed or current conditions, to be a significant impact on that population or assemblage." This recommendation was made in consideration of employing the Physical Habitat Simulation Model (PHABSIM) for analyzing flow, water depth and substrate preferences that define aquatic species habitats. With some exceptions (e.g., loss of fish passage or wetted perimeter inflection point), there are few "bright lines" which can be relied upon to judge when "significant harm" occurs. Rather loss of habitat in many cases occurs incrementally as flows decline, often without a clear inflection point or threshold
D:\Anclote\Report\Final\Anclote_MFL_Final.doc Last Save : 02/22/10 11:02
____________________________________________________________________________________________________ Proposed Minimum Flows and Levels for Anclote River System Purpose and Background of MFL Page 5 of 207
Figure 1-1 Example of ecological 'break point' Based on Gore et al. (2002) comments regarding significant impacts of habitat loss, the Anclote MFL is based on a maximum of 15% change in habitat availability or ecological resource. In essence, "significant harm" is equivalent to a 15% loss for the purpose of MFLs development. Although the District recommends a 15% change in habitat availability as a measure of unacceptable loss, it is important to note that percentage changes employed by others for instream flow determinations have ranged from 10% to 33%. For example, Dunbar et al. (1998) in reference to the use of PHABSIM noted, "an alternative approach is to select the flow giving 80% habitat exceedance percentile," which is equivalent to a 20% decrease. Jowett (1993) used a guideline of one-third loss (i.e., retention of two-thirds) of existing habitat at naturally occurring low flows, but acknowledged that, "[n]o methodology exists for the selection of a percentage loss of "natural" habitat which would be considered acceptable." Powell et al. (2002) developed a procedure using optimization modeling techniques that the state of Texas applied to Galveston Bay and the Trinity-San Jacinto estuaries. The procedure is based on a harvest constraint that no individual species biomass would be less than eighty percent of historical mean harvest. Texas imposed an additional constraint that the optimal flow falls between the 10th and 50th percentile of historical flows1.
1.4.2 Minimum Evaluation Criteria
1 http://www.tpwd.state.tx.us/texaswater/coastal/freashwater/matagorda/matagorda.phtml
D:\Anclote\Report\Final\Anclote_MFL_Final.doc Last Save : 02/22/10 11:02
____________________________________________________________________________________________________ Proposed Minimum Flows and Levels for Anclote River System Purpose and Background of MFL Page 6 of 207
Relating inherently variable biological responses to MFL objectives will ultimately require setting criteria for taking management action based on the strength of the biological response to flows or levels. The science of establishing MFLs is evolving and many researchers have turned to regression statistics to determine the statistical strength between biological responses and inflows. The most common measure of the strength is the correlation coefficient (r) which ranges from +1.0 to 0.0 for a response that increases with increasing flow (conversely r can range from -1.0 to 0 for an inverted response). The coefficient of determination (r2
adj) is a convenient statistic, because it reflects the fraction of response that is attributable to changes in flow. However, it must be recognized that a statistically significant relationship may still be of limited value in the management of the resource. Taking an example from fish monitoring, it is possible to have statistically significant relationships that relate the number of animals to flow, but often the coefficient of determination is very low (e.g. 0.1). The interpretation is that while there is a significant relationship between the number of organisms and flow, flow only accounts for 10% of the change in numbers. The remaining 90% of variation in numbers is due to residual variation in flow and to factor(s) other than flow. It often becomes necessary to try to develop relationships between flow and some response with considerably fewer observations than recommended or desirable. While the legislature has indicated that an MFL should be based on the 'best information available', at some point it becomes questionable whether a management decision should be based on a very low number of observations or a very low correlation, and it becomes preferable to establish acceptance criteria a priori. The criteria for an acceptable regression suitable for making management decisions were addressed by Heyl (2008) in the development of the Weeki Wachee MFL. The same criteria have been applied to development of the Anclote River MFL. Namely, there must be a minimum of ten observations for each parameter in the regression, the regression must exhibit a coefficient of determination (r2
adj.) of at least 0.30 and the underlying assumptions about regressions must be met.
1.5 Summary of the SWFWMD Approach for Developing Minimum Flows
1.5.1 Elements of Minimum Flows It should be noted that this Anclote River MFL report includes an MFL determination for both the freshwater riverine and the downstream estuarine portion of the river. While the approaches and tools differ between these two evaluations, both share a common philosophical approach in attempting to establish a flow regime instead of a single threshold flow. In addition, both the riverine and the estuarine evaluation embody recommendations by Beecher (1990) who noted “it is difficult [in most statutes] to either ascertain legislative intent or determine if a proposed instream flow regime would satisfy the legislative purpose”. According to Beecher (as cited by Stalnaker et al. (1995)), an instream flow standard should include the following elements:
1) a goal (e.g., non-degradation or, for the District’s purpose, protection from “significant harm”);
2) identification of the resources of interest to be protected;
D:\Anclote\Report\Final\Anclote_MFL_Final.doc Last Save : 02/22/10 11:02
____________________________________________________________________________________________________ Proposed Minimum Flows and Levels for Anclote River System Purpose and Background of MFL Page 7 of 207
3) a unit of measure (e.g., flow in cubic feet per second, habitat in usable area, inundation to a specific elevation for a specified duration);
4) a benchmark period, and 5) a protection standard statistic.
In addition to Beecher's requirements, researchers (Seerley et al. 2006) at the University of Georgia Carl Vinson Institute of Government have identified the following seven guiding principals for instream flow protection:
1) Preserving whole functioning ecosystems rather than focusing on a single species. 2) Mimicking, to the greatest extent possible, the natural flow regime, including
seasonal and inter-annual variability. 3) Expanding the spatial scope of instream flow studies beyond the river channel to
include the riparian corridor and floodplain systems. 4) Conducting studies using an interdisciplinary approach. 5) Using reconnaissance information to guide choices from among a variety of tools
and approaches for technical evaluations in particular river systems. 6) Practicing adaptive management, an approach for recommending adjustments to
operational plans in the event that objectives are not achieved. 7) Involving stakeholders in the process.
The District's approach for minimum flows development incorporates the five elements listed by Beecher (1990). Impacts on the water resources or ecology are evaluated based on an identified subset of potential habitats or resources of interest. The approach outlined in this report identifies specific resources of interest and identifies, when it is important seasonally to consider these resources. Fundamental to the District's approach for development of minimum flows and levels is incorporation of: a) corrections and adjustments to flow due to anthropogenic activities, b) consideration of climatic variations in flow, and c) realization that a flow regime adequate to protect the ecology of the river system under varying climatic conditions is necessary. The initial step in this process requires an understanding of historic and current flow conditions to determine if current flows reflect past conditions. If this is the case, the development of minimum flows and levels becomes a question of what can be allowed in terms of withdrawals before significant harm occurs. On the other hand, if there have been changes to the flow regime of a river, these must be assessed to determine if the changes are natural climate changes, human-induced or a combination of both. Human impacts are quantified to the extent possible, and the flow record adjusted to arrive at a 'naturalized' flow. The District has adopted an approach for establishing benchmark flow periods that involves consideration of the effects of multidecadal climatic oscillations on river flow patterns. The approach, which led to identification of separate benchmark periods for flow records collected prior to and after 1970, was used for development of MFLs for the freshwater segment of the Alafia River, middle Peace River, and the Myakka River (Kelly et al. 2005a, Kelly et al. 2005b, Kelly et al. 2005c). This determination was made for the Anclote River based on the Anclote River near Elfers gauge that has a period of record dating back to 1955. The upper freshwater portion of the Anclote was evaluated using the most conservative multidecadal period for the given metric. For example, minimum depth of water for fish passage was evaluated using the drier cycle with the understanding that if the MFL is protective of fish passage during a dry cycle, there would be adequate flow during a wetter
D:\Anclote\Report\Final\Anclote_MFL_Final.doc Last Save : 02/22/10 11:02
____________________________________________________________________________________________________ Proposed Minimum Flows and Levels for Anclote River System Purpose and Background of MFL Page 8 of 207
cycle. The estuarine resources are evaluated using naturalized flows and seasons, but not multidecadal periods. Following assessment of historic and current flow regimes and the factors that have affected their development, the District develops protection standard statistics or criteria for preventing significant harm to the water resource. For the upper segment of the Peace River, criteria associated with fish passage in the river channel and maximization of the wetted perimeter were used to recommend a minimum low flow (SWFWMD 2002a). Criteria associated with medium and higher flows that result in the inundation of woody habitats associated with the river channel and vegetative communities on the floodplain were described. These criteria were not, however, used to develop recommended levels, due to an inability to separate water withdrawal impacts on river flow from those associated with structural alterations within the watershed. For the freshwater Braden River, middle segment of the Peace River, Alafia River, and the upper segment of the Myakka River, the District has used fish passage, wetted perimeter and other criteria to protect low flows and applied approaches associated with development of medium to high flow criteria per recommendations contained in the peer review of the proposed upper Peace River minimum flows (Gore et al. 2002). These efforts have included collection and analyses of in-stream fish and macroinvertebrate habitat data within the Anclote River using PHABSIM, and evaluation of inundation characteristics of floodplain habitats. The District's approach to setting MFL's on freshwater streams was recently and extensively reviewed by the Instream Flow Council (2009). The approach to protection of the downstream resources varies by location and resource. For example, fish and invertebrate resources (expressed as abundance) are evaluated as direct response(s) to changing flows whereas the benthic community is indirectly evaluated as a change in the volume or area of the estuary that is at, or below an ecologically important salinity. At the other end of the spectrum and for systems which provide a thermal refuge for the marine manatee, the volume (and area) of winter habitat that remains above a critical temperature (e.g. 20o C) is used as the metric which reflects protection of the resource.
1.5.2 A Building Block Approach The peer-review report on proposed MFLs for the upper segment of the Peace River (Gore et al. 2002) identified a "building block" approach as "a way to more closely mirror original hydrologic and hydroperiodic conditions in the basin". Development of regulatory flow requirements using this type of approach typically involves description of the natural flow regime, identification of building blocks associated with flow needs for ecosystem specific functions, biological assemblages or populations, and assembly of the blocks to form a flow prescription (Postel and Richter 2003). As noted by the panelists comprising the Upper Peace River MFLs review panel, "assumptions behind building block techniques are based upon simple ecological theory; that organisms and communities occupying that river have evolved and adapted their life cycles to flow conditions over a long period of pre-development history (Stanford et al. 1996). Thus with limited biological knowledge of flow requirements, the best alternative is to recreate the hydrographic conditions under which communities have existed prior to disturbance of the flow regime." Although in most cases, the District does not expect to recreate pre-disturbance hydrographic conditions through MFLs development and implementation, the building block approach is viewed as a reasonable means for ensuring the maintenance of similar, although dampened, natural hydrographic conditions.
D:\Anclote\Report\Final\Anclote_MFL_Final.doc Last Save : 02/22/10 11:02
____________________________________________________________________________________________________ Proposed Minimum Flows and Levels for Anclote River System Purpose and Background of MFL Page 9 of 207
For development of minimum flows and levels for the upper, freshwater segment of the Anclote River, the District has explicitly identified three building. The blocks correspond to seasonal periods of low, medium and high flows. The three distinct flow periods are evident in hydrographs of observed and naturalized (See Section 2.5 for discussion of adjustment) median daily flows for the river (Figure 1-2). Lowest flows occur during Block 1, a 101-day period that extends from April 12 through July 21 (Non-leap year day of year 101 through 201.). Highest flows occur during Block 3 (July 22 through October 14) the 85-day period (day of year 202 though 286) that immediately follows the dry season. This is the period when the floodplain is most likely to be inundated on an annual basis; although high flows can occur in early to mid-March. The remaining 179 days constitute an intermediate or medium flow period, which is referred to as Block 2.
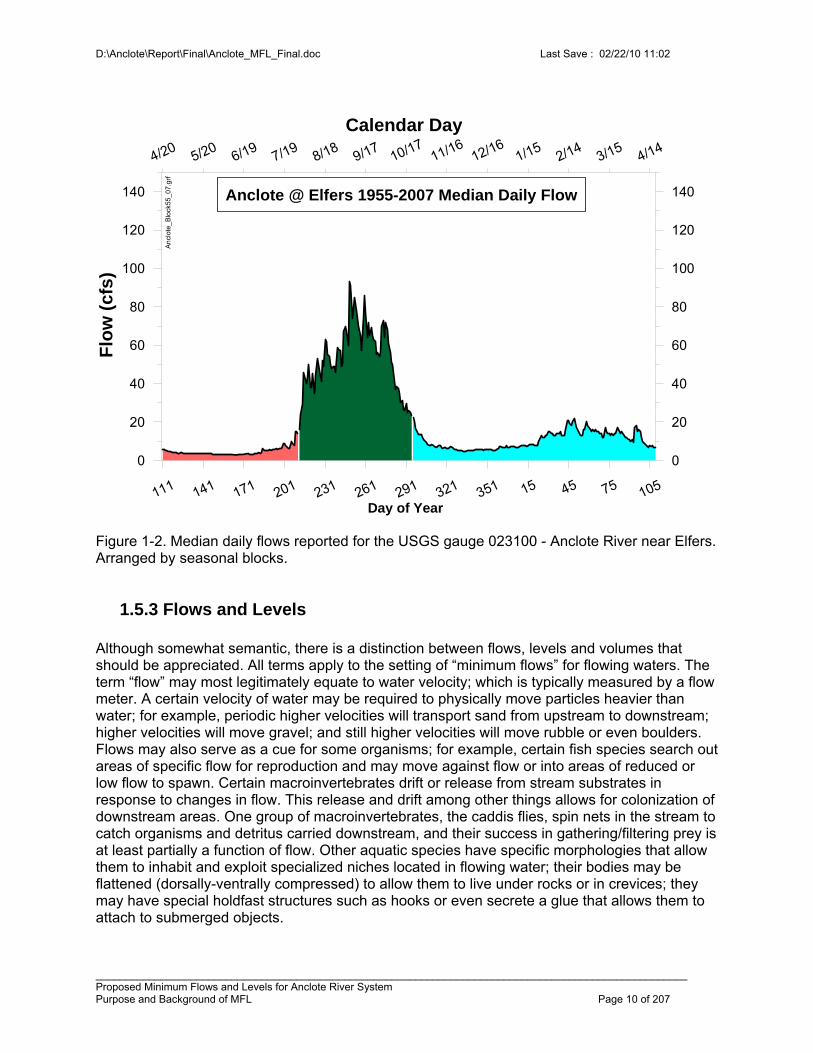
D:\Anclote\Report\Final\Anclote_MFL_Final.doc Last Save : 02/22/10 11:02
____________________________________________________________________________________________________ Proposed Minimum Flows and Levels for Anclote River System Purpose and Background of MFL Page 10 of 207
Figure 1-2. Median daily flows reported for the USGS gauge 023100 - Anclote River near Elfers. Arranged by seasonal blocks.
1.5.3 Flows and Levels Although somewhat semantic, there is a distinction between flows, levels and volumes that should be appreciated. All terms apply to the setting of “minimum flows” for flowing waters. The term “flow” may most legitimately equate to water velocity; which is typically measured by a flow meter. A certain velocity of water may be required to physically move particles heavier than water; for example, periodic higher velocities will transport sand from upstream to downstream; higher velocities will move gravel; and still higher velocities will move rubble or even boulders. Flows may also serve as a cue for some organisms; for example, certain fish species search out areas of specific flow for reproduction and may move against flow or into areas of reduced or low flow to spawn. Certain macroinvertebrates drift or release from stream substrates in response to changes in flow. This release and drift among other things allows for colonization of downstream areas. One group of macroinvertebrates, the caddis flies, spin nets in the stream to catch organisms and detritus carried downstream, and their success in gathering/filtering prey is at least partially a function of flow. Other aquatic species have specific morphologies that allow them to inhabit and exploit specialized niches located in flowing water; their bodies may be flattened (dorsally-ventrally compressed) to allow them to live under rocks or in crevices; they may have special holdfast structures such as hooks or even secrete a glue that allows them to attach to submerged objects.
111 141 171 201 231 261 291 321 351 15 45 75 105
Day of Year
0
20
40
60
80
100
120
140
Flo
w (
cfs
)
4/205/20
6/197/19
8/189/17
10/1711/16
12/161/15
2/143/15
4/14
Calendar Day
0
20
40
60
80
100
120
140
.
An
clot
e_B
lock
55_0
7.gr
f
Anclote @ Elfers 1955-2007 Median Daily Flow
D:\Anclote\Report\Final\Anclote_MFL_Final.doc Last Save : 02/22/10 11:02
____________________________________________________________________________________________________ Proposed Minimum Flows and Levels for Anclote River System Purpose and Background of MFL Page 11 of 207
Discharge, on the other hand, refers to the volume of water moving past a point per unit time, and depending on the size of the stream (cross sectional area), similar volumes of water can be moved with quite large differences in the velocity. The volume of water moved through a stream can be particularly important to an estuary. It is the volume of freshwater that mixes with salt water that determines, to a large extent, what the salinity in a fixed area of an estuary will be. This is especially important for organisms that require a certain range of salinity. The volumes of fresh and marine water determine salinity, not the flow rate per se; therefore, volume rather than flow is the important variable to these biota. For the purpose of developing and evaluating minimum flows, the District identifies discharge in cubic feet per second for field-sampling sites and specific stream flow gauging stations. In some cases, the water level or the elevation of the water above a certain point is the critical issue to dependent biota. For example, the wetland fringing a stream channel is dependent on a certain hydroperiod or seasonal pattern of inundation. On average, the associated wetland requires a certain level and frequency of inundation. Water level and the duration that it is maintained will determine to a large degree the types of vegetation that can occur in an area. Flow and volume are not the critical criteria that need to be met, but rather elevation or level. There is a distinction between volumes, levels and velocities that should be appreciated. Although levels can be related to flows and volumes in a given stream (stream gauging, in fact, depends on the relationship between stream stage or level and discharge), the relationship varies between streams and as one progresses from upstream to downstream in the same system. Because relationships can be empirically determined between levels, flows and volumes, it is possible to speak in terms of, for example, minimum flows for a particular site (discharge in cubic feet per second); however, one needs to appreciate that individual species and many physical features may be most dependent on a given flow, level or volume or some combination of three for their continued survival or occurrence. The resultant ecosystem is dependent on all three.
1.6 Content of Remaining Chapters In this chapter, we have summarized the requirements and rationale for developing minimum flows and levels in general and introduced the need for protection of the flow regime rather than protection of a single minimum flow. For the remainder of this document, the Upper (or freshwater portion) Anclote River, is defined as the river corridor upstream of the USGS Anclote River near Elfers gauge site (located near Little Road) continuing several miles upstream of Starkey Boulevard. The remainder of this document considers the development of minimum flows and levels specific to the estuarine Anclote River, which is defined as the river reach from the Gulf of Mexico to a location approximately 19 kilometers upstream. Chapters 2 through 5 are intended to be largely descriptive of the system. Not all of the material presented in these chapters is used in setting the MFL, but it is important to characterize the nature of the system under investigation. For example, the District has no authority over land-use and thus cannot reasonably manage this watershed characteristic as an MFL issue, but it is important to understand that highly urbanized systems have different runoff patterns and generally offer less habitat than relatively pristine systems but both characteristics may have a bearing on the outcome of the MFL.
D:\Anclote\Report\Final\Anclote_MFL_Final.doc Last Save : 02/22/10 11:02
____________________________________________________________________________________________________ Proposed Minimum Flows and Levels for Anclote River System Purpose and Background of MFL Page 12 of 207
In Chapter 2, we provide a short description of the entire river basin and springshed; the hydrogeologic setting, and consider historical and current river flows and the factors that have influenced the flow regimes. Seasonal blocks corresponding to low, medium and high flows are identified. In Chapter 3 the focus changes to a description of the estuarine characteristics. Chapter 4 is devoted to water quality with a focus on salinity and the relationships with flow. Biological resources are described in Chapter 5 along with quantifiable relationships to flow that have been developed for the MFL evaluation. Goals and specific MFL resource criteria are defined in Chapter 6 while Chapter 7 is devoted to application of evaluation tools to determine what minimum flow(s) achieve the criteria established in the prior chapter. Finally, Chapter 8 provides a definition of the Anclote River MFL. Chapters 9 and 10 contain literature cited and appendices respectively for the prior chapters. With the exceptions noted, the British system of measurement units has been utilized in this report. This will promote consistency with other SWFWMD reports and Governor Crist's Plain Language Initiative2 that promotes a writing style easily understood by the public. The two exceptions to the British system are river distance (expressed in kilometer) and sample depth (expressed in meters) both of which are followed by the more commonly used British metric in parenthesis. A table of common conversions is provided following the Table of Contents. One final comment regarding establishment of the MFL is the issue of hydrologic alterations. It is both a practical, and a statutory requirement (373.0421, FS) that the establishment of an MFL shall consider changes and structural alterations. Examples within the District include in-stream impoundments such as exist on the Hillsborough, Manatee, Braden, Withlacoochee Rivers, Shell Creek, Tampa Bypass Canal (TBC) and Cow Pen Slough (CPS). Some exist for flood control or navigation (Withlacoochee, TBC and CPS), but most have been constructed as potable surface water supplies. The District's policy has been to evaluate free-flowing, un-impounded rivers and estuaries in a 'top-down' manner by attempting to re-create a baseline historical flow as free of anthropogenic impacts as possible and referred to as a 'naturalized' flow. This flow becomes the reference from which 'significant harm' is evaluated. In contrast, systems severely, and irreversibly impacted by hydrologic control structures are evaluated in a 'bottom up' manner. For these systems, the current conditions generally become the starting point for evaluating improvements to minimum system flows and incrementally larger flows are evaluated in order to determine the maximum benefit ratio. In the case of the Anclote River there are no significant structural alterations to the system, and a 'top down' approach was utilized.
2 State initiative can be found at http://www.flgov.com/pl_home
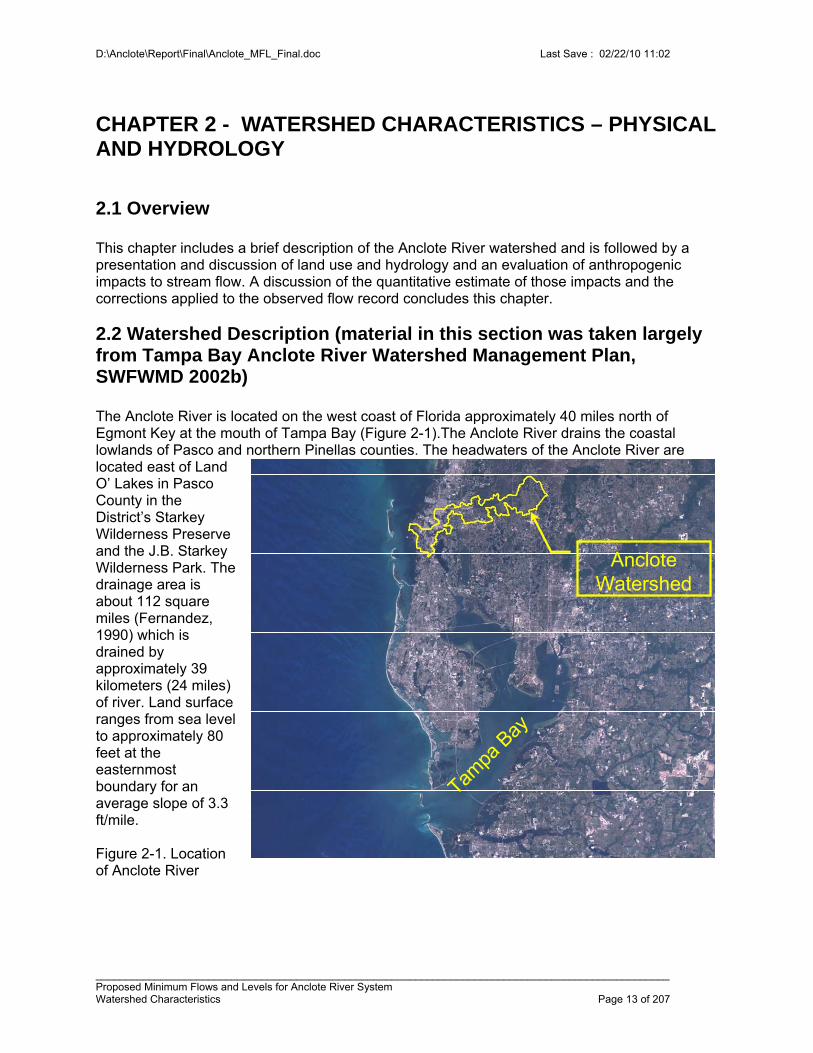
D:\Anclote\Report\Final\Anclote_MFL_Final.doc Last Save : 02/22/10 11:02
_________________________________________________________________________________________________ Proposed Minimum Flows and Levels for Anclote River System Watershed Characteristics Page 13 of 207
CHAPTER 2 - WATERSHED CHARACTERISTICS – PHYSICAL AND HYDROLOGY
2.1 Overview This chapter includes a brief description of the Anclote River watershed and is followed by a presentation and discussion of land use and hydrology and an evaluation of anthropogenic impacts to stream flow. A discussion of the quantitative estimate of those impacts and the corrections applied to the observed flow record concludes this chapter.
2.2 Watershed Description (material in this section was taken largely from Tampa Bay Anclote River Watershed Management Plan, SWFWMD 2002b) The Anclote River is located on the west coast of Florida approximately 40 miles north of Egmont Key at the mouth of Tampa Bay (Figure 2-1).The Anclote River drains the coastal lowlands of Pasco and northern Pinellas counties. The headwaters of the Anclote River are located east of Land O’ Lakes in Pasco County in the District’s Starkey Wilderness Preserve and the J.B. Starkey Wilderness Park. The drainage area is about 112 square miles (Fernandez, 1990) which is drained by approximately 39 kilometers (24 miles) of river. Land surface ranges from sea level to approximately 80 feet at the easternmost boundary for an average slope of 3.3 ft/mile. Figure 2-1. Location of Anclote River
Anclote Watershed
Tampa
Bay
Anclote Watershed
Tampa
Bay
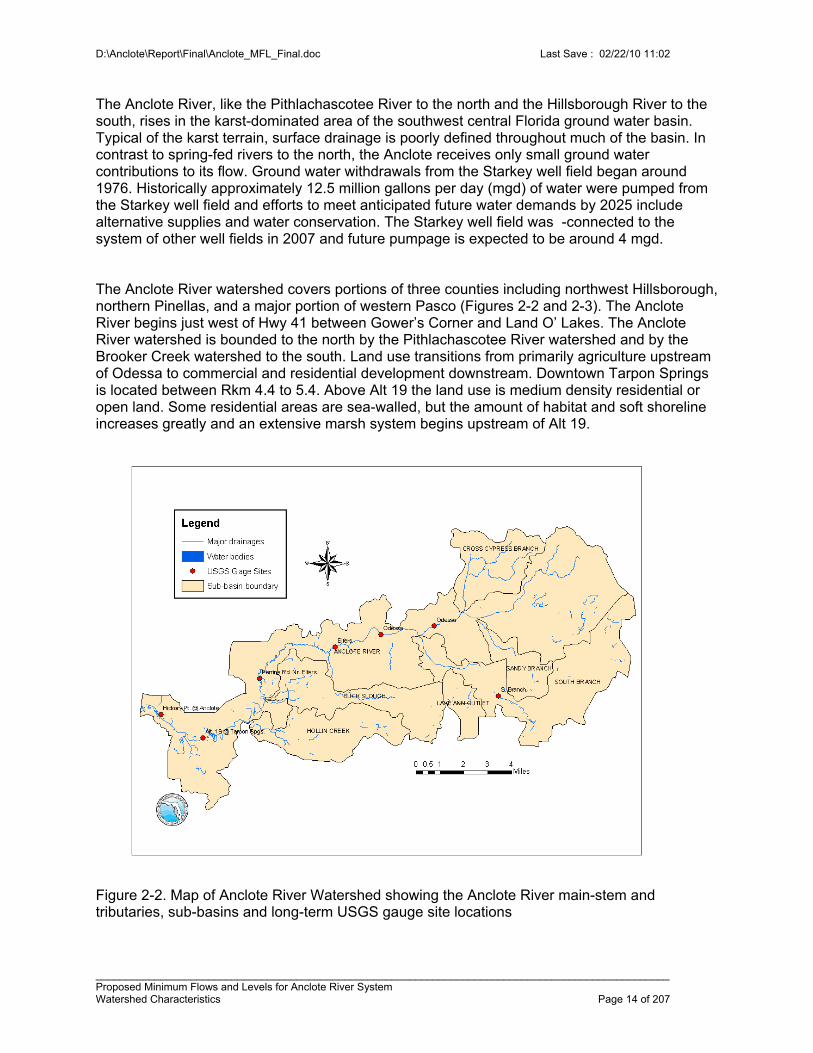
D:\Anclote\Report\Final\Anclote_MFL_Final.doc Last Save : 02/22/10 11:02
_________________________________________________________________________________________________ Proposed Minimum Flows and Levels for Anclote River System Watershed Characteristics Page 14 of 207
The Anclote River, like the Pithlachascotee River to the north and the Hillsborough River to the south, rises in the karst-dominated area of the southwest central Florida ground water basin. Typical of the karst terrain, surface drainage is poorly defined throughout much of the basin. In contrast to spring-fed rivers to the north, the Anclote receives only small ground water contributions to its flow. Ground water withdrawals from the Starkey well field began around 1976. Historically approximately 12.5 million gallons per day (mgd) of water were pumped from the Starkey well field and efforts to meet anticipated future water demands by 2025 include alternative supplies and water conservation. The Starkey well field was -connected to the system of other well fields in 2007 and future pumpage is expected to be around 4 mgd. The Anclote River watershed covers portions of three counties including northwest Hillsborough, northern Pinellas, and a major portion of western Pasco (Figures 2-2 and 2-3). The Anclote River begins just west of Hwy 41 between Gower’s Corner and Land O’ Lakes. The Anclote River watershed is bounded to the north by the Pithlachascotee River watershed and by the Brooker Creek watershed to the south. Land use transitions from primarily agriculture upstream of Odessa to commercial and residential development downstream. Downtown Tarpon Springs is located between Rkm 4.4 to 5.4. Above Alt 19 the land use is medium density residential or open land. Some residential areas are sea-walled, but the amount of habitat and soft shoreline increases greatly and an extensive marsh system begins upstream of Alt 19.
Figure 2-2. Map of Anclote River Watershed showing the Anclote River main-stem and tributaries, sub-basins and long-term USGS gauge site locations
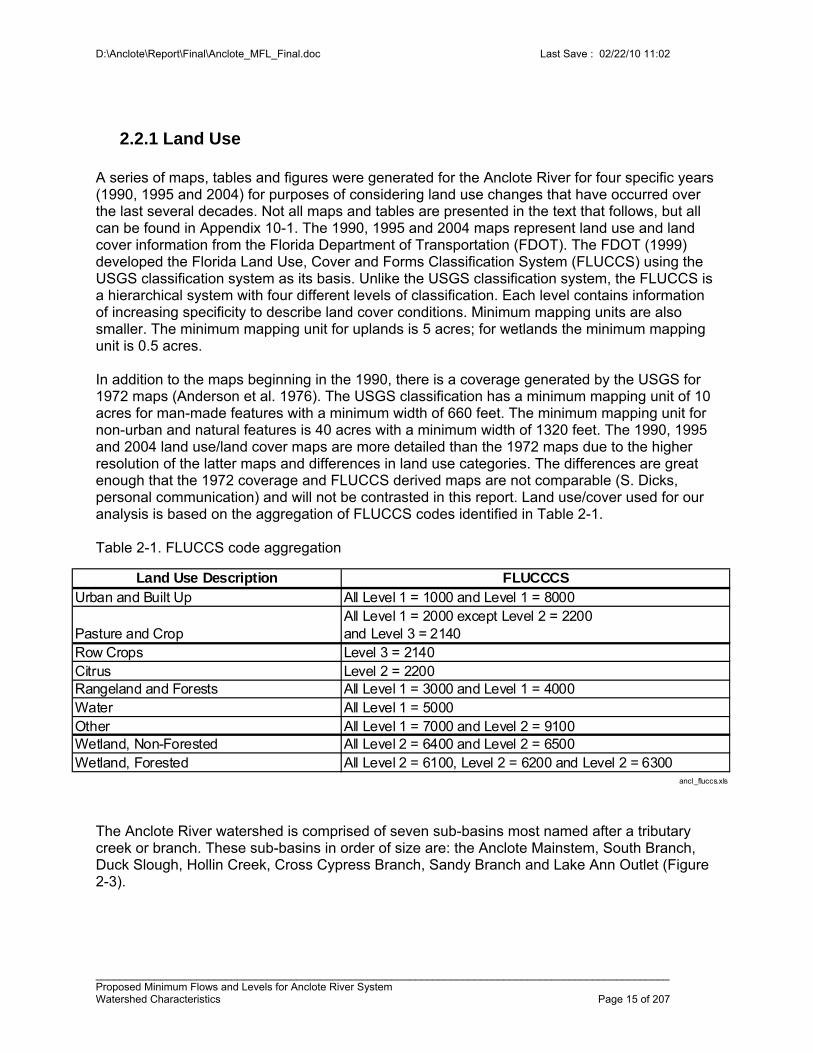
D:\Anclote\Report\Final\Anclote_MFL_Final.doc Last Save : 02/22/10 11:02
_________________________________________________________________________________________________ Proposed Minimum Flows and Levels for Anclote River System Watershed Characteristics Page 15 of 207
2.2.1 Land Use A series of maps, tables and figures were generated for the Anclote River for four specific years (1990, 1995 and 2004) for purposes of considering land use changes that have occurred over the last several decades. Not all maps and tables are presented in the text that follows, but all can be found in Appendix 10-1. The 1990, 1995 and 2004 maps represent land use and land cover information from the Florida Department of Transportation (FDOT). The FDOT (1999) developed the Florida Land Use, Cover and Forms Classification System (FLUCCS) using the USGS classification system as its basis. Unlike the USGS classification system, the FLUCCS is a hierarchical system with four different levels of classification. Each level contains information of increasing specificity to describe land cover conditions. Minimum mapping units are also smaller. The minimum mapping unit for uplands is 5 acres; for wetlands the minimum mapping unit is 0.5 acres. In addition to the maps beginning in the 1990, there is a coverage generated by the USGS for 1972 maps (Anderson et al. 1976). The USGS classification has a minimum mapping unit of 10 acres for man-made features with a minimum width of 660 feet. The minimum mapping unit for non-urban and natural features is 40 acres with a minimum width of 1320 feet. The 1990, 1995 and 2004 land use/land cover maps are more detailed than the 1972 maps due to the higher resolution of the latter maps and differences in land use categories. The differences are great enough that the 1972 coverage and FLUCCS derived maps are not comparable (S. Dicks, personal communication) and will not be contrasted in this report. Land use/cover used for our analysis is based on the aggregation of FLUCCS codes identified in Table 2-1. Table 2-1. FLUCCS code aggregation
The Anclote River watershed is comprised of seven sub-basins most named after a tributary creek or branch. These sub-basins in order of size are: the Anclote Mainstem, South Branch, Duck Slough, Hollin Creek, Cross Cypress Branch, Sandy Branch and Lake Ann Outlet (Figure 2-3).
Land Use Description FLUCCCSUrban and Built Up All Level 1 = 1000 and Level 1 = 8000
Pasture and CropAll Level 1 = 2000 except Level 2 = 2200 and Level 3 = 2140
Row Crops Level 3 = 2140Citrus Level 2 = 2200Rangeland and Forests All Level 1 = 3000 and Level 1 = 4000Water All Level 1 = 5000Other All Level 1 = 7000 and Level 2 = 9100Wetland, Non-Forested All Level 2 = 6400 and Level 2 = 6500Wetland, Forested All Level 2 = 6100, Level 2 = 6200 and Level 2 = 6300
ancl_fluccs.xls
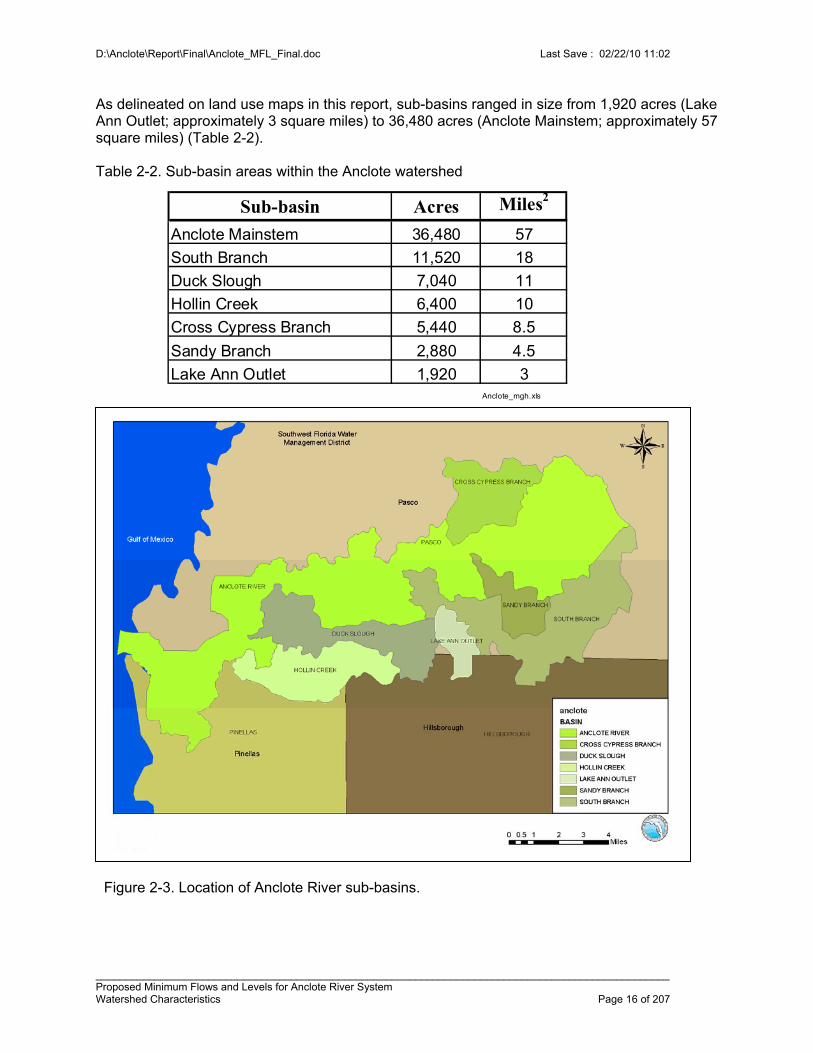
D:\Anclote\Report\Final\Anclote_MFL_Final.doc Last Save : 02/22/10 11:02
_________________________________________________________________________________________________ Proposed Minimum Flows and Levels for Anclote River System Watershed Characteristics Page 16 of 207
As delineated on land use maps in this report, sub-basins ranged in size from 1,920 acres (Lake Ann Outlet; approximately 3 square miles) to 36,480 acres (Anclote Mainstem; approximately 57 square miles) (Table 2-2). Table 2-2. Sub-basin areas within the Anclote watershed
Figure 2-3. Location of Anclote River sub-basins.
Sub-basin Acres Miles2
Anclote Mainstem 36,480 57
South Branch 11,520 18
Duck Slough 7,040 11
Hollin Creek 6,400 10
Cross Cypress Branch 5,440 8.5
Sandy Branch 2,880 4.5
Lake Ann Outlet 1,920 3Anclote_mgh.xls
D:\Anclote\Report\Final\Anclote_MFL_Final.doc Last Save : 02/22/10 11:02
_________________________________________________________________________________________________ Proposed Minimum Flows and Levels for Anclote River System Watershed Characteristics Page 17 of 207
Before discussing individual sub-basin land use changes, it is informative to discuss the entire watershed of the Anclote River to get an appreciation of the major land uses/covers and the changes that have occurred during the time for which land use maps are available. Land use/cover maps for 1990, 1995 and 2004 are shown in Figures 2-4 and 2-5. The land use history for the Anclote watershed and the individual sub-basins is given in Table 2-3. The Anclote River watershed is approximately 112 square miles or 71,680 acres. From inspection of percentage changes as shown in Table 2-3, several land use/cover changes are readily apparent. There has been a steady increase in urban land use, averaging approximately 0.6 percent per year. As of 2004, nearly 30% of the watershed was urbanized. Most of the urbanization occurred in the lower river watershed as the result of conversion of pasture / agricultural land and rangeland.
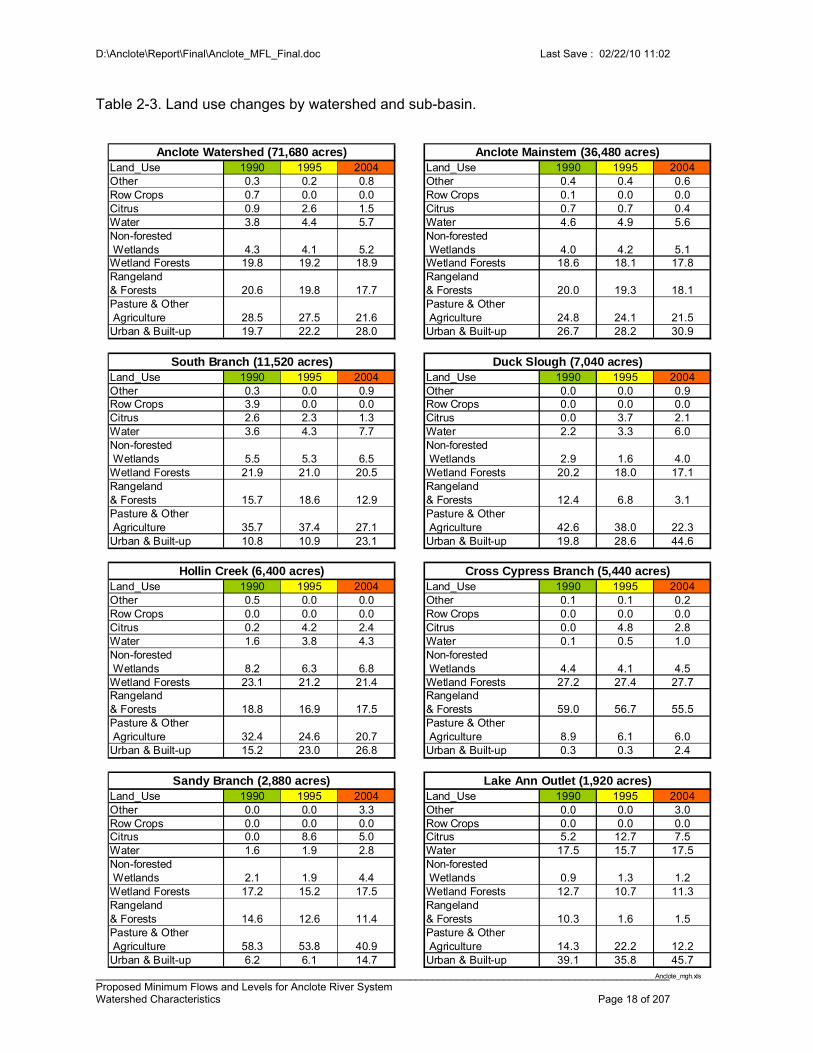
D:\Anclote\Report\Final\Anclote_MFL_Final.doc Last Save : 02/22/10 11:02
_________________________________________________________________________________________________ Proposed Minimum Flows and Levels for Anclote River System Watershed Characteristics Page 18 of 207
Table 2-3. Land use changes by watershed and sub-basin.
Land_Use 1990 1995 2004 Land_Use 1990 1995 2004Other 0.3 0.2 0.8 Other 0.4 0.4 0.6Row Crops 0.7 0.0 0.0 Row Crops 0.1 0.0 0.0Citrus 0.9 2.6 1.5 Citrus 0.7 0.7 0.4Water 3.8 4.4 5.7 Water 4.6 4.9 5.6Non-forested Wetlands 4.3 4.1 5.2
Non-forestedWetlands 4.0 4.2 5.1
Wetland Forests 19.8 19.2 18.9 Wetland Forests 18.6 18.1 17.8Rangeland & Forests 20.6 19.8 17.7
Rangeland & Forests 20.0 19.3 18.1
Pasture & Other Agriculture 28.5 27.5 21.6
Pasture & Other Agriculture 24.8 24.1 21.5
Urban & Built-up 19.7 22.2 28.0 Urban & Built-up 26.7 28.2 30.9
Land_Use 1990 1995 2004 Land_Use 1990 1995 2004Other 0.3 0.0 0.9 Other 0.0 0.0 0.9Row Crops 3.9 0.0 0.0 Row Crops 0.0 0.0 0.0Citrus 2.6 2.3 1.3 Citrus 0.0 3.7 2.1Water 3.6 4.3 7.7 Water 2.2 3.3 6.0Non-forested Wetlands 5.5 5.3 6.5
Non-forested Wetlands 2.9 1.6 4.0
Wetland Forests 21.9 21.0 20.5 Wetland Forests 20.2 18.0 17.1Rangeland & Forests 15.7 18.6 12.9
Rangeland & Forests 12.4 6.8 3.1
Pasture & Other Agriculture 35.7 37.4 27.1
Pasture & OtherAgriculture 42.6 38.0 22.3
Urban & Built-up 10.8 10.9 23.1 Urban & Built-up 19.8 28.6 44.6
Land_Use 1990 1995 2004 Land_Use 1990 1995 2004Other 0.5 0.0 0.0 Other 0.1 0.1 0.2Row Crops 0.0 0.0 0.0 Row Crops 0.0 0.0 0.0Citrus 0.2 4.2 2.4 Citrus 0.0 4.8 2.8Water 1.6 3.8 4.3 Water 0.1 0.5 1.0Non-forested Wetlands 8.2 6.3 6.8
Non-forestedWetlands 4.4 4.1 4.5
Wetland Forests 23.1 21.2 21.4 Wetland Forests 27.2 27.4 27.7Rangeland & Forests 18.8 16.9 17.5
Rangeland & Forests 59.0 56.7 55.5
Pasture & Other Agriculture 32.4 24.6 20.7
Pasture & Other Agriculture 8.9 6.1 6.0
Urban & Built-up 15.2 23.0 26.8 Urban & Built-up 0.3 0.3 2.4
Land_Use 1990 1995 2004 Land_Use 1990 1995 2004Other 0.0 0.0 3.3 Other 0.0 0.0 3.0Row Crops 0.0 0.0 0.0 Row Crops 0.0 0.0 0.0Citrus 0.0 8.6 5.0 Citrus 5.2 12.7 7.5Water 1.6 1.9 2.8 Water 17.5 15.7 17.5Non-forested Wetlands 2.1 1.9 4.4
Non-forested Wetlands 0.9 1.3 1.2
Wetland Forests 17.2 15.2 17.5 Wetland Forests 12.7 10.7 11.3Rangeland & Forests 14.6 12.6 11.4
Rangeland & Forests 10.3 1.6 1.5
Pasture & Other Agriculture 58.3 53.8 40.9
Pasture & Other Agriculture 14.3 22.2 12.2
Urban & Built-up 6.2 6.1 14.7 Urban & Built-up 39.1 35.8 45.7Anclote_mgh.xls
Hollin Creek (6,400 acres) Cross Cypress Branch (5,440 acres)
Lake Ann Outlet (1,920 acres)Sandy Branch (2,880 acres)
Anclote Mainstem (36,480 acres)Anclote Watershed (71,680 acres)
South Branch (11,520 acres) Duck Slough (7,040 acres)
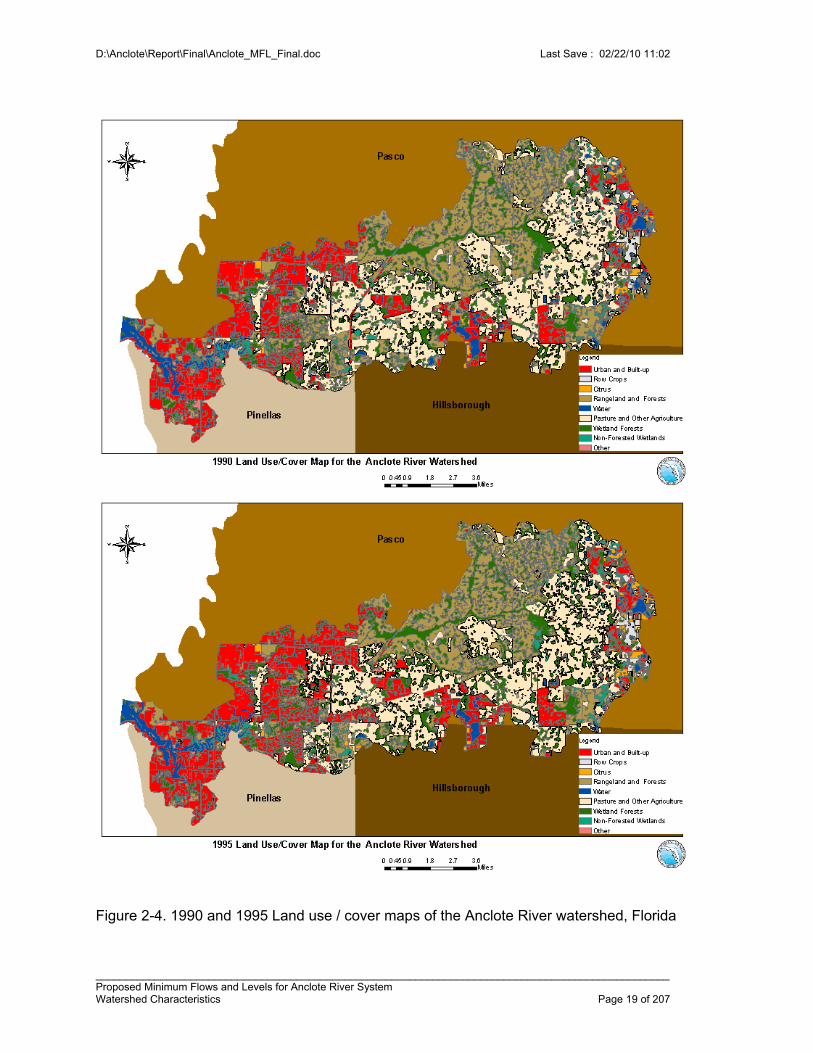
D:\Anclote\Report\Final\Anclote_MFL_Final.doc Last Save : 02/22/10 11:02
_________________________________________________________________________________________________ Proposed Minimum Flows and Levels for Anclote River System Watershed Characteristics Page 19 of 207
Figure 2-4. 1990 and 1995 Land use / cover maps of the Anclote River watershed, Florida
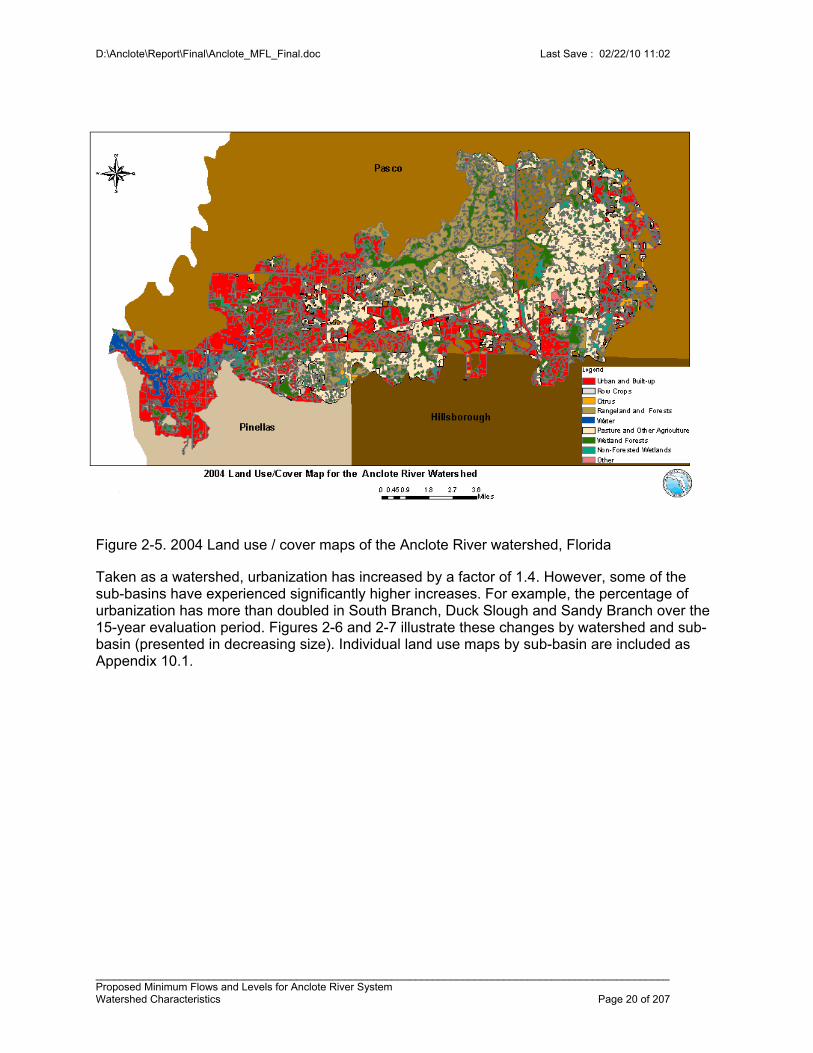
D:\Anclote\Report\Final\Anclote_MFL_Final.doc Last Save : 02/22/10 11:02
_________________________________________________________________________________________________ Proposed Minimum Flows and Levels for Anclote River System Watershed Characteristics Page 20 of 207
Figure 2-5. 2004 Land use / cover maps of the Anclote River watershed, Florida Taken as a watershed, urbanization has increased by a factor of 1.4. However, some of the sub-basins have experienced significantly higher increases. For example, the percentage of urbanization has more than doubled in South Branch, Duck Slough and Sandy Branch over the 15-year evaluation period. Figures 2-6 and 2-7 illustrate these changes by watershed and sub-basin (presented in decreasing size). Individual land use maps by sub-basin are included as Appendix 10.1.
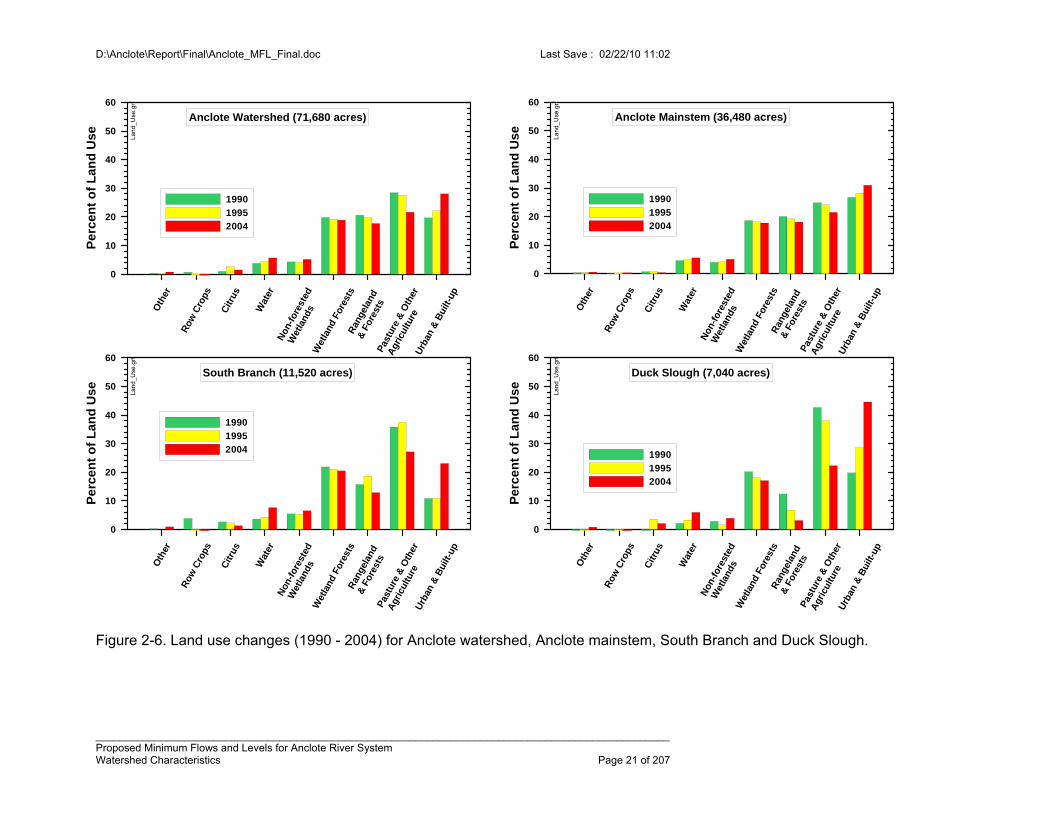
D:\Anclote\Report\Final\Anclote_MFL_Final.doc Last Save : 02/22/10 11:02
_________________________________________________________________________________________________ Proposed Minimum Flows and Levels for Anclote River System Watershed Characteristics Page 21 of 207
Figure 2-6. Land use changes (1990 - 2004) for Anclote watershed, Anclote mainstem, South Branch and Duck Slough.
Citr
us
Non
-for
este
d
Wet
land
sOth
er
Pas
ture
& O
ther
Agr
icul
ture
Ran
gela
nd
& F
ores
ts
Row
Cro
ps
Urb
an &
Bui
lt-up
Wat
er
Wet
land
For
ests
0
10
20
30
40
50
60P
erc
en
t o
f L
an
d U
se
1990
1995
2004
Anclote Watershed (71,680 acres)La
nd
_Use
.grf
Citr
us
Non
-for
este
d
Wet
land
sOth
er
Pas
ture
& O
ther
Agr
icul
ture
Ran
gela
nd
& F
ores
ts
Row
Cro
ps
Urb
an &
Bui
lt-up
Wat
er
Wet
land
For
ests
0
10
20
30
40
50
60
Pe
rce
nt
of
Lan
d U
se
1990
1995
2004
Anclote Mainstem (36,480 acres)
Land
_Use
.grf
Citr
us
Non
-for
este
d
Wet
land
sOth
er
Pas
ture
& O
ther
Agr
icul
ture
Ran
gela
nd
& F
ores
ts
Row
Cro
ps
Urb
an &
Bui
lt-up
Wat
er
Wet
land
For
ests
0
10
20
30
40
50
60
Pe
rce
nt
of
Lan
d U
se
1990
1995
2004
Duck Slough (7,040 acres)
Land
_Use
.grf
Citr
us
Non
-for
este
d
Wet
land
sOth
er
Pas
ture
& O
ther
Agr
icul
ture
Ran
gela
nd
& F
ores
ts
Row
Cro
ps
Urb
an &
Bui
lt-up
Wat
er
Wet
land
For
ests
0
10
20
30
40
50
60
Pe
rce
nt
of
Lan
d U
se
1990
1995
2004
South Branch (11,520 acres)
Land
_Use
.grf
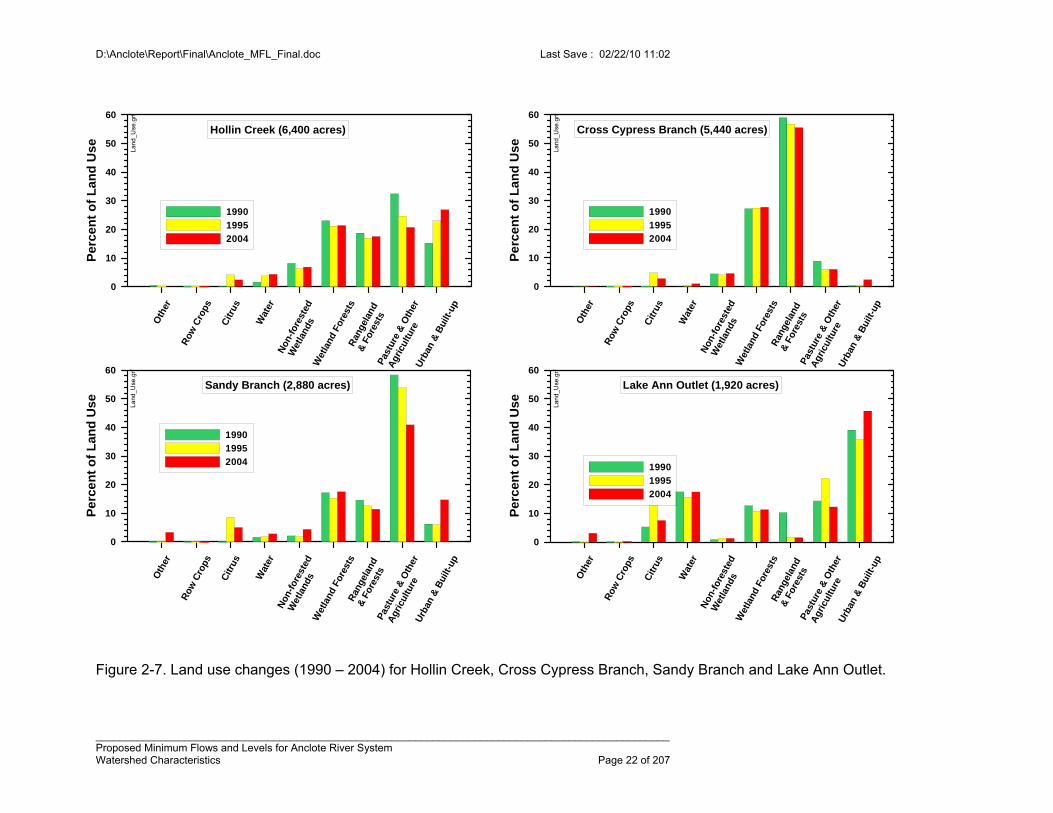
D:\Anclote\Report\Final\Anclote_MFL_Final.doc Last Save : 02/22/10 11:02
_________________________________________________________________________________________________ Proposed Minimum Flows and Levels for Anclote River System Watershed Characteristics Page 22 of 207
Figure 2-7. Land use changes (1990 – 2004) for Hollin Creek, Cross Cypress Branch, Sandy Branch and Lake Ann Outlet.
Citr
us
Non
-for
este
d
Wet
land
sOth
er
Pas
ture
& O
ther
Agr
icul
ture
Ran
gela
nd
& F
ores
ts
Row
Cro
ps
Urb
an &
Bui
lt-up
Wat
er
Wet
land
For
ests
0
10
20
30
40
50
60
Pe
rce
nt
of
Lan
d U
se
1990
1995
2004
Sandy Branch (2,880 acres)
Land
_Use
.grf
Citr
us
Non
-for
este
d
Wet
land
sOth
er
Pas
ture
& O
ther
Agr
icul
ture
Ran
gela
nd
& F
ores
ts
Row
Cro
ps
Urb
an &
Bui
lt-up
Wat
er
Wet
land
For
ests
0
10
20
30
40
50
60
Pe
rce
nt
of
La
nd
Use
1990
1995
2004
Lake Ann Outlet (1,920 acres)
Lan
d_U
se.g
rf
Citr
us
Non
-for
este
d
Wet
land
sOth
er
Pas
ture
& O
ther
Agr
icul
ture
Ran
gela
nd
& F
ores
ts
Row
Cro
ps
Urb
an &
Bui
lt-up
Wat
er
Wet
land
For
ests
0
10
20
30
40
50
60
Pe
rce
nt
of
La
nd
Us
e
1990
1995
2004
Hollin Creek (6,400 acres)L
and
_Use
.grf
Citr
us
Non
-for
este
d
Wet
land
sOth
er
Pas
ture
& O
ther
Agr
icul
ture
Ran
gela
nd
& F
ores
ts
Row
Cro
ps
Urb
an &
Bui
lt-up
Wat
er
Wet
land
For
ests
0
10
20
30
40
50
60
Pe
rce
nt
of
La
nd
Use
1990
1995
2004
Cross Cypress Branch (5,440 acres)
Lan
d_U
se.g
rf
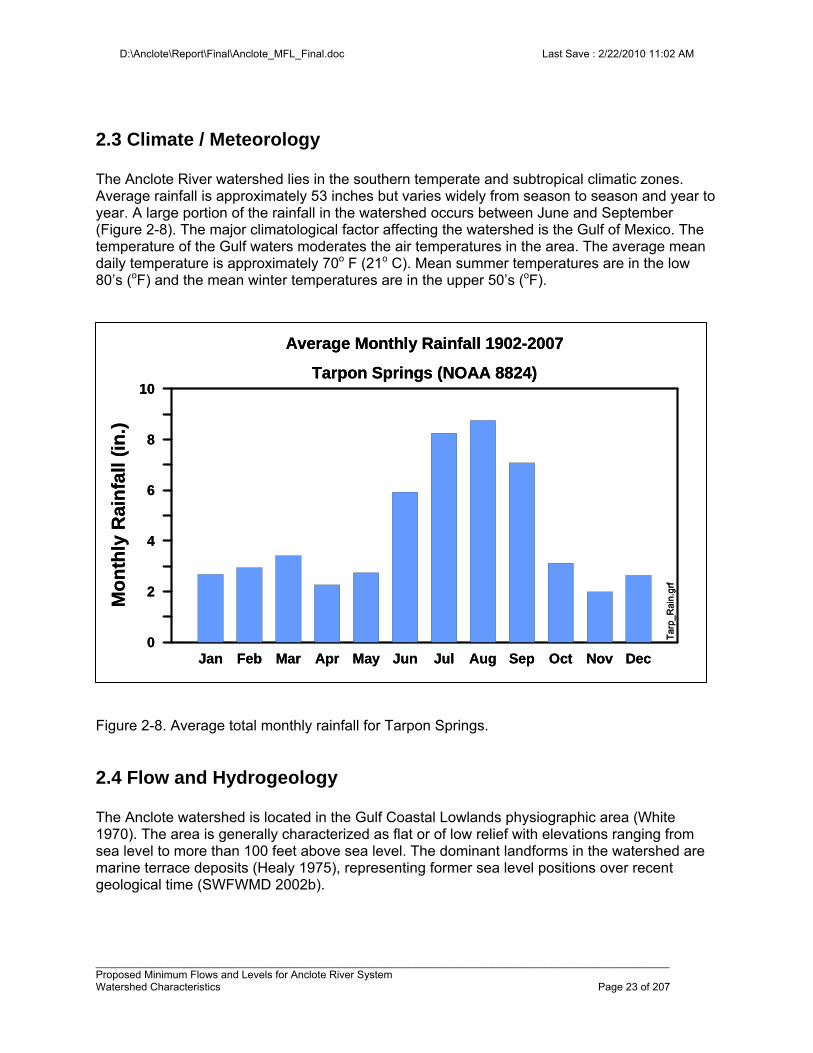
D:\Anclote\Report\Final\Anclote_MFL_Final.doc Last Save : 2/22/2010 11:02 AM
_________________________________________________________________________________________________ Proposed Minimum Flows and Levels for Anclote River System Watershed Characteristics Page 23 of 207
2.3 Climate / Meteorology The Anclote River watershed lies in the southern temperate and subtropical climatic zones. Average rainfall is approximately 53 inches but varies widely from season to season and year to year. A large portion of the rainfall in the watershed occurs between June and September (Figure 2-8). The major climatological factor affecting the watershed is the Gulf of Mexico. The temperature of the Gulf waters moderates the air temperatures in the area. The average mean daily temperature is approximately 70o F (21o C). Mean summer temperatures are in the low 80’s (oF) and the mean winter temperatures are in the upper 50’s (oF).
Figure 2-8. Average total monthly rainfall for Tarpon Springs.
2.4 Flow and Hydrogeology The Anclote watershed is located in the Gulf Coastal Lowlands physiographic area (White 1970). The area is generally characterized as flat or of low relief with elevations ranging from sea level to more than 100 feet above sea level. The dominant landforms in the watershed are marine terrace deposits (Healy 1975), representing former sea level positions over recent geological time (SWFWMD 2002b).
Jan Feb Mar Apr May Jun Jul Aug Sep Oct Nov Dec0
2
4
6
8
10
Mo
nth
ly R
ain
fall
(in
.)
Tar
p_R
ain.
grf
Average Monthly Rainfall 1902-2007
Tarpon Springs (NOAA 8824)
Jan Feb Mar Apr May Jun Jul Aug Sep Oct Nov Dec0
2
4
6
8
10
Mo
nth
ly R
ain
fall
(in
.)
Tar
p_R
ain.
grf
Average Monthly Rainfall 1902-2007
Tarpon Springs (NOAA 8824)
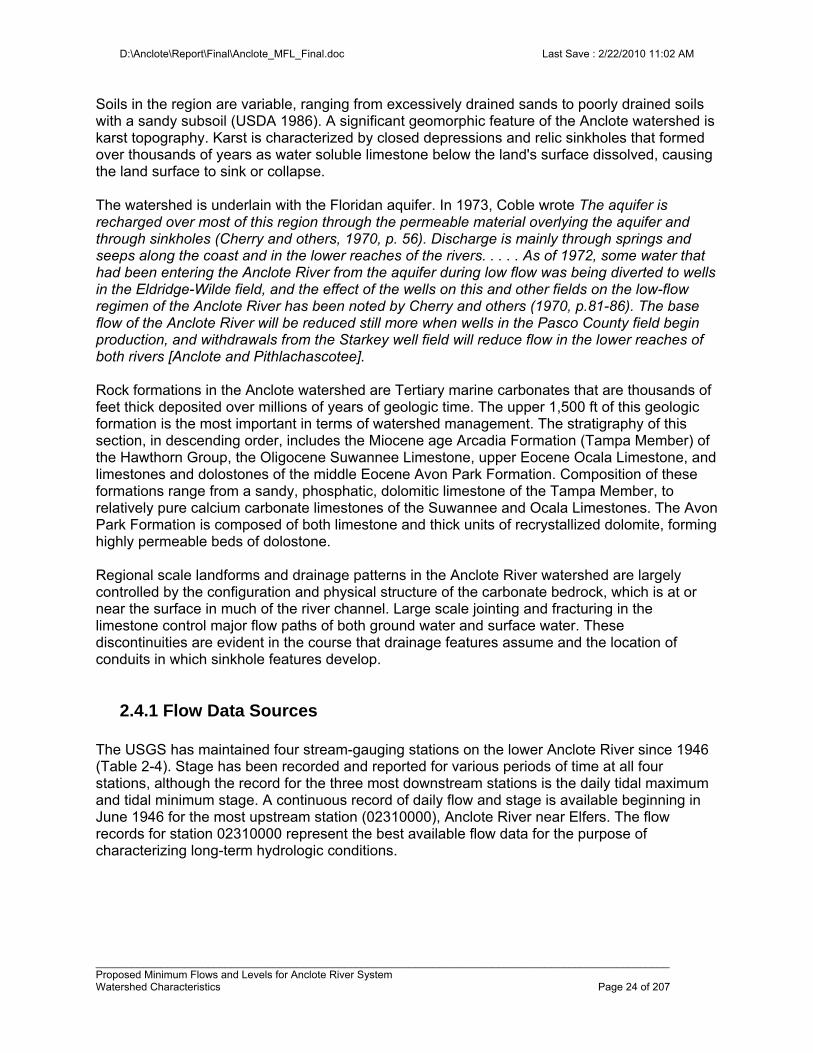
D:\Anclote\Report\Final\Anclote_MFL_Final.doc Last Save : 2/22/2010 11:02 AM
_________________________________________________________________________________________________ Proposed Minimum Flows and Levels for Anclote River System Watershed Characteristics Page 24 of 207
Soils in the region are variable, ranging from excessively drained sands to poorly drained soils with a sandy subsoil (USDA 1986). A significant geomorphic feature of the Anclote watershed is karst topography. Karst is characterized by closed depressions and relic sinkholes that formed over thousands of years as water soluble limestone below the land's surface dissolved, causing the land surface to sink or collapse. The watershed is underlain with the Floridan aquifer. In 1973, Coble wrote The aquifer is recharged over most of this region through the permeable material overlying the aquifer and through sinkholes (Cherry and others, 1970, p. 56). Discharge is mainly through springs and seeps along the coast and in the lower reaches of the rivers. . . . . As of 1972, some water that had been entering the Anclote River from the aquifer during low flow was being diverted to wells in the Eldridge-Wilde field, and the effect of the wells on this and other fields on the low-flow regimen of the Anclote River has been noted by Cherry and others (1970, p.81-86). The base flow of the Anclote River will be reduced still more when wells in the Pasco County field begin production, and withdrawals from the Starkey well field will reduce flow in the lower reaches of both rivers [Anclote and Pithlachascotee]. Rock formations in the Anclote watershed are Tertiary marine carbonates that are thousands of feet thick deposited over millions of years of geologic time. The upper 1,500 ft of this geologic formation is the most important in terms of watershed management. The stratigraphy of this section, in descending order, includes the Miocene age Arcadia Formation (Tampa Member) of the Hawthorn Group, the Oligocene Suwannee Limestone, upper Eocene Ocala Limestone, and limestones and dolostones of the middle Eocene Avon Park Formation. Composition of these formations range from a sandy, phosphatic, dolomitic limestone of the Tampa Member, to relatively pure calcium carbonate limestones of the Suwannee and Ocala Limestones. The Avon Park Formation is composed of both limestone and thick units of recrystallized dolomite, forming highly permeable beds of dolostone. Regional scale landforms and drainage patterns in the Anclote River watershed are largely controlled by the configuration and physical structure of the carbonate bedrock, which is at or near the surface in much of the river channel. Large scale jointing and fracturing in the limestone control major flow paths of both ground water and surface water. These discontinuities are evident in the course that drainage features assume and the location of conduits in which sinkhole features develop.
2.4.1 Flow Data Sources The USGS has maintained four stream-gauging stations on the lower Anclote River since 1946 (Table 2-4). Stage has been recorded and reported for various periods of time at all four stations, although the record for the three most downstream stations is the daily tidal maximum and tidal minimum stage. A continuous record of daily flow and stage is available beginning in June 1946 for the most upstream station (02310000), Anclote River near Elfers. The flow records for station 02310000 represent the best available flow data for the purpose of characterizing long-term hydrologic conditions.
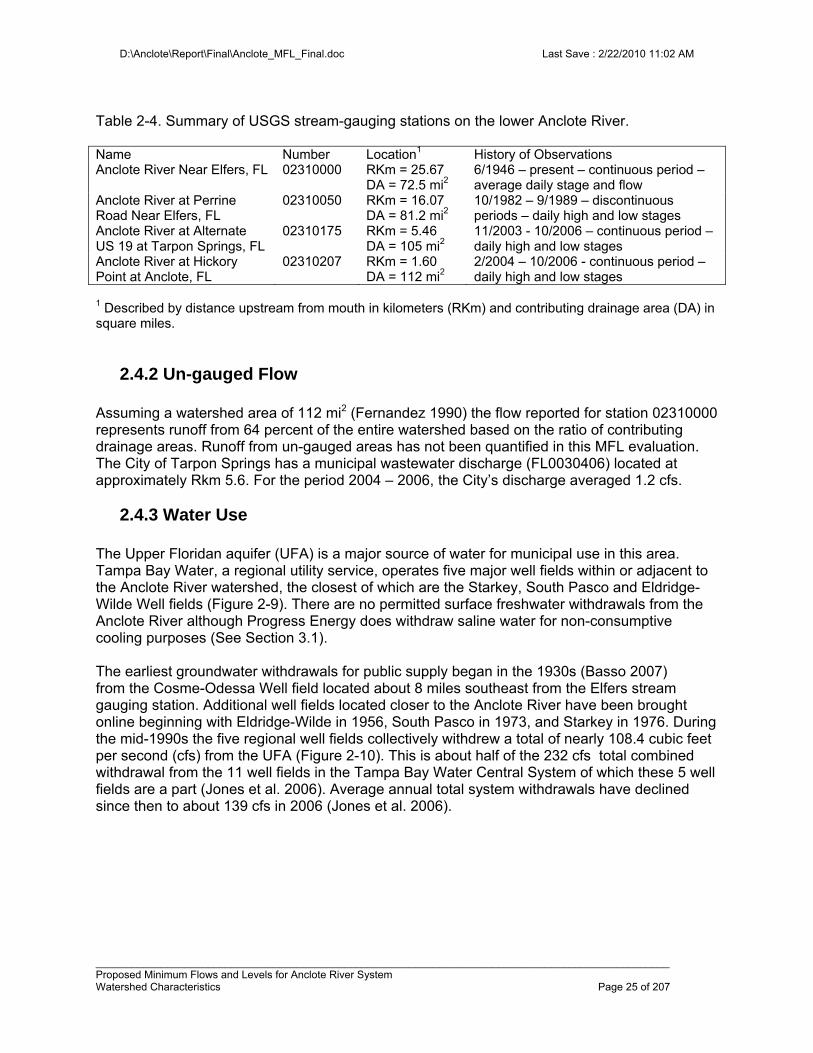
D:\Anclote\Report\Final\Anclote_MFL_Final.doc Last Save : 2/22/2010 11:02 AM
_________________________________________________________________________________________________ Proposed Minimum Flows and Levels for Anclote River System Watershed Characteristics Page 25 of 207
Table 2-4. Summary of USGS stream-gauging stations on the lower Anclote River.
Name Number Location1 History of Observations Anclote River Near Elfers, FL 02310000 RKm = 25.67
DA = 72.5 mi2 6/1946 – present – continuous period – average daily stage and flow
Anclote River at Perrine Road Near Elfers, FL
02310050 RKm = 16.07 DA = 81.2 mi2
10/1982 – 9/1989 – discontinuous periods – daily high and low stages
Anclote River at Alternate US 19 at Tarpon Springs, FL
02310175 RKm = 5.46 DA = 105 mi2
11/2003 - 10/2006 – continuous period – daily high and low stages
Anclote River at Hickory Point at Anclote, FL
02310207 RKm = 1.60 DA = 112 mi2
2/2004 – 10/2006 - continuous period – daily high and low stages
1 Described by distance upstream from mouth in kilometers (RKm) and contributing drainage area (DA) in square miles.
2.4.2 Un-gauged Flow Assuming a watershed area of 112 mi2 (Fernandez 1990) the flow reported for station 02310000 represents runoff from 64 percent of the entire watershed based on the ratio of contributing drainage areas. Runoff from un-gauged areas has not been quantified in this MFL evaluation. The City of Tarpon Springs has a municipal wastewater discharge (FL0030406) located at approximately Rkm 5.6. For the period 2004 – 2006, the City’s discharge averaged 1.2 cfs.
2.4.3 Water Use The Upper Floridan aquifer (UFA) is a major source of water for municipal use in this area. Tampa Bay Water, a regional utility service, operates five major well fields within or adjacent to the Anclote River watershed, the closest of which are the Starkey, South Pasco and Eldridge-Wilde Well fields (Figure 2-9). There are no permitted surface freshwater withdrawals from the Anclote River although Progress Energy does withdraw saline water for non-consumptive cooling purposes (See Section 3.1). The earliest groundwater withdrawals for public supply began in the 1930s (Basso 2007) from the Cosme-Odessa Well field located about 8 miles southeast from the Elfers stream gauging station. Additional well fields located closer to the Anclote River have been brought online beginning with Eldridge-Wilde in 1956, South Pasco in 1973, and Starkey in 1976. During the mid-1990s the five regional well fields collectively withdrew a total of nearly 108.4 cubic feet per second (cfs) from the UFA (Figure 2-10). This is about half of the 232 cfs total combined withdrawal from the 11 well fields in the Tampa Bay Water Central System of which these 5 well fields are a part (Jones et al. 2006). Average annual total system withdrawals have declined since then to about 139 cfs in 2006 (Jones et al. 2006).
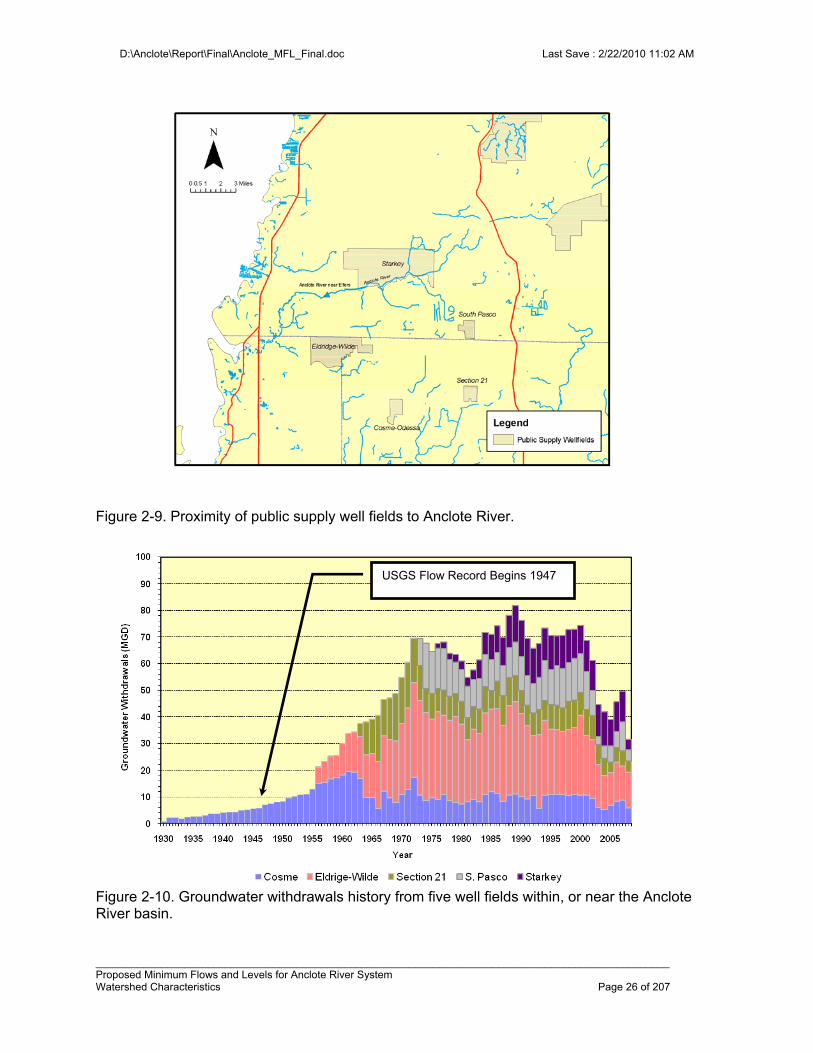
D:\Anclote\Report\Final\Anclote_MFL_Final.doc Last Save : 2/22/2010 11:02 AM
_________________________________________________________________________________________________ Proposed Minimum Flows and Levels for Anclote River System Watershed Characteristics Page 26 of 207
Figure 2-9. Proximity of public supply well fields to Anclote River.
Figure 2-10. Groundwater withdrawals history from five well fields within, or near the Anclote River basin.
USGS Flow Record Begins 1947
D:\Anclote\Report\Final\Anclote_MFL_Final.doc Last Save : 2/22/2010 11:02 AM
_________________________________________________________________________________________________ Proposed Minimum Flows and Levels for Anclote River System Watershed Characteristics Page 27 of 207
The Anclote River watershed is located in southwest Pasco County where the hydrogeologic framework of the area includes a surficial aquifer system (SAS), the underlying upper Floridan aquifer (UFA), and clay confining unit that separates the two aquifer systems (Basso 2007). The SAS is hydraulically well connected to the UFA because the clay confining unit is thin, discontinuous, and breached by numerous karst features. There is a real potential for stream flow in the Anclote River to be influenced by well field withdrawals because of the high degree of hydraulic connection between the SAS and UFA. In areas within a well field zone of influence where the water table and surface waters like the Anclote River are at a higher elevation than the UFA potentiometric surface, the drawdown of the UFA potentiometric surface will increase the vertical gradient between the two aquifers and induce additional downward vertical leakage from the shallow water sources to the UFA. A lowering of the water table creates additional storage capacity for infiltration in the vadose zone thus reducing the potential for surface runoff. In areas where the water table and surface water are at a lower elevation than the UFA potentiometric surface, the vertical gradient between the two aquifers will decrease and the upward discharge of groundwater from the UFA to the shallow water sources will be diminished.
2.5 Corrections for Anthropogenic Impacts3 The impact of groundwater withdrawals from regional well fields on Anclote River flow was evaluated using the Integrated Northern Tampa Bay (INTB) model. The model and application to the Anclote River is more fully described in Appendix 10.2. The INTB model covers 4,000 square miles of the Northern Tampa Bay region (Figure 2-11) including the entire Anclote River watershed. It is an integrated model that combines a groundwater flow model (MODFLOW) with a surface-water model (HSPF) to facilitate assessing changes due to rainfall and drainage alterations in addition to withdrawals (Basso 2007). Declines in average daily Anclote River flow due to groundwater withdrawals from the five regional well fields were calculated using the INTB model and range from 2.0 cfs during 1955 to 18.6 cfs during 2000 (Table 2-5). During this period, withdrawals increased from 20.1 cfs during 1955 at the Cosme-Odessa Well field to a combined five well field total of 118.3 cfs during 1985.
3 At the time (2005-2007) the MFL analyses were developed and the report written, ground water impacts were only available through 2000 and extrapolated to 2007. The analyses were based on the impacts reported by Basso 2007. After the MFL report was published, the groundwater impacts were updated (Basso 2009). Only Sections 2.4.3 and 2.5 were updated in the report. However, the updated results indicate that if groundwater pumpage and well rotation are maintained similar to 2008, recovery of Anclote streamflow to MFL allowable levels is achievable. For further discussion the reader is referred to the Preface.
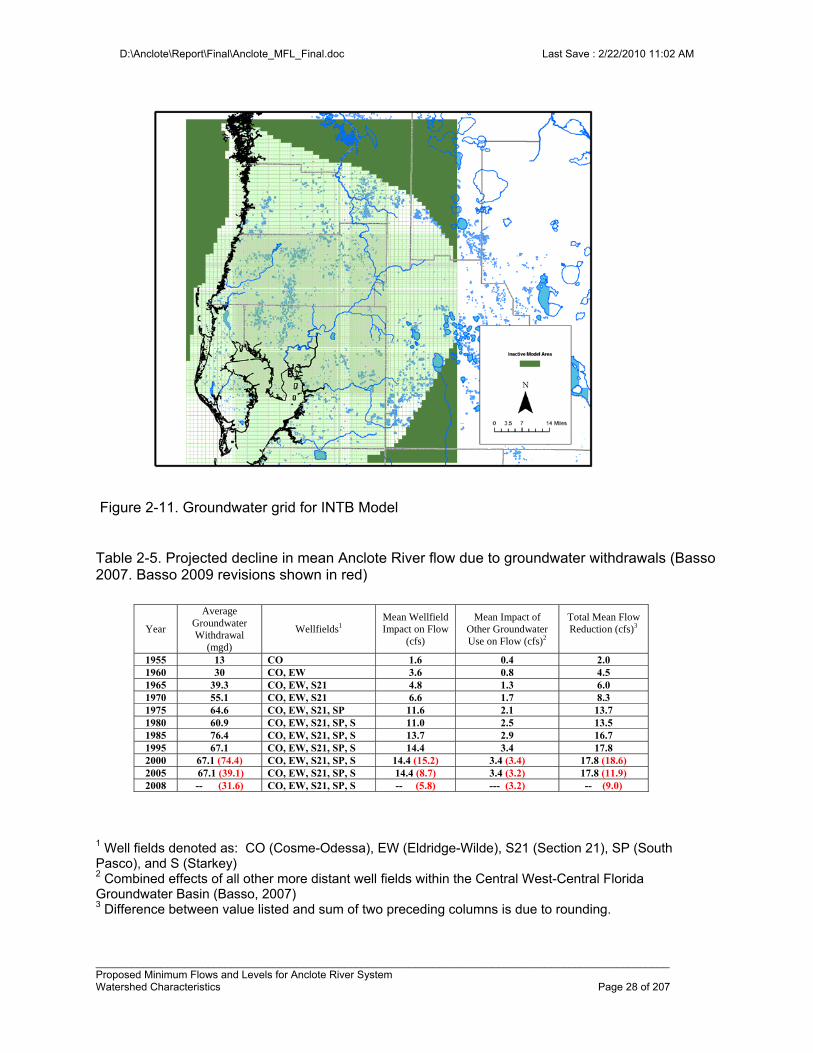
D:\Anclote\Report\Final\Anclote_MFL_Final.doc Last Save : 2/22/2010 11:02 AM
_________________________________________________________________________________________________ Proposed Minimum Flows and Levels for Anclote River System Watershed Characteristics Page 28 of 207
Figure 2-11. Groundwater grid for INTB Model Table 2-5. Projected decline in mean Anclote River flow due to groundwater withdrawals (Basso 2007. Basso 2009 revisions shown in red)
1 Well fields denoted as: CO (Cosme-Odessa), EW (Eldridge-Wilde), S21 (Section 21), SP (South Pasco), and S (Starkey) 2 Combined effects of all other more distant well fields within the Central West-Central Florida Groundwater Basin (Basso, 2007) 3 Difference between value listed and sum of two preceding columns is due to rounding.
Year
Average Groundwater Withdrawal
(mgd)
Wellfields1 Mean Wellfield Impact on Flow
(cfs)
Mean Impact of Other Groundwater Use on Flow (cfs)2
Total Mean Flow Reduction (cfs)3
1955 13 CO 1.6 0.4 2.0 1960 30 CO, EW 3.6 0.8 4.5 1965 39.3 CO, EW, S21 4.8 1.3 6.0 1970 55.1 CO, EW, S21 6.6 1.7 8.3 1975 64.6 CO, EW, S21, SP 11.6 2.1 13.7 1980 60.9 CO, EW, S21, SP, S 11.0 2.5 13.5 1985 76.4 CO, EW, S21, SP, S 13.7 2.9 16.7 1995 67.1 CO, EW, S21, SP, S 14.4 3.4 17.8 2000 67.1 (74.4) CO, EW, S21, SP, S 14.4 (15.2) 3.4 (3.4) 17.8 (18.6) 2005 67.1 (39.1) CO, EW, S21, SP, S 14.4 (8.7) 3.4 (3.2) 17.8 (11.9) 2008 -- (31.6) CO, EW, S21, SP, S -- (5.8) --- (3.2) -- (9.0)
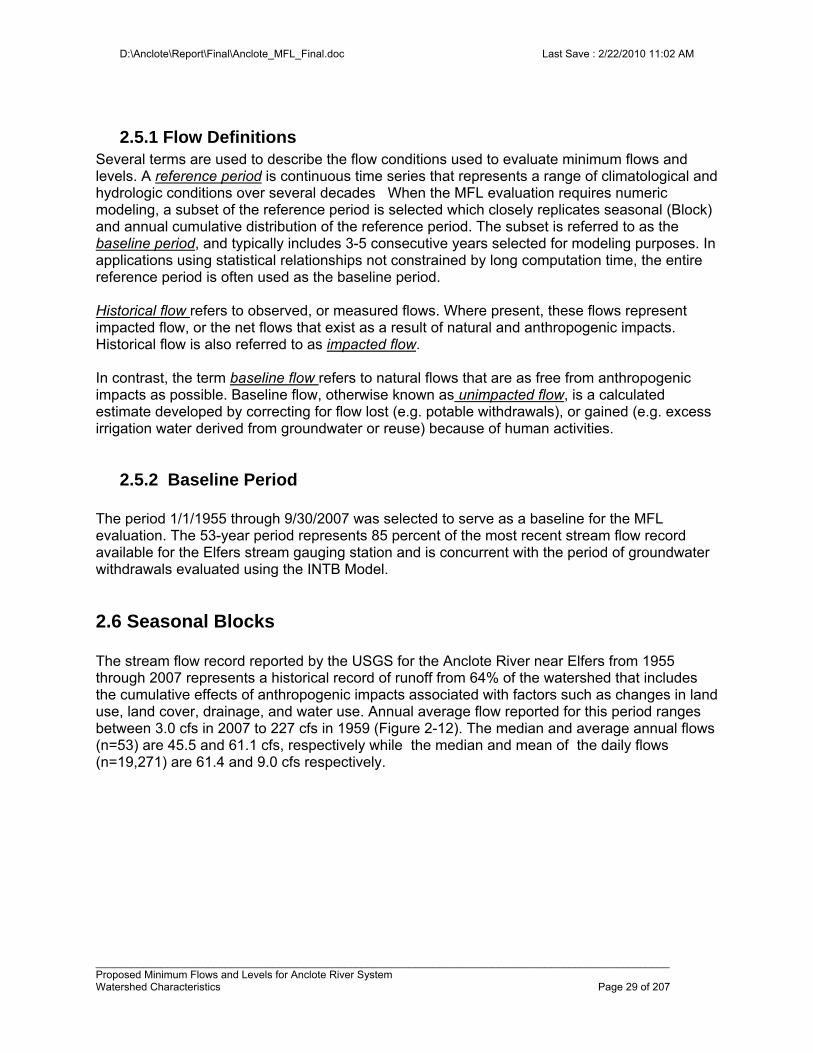
D:\Anclote\Report\Final\Anclote_MFL_Final.doc Last Save : 2/22/2010 11:02 AM
_________________________________________________________________________________________________ Proposed Minimum Flows and Levels for Anclote River System Watershed Characteristics Page 29 of 207
2.5.1 Flow Definitions Several terms are used to describe the flow conditions used to evaluate minimum flows and levels. A reference period is continuous time series that represents a range of climatological and hydrologic conditions over several decades When the MFL evaluation requires numeric modeling, a subset of the reference period is selected which closely replicates seasonal (Block) and annual cumulative distribution of the reference period. The subset is referred to as the baseline period, and typically includes 3-5 consecutive years selected for modeling purposes. In applications using statistical relationships not constrained by long computation time, the entire reference period is often used as the baseline period. Historical flow refers to observed, or measured flows. Where present, these flows represent impacted flow, or the net flows that exist as a result of natural and anthropogenic impacts. Historical flow is also referred to as impacted flow. In contrast, the term baseline flow refers to natural flows that are as free from anthropogenic impacts as possible. Baseline flow, otherwise known as unimpacted flow, is a calculated estimate developed by correcting for flow lost (e.g. potable withdrawals), or gained (e.g. excess irrigation water derived from groundwater or reuse) because of human activities.
2.5.2 Baseline Period The period 1/1/1955 through 9/30/2007 was selected to serve as a baseline for the MFL evaluation. The 53-year period represents 85 percent of the most recent stream flow record available for the Elfers stream gauging station and is concurrent with the period of groundwater withdrawals evaluated using the INTB Model.
2.6 Seasonal Blocks The stream flow record reported by the USGS for the Anclote River near Elfers from 1955 through 2007 represents a historical record of runoff from 64% of the watershed that includes the cumulative effects of anthropogenic impacts associated with factors such as changes in land use, land cover, drainage, and water use. Annual average flow reported for this period ranges between 3.0 cfs in 2007 to 227 cfs in 1959 (Figure 2-12). The median and average annual flows (n=53) are 45.5 and 61.1 cfs, respectively while the median and mean of the daily flows (n=19,271) are 61.4 and 9.0 cfs respectively.
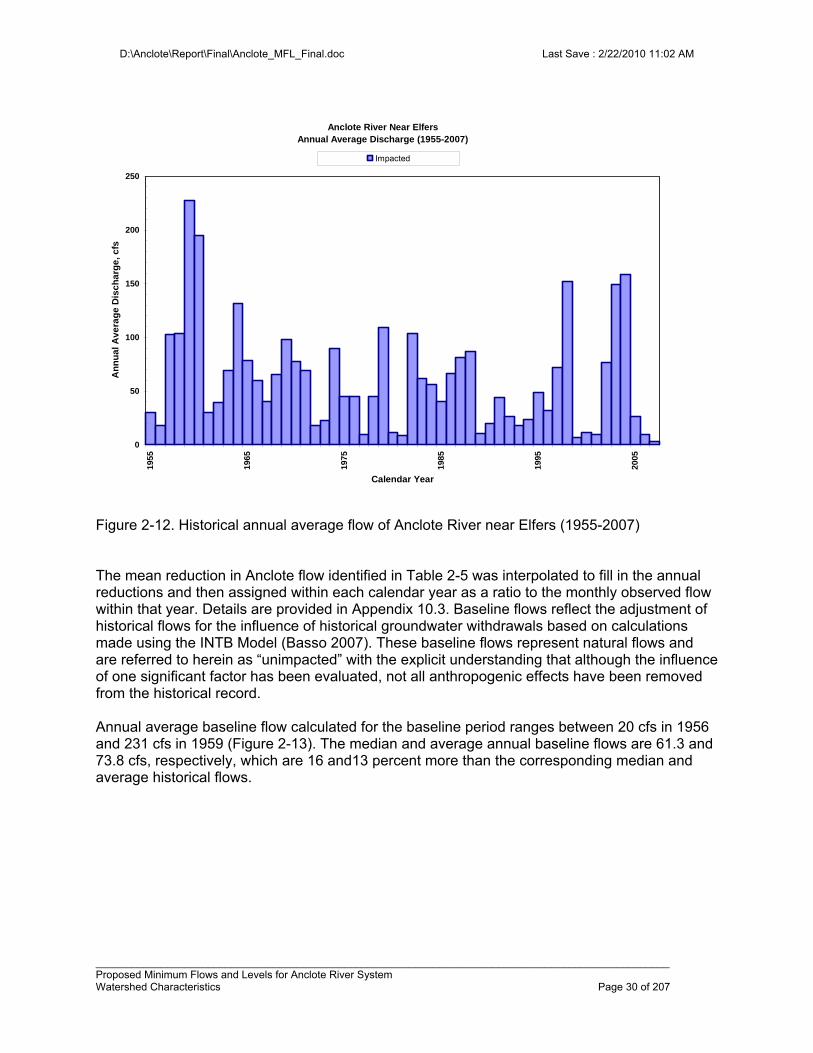
D:\Anclote\Report\Final\Anclote_MFL_Final.doc Last Save : 2/22/2010 11:02 AM
_________________________________________________________________________________________________ Proposed Minimum Flows and Levels for Anclote River System Watershed Characteristics Page 30 of 207
Figure 2-12. Historical annual average flow of Anclote River near Elfers (1955-2007) The mean reduction in Anclote flow identified in Table 2-5 was interpolated to fill in the annual reductions and then assigned within each calendar year as a ratio to the monthly observed flow within that year. Details are provided in Appendix 10.3. Baseline flows reflect the adjustment of historical flows for the influence of historical groundwater withdrawals based on calculations made using the INTB Model (Basso 2007). These baseline flows represent natural flows and are referred to herein as “unimpacted” with the explicit understanding that although the influence of one significant factor has been evaluated, not all anthropogenic effects have been removed from the historical record. Annual average baseline flow calculated for the baseline period ranges between 20 cfs in 1956 and 231 cfs in 1959 (Figure 2-13). The median and average annual baseline flows are 61.3 and 73.8 cfs, respectively, which are 16 and13 percent more than the corresponding median and average historical flows.
Anclote River Near ElfersAnnual Average Discharge (1955-2007)
0
50
100
150
200
250
1955
1965
1975
1985
1995
2005
Calendar Year
An
nu
al
Av
era
ge
Dis
ch
arg
e,
cfs
Impacted
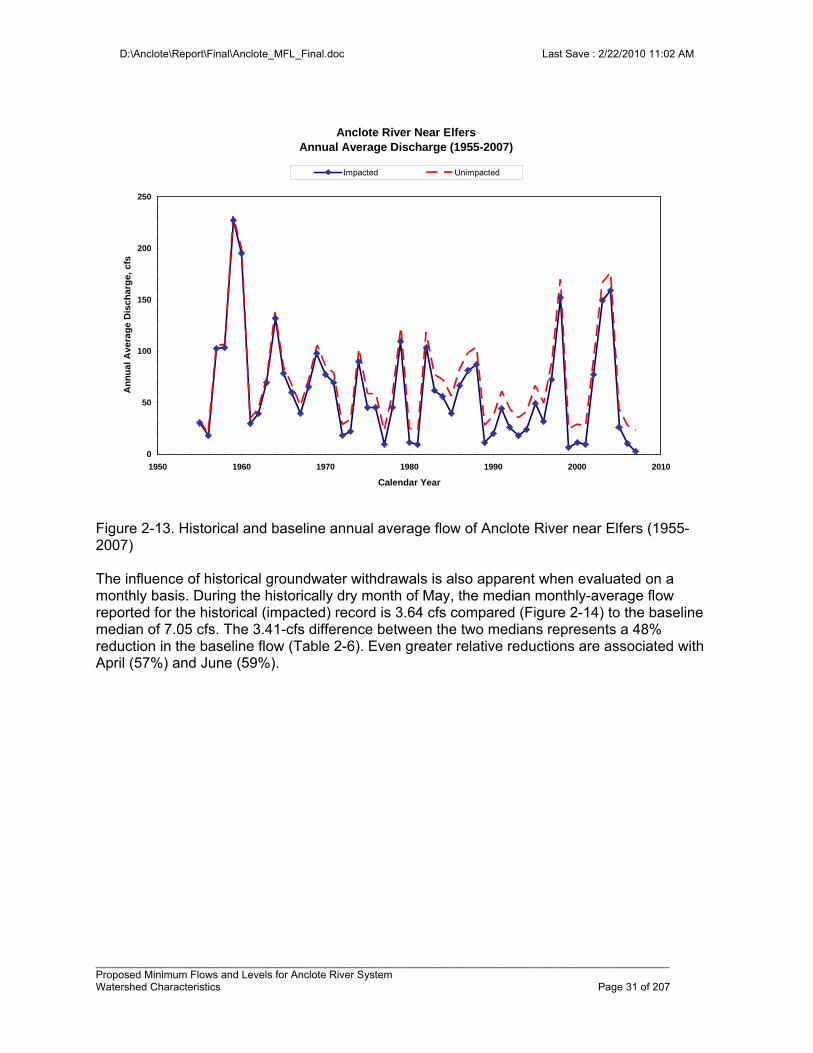
D:\Anclote\Report\Final\Anclote_MFL_Final.doc Last Save : 2/22/2010 11:02 AM
_________________________________________________________________________________________________ Proposed Minimum Flows and Levels for Anclote River System Watershed Characteristics Page 31 of 207
Figure 2-13. Historical and baseline annual average flow of Anclote River near Elfers (1955-2007) The influence of historical groundwater withdrawals is also apparent when evaluated on a monthly basis. During the historically dry month of May, the median monthly-average flow reported for the historical (impacted) record is 3.64 cfs compared (Figure 2-14) to the baseline median of 7.05 cfs. The 3.41-cfs difference between the two medians represents a 48% reduction in the baseline flow (Table 2-6). Even greater relative reductions are associated with April (57%) and June (59%).
Anclote River Near ElfersAnnual Average Discharge (1955-2007)
0
50
100
150
200
250
1950 1960 1970 1980 1990 2000 2010
Calendar Year
An
nu
al
Av
era
ge
Dis
ch
arg
e,
cfs
Impacted Unimpacted
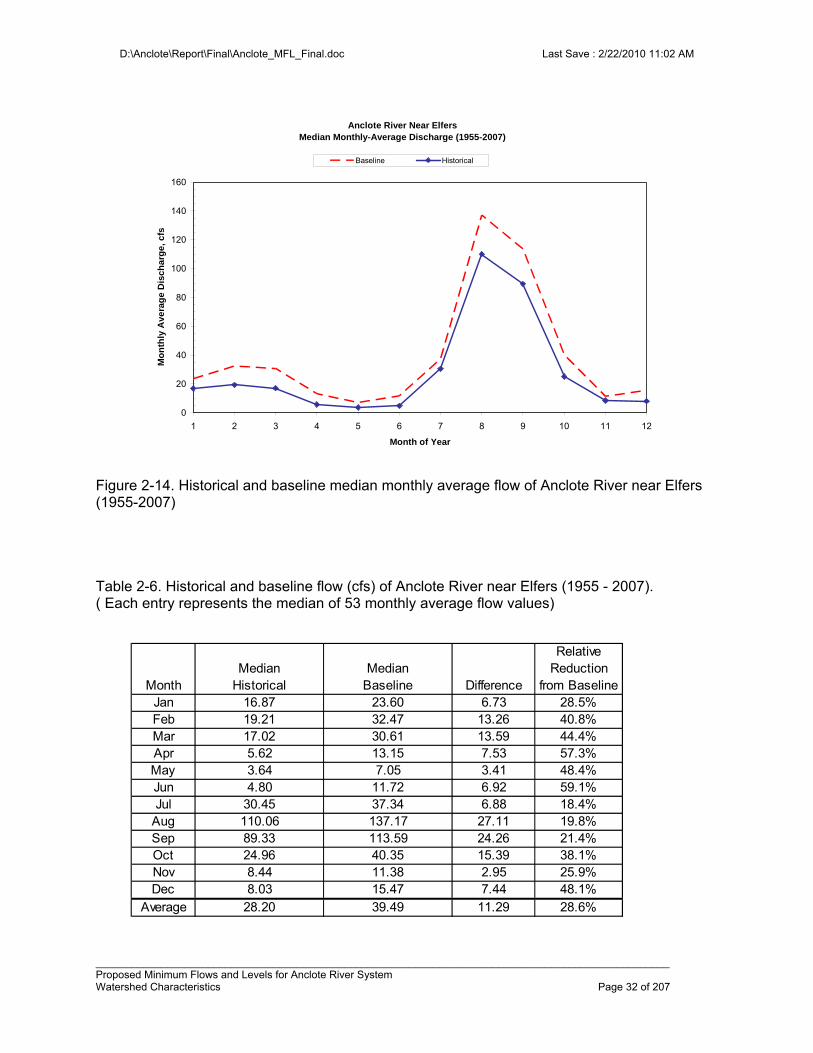
D:\Anclote\Report\Final\Anclote_MFL_Final.doc Last Save : 2/22/2010 11:02 AM
_________________________________________________________________________________________________ Proposed Minimum Flows and Levels for Anclote River System Watershed Characteristics Page 32 of 207
Figure 2-14. Historical and baseline median monthly average flow of Anclote River near Elfers (1955-2007)
Table 2-6. Historical and baseline flow (cfs) of Anclote River near Elfers (1955 - 2007). ( Each entry represents the median of 53 monthly average flow values)
Anclote River Near ElfersMedian Monthly-Average Discharge (1955-2007)
0
20
40
60
80
100
120
140
160
1 2 3 4 5 6 7 8 9 10 11 12
Month of Year
Mo
nth
ly A
vera
ge
Dis
ch
arg
e, c
fsBaseline Historical
MonthMedian
HistoricalMedian
Baseline Difference
Relative Reduction
from BaselineJan 16.87 23.60 6.73 28.5%Feb 19.21 32.47 13.26 40.8%Mar 17.02 30.61 13.59 44.4%Apr 5.62 13.15 7.53 57.3%May 3.64 7.05 3.41 48.4%Jun 4.80 11.72 6.92 59.1%Jul 30.45 37.34 6.88 18.4%
Aug 110.06 137.17 27.11 19.8%Sep 89.33 113.59 24.26 21.4%Oct 24.96 40.35 15.39 38.1%Nov 8.44 11.38 2.95 25.9%Dec 8.03 15.47 7.44 48.1%
Average 28.20 39.49 11.29 28.6%
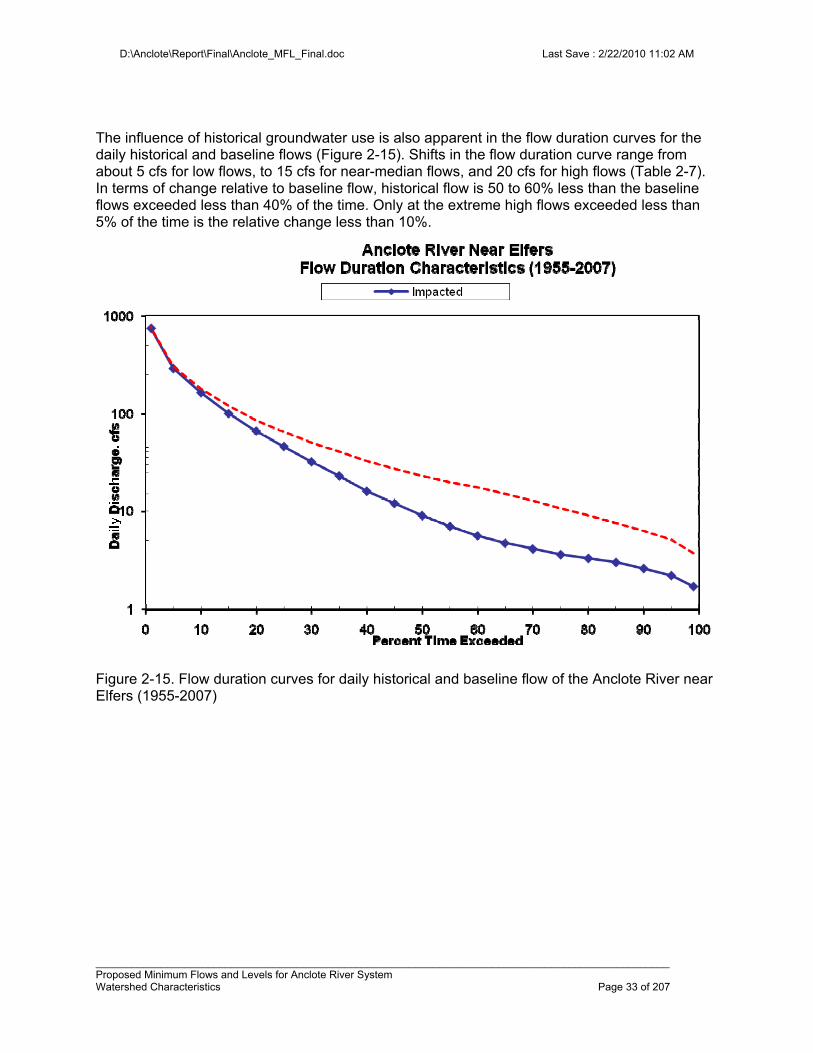
D:\Anclote\Report\Final\Anclote_MFL_Final.doc Last Save : 2/22/2010 11:02 AM
_________________________________________________________________________________________________ Proposed Minimum Flows and Levels for Anclote River System Watershed Characteristics Page 33 of 207
The influence of historical groundwater use is also apparent in the flow duration curves for the daily historical and baseline flows (Figure 2-15). Shifts in the flow duration curve range from about 5 cfs for low flows, to 15 cfs for near-median flows, and 20 cfs for high flows (Table 2-7). In terms of change relative to baseline flow, historical flow is 50 to 60% less than the baseline flows exceeded less than 40% of the time. Only at the extreme high flows exceeded less than 5% of the time is the relative change less than 10%.
Figure 2-15. Flow duration curves for daily historical and baseline flow of the Anclote River near Elfers (1955-2007)
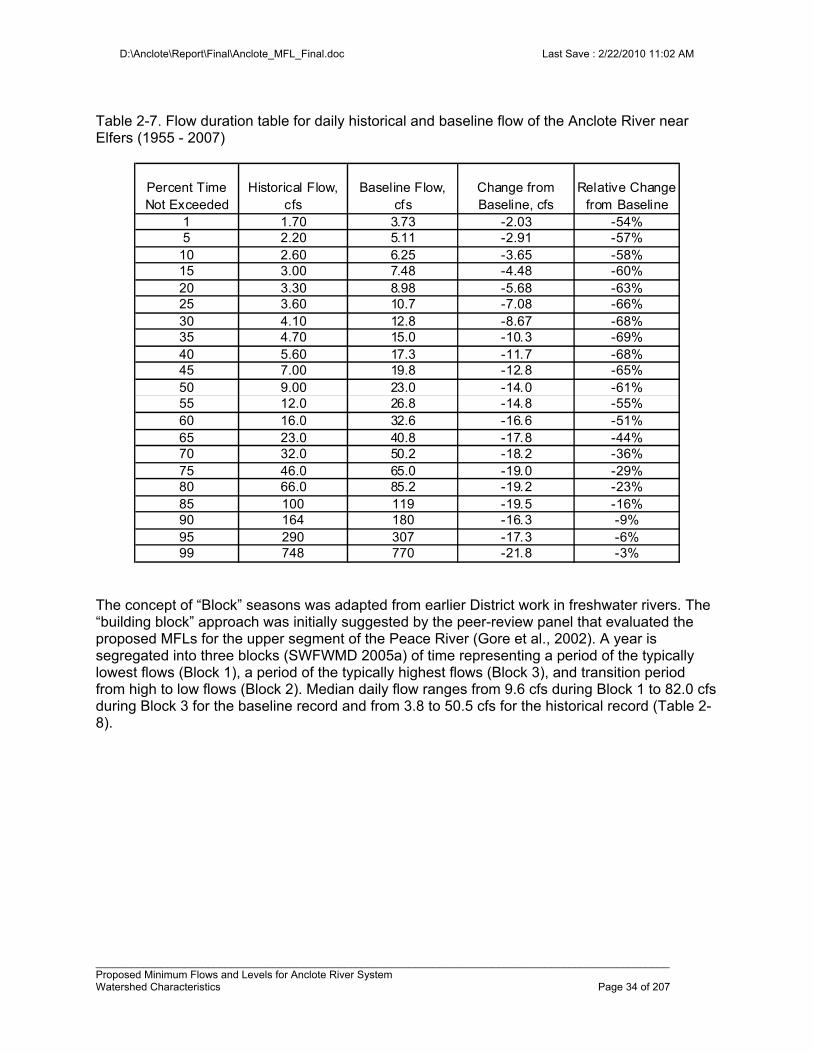
D:\Anclote\Report\Final\Anclote_MFL_Final.doc Last Save : 2/22/2010 11:02 AM
_________________________________________________________________________________________________ Proposed Minimum Flows and Levels for Anclote River System Watershed Characteristics Page 34 of 207
Table 2-7. Flow duration table for daily historical and baseline flow of the Anclote River near Elfers (1955 - 2007)
Percent Time Not Exceeded
Historical Flow, cfs
Baseline Flow, cfs
Change from Baseline, cfs
Relative Change from Baseline
1 1.70 3.73 -2.03 -54%5 2.20 5.11 -2.91 -57%
10 2.60 6.25 -3.65 -58%15 3.00 7.48 -4.48 -60%20 3.30 8.98 -5.68 -63%25 3.60 10.7 -7.08 -66%30 4.10 12.8 -8.67 -68%35 4.70 15.0 -10.3 -69%40 5.60 17.3 -11.7 -68%45 7.00 19.8 -12.8 -65%50 9.00 23.0 -14.0 -61%55 12.0 26.8 -14.8 -55%60 16.0 32.6 -16.6 -51%65 23.0 40.8 -17.8 -44%70 32.0 50.2 -18.2 -36%75 46.0 65.0 -19.0 -29%80 66.0 85.2 -19.2 -23%85 100 119 -19.5 -16%90 164 180 -16.3 -9%95 290 307 -17.3 -6%99 748 770 -21.8 -3%
The concept of “Block” seasons was adapted from earlier District work in freshwater rivers. The “building block” approach was initially suggested by the peer-review panel that evaluated the proposed MFLs for the upper segment of the Peace River (Gore et al., 2002). A year is segregated into three blocks (SWFWMD 2005a) of time representing a period of the typically lowest flows (Block 1), a period of the typically highest flows (Block 3), and transition period from high to low flows (Block 2). Median daily flow ranges from 9.6 cfs during Block 1 to 82.0 cfs during Block 3 for the baseline record and from 3.8 to 50.5 cfs for the historical record (Table 2-8).
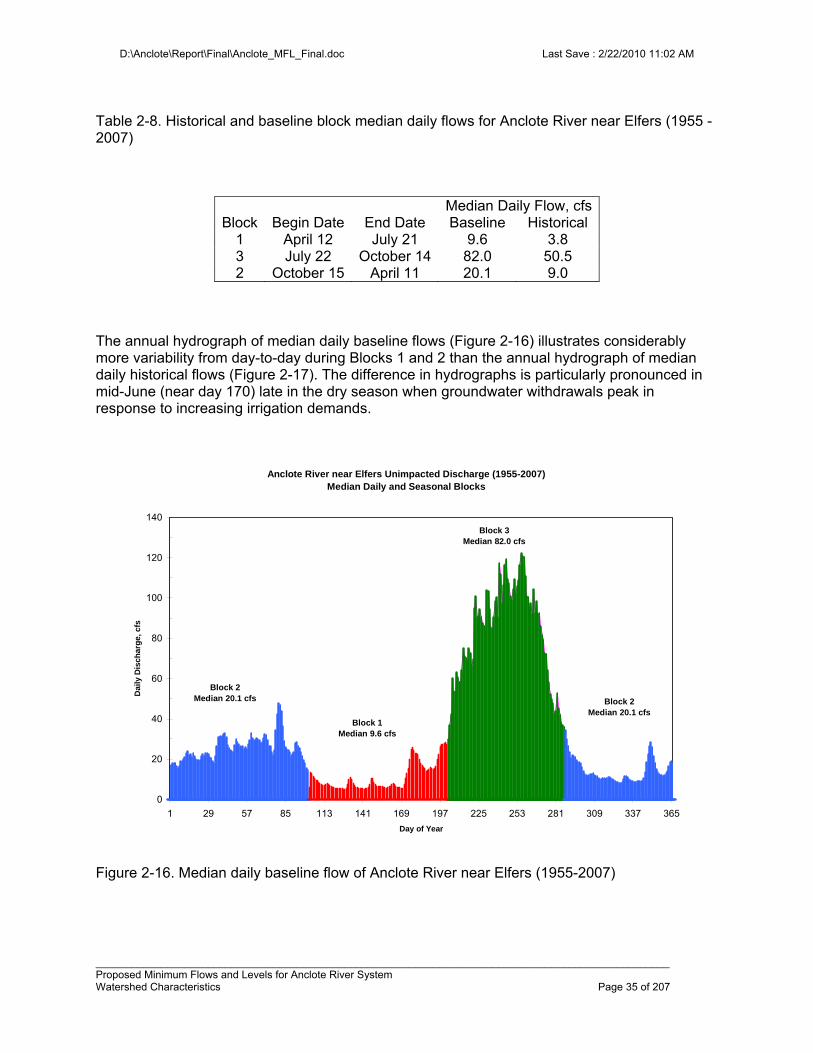
D:\Anclote\Report\Final\Anclote_MFL_Final.doc Last Save : 2/22/2010 11:02 AM
_________________________________________________________________________________________________ Proposed Minimum Flows and Levels for Anclote River System Watershed Characteristics Page 35 of 207
Table 2-8. Historical and baseline block median daily flows for Anclote River near Elfers (1955 - 2007)
Median Daily Flow, cfs Block Begin Date End Date Baseline Historical
1 April 12 July 21 9.6 3.8 3 July 22 October 14 82.0 50.5 2 October 15 April 11 20.1 9.0
The annual hydrograph of median daily baseline flows (Figure 2-16) illustrates considerably more variability from day-to-day during Blocks 1 and 2 than the annual hydrograph of median daily historical flows (Figure 2-17). The difference in hydrographs is particularly pronounced in mid-June (near day 170) late in the dry season when groundwater withdrawals peak in response to increasing irrigation demands.
Figure 2-16. Median daily baseline flow of Anclote River near Elfers (1955-2007)
Anclote River near Elfers Unimpacted Discharge (1955-2007)Median Daily and Seasonal Blocks
0
20
40
60
80
100
120
140
1 29 57 85 113 141 169 197 225 253 281 309 337 365
Day of Year
Dai
ly D
isch
arg
e, c
fs
Block 3Median 82.0 cfs
Block 1Median 9.6 cfs
Block 2Median 20.1 cfs
Block 2Median 20.1 cfs
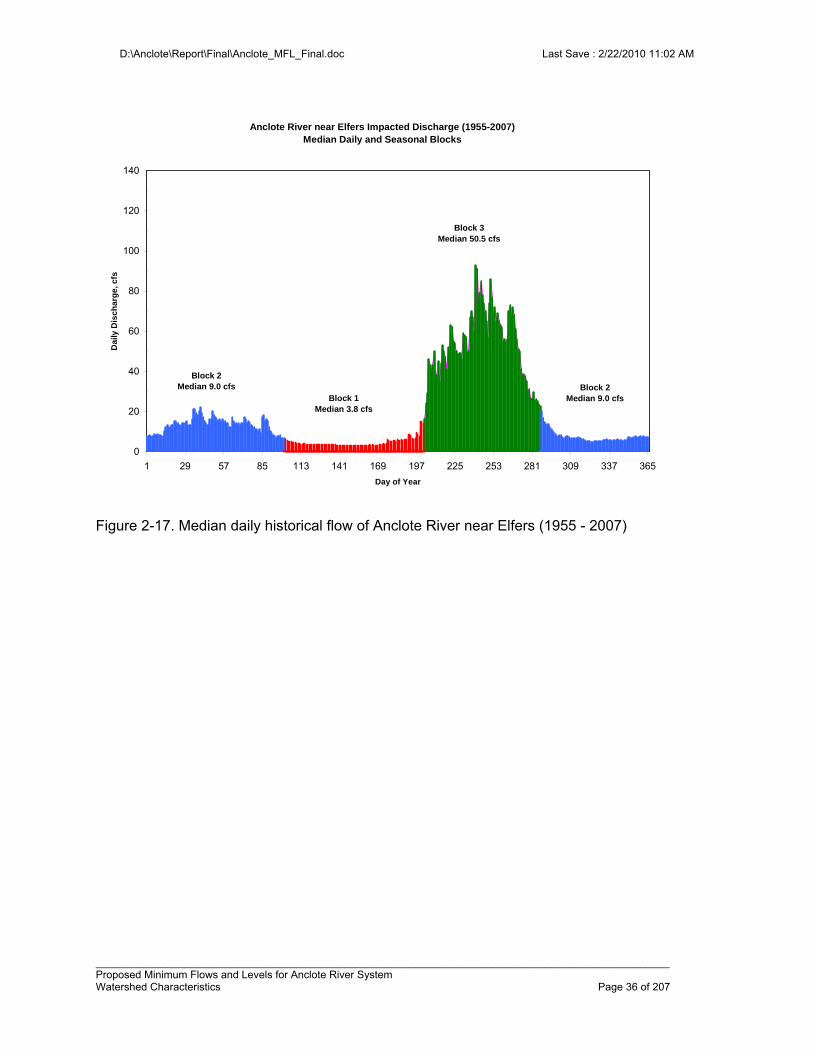
D:\Anclote\Report\Final\Anclote_MFL_Final.doc Last Save : 2/22/2010 11:02 AM
_________________________________________________________________________________________________ Proposed Minimum Flows and Levels for Anclote River System Watershed Characteristics Page 36 of 207
Figure 2-17. Median daily historical flow of Anclote River near Elfers (1955 - 2007)
Anclote River near Elfers Impacted Discharge (1955-2007)Median Daily and Seasonal Blocks
0
20
40
60
80
100
120
140
1 29 57 85 113 141 169 197 225 253 281 309 337 365
Day of Year
Da
ily D
isc
ha
rge
, cfs
Block 3Median 50.5 cfs
Block 1Median 3.8 cfs
Block 2Median 9.0 cfs
Block 2Median 9.0 cfs
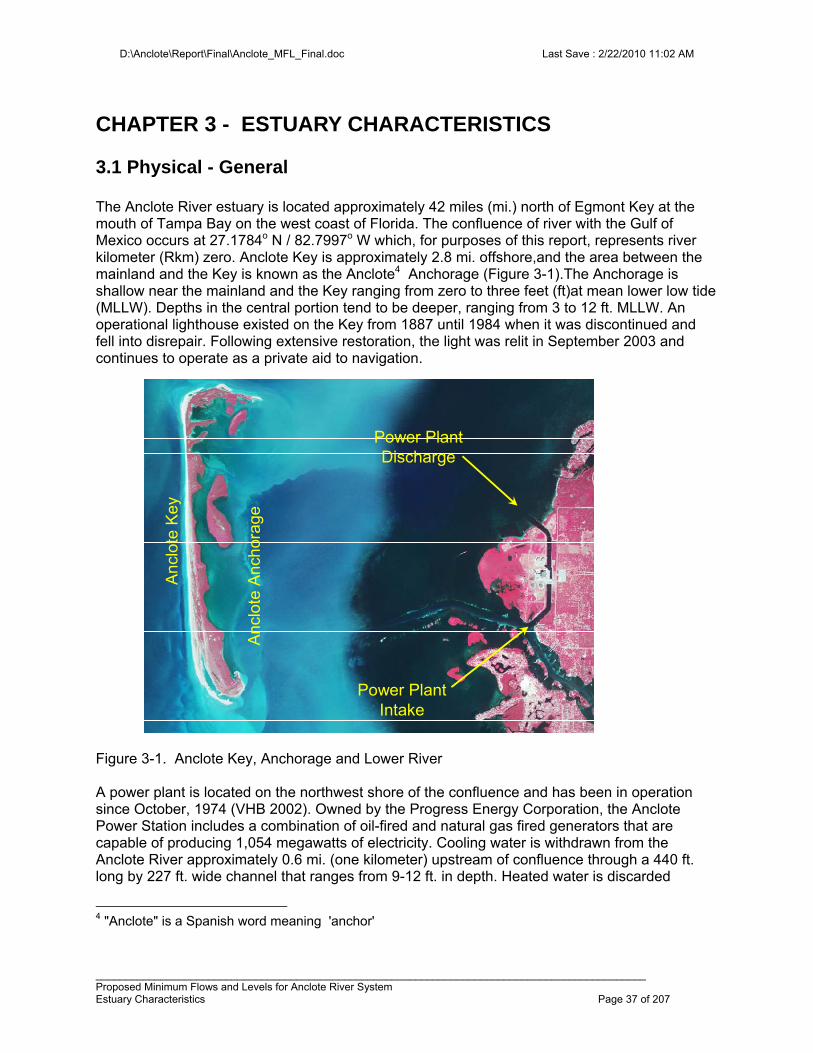
D:\Anclote\Report\Final\Anclote_MFL_Final.doc Last Save : 2/22/2010 11:02 AM
_____________________________________________________________________________________________ Proposed Minimum Flows and Levels for Anclote River System Estuary Characteristics Page 37 of 207
CHAPTER 3 - ESTUARY CHARACTERISTICS
3.1 Physical - General The Anclote River estuary is located approximately 42 miles (mi.) north of Egmont Key at the mouth of Tampa Bay on the west coast of Florida. The confluence of river with the Gulf of Mexico occurs at 27.1784o N / 82.7997o W which, for purposes of this report, represents river kilometer (Rkm) zero. Anclote Key is approximately 2.8 mi. offshore,and the area between the mainland and the Key is known as the Anclote4 Anchorage (Figure 3-1).The Anchorage is shallow near the mainland and the Key ranging from zero to three feet (ft)at mean lower low tide (MLLW). Depths in the central portion tend to be deeper, ranging from 3 to 12 ft. MLLW. An operational lighthouse existed on the Key from 1887 until 1984 when it was discontinued and fell into disrepair. Following extensive restoration, the light was relit in September 2003 and continues to operate as a private aid to navigation.
Figure 3-1. Anclote Key, Anchorage and Lower River A power plant is located on the northwest shore of the confluence and has been in operation since October, 1974 (VHB 2002). Owned by the Progress Energy Corporation, the Anclote Power Station includes a combination of oil-fired and natural gas fired generators that are capable of producing 1,054 megawatts of electricity. Cooling water is withdrawn from the Anclote River approximately 0.6 mi. (one kilometer) upstream of confluence through a 440 ft. long by 227 ft. wide channel that ranges from 9-12 ft. in depth. Heated water is discarded
4 "Anclote" is a Spanish word meaning 'anchor'
Anc
lote
Anc
hor
age
Anc
lote
Key
Power Plant Discharge
Power Plant Intake
Anc
lote
Anc
hor
age
Anc
lote
Key
Power Plant Discharge
Power Plant Intake
D:\Anclote\Report\Final\Anclote_MFL_Final.doc Last Save : 2/22/2010 11:02 AM
_________________________________________________________________________________________________ Proposed Minimum Flows and Levels for Anclote River System Estuary Characteristics Page 38 of 207
through a 4,600 ft. channel that discharges to Anclote Anchorage north of the river mouth. The maximum permitted flow for condenser cooling is 3,440 cfs. and an additional 2,370 cfs. may be withdrawn and pumped directly into the discharge canal for additional cooling (PBSJ 1999). Recently, Tampa Bay Water investigated co-locating a desalinization water plant at this site (Janicki Environmental 2003) producing 10 -15 mgd of potable water. The primary environmental concern for seawater desalination is the disposal of high salinity by-product concentrate. As evaluated, the high volume of cooling water would be used to dilute the concentrate. The desalinization study indicates that diluting the by-product will produce dissolved constituents that are equal to, or less than 20 % above background (PB Water, 2001). Just upstream of the intake canal on the north shore is the abandoned 160-acre Stauffer Chemical Co. which is listed on the National Priority List of Superfund cleanup sites. Elemental phosphorus was extracted from phosphate ore at this plant from 1947 to 1981. Soil, sediment, groundwater and surface water at this site are contaminated (ATSDR undated). Chemicals of concern include arsenic, beryllium, cadmium and chromium. Based on available information, the US Department of Health and Human Services categorized the site as hazardous. The Anchorage supports a lush community of submerged aquatic vegetation (SAV), which has been studied and characterized several times over the past few decades (FPC 1977, FPC, 1983, MML 1991, FPC 1992 and VHB 2002). Early studies were designed to assess the thermal impact of the power plant discharge on the SAV community. Mote Marine Laboratory (MML1991) compared the aerial coverage of SAV from April 1990 photography with that observed on 1981 and 1988 photography. Temperature differences between control and thermal stations were small (< 2oC), and salinity varied less than 3 parts per thousand (ppt) at most stations. No losses attributable to thermal discharge were observed (VHB 2002). Figure 3-2 illustrates the 2004 SAV coverage in the Anchorage and near-coastal river (SWFWMD unpublished map). The lower watershed is heavily urbanized, particularly in Tarpon Springs. The tidal reach of the river extends about 22.6 km (14.1 mi.) upstream of the river mouth to just above Seven Sisters Blvd (Fernandez 51990). Increased polluted storm water runoff in the Anclote River is anticipated as a result of increasing residential development in the Seven Springs area (upstream of S.R. 54), downstream to Tarpon Springs (FDEP 2005).
5 Present reported distances are referenced from Gulf. Fernandez referenced distances from Hickory Point which is 1.06 miles upstream from Gulf.
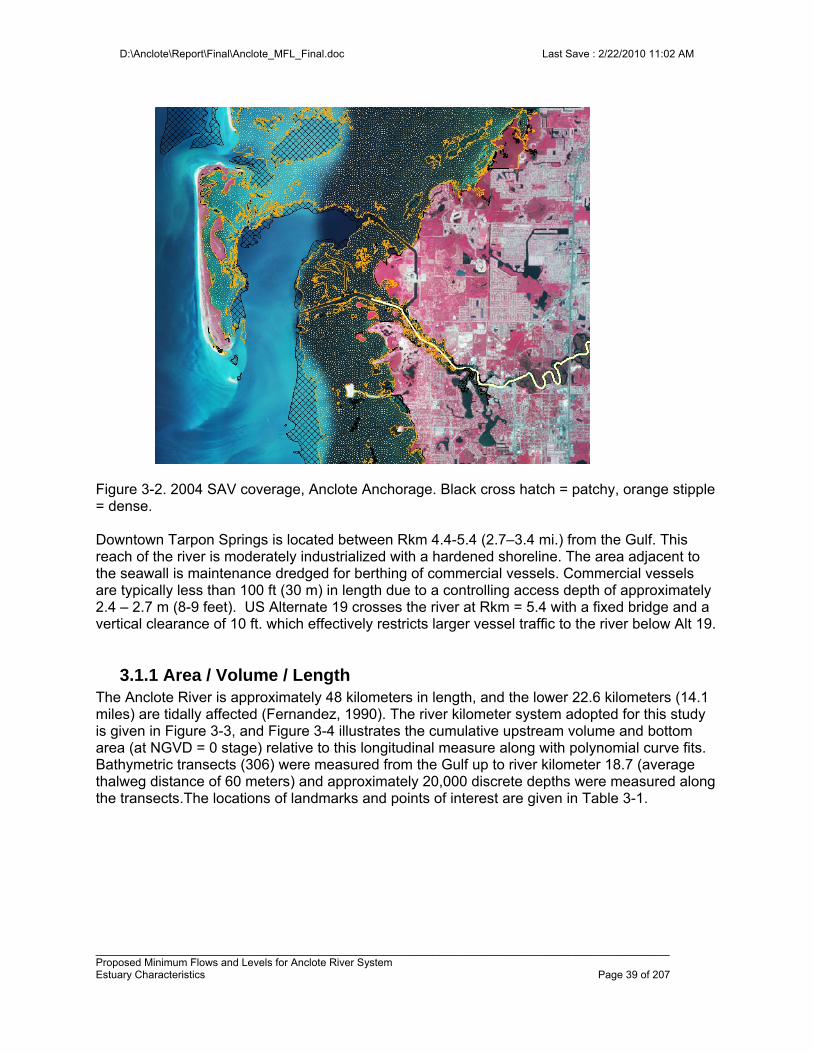
D:\Anclote\Report\Final\Anclote_MFL_Final.doc Last Save : 2/22/2010 11:02 AM
_________________________________________________________________________________________________ Proposed Minimum Flows and Levels for Anclote River System Estuary Characteristics Page 39 of 207
Figure 3-2. 2004 SAV coverage, Anclote Anchorage. Black cross hatch = patchy, orange stipple = dense. Downtown Tarpon Springs is located between Rkm 4.4-5.4 (2.7–3.4 mi.) from the Gulf. This reach of the river is moderately industrialized with a hardened shoreline. The area adjacent to the seawall is maintenance dredged for berthing of commercial vessels. Commercial vessels are typically less than 100 ft (30 m) in length due to a controlling access depth of approximately 2.4 – 2.7 m (8-9 feet). US Alternate 19 crosses the river at Rkm = 5.4 with a fixed bridge and a vertical clearance of 10 ft. which effectively restricts larger vessel traffic to the river below Alt 19.
3.1.1 Area / Volume / Length The Anclote River is approximately 48 kilometers in length, and the lower 22.6 kilometers (14.1 miles) are tidally affected (Fernandez, 1990). The river kilometer system adopted for this study is given in Figure 3-3, and Figure 3-4 illustrates the cumulative upstream volume and bottom area (at NGVD = 0 stage) relative to this longitudinal measure along with polynomial curve fits. Bathymetric transects (306) were measured from the Gulf up to river kilometer 18.7 (average thalweg distance of 60 meters) and approximately 20,000 discrete depths were measured along the transects.The locations of landmarks and points of interest are given in Table 3-1.
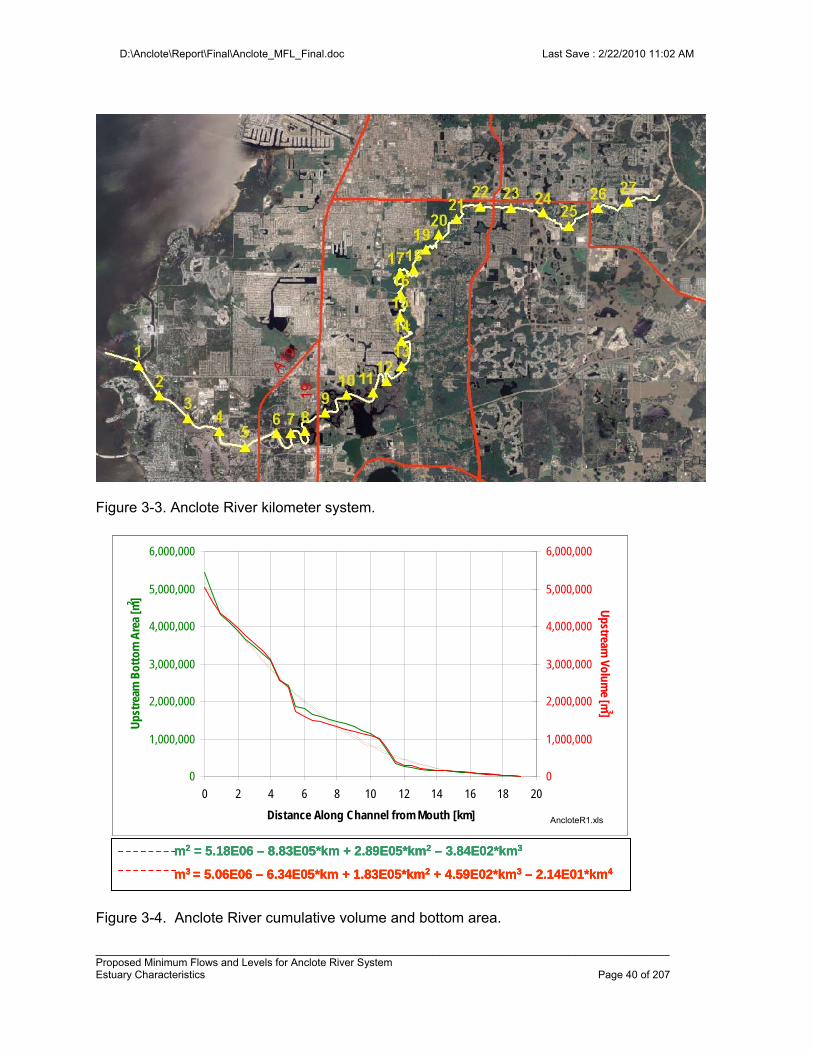
D:\Anclote\Report\Final\Anclote_MFL_Final.doc Last Save : 2/22/2010 11:02 AM
_________________________________________________________________________________________________ Proposed Minimum Flows and Levels for Anclote River System Estuary Characteristics Page 40 of 207
Figure 3-3. Anclote River kilometer system.
Figure 3-4. Anclote River cumulative volume and bottom area.
m2 = 5.18E06 – 8.83E05*km + 2.89E05*km2 – 3.84E02*km3
m3 = 5.06E06 – 6.34E05*km + 1.83E05*km2 + 4.59E02*km3 – 2.14E01*km4
0
1,000,000
2,000,000
3,000,000
4,000,000
5,000,000
6,000,000
0 2 4 6 8 10 12 14 16 18 20
Distance Along Channel from Mouth [km]
Ups
trea
m B
otto
m A
rea
[m2 ]
0
1,000,000
2,000,000
3,000,000
4,000,000
5,000,000
6,000,000
Upstream
Volume [m
3]
AncloteR1.xls
m2 = 5.18E06 – 8.83E05*km + 2.89E05*km2 – 3.84E02*km3
m3 = 5.06E06 – 6.34E05*km + 1.83E05*km2 + 4.59E02*km3 – 2.14E01*km4
m2 = 5.18E06 – 8.83E05*km + 2.89E05*km2 – 3.84E02*km3
m3 = 5.06E06 – 6.34E05*km + 1.83E05*km2 + 4.59E02*km3 – 2.14E01*km4
0
1,000,000
2,000,000
3,000,000
4,000,000
5,000,000
6,000,000
0 2 4 6 8 10 12 14 16 18 20
Distance Along Channel from Mouth [km]
Ups
trea
m B
otto
m A
rea
[m2 ]
0
1,000,000
2,000,000
3,000,000
4,000,000
5,000,000
6,000,000
Upstream
Volume [m
3]
AncloteR1.xls
0
1,000,000
2,000,000
3,000,000
4,000,000
5,000,000
6,000,000
0 2 4 6 8 10 12 14 16 18 20
Distance Along Channel from Mouth [km]
Ups
trea
m B
otto
m A
rea
[m2 ]
0
1,000,000
2,000,000
3,000,000
4,000,000
5,000,000
6,000,000
Upstream
Volume [m
3]
AncloteR1.xls
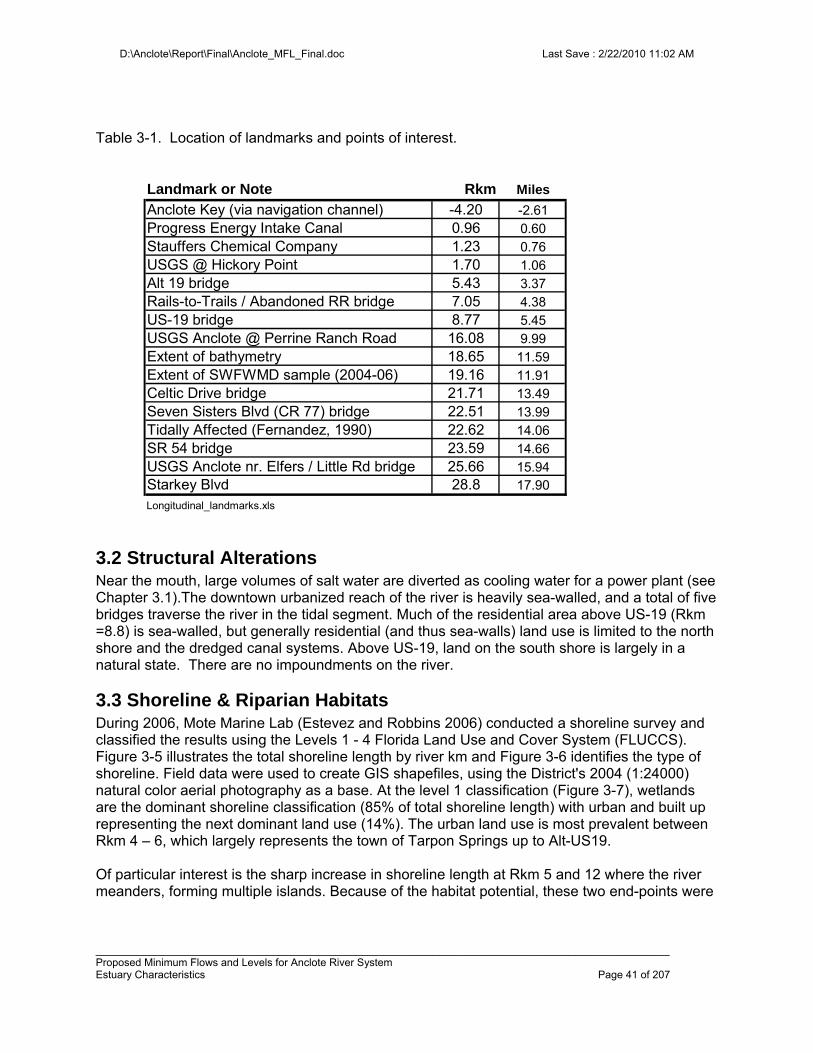
D:\Anclote\Report\Final\Anclote_MFL_Final.doc Last Save : 2/22/2010 11:02 AM
_________________________________________________________________________________________________ Proposed Minimum Flows and Levels for Anclote River System Estuary Characteristics Page 41 of 207
Table 3-1. Location of landmarks and points of interest.
3.2 Structural Alterations Near the mouth, large volumes of salt water are diverted as cooling water for a power plant (see Chapter 3.1).The downtown urbanized reach of the river is heavily sea-walled, and a total of five bridges traverse the river in the tidal segment. Much of the residential area above US-19 (Rkm =8.8) is sea-walled, but generally residential (and thus sea-walls) land use is limited to the north shore and the dredged canal systems. Above US-19, land on the south shore is largely in a natural state. There are no impoundments on the river.
3.3 Shoreline & Riparian Habitats During 2006, Mote Marine Lab (Estevez and Robbins 2006) conducted a shoreline survey and classified the results using the Levels 1 - 4 Florida Land Use and Cover System (FLUCCS). Figure 3-5 illustrates the total shoreline length by river km and Figure 3-6 identifies the type of shoreline. Field data were used to create GIS shapefiles, using the District's 2004 (1:24000) natural color aerial photography as a base. At the level 1 classification (Figure 3-7), wetlands are the dominant shoreline classification (85% of total shoreline length) with urban and built up representing the next dominant land use (14%). The urban land use is most prevalent between Rkm 4 – 6, which largely represents the town of Tarpon Springs up to Alt-US19. Of particular interest is the sharp increase in shoreline length at Rkm 5 and 12 where the river meanders, forming multiple islands. Because of the habitat potential, these two end-points were
Landmark or Note Rkm Miles
Anclote Key (via navigation channel) -4.20 -2.61Progress Energy Intake Canal 0.96 0.60Stauffers Chemical Company 1.23 0.76USGS @ Hickory Point 1.70 1.06Alt 19 bridge 5.43 3.37Rails-to-Trails / Abandoned RR bridge 7.05 4.38US-19 bridge 8.77 5.45USGS Anclote @ Perrine Ranch Road 16.08 9.99Extent of bathymetry 18.65 11.59Extent of SWFWMD sample (2004-06) 19.16 11.91Celtic Drive bridge 21.71 13.49Seven Sisters Blvd (CR 77) bridge 22.51 13.99Tidally Affected (Fernandez, 1990) 22.62 14.06SR 54 bridge 23.59 14.66USGS Anclote nr. Elfers / Little Rd bridge 25.66 15.94Starkey Blvd 28.8 17.90
Longitudinal_landmarks.xls
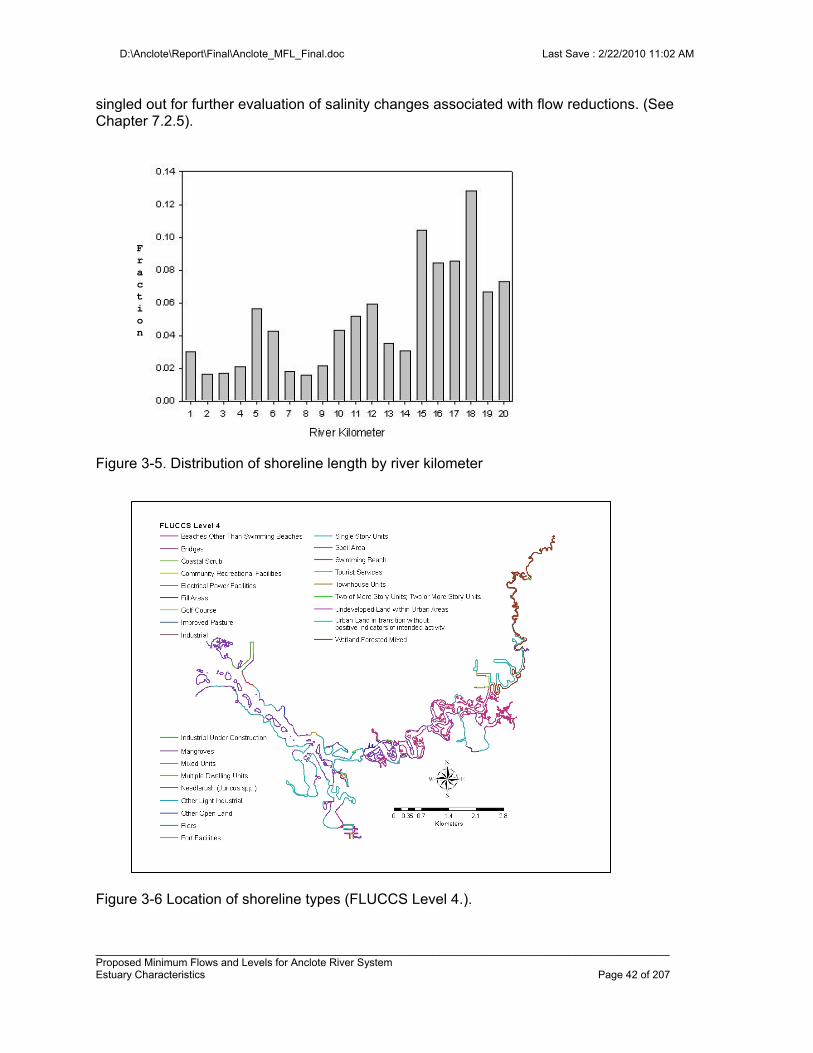
D:\Anclote\Report\Final\Anclote_MFL_Final.doc Last Save : 2/22/2010 11:02 AM
_________________________________________________________________________________________________ Proposed Minimum Flows and Levels for Anclote River System Estuary Characteristics Page 42 of 207
singled out for further evaluation of salinity changes associated with flow reductions. (See Chapter 7.2.5).
Figure 3-5. Distribution of shoreline length by river kilometer
Figure 3-6 Location of shoreline types (FLUCCS Level 4.).
Fraction
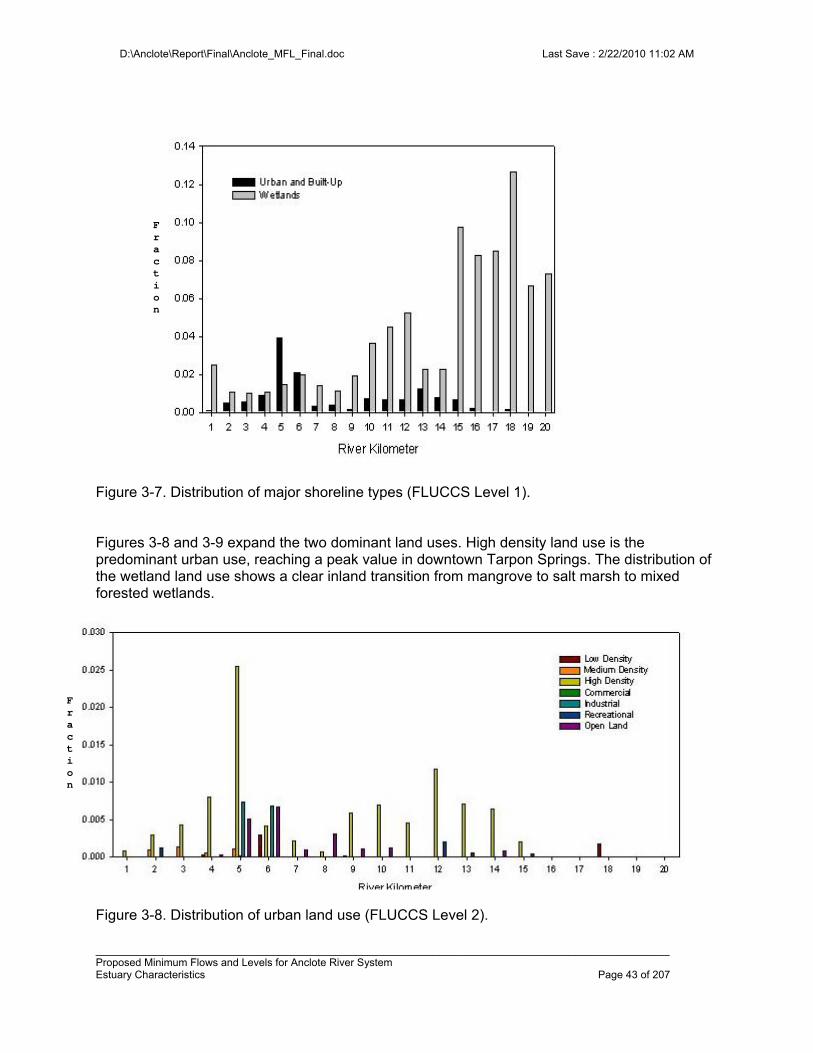
D:\Anclote\Report\Final\Anclote_MFL_Final.doc Last Save : 2/22/2010 11:02 AM
_________________________________________________________________________________________________ Proposed Minimum Flows and Levels for Anclote River System Estuary Characteristics Page 43 of 207
Figure 3-7. Distribution of major shoreline types (FLUCCS Level 1). Figures 3-8 and 3-9 expand the two dominant land uses. High density land use is the predominant urban use, reaching a peak value in downtown Tarpon Springs. The distribution of the wetland land use shows a clear inland transition from mangrove to salt marsh to mixed forested wetlands.
Figure 3-8. Distribution of urban land use (FLUCCS Level 2).
Fraction
Fraction
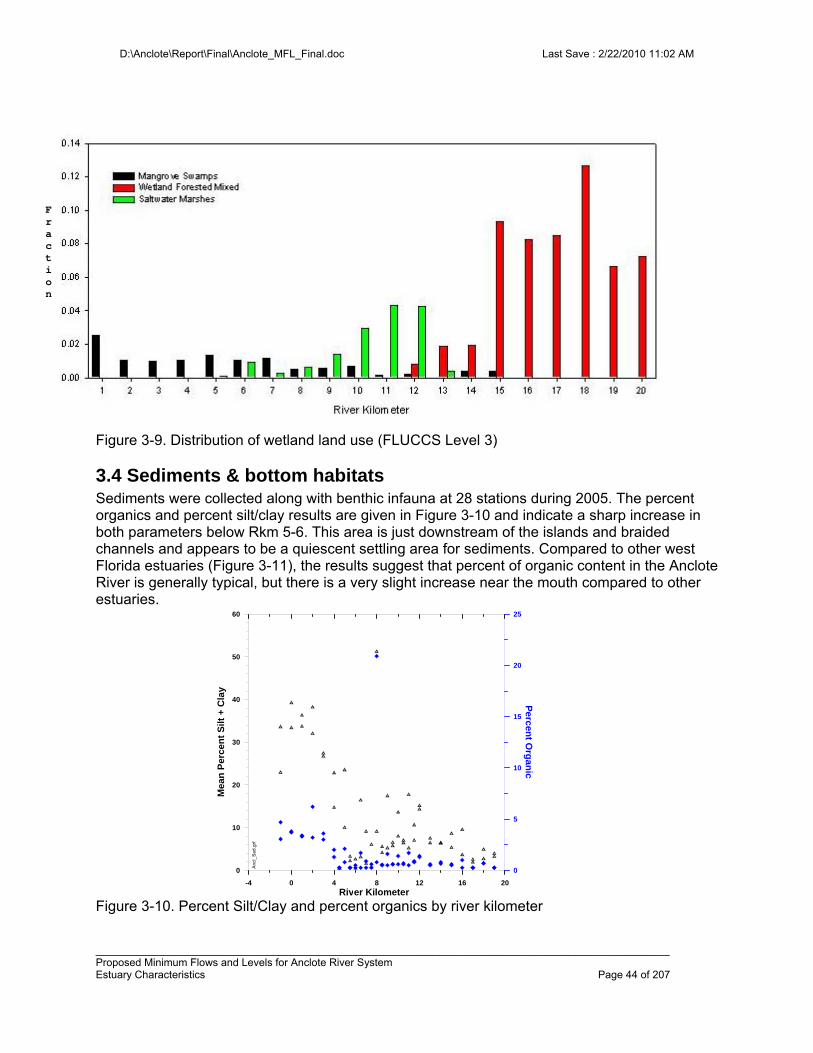
D:\Anclote\Report\Final\Anclote_MFL_Final.doc Last Save : 2/22/2010 11:02 AM
_________________________________________________________________________________________________ Proposed Minimum Flows and Levels for Anclote River System Estuary Characteristics Page 44 of 207
Figure 3-9. Distribution of wetland land use (FLUCCS Level 3)
3.4 Sediments & bottom habitats Sediments were collected along with benthic infauna at 28 stations during 2005. The percent organics and percent silt/clay results are given in Figure 3-10 and indicate a sharp increase in both parameters below Rkm 5-6. This area is just downstream of the islands and braided channels and appears to be a quiescent settling area for sediments. Compared to other west Florida estuaries (Figure 3-11), the results suggest that percent of organic content in the Anclote River is generally typical, but there is a very slight increase near the mouth compared to other estuaries.
Figure 3-10. Percent Silt/Clay and percent organics by river kilometer
Fraction
-4 0 4 8 12 16 20
River Kilometer
0
10
20
30
40
50
60
Mea
n P
erce
nt
Silt
+ C
lay
0
5
10
15
20
25
Pe
rcen
tO
rga
nic
An
cl_
Sed
.grf
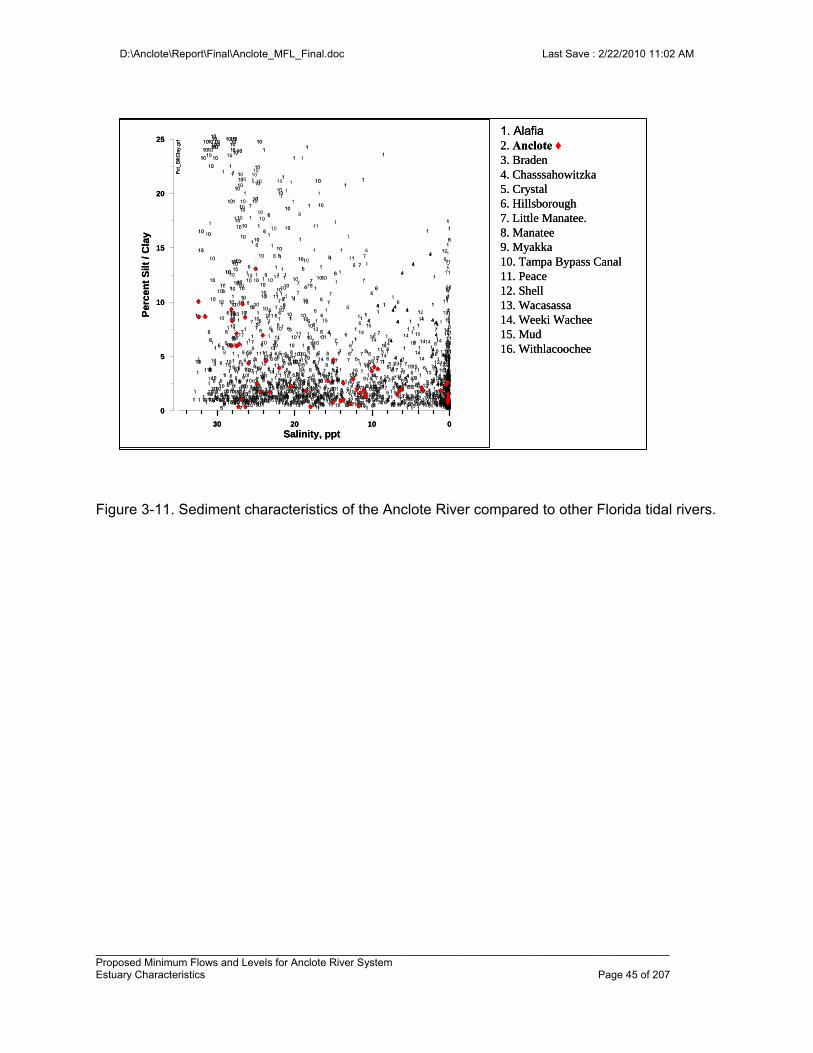
D:\Anclote\Report\Final\Anclote_MFL_Final.doc Last Save : 2/22/2010 11:02 AM
_________________________________________________________________________________________________ Proposed Minimum Flows and Levels for Anclote River System Estuary Characteristics Page 45 of 207
Figure 3-11. Sediment characteristics of the Anclote River compared to other Florida tidal rivers.
30 20 10 0
Salinity, ppt
1
11
1
1
1
1
111
1
1
1
1
1
1
1
1
1
1
1
111
1
1
11 11
11
11
1
11
11
1
1
1
1
1
1
11
1
1
1
1
1
1
1
1
1
1
1
1
111 1 1 1
1
1
1
1
1
1
1
1
1
1
1
1
1
1
1
1
11
1
1
11
1
1
11
1
1
1
11
1
1
1
1 1
1
1 11
1
1111
1
1
1
11
1 1
1
1
1
111
11
1
11
1
111
1
1
1
1
1
1
1
1
11
1 11
1
1
1
1
11
11
1
1
1
1
1
1
1
1
11
1
1
1
1
1
1
1
1
1
1
1
1
1
1
1
1
1
1
11
1
1
1
1
1
1
1
1
1
11 1
1
1 1 1
1
1
1
1
111
1
1
1
1
1
1
1
1
11
1
1
1
1
1
1
1
1
1
1
1
1 1
1
1
1
1
1
1
1
1
1
1
1
1
11 11 11
1
11
1
1
1
1 1
1
1
1
1
11
1
111
1
1
1
1
1
11
1
1
1
1
1
1
1
1
1
11
1
1
1
1
11
1
1
11
1
1
1
1
1
11
1
1
1
1
1
1
1
1
1
1
11
1
1
1
11 1
11 1 1
1
1
1
1
1 1
1
1
1
11
1
1
1
1
1
1
1
11
1
1
1
1
11 1
1
1
1
1
1
1
1
1
1
1
1
1
11
1
111
1
1
1
1
1
1
1
1
1
1
1
1
11
11
1
1
1
1
1
1
1
111
1
11
1
1
1
111
1
1
1
1
1
1
1
1
1
1
1
1
1
1
1
11
1
111
1111
1
1 1
1
1 1
1
11
1
1
11
11
1
1
1
1
11
1
1
11
1
1
1
1
1
1
1
1
1 1
1
1
1
1 11
1
1
1
1
1
11
1 1
11 1
1
1 1111
1
1 11
1
1
111111111
1
1 11111
1
1 1
1
1 1
11 11 111
1 1
1
1
11
1
111
1
1 11 1
1
1
11
1
1
1111
1
1
1
1
1
11 111 1
1
1
1
11
11
11
11
1
1
1
1
1
1
1 1
11111
1
1111
1
1
1
11111
1
1
1 1
1
11111
1
1
11
1
1
1
1
1
1
1
1
1
1
1
1
11
1
1
1
1
1
1
1
11
1
1
1
1
1
1
1
1
1
1
1
1
1
1
1
1
1
11
1
1
1
1
11
111
1
1111
1
11
1
1
1
1
1
1
11
111
1
11
1
1
11
1
1
1
1111
1
1
1
1
1
1 11
1
1
1
11111
1
1
1
11
1
1
11
1
111
1
1
1
111 1
11
1
1111
111
1
11
1
11 1
1111
11
111
1
1
1111111
1
1111
11111
111
1
111111
1
1
111
1
1
1111111111
11
11
111111
11
11
1
1
1
1
11
11
111
2
2 2
2
22
2
2 222
222
22
2
2 2
2
2
2 22
2
2 2
2
22
222
2
2 2
22
22222
2
2
2
2
2
2
2
2
2
2
2
2
2
2
2
3
33
3
3
3
3
3
3
3
33
33333
3
3
3
3
3
3
3 33
3
3 3
3
3
3
3 333
33
44
44
44 44
44
44
44
4444
44
44
44
44
44
44
44
44 44
44
44
44
44
44
44
44
4444
44
5
5
5
55
5
55
6
6
6
66
6
6
6
6
6
6
6
66
6
6
66
6
6
6
6
6
6
6
6
6 6
6
6
6
6
6
6
6
6
6
6
6
6
6
6
6
6
6
6
6
6
6
6
6
6
6
6
66
666 6 6
6
6
6
6
6
6
6
6
6
6
6
6
6
6
6
6
6
6
6
6
6 6
6
6
6 6
6
66
6
6
6
6
6
6
6
6
6 6
6
6
6
6
6
6
6
6
6
6
6
6
66
6
6
6
6
6
6
6
666
6
6
6
6
6
6
6
6
6
6
66
66
6
6 6
6
6
6
6
6 6
6
6
6
6
66
6
6
6
6
6
6
6
6 6 6
6
6
6
66
6
6
6
6
6
6
6
6
6
6
666
6
6
6
6
6
6
6 6 6
6
6
6
6 6 66 66 6
6
66
6
6
66 66
6
6
6
6
6
6
6
6
6
6
6
6
6
6
6
6
6
66
66
6
6
6
6
6 6 66
6
6
6
6
6
666
6
6
6
6
6
6
6
66666
6
6
66 66
6666666 6 6 66
6 6666
66
6
6
66
6 6
66666
6 66
6
6
666666666
6
66666666
6
6
6
6
6
66
6
6
66
6
7 7
777
7
7
77
77
77
7
7
7
7
7
7
7
7
7
7
7
7
77
77
7
7
7
7
777
7
7
77
7
77
77
7
7
777
7
7
7
777
7
7
77
7
77
77
7
777
7
7
7
7
7 77
7
7
7
7
7
77
7
7
777
77
7 7
7
7
7
77
7
7
77
7
77
77
7
7
7
77
7
7
77
7
77
777
7
7
7
7
7
7
7
7
77
7
7
7
7
7
7
7
7
7
7
7
7
7
7
7
7
7
7
77
77
7
7
7
7
7
7
7
7
7
7
7
7
7
77 7
7
7
77
777
77
77
7
77
7
777
7
77
777
7
77
7
7777
7
777
7
7
7
7
7
7
7
7
7 7
7
7
7
7
7
7 7
7
7
77
7
7
7
7
7
8
88
88
8 8
888
8888
88
88
8888
8888
88
8888
8
8
8
8
8
8
8
8
8
88
8 8
8
88
8
8
88
8
8 88
8
8
8
8 8
8 88
8
8
8
8 888
8
88
8
8
8 8
8
8
8 8 8
8
8 8
88
8
8
8
8
88
8
8
8
88 8
8
88
88
8 8 8
8
8
8
8 888
8
8
88
88 8888 888888
8888
88
8
8
8
8
8
8
8
8
8
8
8
8
8
8
8
8
8
8
888
8
8
88
8
888888888
8
88888888
88
8
8
8
8
8
8 8
8
8
8
88
8
88
8
8
8
8
8 888
8
8
88 88888
8
9 9
9
9
9
9
9
9 9
99
9
9
9
9
9
9
9 9
9
9
9
9
9
99 9
9
9
9
9 9
9
9
9
9
9
9
9
9
999
9
991010 10
10101010
10
10
10
10
10
10
10
10
10
10
1010
10
10
10
10
1010 10
1010
10
10
10
10
10 10
10
1010
10
10
10
10
10 101010
10
10
10
10
10
10
10
10
10
10
10
10
10 10
10
10
10
10
1010
10
10
10
10
10
10
10
10
1010
1010
10
101010
10
10
10
10
10
10
10
10
10
10
10
10
10
10
1010
10
10
10
10
10
10
10
10
10
1010
1010
10
10
10
10
10
10
10
1010
10
10
10
10
10
10
1010
10
1010
10
10
10
10
10
10
10
10
10
10
10
10
10
10
10
10
10
10
101010
10
10
10
10
10
10
10
10
10
10
10
10
10
10
10
10
10
10
10
10
1010
10
10
10
10 10
10
10
10
10
1010
10
10
10
10
10
10
10
10
10
10
10
10
10 10
10
10
10
1010
10
1010
10
10 101010
10101010
10
10
10
10
10
10
10
1010
10
10
10
10
10
10
10
10
10
10
10
10
10
10
10
10
10
10
10
1010
10
10
10
10
10
10
10
10
10
10
10
10
10
10
10
10
10
10
1010
10 10
10
10
10
10
10
1010
10
10
10
10
10
10
10
10
10
10
10
10
10
10
10
10
11
11
11
1111
1111
1111
11
11111111111111
11
11
11
11
11
11
11
11
11
11
11
11
11
11
1111
11
11
11 111111
1111
11
11
11
11
11
11
11
11
11
11 1111
1111
11111111
11
11
11
11
11
11
11
11
11
11
11
11
11
11
11
1111
11
1111
11
11
1111
11
11
11
11
11
12
1212
12
12
12
12
12
12
12
12 12
12
1212
1212
12
12
12
12
12
12
1212
1313
13
13 13
13
13
13
14
1414
14
1414
14
14
14
1414 14
14
14
14
14
14 14
14
14
14
14
1414
14
14
14
1414
14
14
14
14
14
141414
14
1414
15
15
15
15
15
15
15
1515
1616
1616 16
1616
16
0
5
10
15
20
25P
erce
nt
Silt
/ C
lay
Pct
_Silt
Cla
y.gr
f
1. Alafia2. Anclote ♦3. Braden4. Chasssahowitzka5. Crystal6. Hillsborough7. Little Manatee.8. Manatee 9. Myakka10. Tampa Bypass Canal11. Peace12. Shell13. Wacasassa14. Weeki Wachee15. Mud16. Withlacoochee
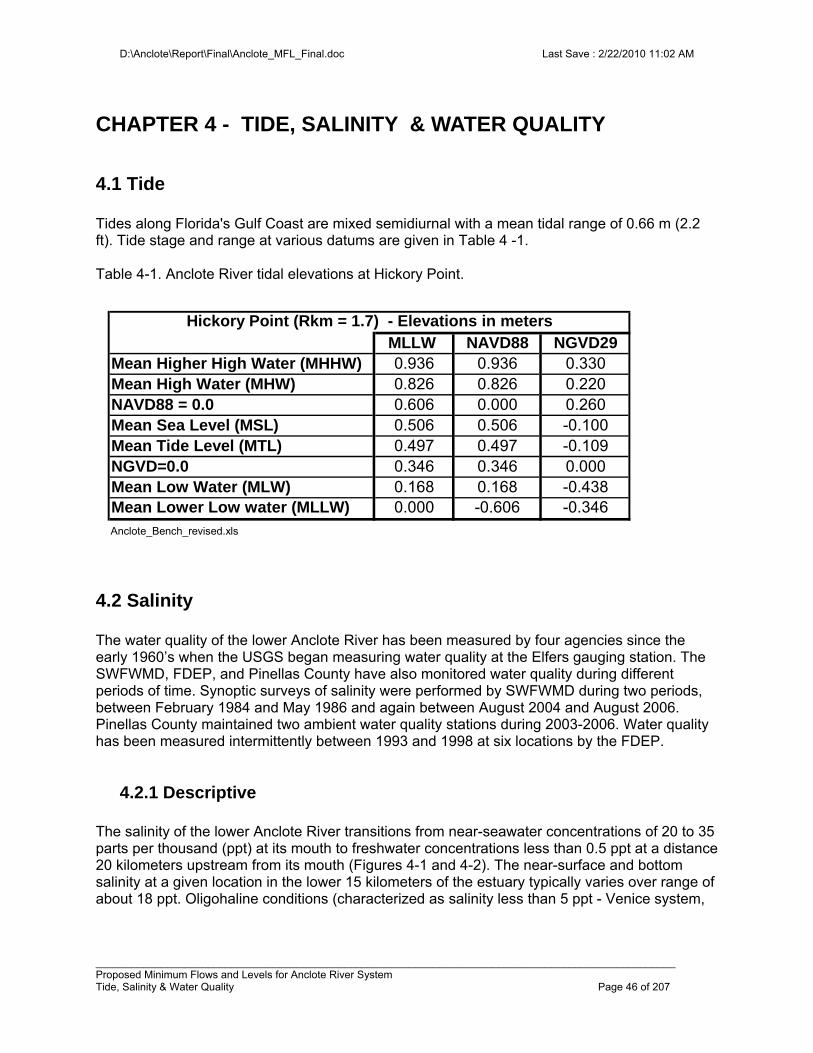
D:\Anclote\Report\Final\Anclote_MFL_Final.doc Last Save : 2/22/2010 11:02 AM
__________________________________________________________________________________________________ Proposed Minimum Flows and Levels for Anclote River System Tide, Salinity & Water Quality Page 46 of 207
CHAPTER 4 - TIDE, SALINITY & WATER QUALITY
4.1 Tide Tides along Florida's Gulf Coast are mixed semidiurnal with a mean tidal range of 0.66 m (2.2 ft). Tide stage and range at various datums are given in Table 4 -1. Table 4-1. Anclote River tidal elevations at Hickory Point.
4.2 Salinity The water quality of the lower Anclote River has been measured by four agencies since the early 1960’s when the USGS began measuring water quality at the Elfers gauging station. The SWFWMD, FDEP, and Pinellas County have also monitored water quality during different periods of time. Synoptic surveys of salinity were performed by SWFWMD during two periods, between February 1984 and May 1986 and again between August 2004 and August 2006. Pinellas County maintained two ambient water quality stations during 2003-2006. Water quality has been measured intermittently between 1993 and 1998 at six locations by the FDEP.
4.2.1 Descriptive The salinity of the lower Anclote River transitions from near-seawater concentrations of 20 to 35 parts per thousand (ppt) at its mouth to freshwater concentrations less than 0.5 ppt at a distance 20 kilometers upstream from its mouth (Figures 4-1 and 4-2). The near-surface and bottom salinity at a given location in the lower 15 kilometers of the estuary typically varies over range of about 18 ppt. Oligohaline conditions (characterized as salinity less than 5 ppt - Venice system,
MLLW NAVD88 NGVD29Mean Higher High Water (MHHW) 0.936 0.936 0.330Mean High Water (MHW) 0.826 0.826 0.220NAVD88 = 0.0 0.606 0.000 0.260Mean Sea Level (MSL) 0.506 0.506 -0.100Mean Tide Level (MTL) 0.497 0.497 -0.109NGVD=0.0 0.346 0.346 0.000Mean Low Water (MLW) 0.168 0.168 -0.438Mean Lower Low water (MLLW) 0.000 -0.606 -0.346Anclote_Bench_revised.xls
Hickory Point (Rkm = 1.7) - Elevations in meters
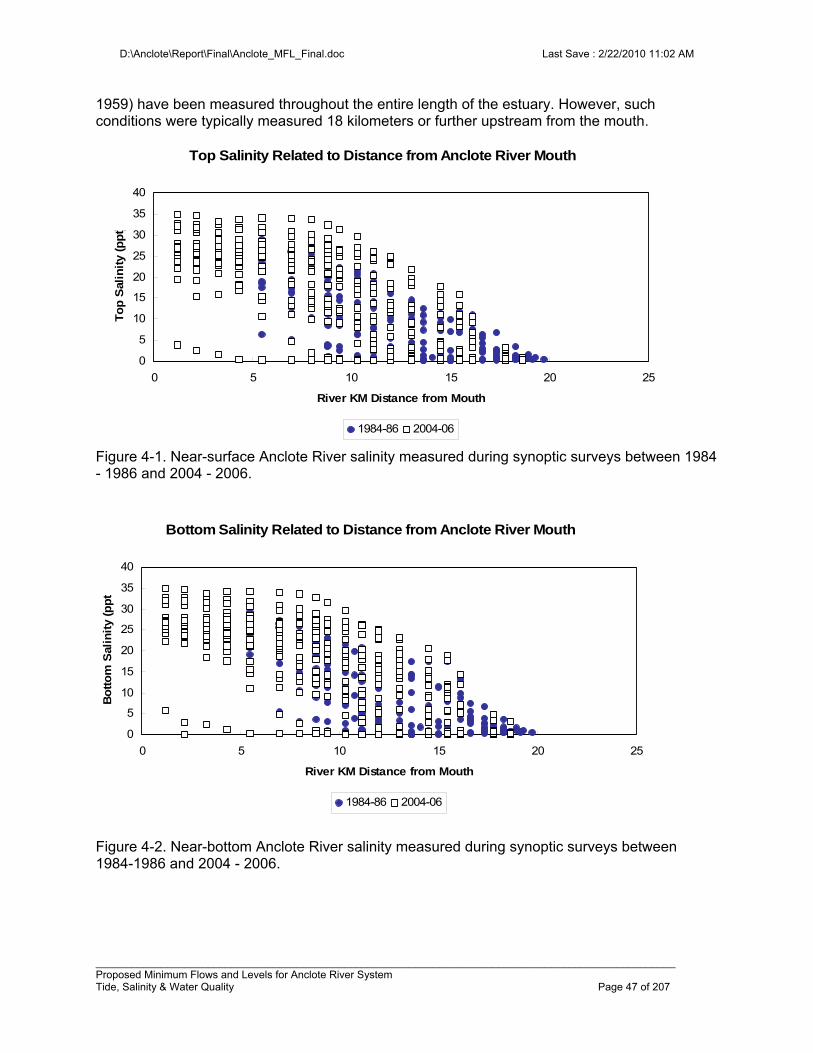
D:\Anclote\Report\Final\Anclote_MFL_Final.doc Last Save : 2/22/2010 11:02 AM
__________________________________________________________________________________________________ Proposed Minimum Flows and Levels for Anclote River System Tide, Salinity & Water Quality Page 47 of 207
1959) have been measured throughout the entire length of the estuary. However, such conditions were typically measured 18 kilometers or further upstream from the mouth.
Figure 4-1. Near-surface Anclote River salinity measured during synoptic surveys between 1984 - 1986 and 2004 - 2006.
Figure 4-2. Near-bottom Anclote River salinity measured during synoptic surveys between 1984-1986 and 2004 - 2006.
Top Salinity Related to Distance from Anclote River Mouth
0
5
10
15
20
25
30
35
40
0 5 10 15 20 25
River KM Distance from Mouth
To
p S
alin
ity
(pp
t)
1984-86 2004-06
Bottom Salinity Related to Distance from Anclote River Mouth
0
5
10
15
20
25
30
35
40
0 5 10 15 20 25
River KM Distance from Mouth
Bo
tto
m S
alin
ity
(pp
t
1984-86 2004-06
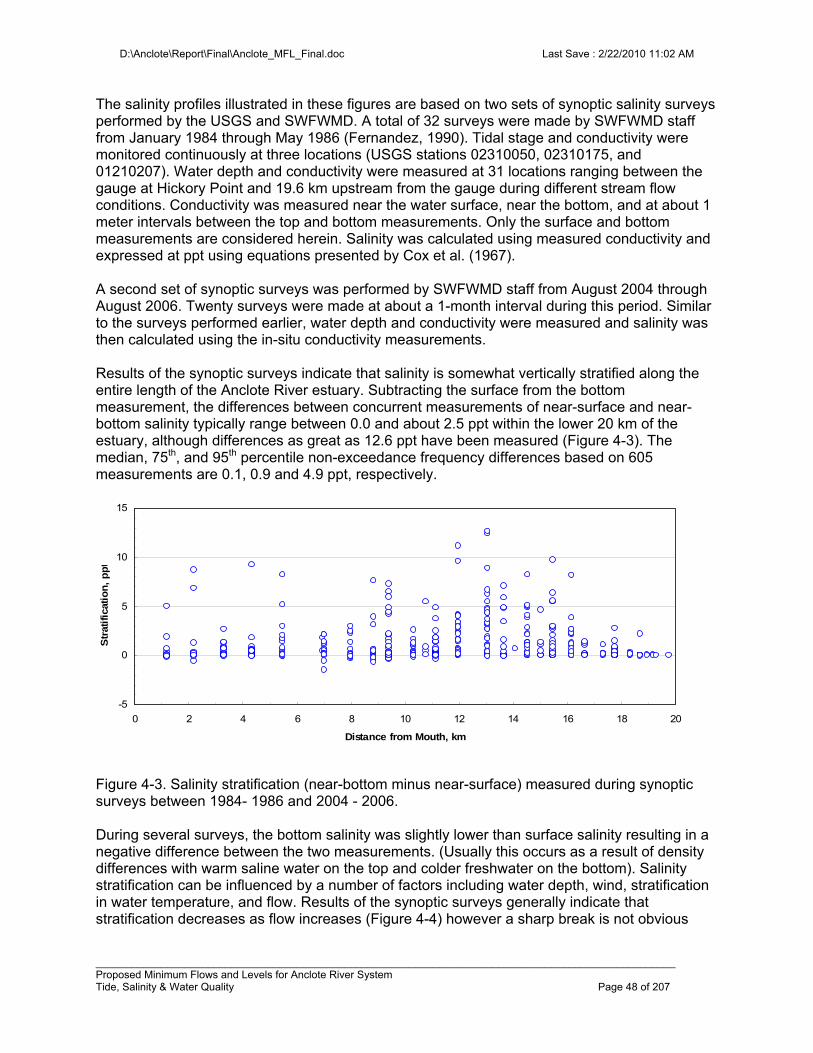
D:\Anclote\Report\Final\Anclote_MFL_Final.doc Last Save : 2/22/2010 11:02 AM
__________________________________________________________________________________________________ Proposed Minimum Flows and Levels for Anclote River System Tide, Salinity & Water Quality Page 48 of 207
The salinity profiles illustrated in these figures are based on two sets of synoptic salinity surveys performed by the USGS and SWFWMD. A total of 32 surveys were made by SWFWMD staff from January 1984 through May 1986 (Fernandez, 1990). Tidal stage and conductivity were monitored continuously at three locations (USGS stations 02310050, 02310175, and 01210207). Water depth and conductivity were measured at 31 locations ranging between the gauge at Hickory Point and 19.6 km upstream from the gauge during different stream flow conditions. Conductivity was measured near the water surface, near the bottom, and at about 1 meter intervals between the top and bottom measurements. Only the surface and bottom measurements are considered herein. Salinity was calculated using measured conductivity and expressed at ppt using equations presented by Cox et al. (1967). A second set of synoptic surveys was performed by SWFWMD staff from August 2004 through August 2006. Twenty surveys were made at about a 1-month interval during this period. Similar to the surveys performed earlier, water depth and conductivity were measured and salinity was then calculated using the in-situ conductivity measurements. Results of the synoptic surveys indicate that salinity is somewhat vertically stratified along the entire length of the Anclote River estuary. Subtracting the surface from the bottom measurement, the differences between concurrent measurements of near-surface and near-bottom salinity typically range between 0.0 and about 2.5 ppt within the lower 20 km of the estuary, although differences as great as 12.6 ppt have been measured (Figure 4-3). The median, 75th, and 95th percentile non-exceedance frequency differences based on 605 measurements are 0.1, 0.9 and 4.9 ppt, respectively.
Figure 4-3. Salinity stratification (near-bottom minus near-surface) measured during synoptic surveys between 1984- 1986 and 2004 - 2006. During several surveys, the bottom salinity was slightly lower than surface salinity resulting in a negative difference between the two measurements. (Usually this occurs as a result of density differences with warm saline water on the top and colder freshwater on the bottom). Salinity stratification can be influenced by a number of factors including water depth, wind, stratification in water temperature, and flow. Results of the synoptic surveys generally indicate that stratification decreases as flow increases (Figure 4-4) however a sharp break is not obvious
-5
0
5
10
15
0 2 4 6 8 10 12 14 16 18 20
Distance from Mouth, km
Str
atif
icat
ion
, p
pt
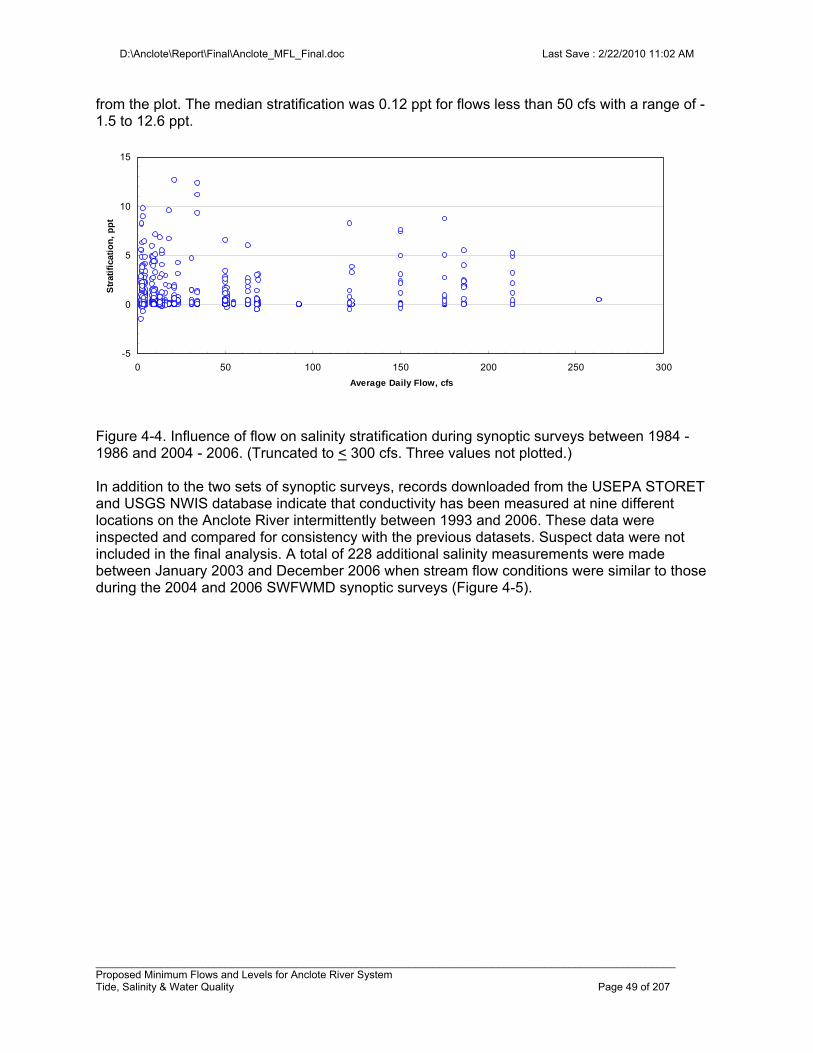
D:\Anclote\Report\Final\Anclote_MFL_Final.doc Last Save : 2/22/2010 11:02 AM
__________________________________________________________________________________________________ Proposed Minimum Flows and Levels for Anclote River System Tide, Salinity & Water Quality Page 49 of 207
from the plot. The median stratification was 0.12 ppt for flows less than 50 cfs with a range of -1.5 to 12.6 ppt.
Figure 4-4. Influence of flow on salinity stratification during synoptic surveys between 1984 - 1986 and 2004 - 2006. (Truncated to < 300 cfs. Three values not plotted.) In addition to the two sets of synoptic surveys, records downloaded from the USEPA STORET and USGS NWIS database indicate that conductivity has been measured at nine different locations on the Anclote River intermittently between 1993 and 2006. These data were inspected and compared for consistency with the previous datasets. Suspect data were not included in the final analysis. A total of 228 additional salinity measurements were made between January 2003 and December 2006 when stream flow conditions were similar to those during the 2004 and 2006 SWFWMD synoptic surveys (Figure 4-5).
-5
0
5
10
15
0 50 100 150 200 250 300
Average Daily Flow, cfs
Str
atif
icat
ion
, p
pt
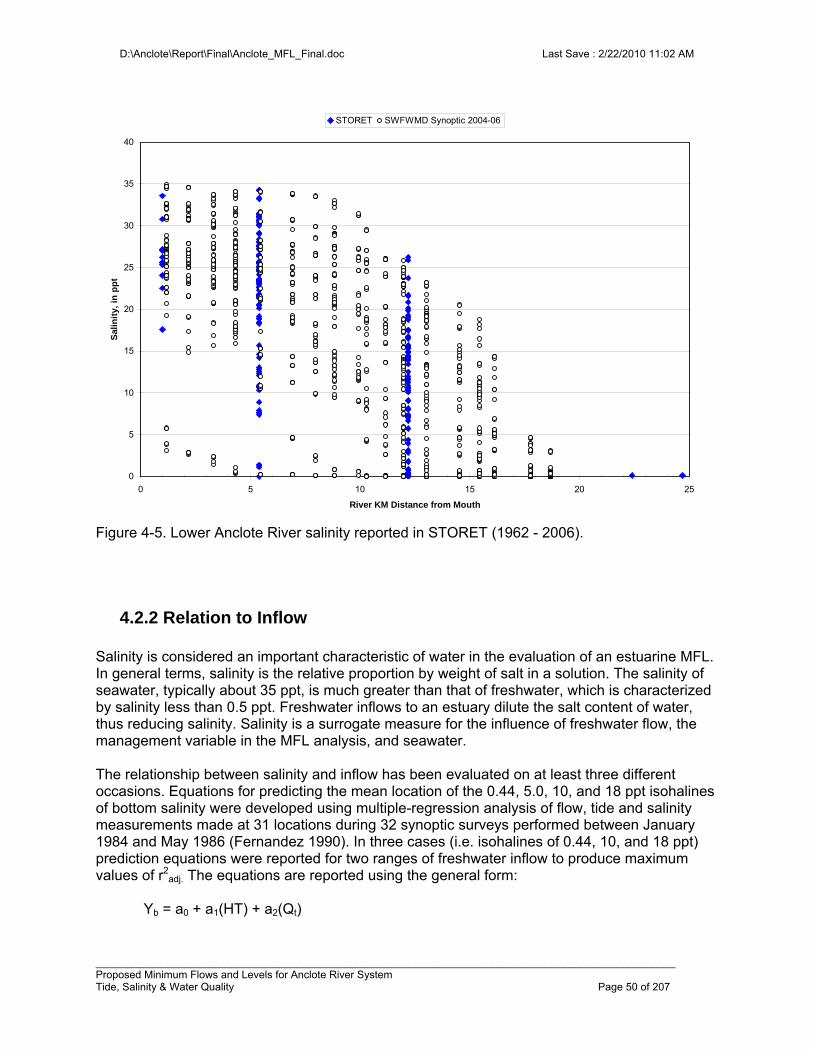
D:\Anclote\Report\Final\Anclote_MFL_Final.doc Last Save : 2/22/2010 11:02 AM
__________________________________________________________________________________________________ Proposed Minimum Flows and Levels for Anclote River System Tide, Salinity & Water Quality Page 50 of 207
Figure 4-5. Lower Anclote River salinity reported in STORET (1962 - 2006).
4.2.2 Relation to Inflow Salinity is considered an important characteristic of water in the evaluation of an estuarine MFL. In general terms, salinity is the relative proportion by weight of salt in a solution. The salinity of seawater, typically about 35 ppt, is much greater than that of freshwater, which is characterized by salinity less than 0.5 ppt. Freshwater inflows to an estuary dilute the salt content of water, thus reducing salinity. Salinity is a surrogate measure for the influence of freshwater flow, the management variable in the MFL analysis, and seawater. The relationship between salinity and inflow has been evaluated on at least three different occasions. Equations for predicting the mean location of the 0.44, 5.0, 10, and 18 ppt isohalines of bottom salinity were developed using multiple-regression analysis of flow, tide and salinity measurements made at 31 locations during 32 synoptic surveys performed between January 1984 and May 1986 (Fernandez 1990). In three cases (i.e. isohalines of 0.44, 10, and 18 ppt) prediction equations were reported for two ranges of freshwater inflow to produce maximum values of r2
adj. The equations are reported using the general form:
Yb = a0 + a1(HT) + a2(Qt)
0
5
10
15
20
25
30
35
40
0 5 10 15 20 25
River KM Distance from Mouth
Sal
init
y, i
n p
pt
STORET SWFWMD Synoptic 2004-06
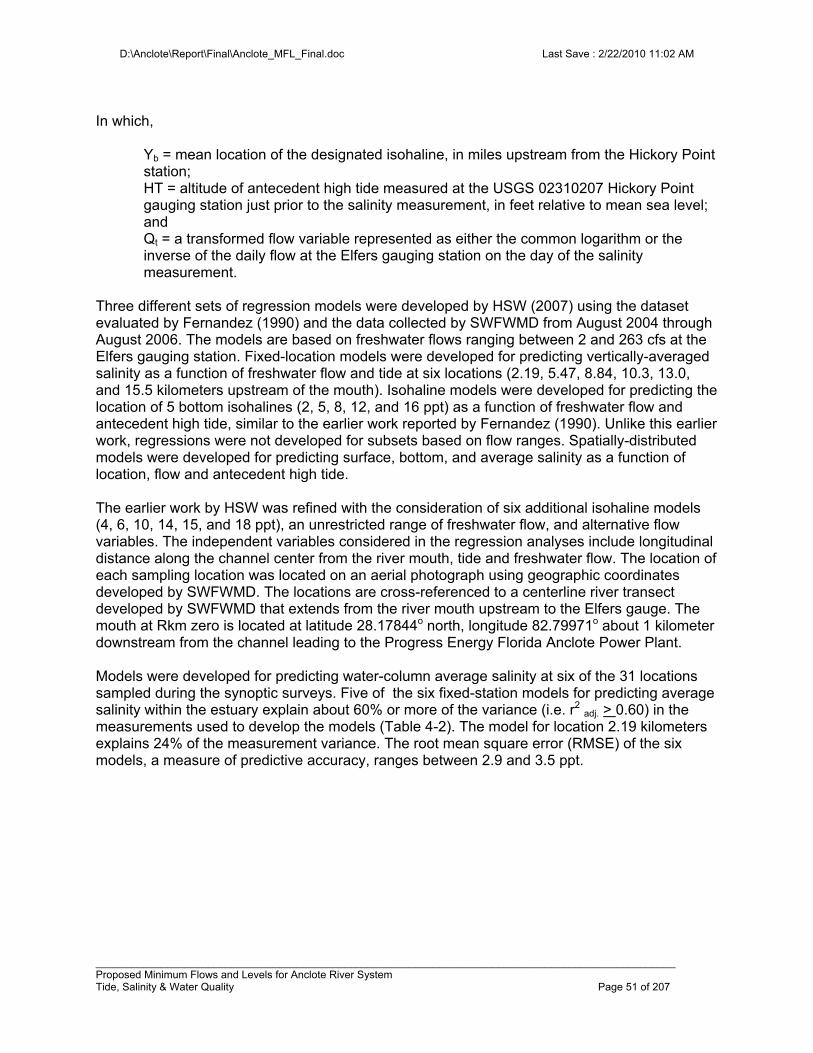
D:\Anclote\Report\Final\Anclote_MFL_Final.doc Last Save : 2/22/2010 11:02 AM
__________________________________________________________________________________________________ Proposed Minimum Flows and Levels for Anclote River System Tide, Salinity & Water Quality Page 51 of 207
In which,
Yb = mean location of the designated isohaline, in miles upstream from the Hickory Point station; HT = altitude of antecedent high tide measured at the USGS 02310207 Hickory Point gauging station just prior to the salinity measurement, in feet relative to mean sea level; and Qt = a transformed flow variable represented as either the common logarithm or the inverse of the daily flow at the Elfers gauging station on the day of the salinity measurement.
Three different sets of regression models were developed by HSW (2007) using the dataset evaluated by Fernandez (1990) and the data collected by SWFWMD from August 2004 through August 2006. The models are based on freshwater flows ranging between 2 and 263 cfs at the Elfers gauging station. Fixed-location models were developed for predicting vertically-averaged salinity as a function of freshwater flow and tide at six locations (2.19, 5.47, 8.84, 10.3, 13.0, and 15.5 kilometers upstream of the mouth). Isohaline models were developed for predicting the location of 5 bottom isohalines (2, 5, 8, 12, and 16 ppt) as a function of freshwater flow and antecedent high tide, similar to the earlier work reported by Fernandez (1990). Unlike this earlier work, regressions were not developed for subsets based on flow ranges. Spatially-distributed models were developed for predicting surface, bottom, and average salinity as a function of location, flow and antecedent high tide. The earlier work by HSW was refined with the consideration of six additional isohaline models (4, 6, 10, 14, 15, and 18 ppt), an unrestricted range of freshwater flow, and alternative flow variables. The independent variables considered in the regression analyses include longitudinal distance along the channel center from the river mouth, tide and freshwater flow. The location of each sampling location was located on an aerial photograph using geographic coordinates developed by SWFWMD. The locations are cross-referenced to a centerline river transect developed by SWFWMD that extends from the river mouth upstream to the Elfers gauge. The mouth at Rkm zero is located at latitude 28.17844o north, longitude 82.79971o about 1 kilometer downstream from the channel leading to the Progress Energy Florida Anclote Power Plant. Models were developed for predicting water-column average salinity at six of the 31 locations sampled during the synoptic surveys. Five of the six fixed-station models for predicting average salinity within the estuary explain about 60% or more of the variance (i.e. r2 adj. > 0.60) in the measurements used to develop the models (Table 4-2). The model for location 2.19 kilometers explains 24% of the measurement variance. The root mean square error (RMSE) of the six models, a measure of predictive accuracy, ranges between 2.9 and 3.5 ppt.
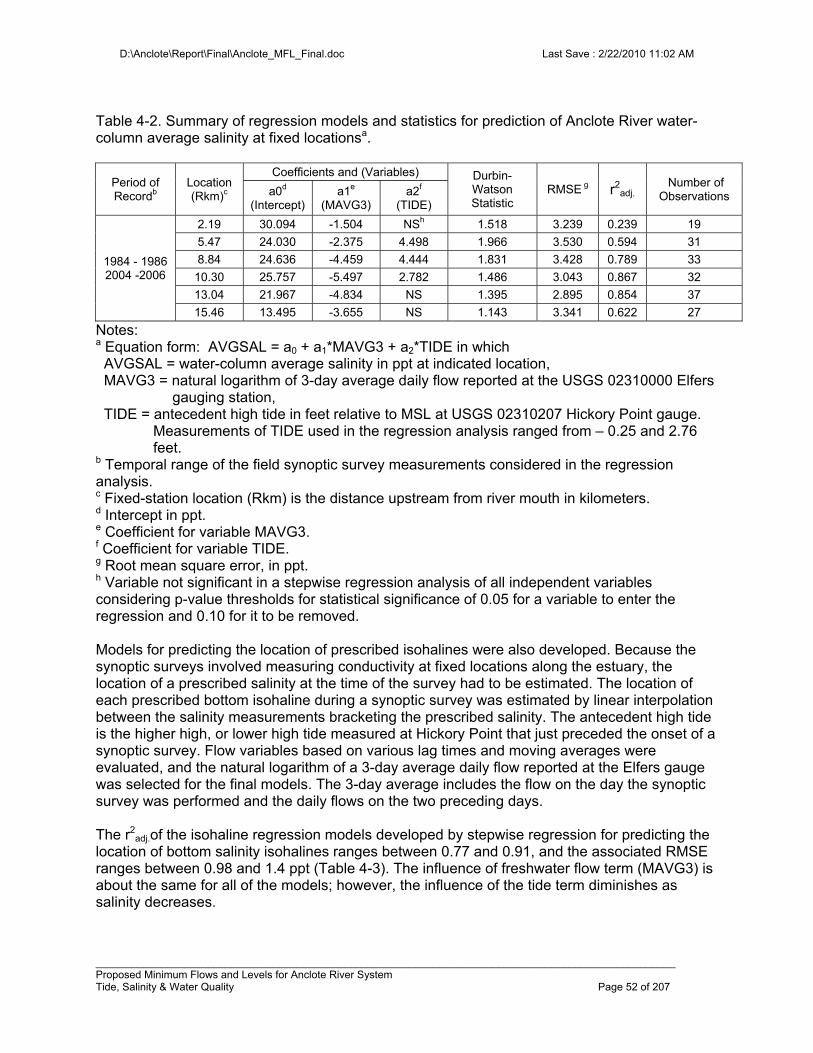
D:\Anclote\Report\Final\Anclote_MFL_Final.doc Last Save : 2/22/2010 11:02 AM
__________________________________________________________________________________________________ Proposed Minimum Flows and Levels for Anclote River System Tide, Salinity & Water Quality Page 52 of 207
Table 4-2. Summary of regression models and statistics for prediction of Anclote River water-column average salinity at fixed locationsa.
Period of Recordb
Location (Rkm)c
Coefficients and (Variables) Durbin-Watson Statistic
RMSE g r2adj.
Number of Observations a0d
(Intercept) a1e
(MAVG3) a2f
(TIDE)
1984 - 1986 2004 -2006
2.19 30.094 -1.504 NSh 1.518 3.239 0.239 19
5.47 24.030 -2.375 4.498 1.966 3.530 0.594 31
8.84 24.636 -4.459 4.444 1.831 3.428 0.789 33
10.30 25.757 -5.497 2.782 1.486 3.043 0.867 32
13.04 21.967 -4.834 NS 1.395 2.895 0.854 37
15.46 13.495 -3.655 NS 1.143 3.341 0.622 27
Notes: a Equation form: AVGSAL = a0 + a1*MAVG3 + a2*TIDE in which AVGSAL = water-column average salinity in ppt at indicated location, MAVG3 = natural logarithm of 3-day average daily flow reported at the USGS 02310000 Elfers
gauging station, TIDE = antecedent high tide in feet relative to MSL at USGS 02310207 Hickory Point gauge.
Measurements of TIDE used in the regression analysis ranged from – 0.25 and 2.76 feet.
b Temporal range of the field synoptic survey measurements considered in the regression analysis. c Fixed-station location (Rkm) is the distance upstream from river mouth in kilometers. d Intercept in ppt. e Coefficient for variable MAVG3. f Coefficient for variable TIDE. g Root mean square error, in ppt. h Variable not significant in a stepwise regression analysis of all independent variables considering p-value thresholds for statistical significance of 0.05 for a variable to enter the regression and 0.10 for it to be removed. Models for predicting the location of prescribed isohalines were also developed. Because the synoptic surveys involved measuring conductivity at fixed locations along the estuary, the location of a prescribed salinity at the time of the survey had to be estimated. The location of each prescribed bottom isohaline during a synoptic survey was estimated by linear interpolation between the salinity measurements bracketing the prescribed salinity. The antecedent high tide is the higher high, or lower high tide measured at Hickory Point that just preceded the onset of a synoptic survey. Flow variables based on various lag times and moving averages were evaluated, and the natural logarithm of a 3-day average daily flow reported at the Elfers gauge was selected for the final models. The 3-day average includes the flow on the day the synoptic survey was performed and the daily flows on the two preceding days. The r2
adj.of the isohaline regression models developed by stepwise regression for predicting the location of bottom salinity isohalines ranges between 0.77 and 0.91, and the associated RMSE ranges between 0.98 and 1.4 ppt (Table 4-3). The influence of freshwater flow term (MAVG3) is about the same for all of the models; however, the influence of the tide term diminishes as salinity decreases.
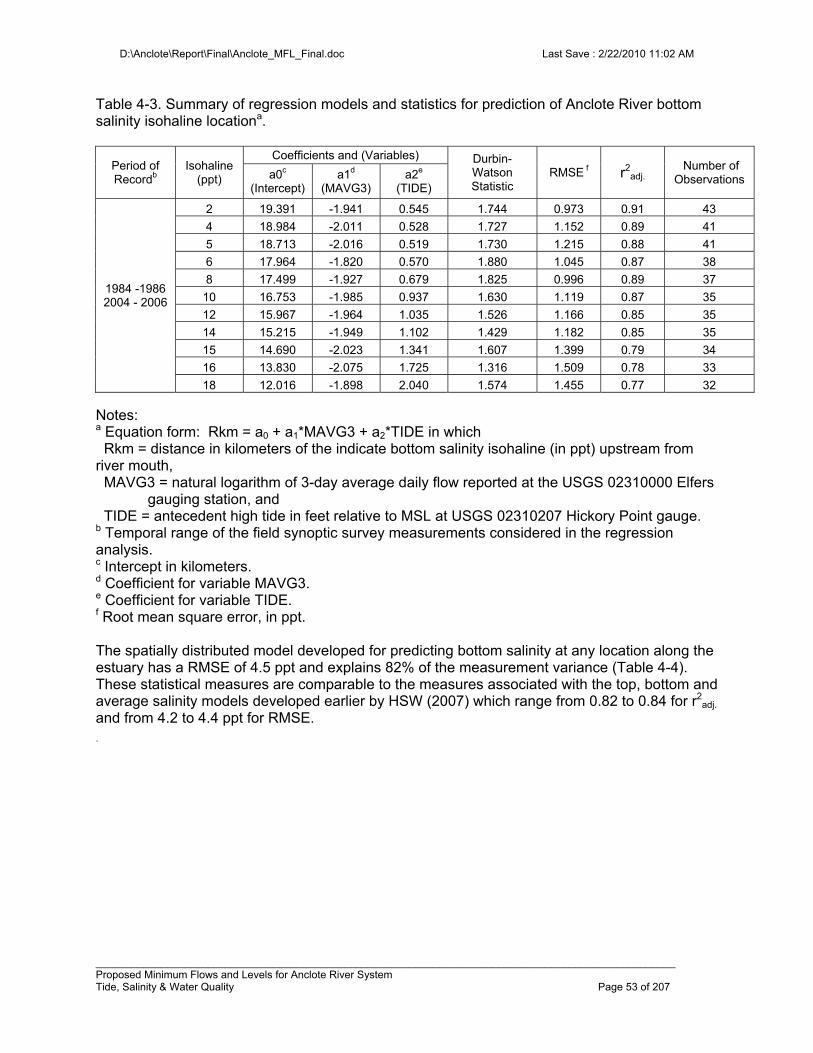
D:\Anclote\Report\Final\Anclote_MFL_Final.doc Last Save : 2/22/2010 11:02 AM
__________________________________________________________________________________________________ Proposed Minimum Flows and Levels for Anclote River System Tide, Salinity & Water Quality Page 53 of 207
Table 4-3. Summary of regression models and statistics for prediction of Anclote River bottom salinity isohaline locationa.
Period of Recordb
Isohaline (ppt)
Coefficients and (Variables) Durbin-Watson Statistic
RMSE f r2adj.
Number of Observations a0c
(Intercept) a1d
(MAVG3) a2e
(TIDE)
1984 -1986 2004 - 2006
2 19.391 -1.941 0.545 1.744 0.973 0.91 43
4 18.984 -2.011 0.528 1.727 1.152 0.89 41
5 18.713 -2.016 0.519 1.730 1.215 0.88 41
6 17.964 -1.820 0.570 1.880 1.045 0.87 38
8 17.499 -1.927 0.679 1.825 0.996 0.89 37
10 16.753 -1.985 0.937 1.630 1.119 0.87 35
12 15.967 -1.964 1.035 1.526 1.166 0.85 35
14 15.215 -1.949 1.102 1.429 1.182 0.85 35
15 14.690 -2.023 1.341 1.607 1.399 0.79 34
16 13.830 -2.075 1.725 1.316 1.509 0.78 33
18 12.016 -1.898 2.040 1.574 1.455 0.77 32 Notes: a Equation form: Rkm = a0 + a1*MAVG3 + a2*TIDE in which Rkm = distance in kilometers of the indicate bottom salinity isohaline (in ppt) upstream from river mouth, MAVG3 = natural logarithm of 3-day average daily flow reported at the USGS 02310000 Elfers
gauging station, and TIDE = antecedent high tide in feet relative to MSL at USGS 02310207 Hickory Point gauge. b Temporal range of the field synoptic survey measurements considered in the regression analysis. c Intercept in kilometers. d Coefficient for variable MAVG3. e Coefficient for variable TIDE. f Root mean square error, in ppt. The spatially distributed model developed for predicting bottom salinity at any location along the estuary has a RMSE of 4.5 ppt and explains 82% of the measurement variance (Table 4-4). These statistical measures are comparable to the measures associated with the top, bottom and average salinity models developed earlier by HSW (2007) which range from 0.82 to 0.84 for r2
adj. and from 4.2 to 4.4 ppt for RMSE. .
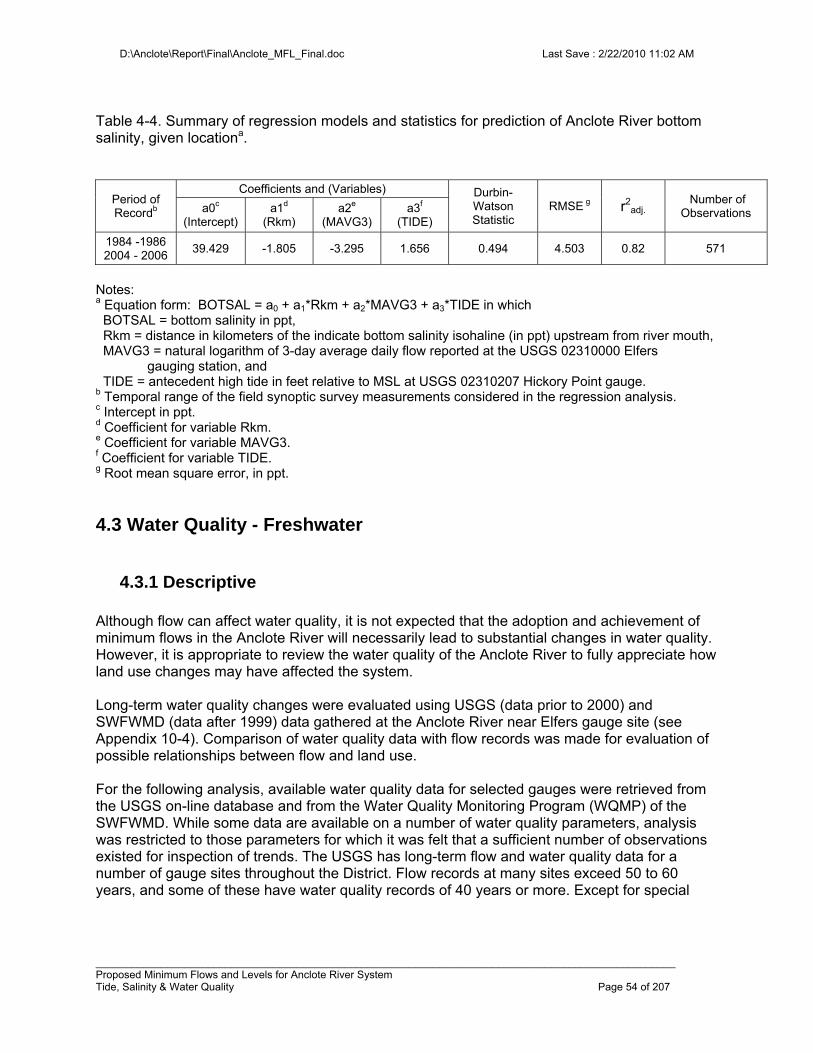
D:\Anclote\Report\Final\Anclote_MFL_Final.doc Last Save : 2/22/2010 11:02 AM
__________________________________________________________________________________________________ Proposed Minimum Flows and Levels for Anclote River System Tide, Salinity & Water Quality Page 54 of 207
Table 4-4. Summary of regression models and statistics for prediction of Anclote River bottom salinity, given locationa.
Period of Recordb
Coefficients and (Variables) Durbin-Watson Statistic
RMSE g r2adj.
Number of Observations a0c
(Intercept) a1d
(Rkm) a2e
(MAVG3) a3f
(TIDE)
1984 -1986 2004 - 2006
39.429 -1.805 -3.295 1.656 0.494 4.503 0.82 571
Notes: a Equation form: BOTSAL = a0 + a1*Rkm + a2*MAVG3 + a3*TIDE in which BOTSAL = bottom salinity in ppt, Rkm = distance in kilometers of the indicate bottom salinity isohaline (in ppt) upstream from river mouth, MAVG3 = natural logarithm of 3-day average daily flow reported at the USGS 02310000 Elfers
gauging station, and TIDE = antecedent high tide in feet relative to MSL at USGS 02310207 Hickory Point gauge. b Temporal range of the field synoptic survey measurements considered in the regression analysis. c Intercept in ppt. d Coefficient for variable Rkm. e Coefficient for variable MAVG3. f Coefficient for variable TIDE. g Root mean square error, in ppt.
4.3 Water Quality - Freshwater
4.3.1 Descriptive Although flow can affect water quality, it is not expected that the adoption and achievement of minimum flows in the Anclote River will necessarily lead to substantial changes in water quality. However, it is appropriate to review the water quality of the Anclote River to fully appreciate how land use changes may have affected the system. Long-term water quality changes were evaluated using USGS (data prior to 2000) and SWFWMD (data after 1999) data gathered at the Anclote River near Elfers gauge site (see Appendix 10-4). Comparison of water quality data with flow records was made for evaluation of possible relationships between flow and land use. For the following analysis, available water quality data for selected gauges were retrieved from the USGS on-line database and from the Water Quality Monitoring Program (WQMP) of the SWFWMD. While some data are available on a number of water quality parameters, analysis was restricted to those parameters for which it was felt that a sufficient number of observations existed for inspection of trends. The USGS has long-term flow and water quality data for a number of gauge sites throughout the District. Flow records at many sites exceed 50 to 60 years, and some of these have water quality records of 40 years or more. Except for special
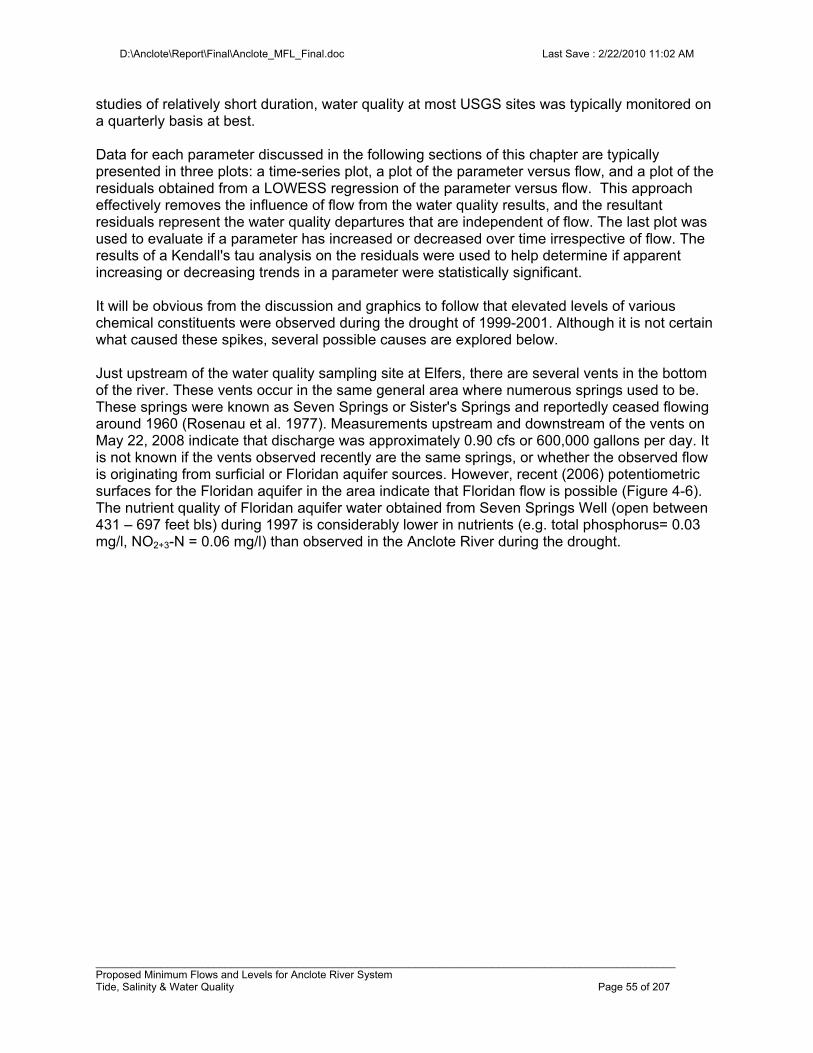
D:\Anclote\Report\Final\Anclote_MFL_Final.doc Last Save : 2/22/2010 11:02 AM
__________________________________________________________________________________________________ Proposed Minimum Flows and Levels for Anclote River System Tide, Salinity & Water Quality Page 55 of 207
studies of relatively short duration, water quality at most USGS sites was typically monitored on a quarterly basis at best. Data for each parameter discussed in the following sections of this chapter are typically presented in three plots: a time-series plot, a plot of the parameter versus flow, and a plot of the residuals obtained from a LOWESS regression of the parameter versus flow. This approach effectively removes the influence of flow from the water quality results, and the resultant residuals represent the water quality departures that are independent of flow. The last plot was used to evaluate if a parameter has increased or decreased over time irrespective of flow. The results of a Kendall's tau analysis on the residuals were used to help determine if apparent increasing or decreasing trends in a parameter were statistically significant. It will be obvious from the discussion and graphics to follow that elevated levels of various chemical constituents were observed during the drought of 1999-2001. Although it is not certain what caused these spikes, several possible causes are explored below. Just upstream of the water quality sampling site at Elfers, there are several vents in the bottom of the river. These vents occur in the same general area where numerous springs used to be. These springs were known as Seven Springs or Sister's Springs and reportedly ceased flowing around 1960 (Rosenau et al. 1977). Measurements upstream and downstream of the vents on May 22, 2008 indicate that discharge was approximately 0.90 cfs or 600,000 gallons per day. It is not known if the vents observed recently are the same springs, or whether the observed flow is originating from surficial or Floridan aquifer sources. However, recent (2006) potentiometric surfaces for the Floridan aquifer in the area indicate that Floridan flow is possible (Figure 4-6). The nutrient quality of Floridan aquifer water obtained from Seven Springs Well (open between 431 – 697 feet bls) during 1997 is considerably lower in nutrients (e.g. total phosphorus= 0.03 mg/l, NO2+3-N = 0.06 mg/l) than observed in the Anclote River during the drought.
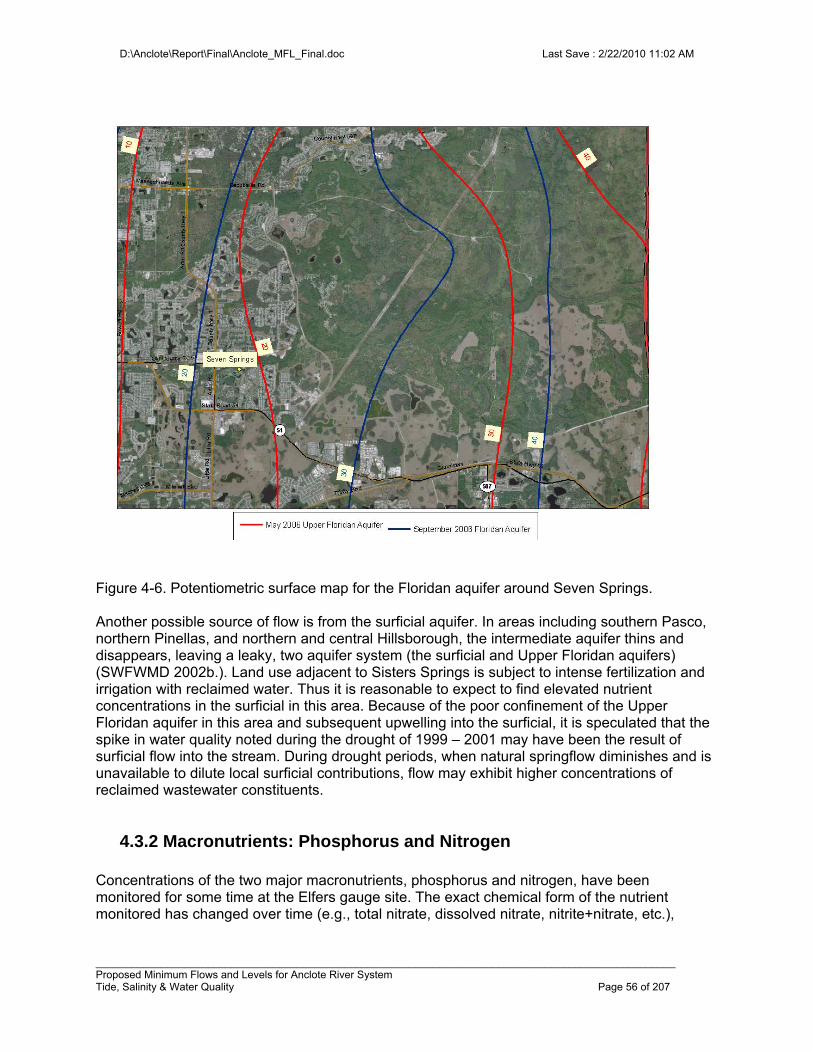
D:\Anclote\Report\Final\Anclote_MFL_Final.doc Last Save : 2/22/2010 11:02 AM
__________________________________________________________________________________________________ Proposed Minimum Flows and Levels for Anclote River System Tide, Salinity & Water Quality Page 56 of 207
Figure 4-6. Potentiometric surface map for the Floridan aquifer around Seven Springs. Another possible source of flow is from the surficial aquifer. In areas including southern Pasco, northern Pinellas, and northern and central Hillsborough, the intermediate aquifer thins and disappears, leaving a leaky, two aquifer system (the surficial and Upper Floridan aquifers) (SWFWMD 2002b.). Land use adjacent to Sisters Springs is subject to intense fertilization and irrigation with reclaimed water. Thus it is reasonable to expect to find elevated nutrient concentrations in the surficial in this area. Because of the poor confinement of the Upper Floridan aquifer in this area and subsequent upwelling into the surficial, it is speculated that the spike in water quality noted during the drought of 1999 – 2001 may have been the result of surficial flow into the stream. During drought periods, when natural springflow diminishes and is unavailable to dilute local surficial contributions, flow may exhibit higher concentrations of reclaimed wastewater constituents.
4.3.2 Macronutrients: Phosphorus and Nitrogen Concentrations of the two major macronutrients, phosphorus and nitrogen, have been monitored for some time at the Elfers gauge site. The exact chemical form of the nutrient monitored has changed over time (e.g., total nitrate, dissolved nitrate, nitrite+nitrate, etc.),
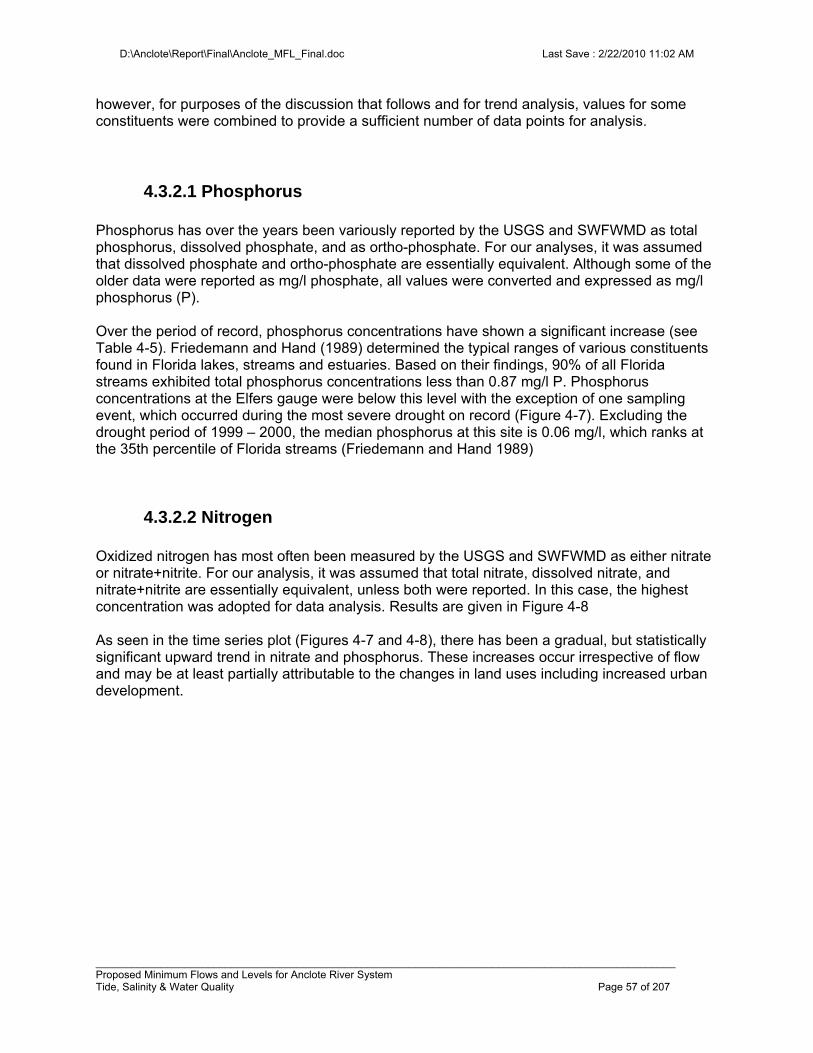
D:\Anclote\Report\Final\Anclote_MFL_Final.doc Last Save : 2/22/2010 11:02 AM
__________________________________________________________________________________________________ Proposed Minimum Flows and Levels for Anclote River System Tide, Salinity & Water Quality Page 57 of 207
however, for purposes of the discussion that follows and for trend analysis, values for some constituents were combined to provide a sufficient number of data points for analysis.
4.3.2.1 Phosphorus Phosphorus has over the years been variously reported by the USGS and SWFWMD as total phosphorus, dissolved phosphate, and as ortho-phosphate. For our analyses, it was assumed that dissolved phosphate and ortho-phosphate are essentially equivalent. Although some of the older data were reported as mg/l phosphate, all values were converted and expressed as mg/l phosphorus (P). Over the period of record, phosphorus concentrations have shown a significant increase (see Table 4-5). Friedemann and Hand (1989) determined the typical ranges of various constituents found in Florida lakes, streams and estuaries. Based on their findings, 90% of all Florida streams exhibited total phosphorus concentrations less than 0.87 mg/l P. Phosphorus concentrations at the Elfers gauge were below this level with the exception of one sampling event, which occurred during the most severe drought on record (Figure 4-7). Excluding the drought period of 1999 – 2000, the median phosphorus at this site is 0.06 mg/l, which ranks at the 35th percentile of Florida streams (Friedemann and Hand 1989)
4.3.2.2 Nitrogen Oxidized nitrogen has most often been measured by the USGS and SWFWMD as either nitrate or nitrate+nitrite. For our analysis, it was assumed that total nitrate, dissolved nitrate, and nitrate+nitrite are essentially equivalent, unless both were reported. In this case, the highest concentration was adopted for data analysis. Results are given in Figure 4-8 As seen in the time series plot (Figures 4-7 and 4-8), there has been a gradual, but statistically significant upward trend in nitrate and phosphorus. These increases occur irrespective of flow and may be at least partially attributable to the changes in land uses including increased urban development.
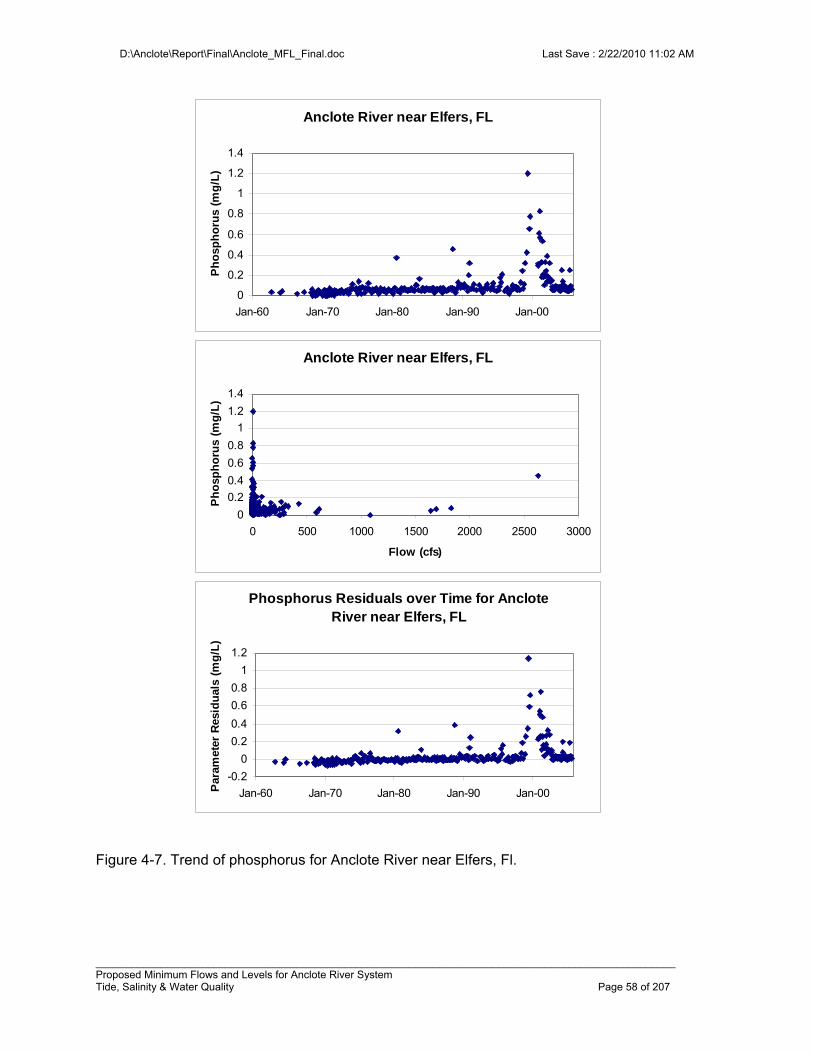
D:\Anclote\Report\Final\Anclote_MFL_Final.doc Last Save : 2/22/2010 11:02 AM
__________________________________________________________________________________________________ Proposed Minimum Flows and Levels for Anclote River System Tide, Salinity & Water Quality Page 58 of 207
Figure 4-7. Trend of phosphorus for Anclote River near Elfers, Fl.
Anclote River near Elfers, FL
0
0.2
0.4
0.6
0.8
1
1.2
1.4
0 500 1000 1500 2000 2500 3000
Flow (cfs)
Ph
osp
ho
rus
(mg
/L)
Phosphorus Residuals over Time for Anclote River near Elfers, FL
-0.2
0
0.2
0.4
0.6
0.8
1
1.2
Jan-60 Jan-70 Jan-80 Jan-90 Jan-00Par
amet
er R
esid
ual
s (m
g/L
)
Anclote River near Elfers, FL
0
0.2
0.4
0.6
0.8
1
1.2
1.4
Jan-60 Jan-70 Jan-80 Jan-90 Jan-00
Ph
osp
ho
rus
(mg
/L)
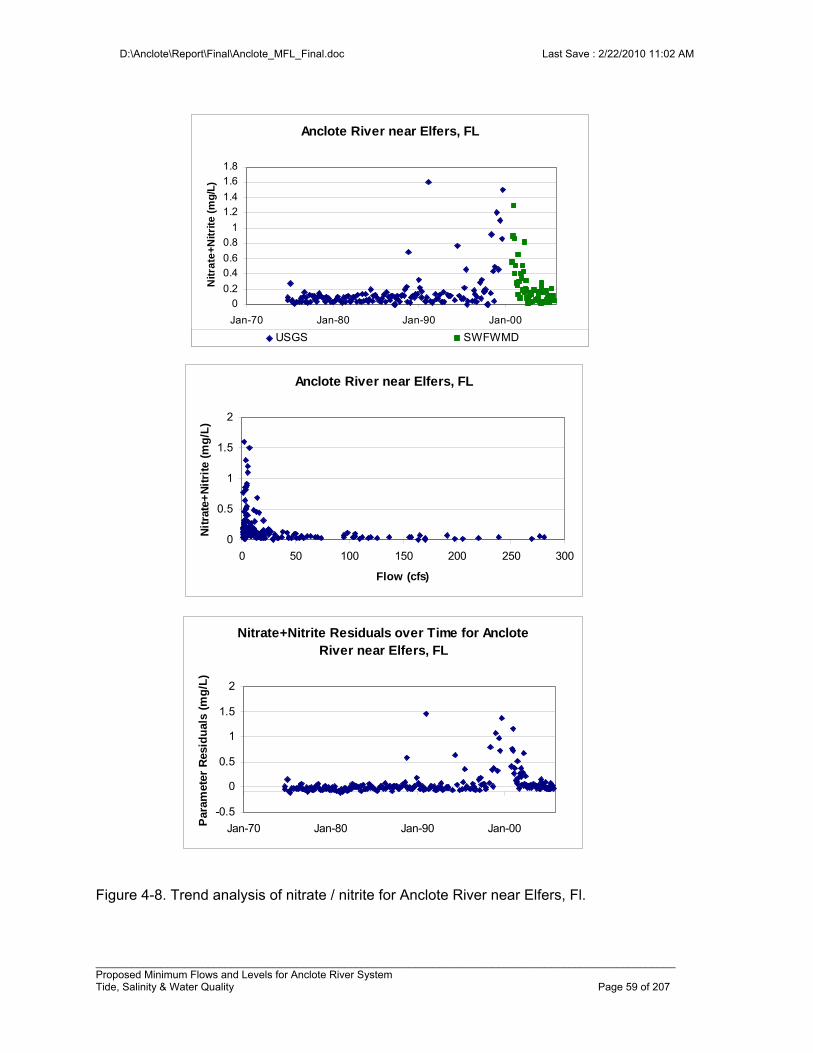
D:\Anclote\Report\Final\Anclote_MFL_Final.doc Last Save : 2/22/2010 11:02 AM
__________________________________________________________________________________________________ Proposed Minimum Flows and Levels for Anclote River System Tide, Salinity & Water Quality Page 59 of 207
Figure 4-8. Trend analysis of nitrate / nitrite for Anclote River near Elfers, Fl.
Anclote River near Elfers, FL
0
0.2
0.4
0.6
0.8
1
1.2
1.4
1.6
1.8
Jan-70 Jan-80 Jan-90 Jan-00
Nit
rate
+N
itri
te (
mg
/L)
USGS SWFWMD
Anclote River near Elfers, FL
0
0.5
1
1.5
2
0 50 100 150 200 250 300
Flow (cfs)
Nit
rate
+N
itri
te (
mg
/L)
Nitrate+Nitrite Residuals over Time for Anclote River near Elfers, FL
-0.5
0
0.5
1
1.5
2
Jan-70 Jan-80 Jan-90 Jan-00Par
amet
er R
esid
ual
s (m
g/L
)
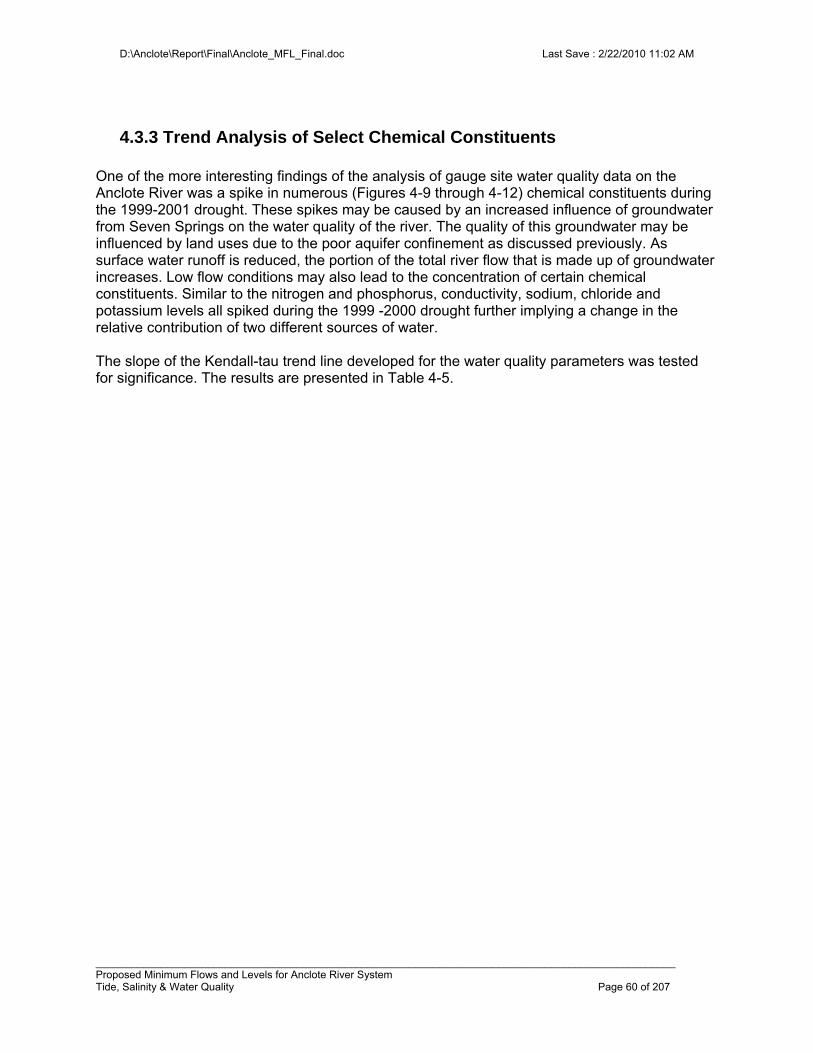
D:\Anclote\Report\Final\Anclote_MFL_Final.doc Last Save : 2/22/2010 11:02 AM
__________________________________________________________________________________________________ Proposed Minimum Flows and Levels for Anclote River System Tide, Salinity & Water Quality Page 60 of 207
4.3.3 Trend Analysis of Select Chemical Constituents One of the more interesting findings of the analysis of gauge site water quality data on the Anclote River was a spike in numerous (Figures 4-9 through 4-12) chemical constituents during the 1999-2001 drought. These spikes may be caused by an increased influence of groundwater from Seven Springs on the water quality of the river. The quality of this groundwater may be influenced by land uses due to the poor aquifer confinement as discussed previously. As surface water runoff is reduced, the portion of the total river flow that is made up of groundwater increases. Low flow conditions may also lead to the concentration of certain chemical constituents. Similar to the nitrogen and phosphorus, conductivity, sodium, chloride and potassium levels all spiked during the 1999 -2000 drought further implying a change in the relative contribution of two different sources of water. The slope of the Kendall-tau trend line developed for the water quality parameters was tested for significance. The results are presented in Table 4-5.
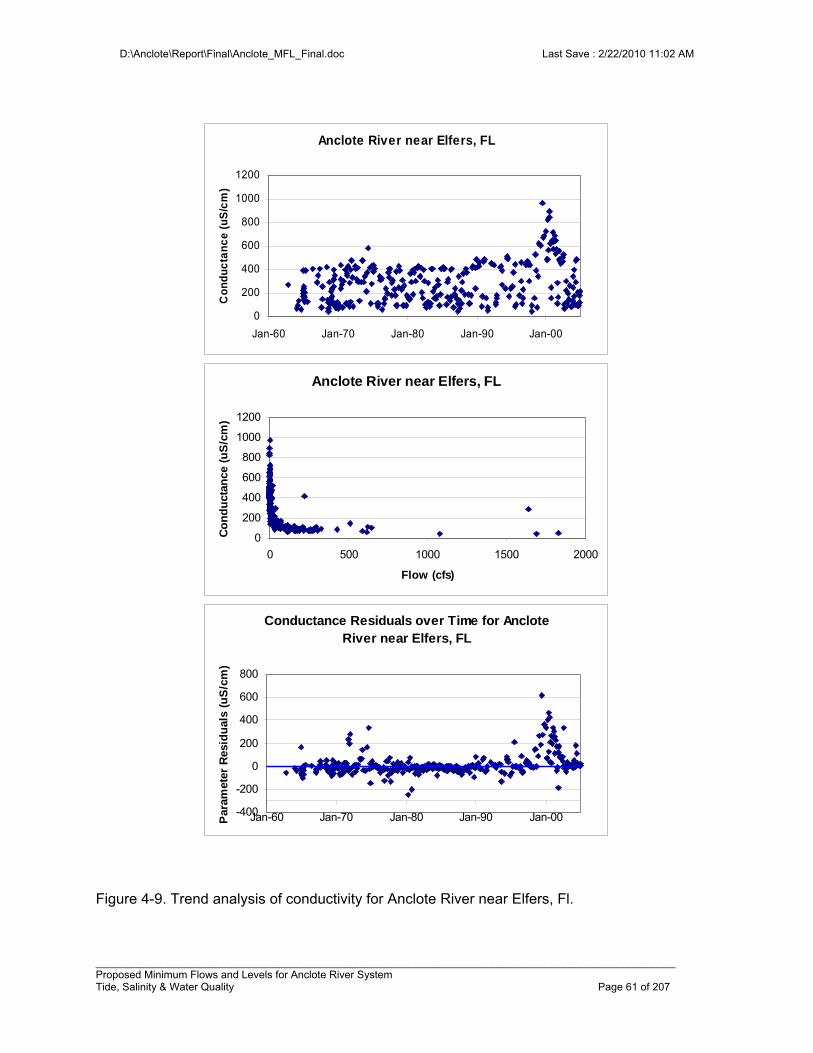
D:\Anclote\Report\Final\Anclote_MFL_Final.doc Last Save : 2/22/2010 11:02 AM
__________________________________________________________________________________________________ Proposed Minimum Flows and Levels for Anclote River System Tide, Salinity & Water Quality Page 61 of 207
Figure 4-9. Trend analysis of conductivity for Anclote River near Elfers, Fl.
Anclote River near Elfers, FL
0
200
400
600
800
1000
1200
Jan-60 Jan-70 Jan-80 Jan-90 Jan-00
Co
nd
uc
tan
ce
(u
S/c
m)
Anclote River near Elfers, FL
0
200
400
600
800
1000
1200
0 500 1000 1500 2000
Flow (cfs)
Co
nd
uct
ance
(u
S/c
m)
Conductance Residuals over Time for Anclote River near Elfers, FL
-400
-200
0
200
400
600
800
Jan-60 Jan-70 Jan-80 Jan-90 Jan-00Par
amet
er R
esid
ual
s (u
S/c
m)
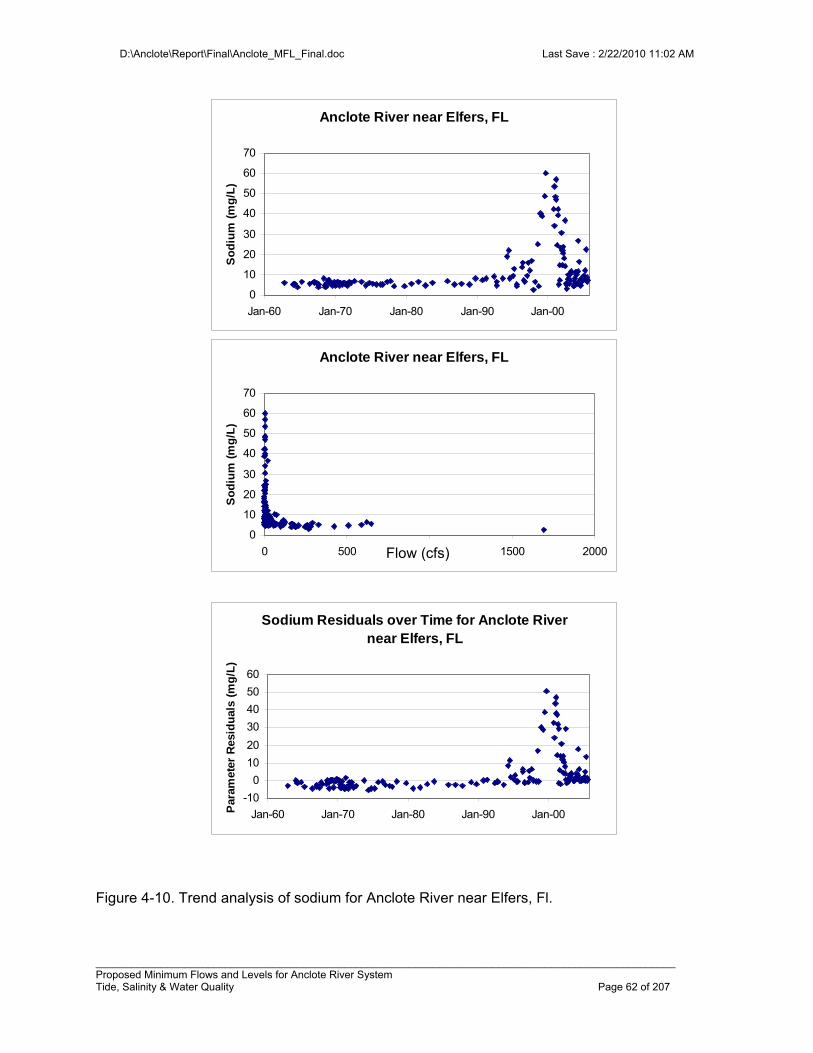
D:\Anclote\Report\Final\Anclote_MFL_Final.doc Last Save : 2/22/2010 11:02 AM
__________________________________________________________________________________________________ Proposed Minimum Flows and Levels for Anclote River System Tide, Salinity & Water Quality Page 62 of 207
Figure 4-10. Trend analysis of sodium for Anclote River near Elfers, Fl.
Anclote River near Elfers, FL
0
10
20
30
40
50
60
70
Jan-60 Jan-70 Jan-80 Jan-90 Jan-00
So
diu
m (
mg
/L)
Anclote River near Elfers, FL
0
10
20
30
40
50
60
70
0 500 1000 1500 2000
So
diu
m (
mg
/L)
Sodium Residuals over Time for Anclote River near Elfers, FL
-10
0
10
20
30
40
50
60
Jan-60 Jan-70 Jan-80 Jan-90 Jan-00Par
amet
er R
esid
ual
s (m
g/L
)
Flow (cfs)
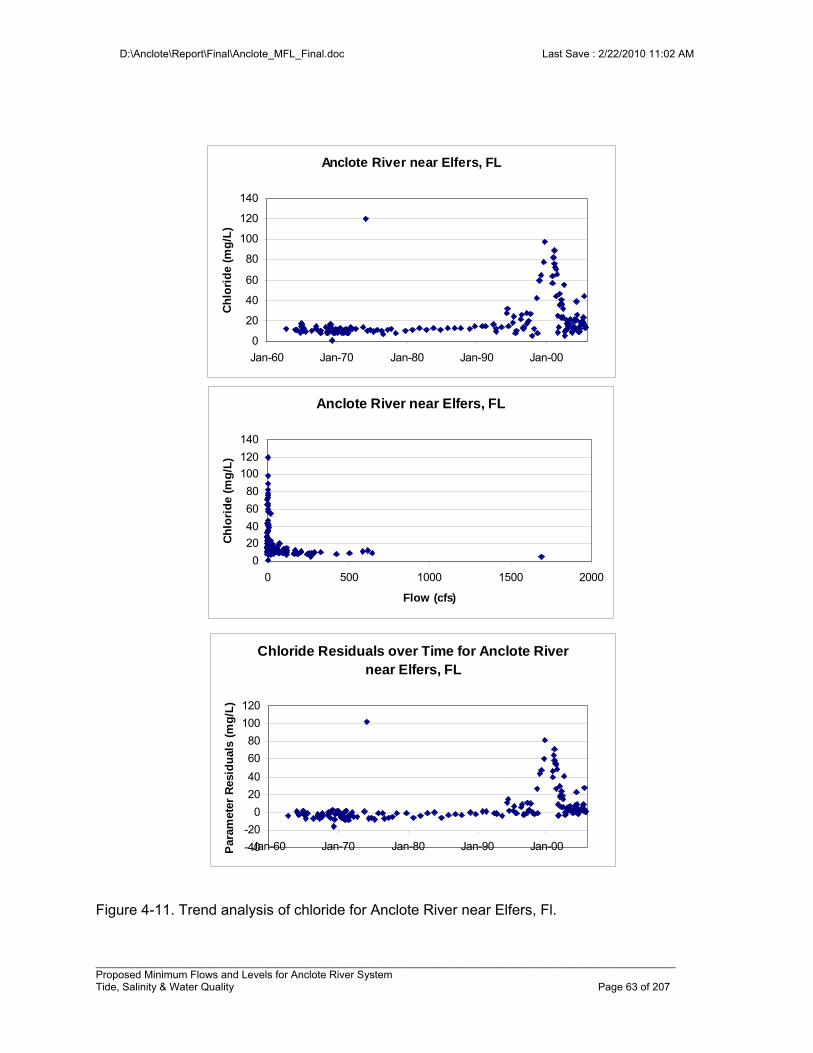
D:\Anclote\Report\Final\Anclote_MFL_Final.doc Last Save : 2/22/2010 11:02 AM
__________________________________________________________________________________________________ Proposed Minimum Flows and Levels for Anclote River System Tide, Salinity & Water Quality Page 63 of 207
Figure 4-11. Trend analysis of chloride for Anclote River near Elfers, Fl.
Chloride Residuals over Time for Anclote River near Elfers, FL
-40
-20
0
20
40
60
80
100
120
Jan-60 Jan-70 Jan-80 Jan-90 Jan-00Par
amet
er R
esid
ual
s (m
g/L
)
Anclote River near Elfers, FL
0
20
40
60
80
100
120
140
0 500 1000 1500 2000
Flow (cfs)
Ch
lori
de
(mg
/L)
Anclote River near Elfers, FL
0
20
40
60
80
100
120
140
Jan-60 Jan-70 Jan-80 Jan-90 Jan-00
Ch
lori
de
(mg
/L)
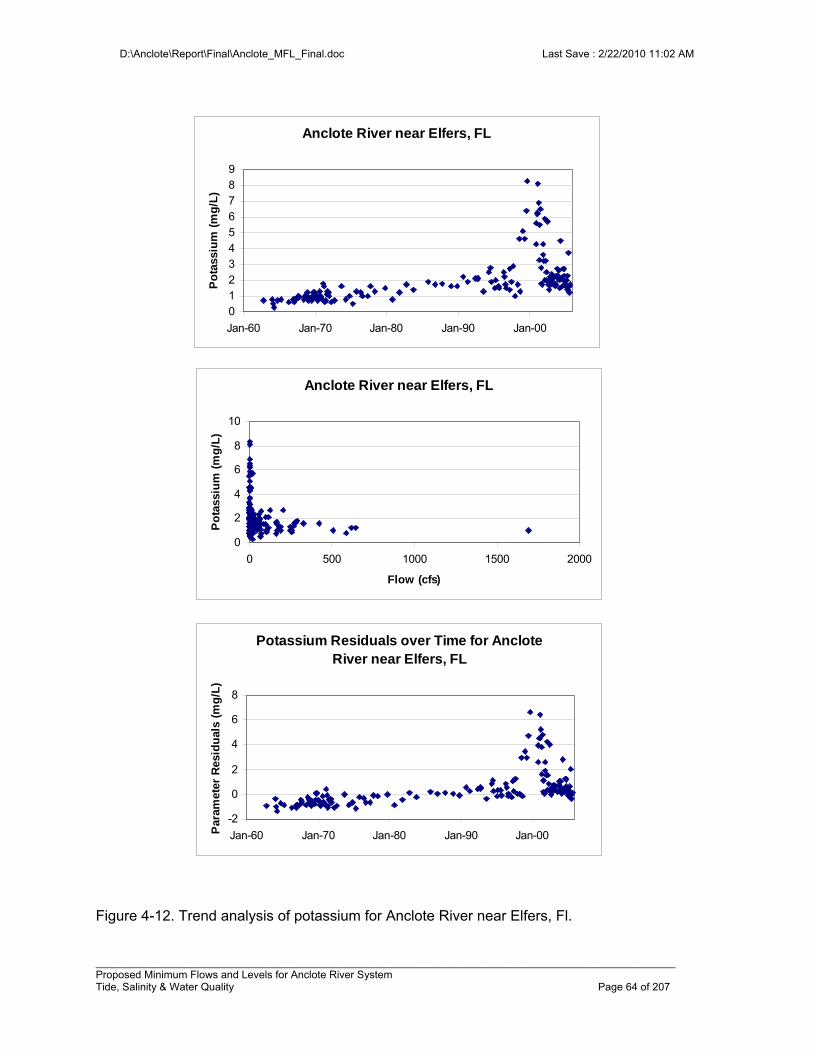
D:\Anclote\Report\Final\Anclote_MFL_Final.doc Last Save : 2/22/2010 11:02 AM
__________________________________________________________________________________________________ Proposed Minimum Flows and Levels for Anclote River System Tide, Salinity & Water Quality Page 64 of 207
Figure 4-12. Trend analysis of potassium for Anclote River near Elfers, Fl.
Anclote River near Elfers, FL
0123456789
Jan-60 Jan-70 Jan-80 Jan-90 Jan-00
Po
tass
ium
(m
g/L
)
Potassium Residuals over Time for Anclote River near Elfers, FL
-2
0
2
4
6
8
Jan-60 Jan-70 Jan-80 Jan-90 Jan-00Par
amet
er R
esid
ual
s (m
g/L
)
Anclote River near Elfers, FL
0
2
4
6
8
10
0 500 1000 1500 2000
Flow (cfs)
Po
tass
ium
(m
g/L
)
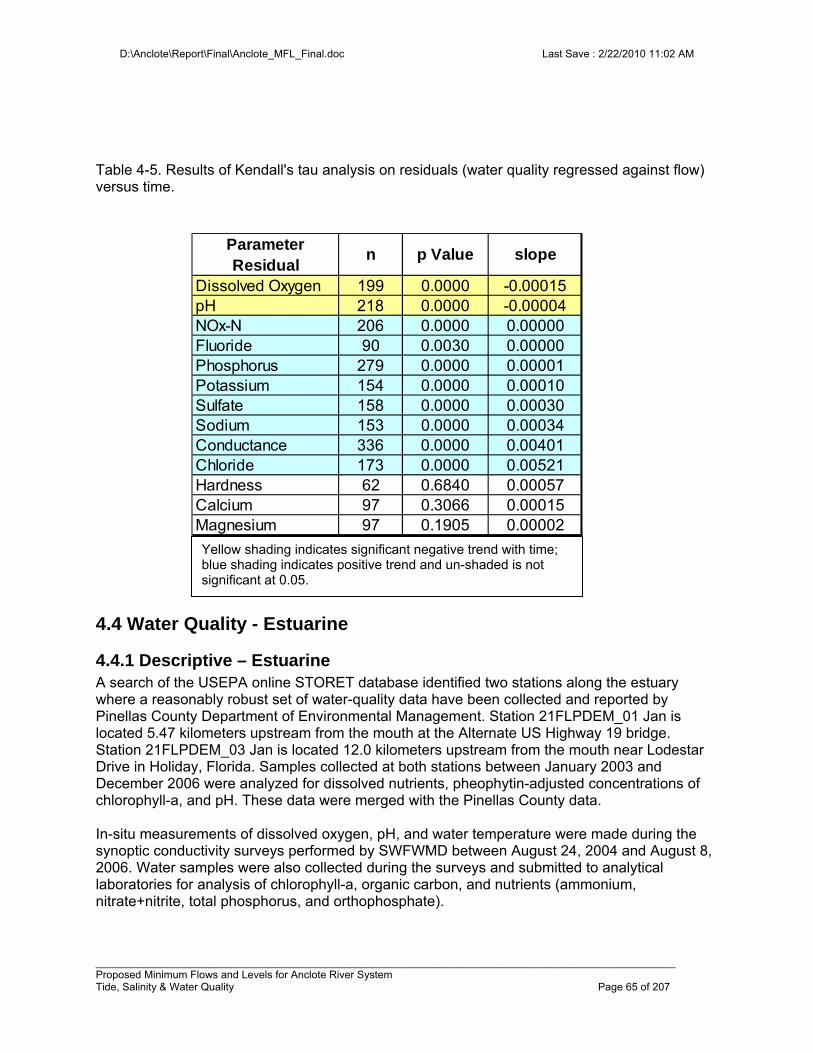
D:\Anclote\Report\Final\Anclote_MFL_Final.doc Last Save : 2/22/2010 11:02 AM
__________________________________________________________________________________________________ Proposed Minimum Flows and Levels for Anclote River System Tide, Salinity & Water Quality Page 65 of 207
Table 4-5. Results of Kendall's tau analysis on residuals (water quality regressed against flow) versus time.
4.4 Water Quality - Estuarine
4.4.1 Descriptive – Estuarine A search of the USEPA online STORET database identified two stations along the estuary where a reasonably robust set of water-quality data have been collected and reported by Pinellas County Department of Environmental Management. Station 21FLPDEM_01 Jan is located 5.47 kilometers upstream from the mouth at the Alternate US Highway 19 bridge. Station 21FLPDEM_03 Jan is located 12.0 kilometers upstream from the mouth near Lodestar Drive in Holiday, Florida. Samples collected at both stations between January 2003 and December 2006 were analyzed for dissolved nutrients, pheophytin-adjusted concentrations of chlorophyll-a, and pH. These data were merged with the Pinellas County data. In-situ measurements of dissolved oxygen, pH, and water temperature were made during the synoptic conductivity surveys performed by SWFWMD between August 24, 2004 and August 8, 2006. Water samples were also collected during the surveys and submitted to analytical laboratories for analysis of chlorophyll-a, organic carbon, and nutrients (ammonium, nitrate+nitrite, total phosphorus, and orthophosphate).
Parameter Residual
n p Value slope
Dissolved Oxygen 199 0.0000 -0.00015pH 218 0.0000 -0.00004NOx-N 206 0.0000 0.00000Fluoride 90 0.0030 0.00000Phosphorus 279 0.0000 0.00001Potassium 154 0.0000 0.00010Sulfate 158 0.0000 0.00030Sodium 153 0.0000 0.00034Conductance 336 0.0000 0.00401Chloride 173 0.0000 0.00521Hardness 62 0.6840 0.00057Calcium 97 0.3066 0.00015Magnesium 97 0.1905 0.00002
Yellow shading indicates significant negative trend with time; blue shading indicates positive trend and un-shaded is not significant at 0.05.
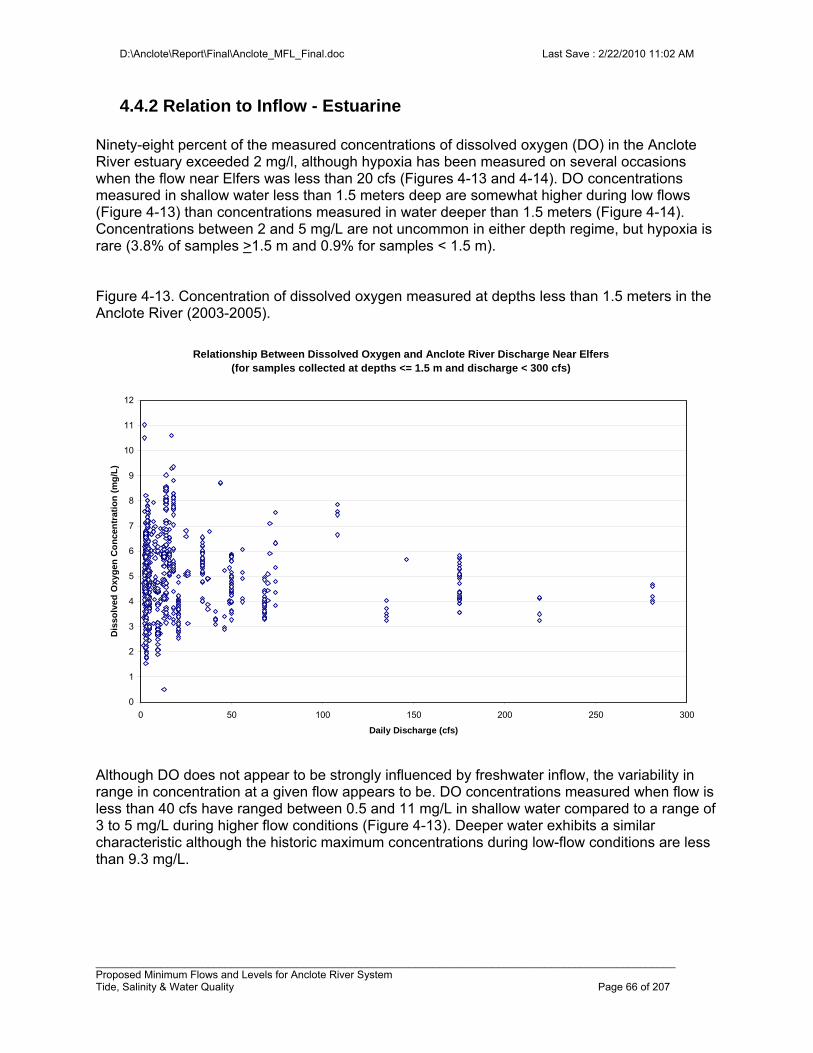
D:\Anclote\Report\Final\Anclote_MFL_Final.doc Last Save : 2/22/2010 11:02 AM
__________________________________________________________________________________________________ Proposed Minimum Flows and Levels for Anclote River System Tide, Salinity & Water Quality Page 66 of 207
4.4.2 Relation to Inflow - Estuarine Ninety-eight percent of the measured concentrations of dissolved oxygen (DO) in the Anclote River estuary exceeded 2 mg/l, although hypoxia has been measured on several occasions when the flow near Elfers was less than 20 cfs (Figures 4-13 and 4-14). DO concentrations measured in shallow water less than 1.5 meters deep are somewhat higher during low flows (Figure 4-13) than concentrations measured in water deeper than 1.5 meters (Figure 4-14). Concentrations between 2 and 5 mg/L are not uncommon in either depth regime, but hypoxia is rare (3.8% of samples >1.5 m and 0.9% for samples < 1.5 m). Figure 4-13. Concentration of dissolved oxygen measured at depths less than 1.5 meters in the Anclote River (2003-2005).
Although DO does not appear to be strongly influenced by freshwater inflow, the variability in range in concentration at a given flow appears to be. DO concentrations measured when flow is less than 40 cfs have ranged between 0.5 and 11 mg/L in shallow water compared to a range of 3 to 5 mg/L during higher flow conditions (Figure 4-13). Deeper water exhibits a similar characteristic although the historic maximum concentrations during low-flow conditions are less than 9.3 mg/L.
Relationship Between Dissolved Oxygen and Anclote River Discharge Near Elfers(for samples collected at depths <= 1.5 m and discharge < 300 cfs)
0
1
2
3
4
5
6
7
8
9
10
11
12
0 50 100 150 200 250 300
Daily Discharge (cfs)
Dis
solv
ed O
xyg
en C
on
cen
trat
ion
(m
g/L
)
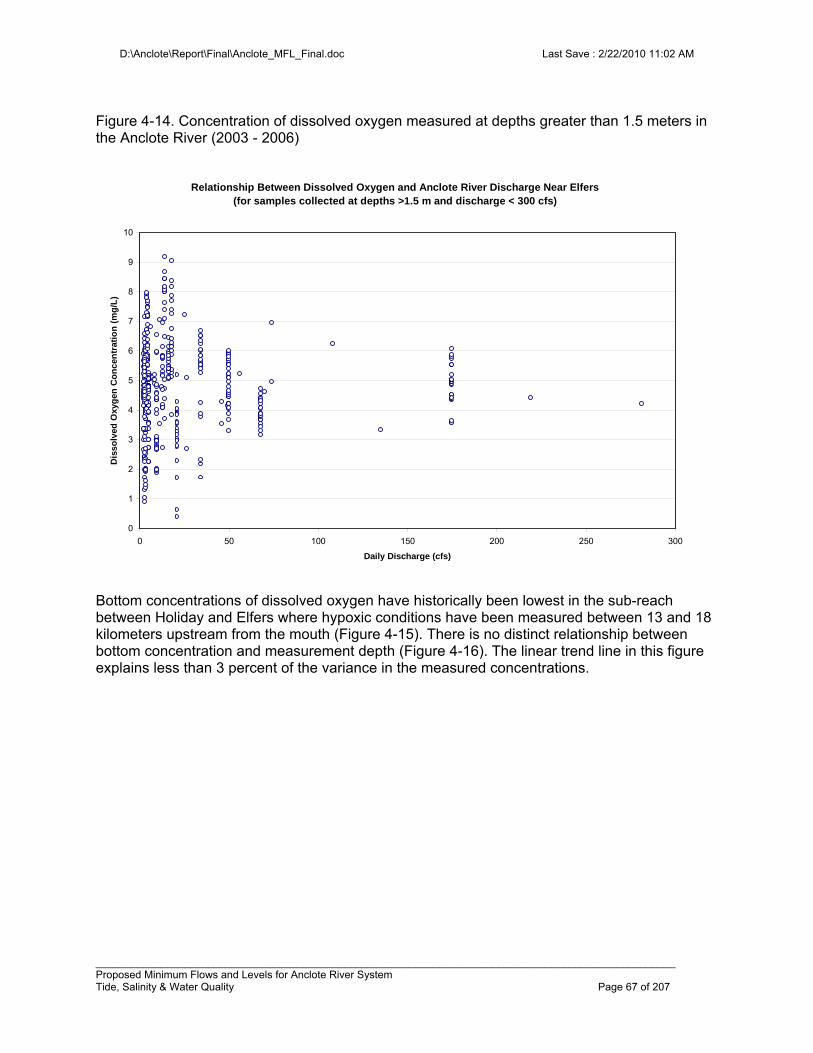
D:\Anclote\Report\Final\Anclote_MFL_Final.doc Last Save : 2/22/2010 11:02 AM
__________________________________________________________________________________________________ Proposed Minimum Flows and Levels for Anclote River System Tide, Salinity & Water Quality Page 67 of 207
Figure 4-14. Concentration of dissolved oxygen measured at depths greater than 1.5 meters in the Anclote River (2003 - 2006)
Bottom concentrations of dissolved oxygen have historically been lowest in the sub-reach between Holiday and Elfers where hypoxic conditions have been measured between 13 and 18 kilometers upstream from the mouth (Figure 4-15). There is no distinct relationship between bottom concentration and measurement depth (Figure 4-16). The linear trend line in this figure explains less than 3 percent of the variance in the measured concentrations.
Relationship Between Dissolved Oxygen and Anclote River Discharge Near Elfers(for samples collected at depths >1.5 m and discharge < 300 cfs)
0
1
2
3
4
5
6
7
8
9
10
0 50 100 150 200 250 300
Daily Discharge (cfs)
Dis
solv
ed O
xyg
en C
on
cen
trat
ion
(m
g/L
)
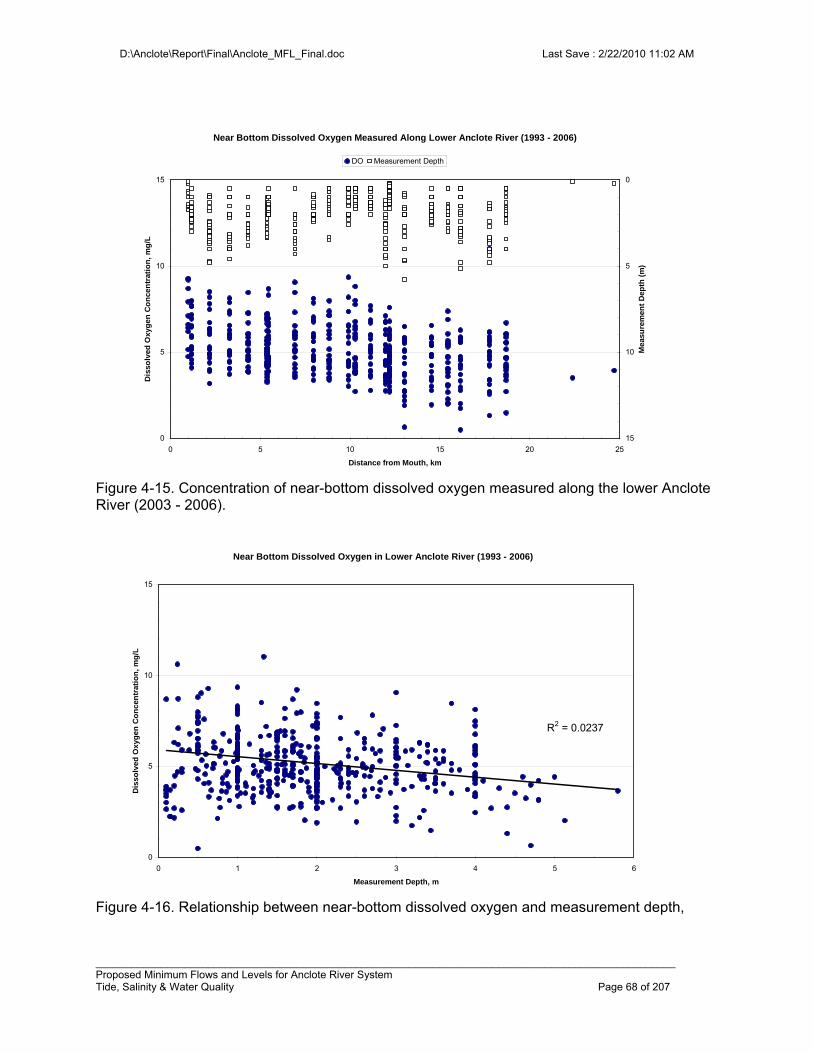
D:\Anclote\Report\Final\Anclote_MFL_Final.doc Last Save : 2/22/2010 11:02 AM
__________________________________________________________________________________________________ Proposed Minimum Flows and Levels for Anclote River System Tide, Salinity & Water Quality Page 68 of 207
Figure 4-15. Concentration of near-bottom dissolved oxygen measured along the lower Anclote River (2003 - 2006).
Figure 4-16. Relationship between near-bottom dissolved oxygen and measurement depth,
Near Bottom Dissolved Oxygen in Lower Anclote River (1993 - 2006)
R2 = 0.0237
0
5
10
15
0 1 2 3 4 5 6
Measurement Depth, m
Dis
solv
ed O
xyg
en C
on
cen
trat
ion
, m
g/L
Near Bottom Dissolved Oxygen Measured Along Lower Anclote River (1993 - 2006)
0
5
10
15
0 5 10 15 20 25
Distance from Mouth, km
Dis
solv
ed O
xyg
en C
on
cen
trat
ion
, m
g/L
0
5
10
15
Mea
sure
men
t D
epth
(m
)
DO Measurement Depth
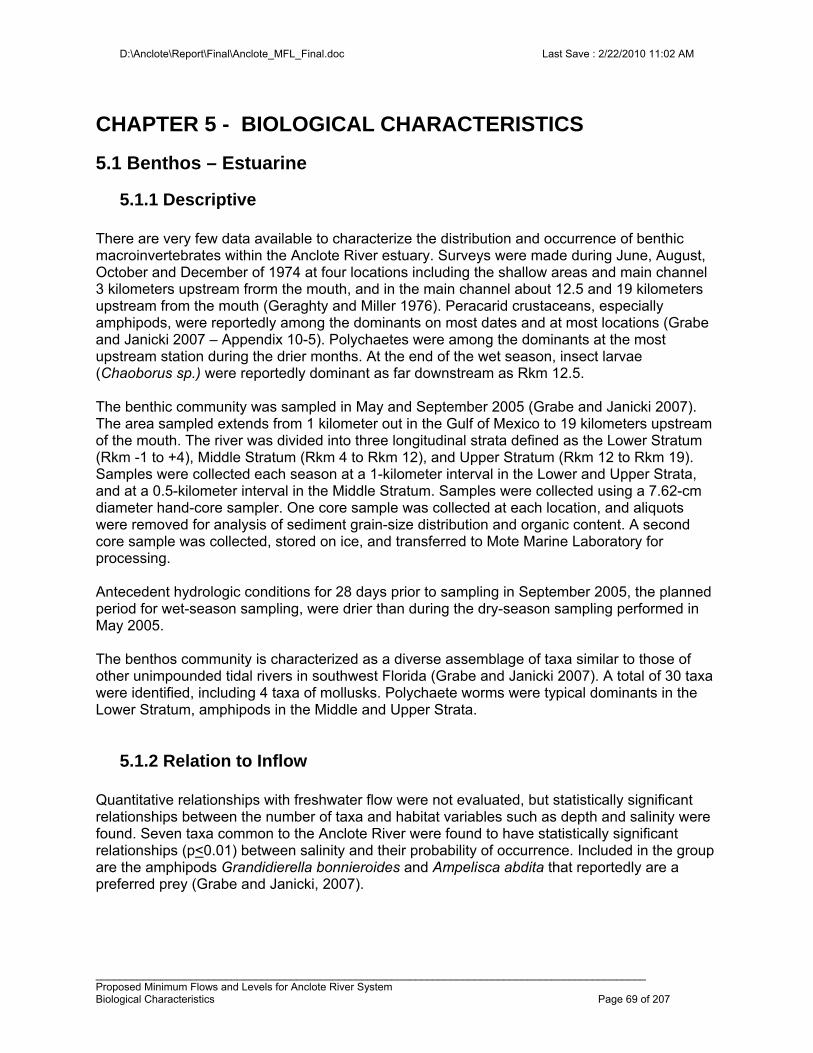
D:\Anclote\Report\Final\Anclote_MFL_Final.doc Last Save : 2/22/2010 11:02 AM
_____________________________________________________________________________________________ Proposed Minimum Flows and Levels for Anclote River System Biological Characteristics Page 69 of 207
CHAPTER 5 - BIOLOGICAL CHARACTERISTICS
5.1 Benthos – Estuarine
5.1.1 Descriptive There are very few data available to characterize the distribution and occurrence of benthic macroinvertebrates within the Anclote River estuary. Surveys were made during June, August, October and December of 1974 at four locations including the shallow areas and main channel 3 kilometers upstream frorm the mouth, and in the main channel about 12.5 and 19 kilometers upstream from the mouth (Geraghty and Miller 1976). Peracarid crustaceans, especially amphipods, were reportedly among the dominants on most dates and at most locations (Grabe and Janicki 2007 – Appendix 10-5). Polychaetes were among the dominants at the most upstream station during the drier months. At the end of the wet season, insect larvae (Chaoborus sp.) were reportedly dominant as far downstream as Rkm 12.5. The benthic community was sampled in May and September 2005 (Grabe and Janicki 2007). The area sampled extends from 1 kilometer out in the Gulf of Mexico to 19 kilometers upstream of the mouth. The river was divided into three longitudinal strata defined as the Lower Stratum (Rkm -1 to +4), Middle Stratum (Rkm 4 to Rkm 12), and Upper Stratum (Rkm 12 to Rkm 19). Samples were collected each season at a 1-kilometer interval in the Lower and Upper Strata, and at a 0.5-kilometer interval in the Middle Stratum. Samples were collected using a 7.62-cm diameter hand-core sampler. One core sample was collected at each location, and aliquots were removed for analysis of sediment grain-size distribution and organic content. A second core sample was collected, stored on ice, and transferred to Mote Marine Laboratory for processing. Antecedent hydrologic conditions for 28 days prior to sampling in September 2005, the planned period for wet-season sampling, were drier than during the dry-season sampling performed in May 2005. The benthos community is characterized as a diverse assemblage of taxa similar to those of other unimpounded tidal rivers in southwest Florida (Grabe and Janicki 2007). A total of 30 taxa were identified, including 4 taxa of mollusks. Polychaete worms were typical dominants in the Lower Stratum, amphipods in the Middle and Upper Strata.
5.1.2 Relation to Inflow Quantitative relationships with freshwater flow were not evaluated, but statistically significant relationships between the number of taxa and habitat variables such as depth and salinity were found. Seven taxa common to the Anclote River were found to have statistically significant relationships (p<0.01) between salinity and their probability of occurrence. Included in the group are the amphipods Grandidierella bonnieroides and Ampelisca abdita that reportedly are a preferred prey (Grabe and Janicki, 2007).
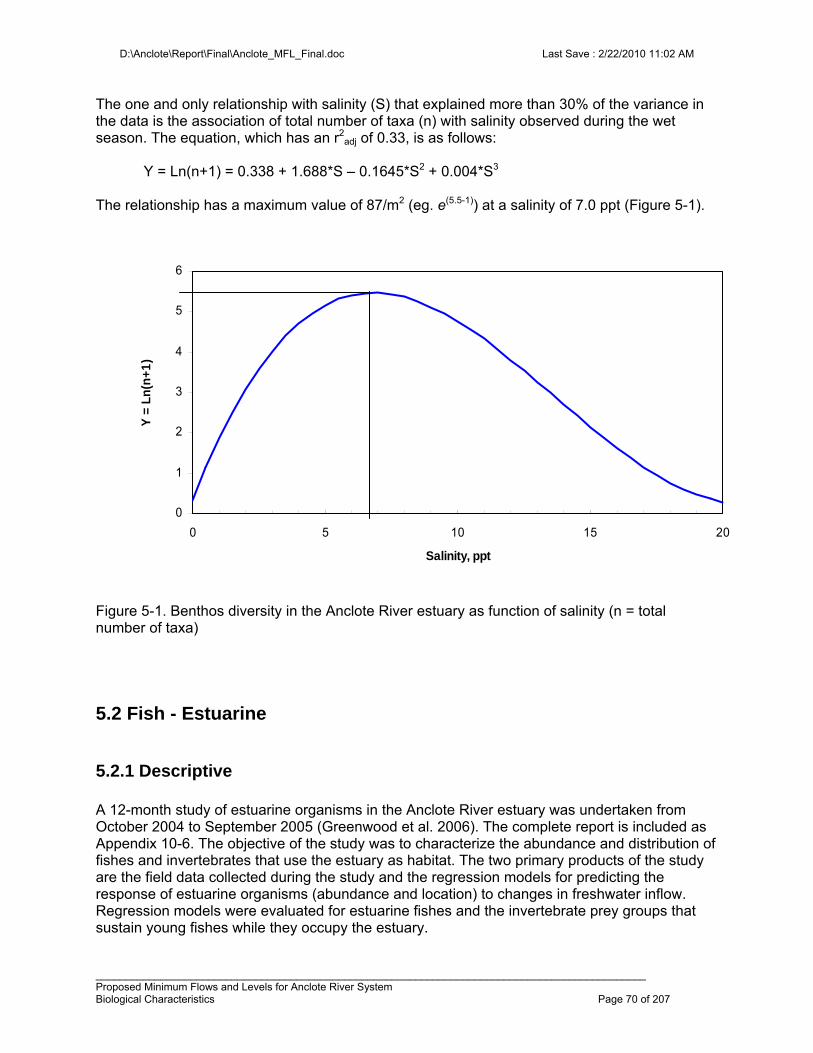
D:\Anclote\Report\Final\Anclote_MFL_Final.doc Last Save : 2/22/2010 11:02 AM
_____________________________________________________________________________________________ Proposed Minimum Flows and Levels for Anclote River System Biological Characteristics Page 70 of 207
The one and only relationship with salinity (S) that explained more than 30% of the variance in the data is the association of total number of taxa (n) with salinity observed during the wet season. The equation, which has an r2
adj of 0.33, is as follows: Y = Ln(n+1) = 0.338 + 1.688*S – 0.1645*S2 + 0.004*S3 The relationship has a maximum value of 87/m2 (eg. e(5.5-1)) at a salinity of 7.0 ppt (Figure 5-1).
Figure 5-1. Benthos diversity in the Anclote River estuary as function of salinity (n = total number of taxa)
5.2 Fish - Estuarine
5.2.1 Descriptive A 12-month study of estuarine organisms in the Anclote River estuary was undertaken from October 2004 to September 2005 (Greenwood et al. 2006). The complete report is included as Appendix 10-6. The objective of the study was to characterize the abundance and distribution of fishes and invertebrates that use the estuary as habitat. The two primary products of the study are the field data collected during the study and the regression models for predicting the response of estuarine organisms (abundance and location) to changes in freshwater inflow. Regression models were evaluated for estuarine fishes and the invertebrate prey groups that sustain young fishes while they occupy the estuary.
0
1
2
3
4
5
6
0 5 10 15 20
Salinity, ppt
Y =
Ln
(n+
1)

D:\Anclote\Report\Final\Anclote_MFL_Final.doc Last Save : 2/22/2010 11:02 AM
_____________________________________________________________________________________________ Proposed Minimum Flows and Levels for Anclote River System Biological Characteristics Page 71 of 207
The study area from which samples were collected extends from 1.8 kilometers out into the Gulf of Mexico to 16.1 kilometers upstream of the Anclote River mouth at Perrine Ranch Road. The study area was divided into six collection zones with endpoint locations defined as -1.8, 0.0, 2.4, 5.4, 9.8, 13.2 and 16.1 kilometers from the mouth. Biological samples were collected using three types of gear – a plankton net, bag seine and otter trawl. The sampling protocol and the evaluation approach differed by gear type. Plankton-net surveys were conducted at night during flood tides, and the bag seine and otter trawl surveys were conducted during the day under variable tide conditions. Small organisms from the zooplankton and hyperbenthos communities are the catch targeted in a plankton-net survey. In addition, the invertebrate catch in a plankton net reportedly consists largely of organisms that serve as important food for fishes (Greenwood et al. 2006). Larger organisms that typically evade plankton nets are collected using seines and trawls. Seine hauls are usually composed of shallow-water organisms, whereas trawls are usually composed of deeper-water organisms (Greenwood et al. 2006). For identification and inflow response purposes, some taxa were sub-divided into size class (pseudo-taxa). The term 'taxa' is used in this report to connote either a true taxa, or a pseudo-taxa. Monthly sampling was conducted with each gear type resulting in 144 plankton tow and seine samples and 72 trawl samples. A plankton net (0.5 meter mouth with 500 µm mesh) was also towed behind a vessel in such a manner as to sample from near bottom to surface. A flow meter mounted ahead of the opening cone measured volume sampled which was typically on the order of 70-80 m3. Plankton tows were conducted at night. The small organisms collected represent a combination of zooplankton and hyperbenthos communities. The term zooplankton includes all weakly swimming animals that suspend in the water column during one, or more life stages. The distribution of these animals is largely subject to the motion of the waters in which they live. In contrast, many of the hyperbenthos are capable of actively positioning themselves at different locations along the estuarine gradient by selectively occupying opposite tidal flows. The term refers to animals that are associated with the bottom but tend to suspend above it, rising into the water column at night. This faunal mixture of a plankton tow includes larvae of fishes and the planktonic eggs of fishes. Each is described separately. Dominant fish taxa include larval gobies (Gobiosoma and Microgobius, bay anchovies (Anchoa mitchilli), silversides (Menidia spp.) and skilletfish (Gobiesox strumosus). Juvenile spot (Leiostomus xanthurus) were abundant relative to other tidal rivers in west-central Florida. Although fish eggs and larvae are the target catch, invertebrate plankton and hyperbenthos almost always dominate the samples numerically, and these serve as an important food source for juvenile fish. The invertebrate catch of the plankton tow was dominated by Gammaridean amphipods, larval crabs (decapod zoeae), larval shrimp (decapod mysis) and by river-plume taxa such as copepods (Acarthia tonsa and Labidocera aestiva), chaetognaths Sagitta spp., planktonic shrimp (Lucifer faxoni) and the ostracod Paraserope pollex. The mysid Americamysis almyra is often a numerical dominant in estuaries dominated by surface runoff, but was not strongly dominant in the tidal Anclote River. The seine was deployed in waters > 1.8 meters depth and consisted of a 21.3-m center bag with 3.2 mm mesh and leads spaced every 150 mm. The seine fish catch was dominated by spot (Leiostomus xanthurus), pinfish (Lagodon rhomboides), bay anchovy (Anchoa mitchilli)and
D:\Anclote\Report\Final\Anclote_MFL_Final.doc Last Save : 2/22/2010 11:02 AM
_____________________________________________________________________________________________ Proposed Minimum Flows and Levels for Anclote River System Biological Characteristics Page 72 of 207
eucinostomas mojarras (Eucinostomus spp.) Collectively, these taxa comprised over 84% of total seine catch of fishes. The dominant invertebrates captured in the seine were the daggerblade shrimp (Palaemonestes pugio) and the brackish grass shrimp (P. intermedius) which collectively comprised 94% of the invertebrate catch. The trawl was deployed in deeper areas (water depths > 1.8 m and < 7.6 m) and consists of a 6.1-m otter trawl with 38-mm stretched mesh, a 3.2 mm mesh liner and a tickler chain. The trawl fish catch was dominated by the same taxa as the seine, namely pinfish (Lagodon rhomboides), spot (Leiostomus xanthurus ), by anchovy (Anchoa mitchilli) and eucinostomus mojarras (Eucinostomus spp.) Collectively these taxa comprised over 86% of total trawl catch of fishes. The dominant invertebrate catch of the trawl were arrow shrimp (Tozeuma carolinense), brackish grass shrimp (P. intermedius), pink shrimp (Farfantepenaeus duorarum), and longtail grass shrimp (Periclimenes longicaudatus). These four taxa comprised nearly 98% of the total trawl catch of invertebrates. Few seasonal patterns are apparent in the richness of taxa collected during the seine and trawl surveys which was attributed to the short sampling period and the “unusual hydrological conditions” during the sampling period (Greenwood et al. 2006). The authors tentatively conclude that the period from October to February may have the greatest potential for negative effects of change in freshwater inflow on organisms collected using the seine and trawl. In comparison, they conclude that many species collected using a plankton net may have the greatest potential for impact during the months from June through October.
5.2.2 Relation to inflow Response to inflow was assessed in terms of location of maximum occurrence and in terms of quantity (abundance) of organisms present. The assessment protocol differs slightly between the plankton tows and the seine/trawls. Regression models were evaluated to predict the geographic center of abundance, i.e.
distribution (kmu), abundance of total organisms (N), and relative abundance ( N ) as a function of various freshwater flow variables (F) based on the natural logarithms of daily flows reported
for the Elfers gauge. For the seine and trawl data, a constant of 1.0 was added to N and F to avoid censoring zero values (Greenwood et al. 2006). A value of 2.79 was added to seine and trawl kmu to adjust for negative values when taxa were centered below the mouth of the river in the Gulf. No additions were done to the plankton tow results for location, abundance or flow
The independent variable Y in these equations is kmu, N, or N . The dependent variable F is any one of a series of n-day lag (i.e. average of flow on sampling day plus n-1 prior days), log-transformed. Lag times up to 365 days in steps of 7 days (i.e. same day flow averaged with prior six days, same day averaged with prior 13 days) were evaluated for the seines and trawls, while up to 120 historical daily values were used for the plankton tow evaluations. The location metric is based on the mean location of the catch-per-unit-effort (CPUE) where the CPUE is the number of organisms per volume (plankton net) sampled or area sampled (seine or trawl). For simplicity CPUE is abbreviated as "U". The location metric is defined as:
kmu = ∑ (km* U) / ∑ U
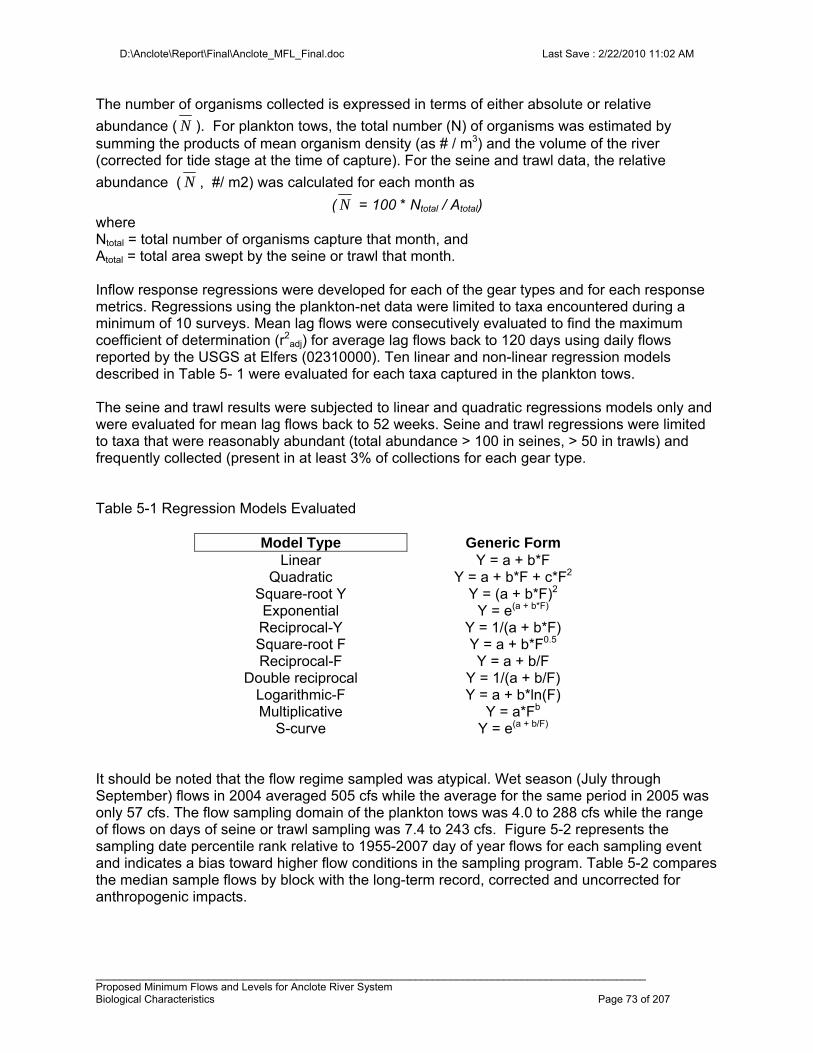
D:\Anclote\Report\Final\Anclote_MFL_Final.doc Last Save : 2/22/2010 11:02 AM
_____________________________________________________________________________________________ Proposed Minimum Flows and Levels for Anclote River System Biological Characteristics Page 73 of 207
The number of organisms collected is expressed in terms of either absolute or relative
abundance ( N ). For plankton tows, the total number (N) of organisms was estimated by summing the products of mean organism density (as # / m3) and the volume of the river (corrected for tide stage at the time of capture). For the seine and trawl data, the relative
abundance ( N , #/ m2) was calculated for each month as
( N = 100 * Ntotal / Atotal) where Ntotal = total number of organisms capture that month, and Atotal = total area swept by the seine or trawl that month. Inflow response regressions were developed for each of the gear types and for each response metrics. Regressions using the plankton-net data were limited to taxa encountered during a minimum of 10 surveys. Mean lag flows were consecutively evaluated to find the maximum coefficient of determination (r2
adj) for average lag flows back to 120 days using daily flows reported by the USGS at Elfers (02310000). Ten linear and non-linear regression models described in Table 5- 1 were evaluated for each taxa captured in the plankton tows. The seine and trawl results were subjected to linear and quadratic regressions models only and were evaluated for mean lag flows back to 52 weeks. Seine and trawl regressions were limited to taxa that were reasonably abundant (total abundance > 100 in seines, > 50 in trawls) and frequently collected (present in at least 3% of collections for each gear type. Table 5-1 Regression Models Evaluated
Model Type Generic Form Linear Y = a + b*F
Quadratic Y = a + b*F + c*F2 Square-root Y Y = (a + b*F)2 Exponential Y = e(a + b*F) Reciprocal-Y Y = 1/(a + b*F) Square-root F Y = a + b*F0.5 Reciprocal-F Y = a + b/F
Double reciprocal Y = 1/(a + b/F) Logarithmic-F Y = a + b*ln(F) Multiplicative Y = a*Fb
S-curve Y = e(a + b/F)
It should be noted that the flow regime sampled was atypical. Wet season (July through September) flows in 2004 averaged 505 cfs while the average for the same period in 2005 was only 57 cfs. The flow sampling domain of the plankton tows was 4.0 to 288 cfs while the range of flows on days of seine or trawl sampling was 7.4 to 243 cfs. Figure 5-2 represents the sampling date percentile rank relative to 1955-2007 day of year flows for each sampling event and indicates a bias toward higher flow conditions in the sampling program. Table 5-2 compares the median sample flows by block with the long-term record, corrected and uncorrected for anthropogenic impacts.
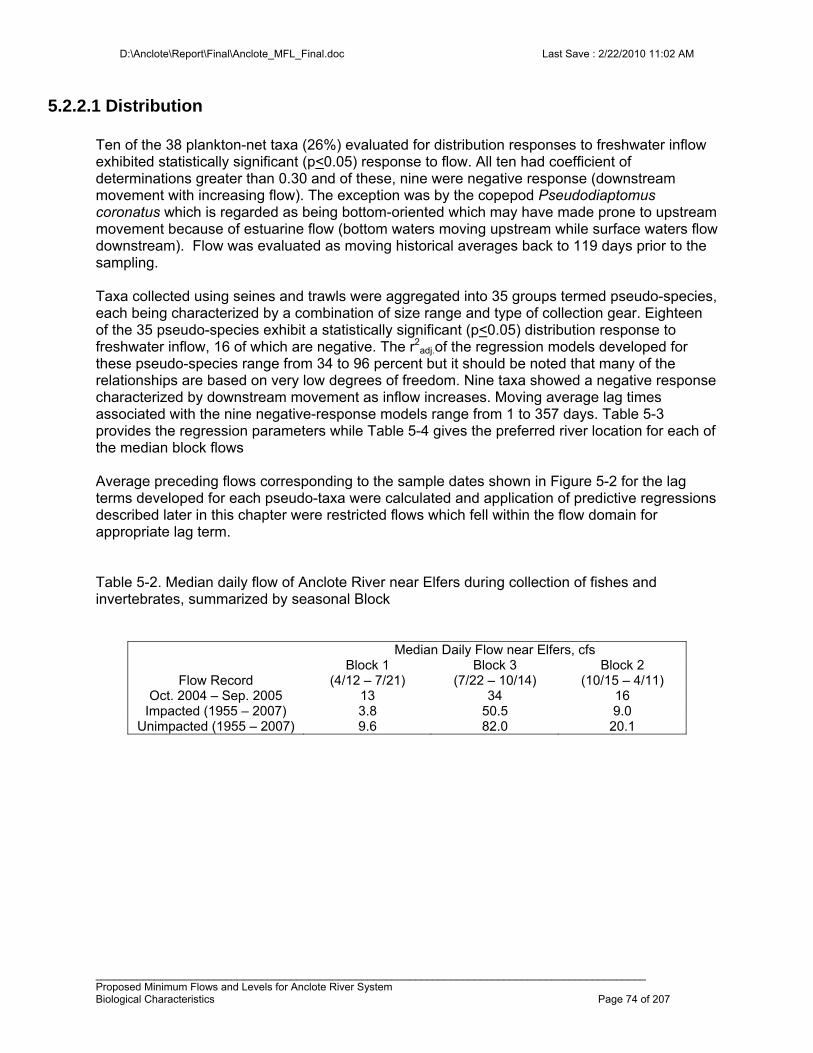
D:\Anclote\Report\Final\Anclote_MFL_Final.doc Last Save : 2/22/2010 11:02 AM
_____________________________________________________________________________________________ Proposed Minimum Flows and Levels for Anclote River System Biological Characteristics Page 74 of 207
5.2.2.1 Distribution Ten of the 38 plankton-net taxa (26%) evaluated for distribution responses to freshwater inflow exhibited statistically significant (p<0.05) response to flow. All ten had coefficient of determinations greater than 0.30 and of these, nine were negative response (downstream movement with increasing flow). The exception was by the copepod Pseudodiaptomus coronatus which is regarded as being bottom-oriented which may have made prone to upstream movement because of estuarine flow (bottom waters moving upstream while surface waters flow downstream). Flow was evaluated as moving historical averages back to 119 days prior to the sampling. Taxa collected using seines and trawls were aggregated into 35 groups termed pseudo-species, each being characterized by a combination of size range and type of collection gear. Eighteen of the 35 pseudo-species exhibit a statistically significant (p<0.05) distribution response to freshwater inflow, 16 of which are negative. The r2
adj.of the regression models developed for these pseudo-species range from 34 to 96 percent but it should be noted that many of the relationships are based on very low degrees of freedom. Nine taxa showed a negative response characterized by downstream movement as inflow increases. Moving average lag times associated with the nine negative-response models range from 1 to 357 days. Table 5-3 provides the regression parameters while Table 5-4 gives the preferred river location for each of the median block flows Average preceding flows corresponding to the sample dates shown in Figure 5-2 for the lag terms developed for each pseudo-taxa were calculated and application of predictive regressions described later in this chapter were restricted flows which fell within the flow domain for appropriate lag term. Table 5-2. Median daily flow of Anclote River near Elfers during collection of fishes and invertebrates, summarized by seasonal Block
Median Daily Flow near Elfers, cfs
Flow Record Block 1
(4/12 – 7/21) Block 3
(7/22 – 10/14) Block 2
(10/15 – 4/11) Oct. 2004 – Sep. 2005 13 34 16
Impacted (1955 – 2007) 3.8 50.5 9.0 Unimpacted (1955 – 2007) 9.6 82.0 20.1
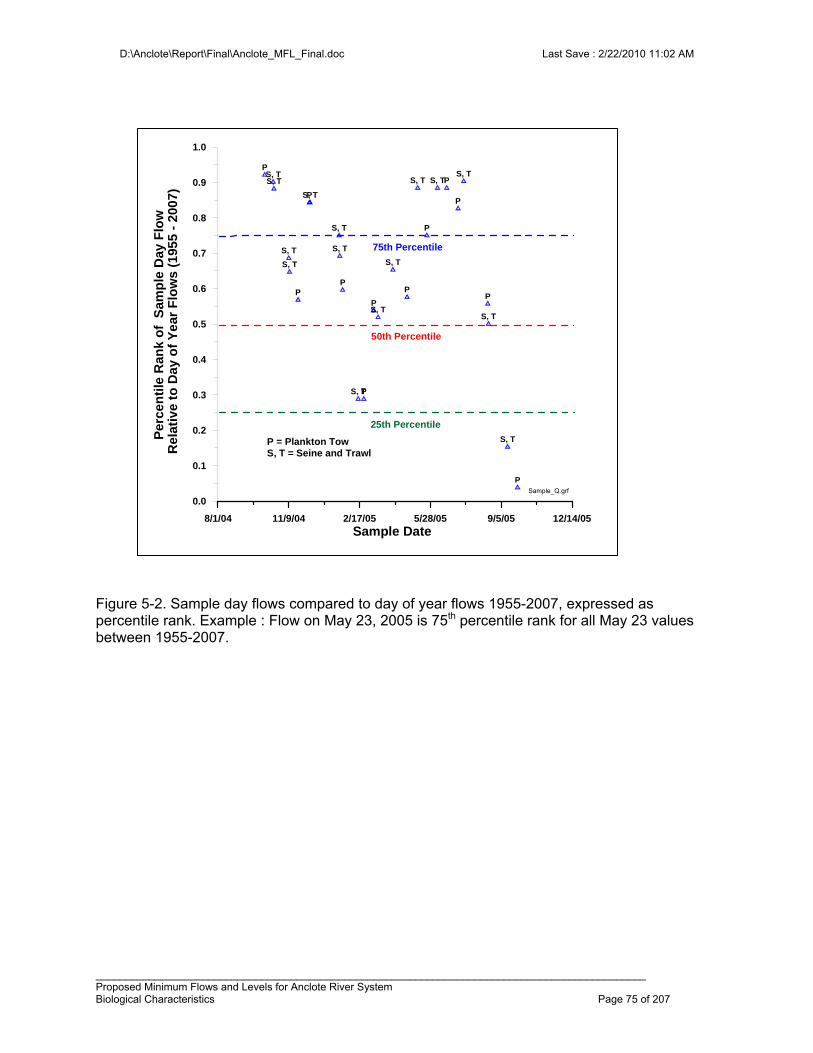
D:\Anclote\Report\Final\Anclote_MFL_Final.doc Last Save : 2/22/2010 11:02 AM
_____________________________________________________________________________________________ Proposed Minimum Flows and Levels for Anclote River System Biological Characteristics Page 75 of 207
Figure 5-2. Sample day flows compared to day of year flows 1955-2007, expressed as percentile rank. Example : Flow on May 23, 2005 is 75th percentile rank for all May 23 values between 1955-2007.
8/1/04 11/9/04 2/17/05 5/28/05 9/5/05 12/14/05
Sample Date
0.0
0.1
0.2
0.3
0.4
0.5
0.6
0.7
0.8
0.9
1.0P
erce
nti
le R
ank
of
Sam
ple
Day
Flo
w
Rel
ativ
e t
o D
ay o
f Y
ear
Flo
ws
(195
5 -
200
7)
S, T
S, T
P
S, TP
PS, T
S, T
P
S, T
P
S, TP
P
S, T
P
S, T
S, T
P
PS, TS, T
S, T
S, T
P
PS, T
50th Percentile
75th Percentile
25th Percentile
Sample_Q.grf
P = Plankton TowS, T = Seine and Trawl
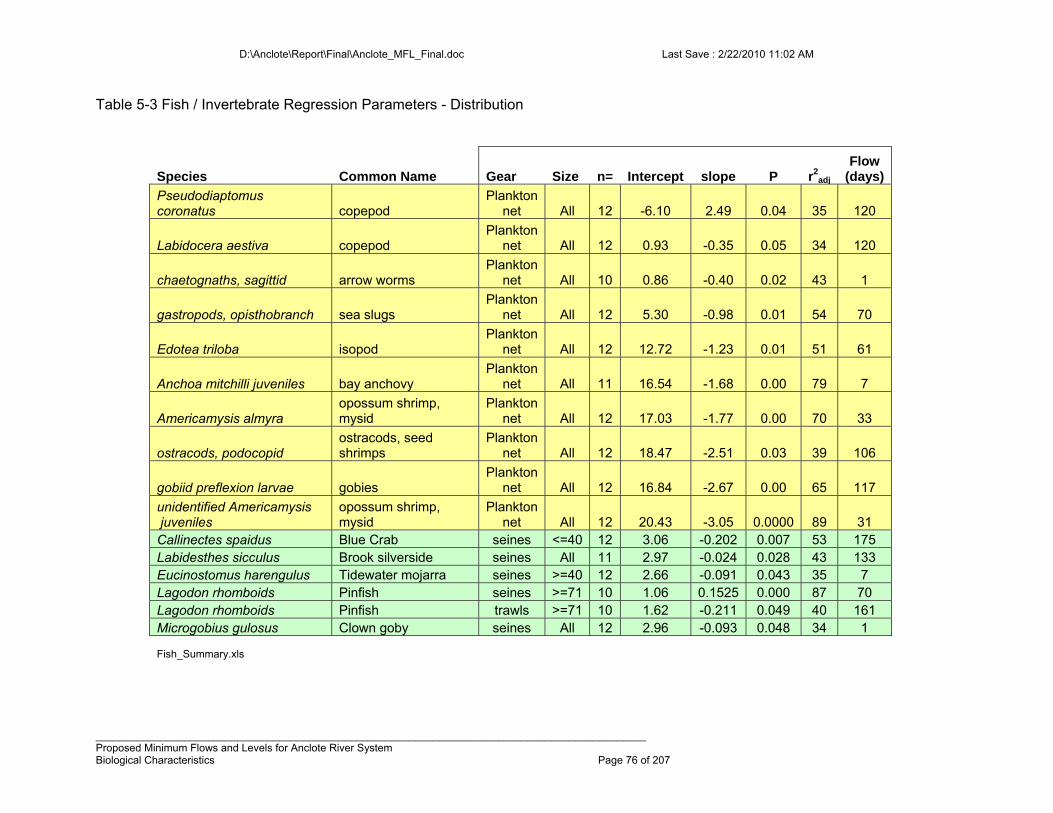
D:\Anclote\Report\Final\Anclote_MFL_Final.doc Last Save : 2/22/2010 11:02 AM
_____________________________________________________________________________________________ Proposed Minimum Flows and Levels for Anclote River System Biological Characteristics Page 76 of 207
Table 5-3 Fish / Invertebrate Regression Parameters - Distribution
Species Common Name Gear Size n= Intercept slope P r2adj
Flow(days)
Pseudodiaptomus coronatus copepod
Planktonnet All 12 -6.10 2.49 0.04 35 120
Labidocera aestiva copepod Plankton
net All 12 0.93 -0.35 0.05 34 120
chaetognaths, sagittid arrow worms Plankton
net All 10 0.86 -0.40 0.02 43 1
gastropods, opisthobranch sea slugs Plankton
net All 12 5.30 -0.98 0.01 54 70
Edotea triloba isopod Plankton
net All 12 12.72 -1.23 0.01 51 61
Anchoa mitchilli juveniles bay anchovy Plankton
net All 11 16.54 -1.68 0.00 79 7
Americamysis almyra opossum shrimp, mysid
Planktonnet All 12 17.03 -1.77 0.00 70 33
ostracods, podocopid ostracods, seed shrimps
Planktonnet All 12 18.47 -2.51 0.03 39 106
gobiid preflexion larvae gobies Plankton
net All 12 16.84 -2.67 0.00 65 117
unidentified Americamysis juveniles
opossum shrimp, mysid
Planktonnet All 12 20.43 -3.05 0.0000 89 31
Callinectes spaidus Blue Crab seines <=40 12 3.06 -0.202 0.007 53 175 Labidesthes sicculus Brook silverside seines All 11 2.97 -0.024 0.028 43 133 Eucinostomus harengulus Tidewater mojarra seines >=40 12 2.66 -0.091 0.043 35 7 Lagodon rhomboids Pinfish seines >=71 10 1.06 0.1525 0.000 87 70 Lagodon rhomboids Pinfish trawls >=71 10 1.62 -0.211 0.049 40 161 Microgobius gulosus Clown goby seines All 12 2.96 -0.093 0.048 34 1
Fish_Summary.xls
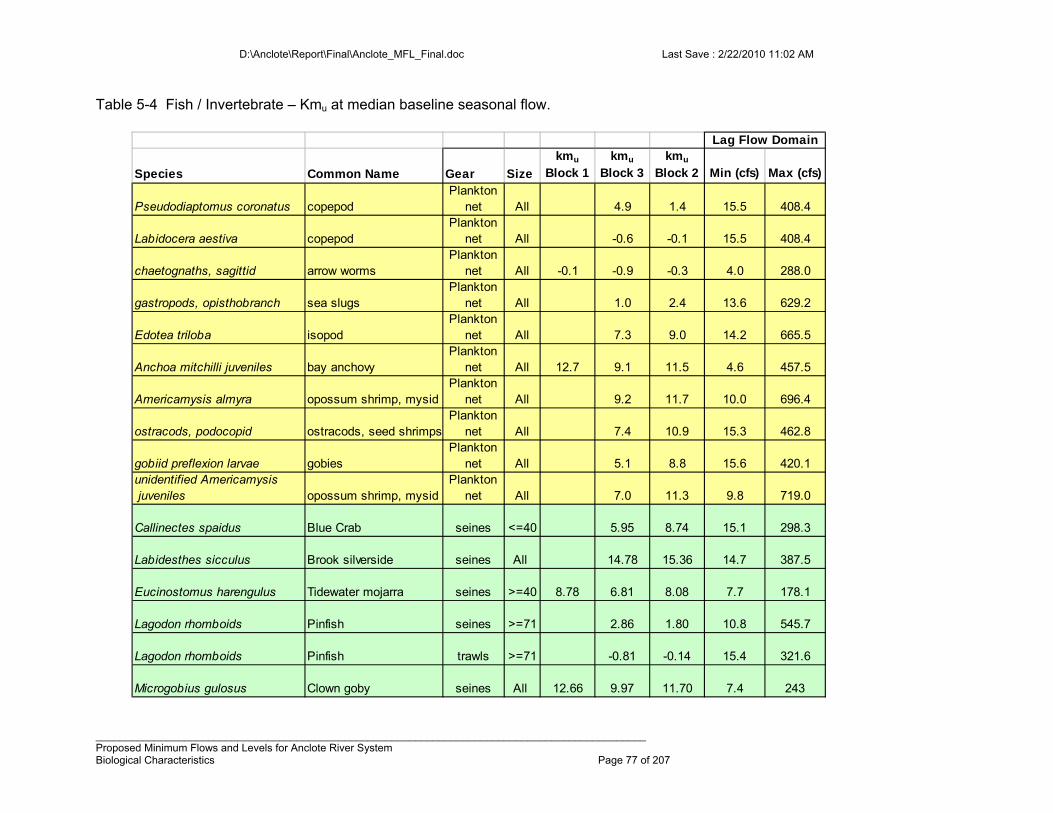
D:\Anclote\Report\Final\Anclote_MFL_Final.doc Last Save : 2/22/2010 11:02 AM
_____________________________________________________________________________________________ Proposed Minimum Flows and Levels for Anclote River System Biological Characteristics Page 77 of 207
Table 5-4 Fish / Invertebrate – Kmu at median baseline seasonal flow.
Species Common Name Gear Size
kmu
Block 1kmu
Block 3kmu
Block 2 Min (cfs) Max (cfs)
Pseudodiaptomus coronatus copepodPlankton
net All 4.9 1.4 15.5 408.4
Labidocera aestiva copepodPlankton
net All -0.6 -0.1 15.5 408.4
chaetognaths, sagittid arrow wormsPlankton
net All -0.1 -0.9 -0.3 4.0 288.0
gastropods, opisthobranch sea slugsPlankton
net All 1.0 2.4 13.6 629.2
Edotea triloba isopodPlankton
net All 7.3 9.0 14.2 665.5
Anchoa mitchilli juveniles bay anchovyPlankton
net All 12.7 9.1 11.5 4.6 457.5
Americamysis almyra opossum shrimp, mysidPlankton
net All 9.2 11.7 10.0 696.4
ostracods, podocopid ostracods, seed shrimpsPlankton
net All 7.4 10.9 15.3 462.8
gobiid preflexion larvae gobiesPlankton
net All 5.1 8.8 15.6 420.1unidentified Americamysis juveniles opossum shrimp, mysid
Planktonnet All 7.0 11.3 9.8 719.0
Callinectes spaidus Blue Crab seines <=40 5.95 8.74 15.1 298.3
Labidesthes sicculus Brook silverside seines All 14.78 15.36 14.7 387.5
Eucinostomus harengulus Tidewater mojarra seines >=40 8.78 6.81 8.08 7.7 178.1
Lagodon rhomboids Pinfish seines >=71 2.86 1.80 10.8 545.7
Lagodon rhomboids Pinfish trawls >=71 -0.81 -0.14 15.4 321.6
Microgobius gulosus Clown goby seines All 12.66 9.97 11.70 7.4 243
Lag Flow Domain
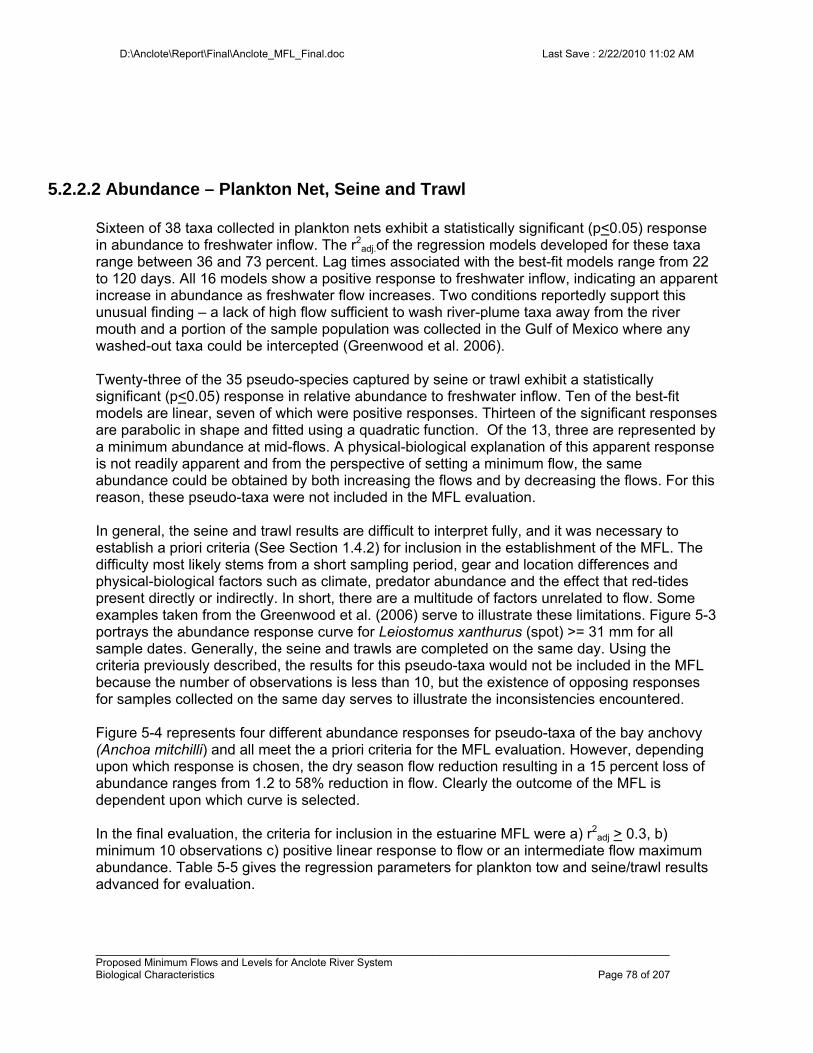
D:\Anclote\Report\Final\Anclote_MFL_Final.doc Last Save : 2/22/2010 11:02 AM
_________________________________________________________________________________________________ Proposed Minimum Flows and Levels for Anclote River System Biological Characteristics Page 78 of 207
5.2.2.2 Abundance – Plankton Net, Seine and Trawl Sixteen of 38 taxa collected in plankton nets exhibit a statistically significant (p<0.05) response in abundance to freshwater inflow. The r2
adj.of the regression models developed for these taxa range between 36 and 73 percent. Lag times associated with the best-fit models range from 22 to 120 days. All 16 models show a positive response to freshwater inflow, indicating an apparent increase in abundance as freshwater flow increases. Two conditions reportedly support this unusual finding – a lack of high flow sufficient to wash river-plume taxa away from the river mouth and a portion of the sample population was collected in the Gulf of Mexico where any washed-out taxa could be intercepted (Greenwood et al. 2006). Twenty-three of the 35 pseudo-species captured by seine or trawl exhibit a statistically significant (p<0.05) response in relative abundance to freshwater inflow. Ten of the best-fit models are linear, seven of which were positive responses. Thirteen of the significant responses are parabolic in shape and fitted using a quadratic function. Of the 13, three are represented by a minimum abundance at mid-flows. A physical-biological explanation of this apparent response is not readily apparent and from the perspective of setting a minimum flow, the same abundance could be obtained by both increasing the flows and by decreasing the flows. For this reason, these pseudo-taxa were not included in the MFL evaluation. In general, the seine and trawl results are difficult to interpret fully, and it was necessary to establish a priori criteria (See Section 1.4.2) for inclusion in the establishment of the MFL. The difficulty most likely stems from a short sampling period, gear and location differences and physical-biological factors such as climate, predator abundance and the effect that red-tides present directly or indirectly. In short, there are a multitude of factors unrelated to flow. Some examples taken from the Greenwood et al. (2006) serve to illustrate these limitations. Figure 5-3 portrays the abundance response curve for Leiostomus xanthurus (spot) >= 31 mm for all sample dates. Generally, the seine and trawls are completed on the same day. Using the criteria previously described, the results for this pseudo-taxa would not be included in the MFL because the number of observations is less than 10, but the existence of opposing responses for samples collected on the same day serves to illustrate the inconsistencies encountered. Figure 5-4 represents four different abundance responses for pseudo-taxa of the bay anchovy (Anchoa mitchilli) and all meet the a priori criteria for the MFL evaluation. However, depending upon which response is chosen, the dry season flow reduction resulting in a 15 percent loss of abundance ranges from 1.2 to 58% reduction in flow. Clearly the outcome of the MFL is dependent upon which curve is selected. In the final evaluation, the criteria for inclusion in the estuarine MFL were a) r2
adj > 0.3, b) minimum 10 observations c) positive linear response to flow or an intermediate flow maximum abundance. Table 5-5 gives the regression parameters for plankton tow and seine/trawl results advanced for evaluation.
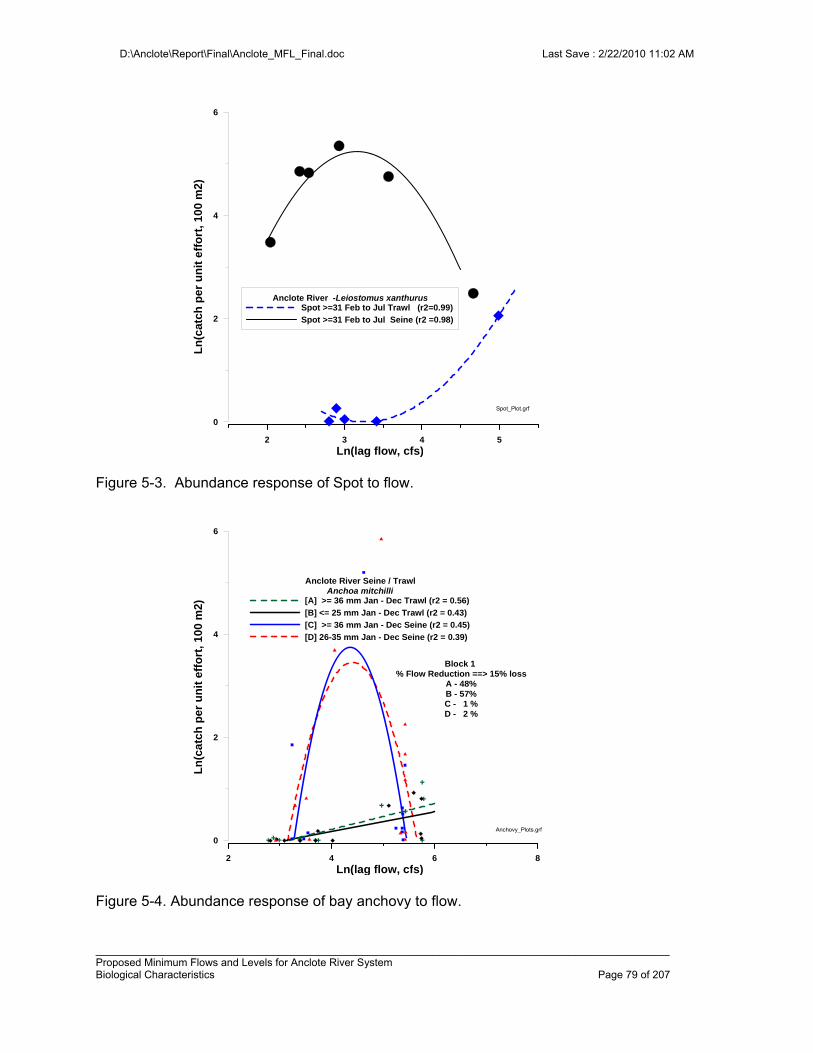
D:\Anclote\Report\Final\Anclote_MFL_Final.doc Last Save : 2/22/2010 11:02 AM
_________________________________________________________________________________________________ Proposed Minimum Flows and Levels for Anclote River System Biological Characteristics Page 79 of 207
Figure 5-3. Abundance response of Spot to flow.
Figure 5-4. Abundance response of bay anchovy to flow.
2 3 4 5
Ln(lag flow, cfs)
0
2
4
6
Ln
(cat
ch p
er
un
it e
ffo
rt,
10
0 m
2)
Anclote River -Leiostomus xanthurusSpot >=31 Feb to Jul Trawl (r2=0.99)
Spot >=31 Feb to Jul Seine (r2 =0.98)
Spot_Plot.grf
2 4 6 8
Ln(lag flow, cfs)
0
2
4
6
Ln
(ca
tch
pe
r u
nit
eff
ort
, 1
00
m2)
Anclote River Seine / TrawlAnchoa mitchilli
[A] >= 36 mm Jan - Dec Trawl (r2 = 0.56)
[B] <= 25 mm Jan - Dec Trawl (r2 = 0.43)
[C] >= 36 mm Jan - Dec Seine (r2 = 0.45)
[D] 26-35 mm Jan - Dec Seine (r2 = 0.39)
Anchovy_Plots.grf
Block 1 % Flow Reduction ==> 15% loss
A - 48%B - 57%C - 1 %D - 2 %
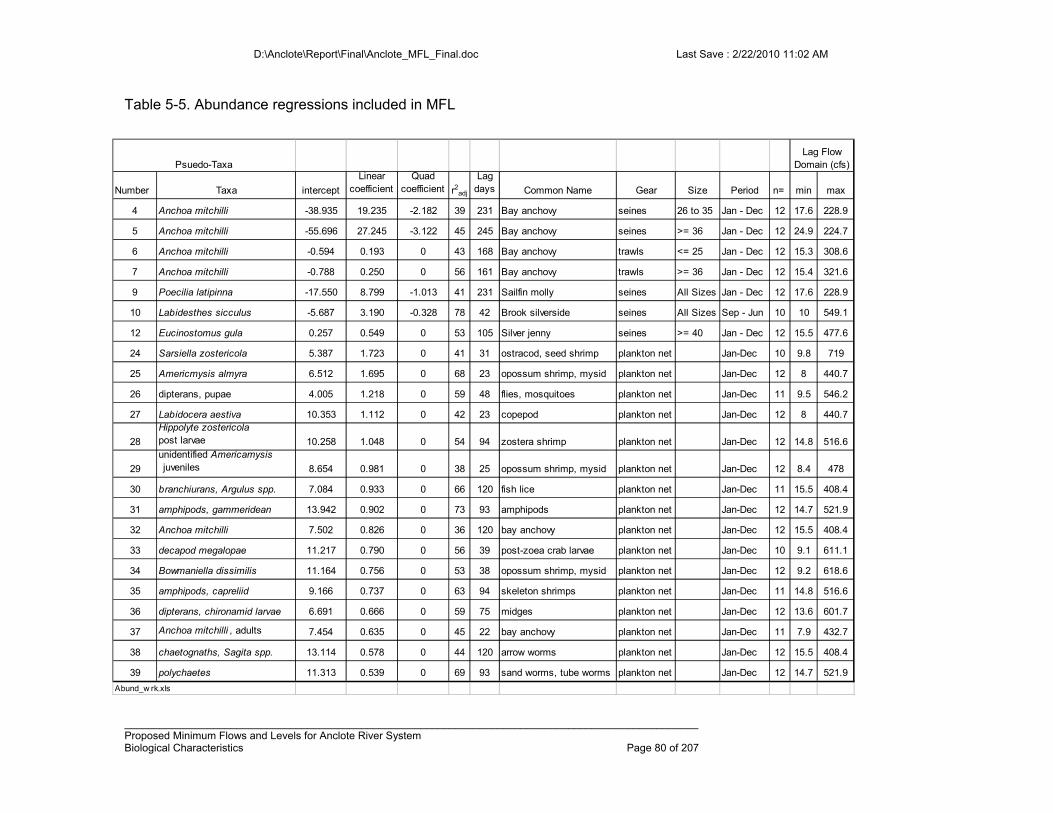
D:\Anclote\Report\Final\Anclote_MFL_Final.doc Last Save : 2/22/2010 11:02 AM
_________________________________________________________________________________________________ Proposed Minimum Flows and Levels for Anclote River System Biological Characteristics Page 80 of 207
Table 5-5. Abundance regressions included in MFL
Number Taxa intercept
Linear coefficient
Quad coefficient r2adj
Lagdays Common Name Gear Size Period n= min max
4 Anchoa mitchilli -38.935 19.235 -2.182 39 231 Bay anchovy seines 26 to 35 Jan - Dec 12 17.6 228.9
5 Anchoa mitchilli -55.696 27.245 -3.122 45 245 Bay anchovy seines >= 36 Jan - Dec 12 24.9 224.7
6 Anchoa mitchilli -0.594 0.193 0 43 168 Bay anchovy trawls <= 25 Jan - Dec 12 15.3 308.6
7 Anchoa mitchilli -0.788 0.250 0 56 161 Bay anchovy trawls >= 36 Jan - Dec 12 15.4 321.6
9 Poecilia latipinna -17.550 8.799 -1.013 41 231 Sailfin molly seines All Sizes Jan - Dec 12 17.6 228.9
10 Labidesthes sicculus -5.687 3.190 -0.328 78 42 Brook silverside seines All Sizes Sep - Jun 10 10 549.1
12 Eucinostomus gula 0.257 0.549 0 53 105 Silver jenny seines >= 40 Jan - Dec 12 15.5 477.6
24 Sarsiella zostericola 5.387 1.723 0 41 31 ostracod, seed shrimp plankton net Jan-Dec 10 9.8 719
25 Americmysis almyra 6.512 1.695 0 68 23 opossum shrimp, mysid plankton net Jan-Dec 12 8 440.7
26 dipterans, pupae 4.005 1.218 0 59 48 flies, mosquitoes plankton net Jan-Dec 11 9.5 546.2
27 Labidocera aestiva 10.353 1.112 0 42 23 copepod plankton net Jan-Dec 12 8 440.7
28
Hippolyte zostericola post larvae 10.258 1.048 0 54 94 zostera shrimp plankton net Jan-Dec 12 14.8 516.6
29
unidentified Americamysis juveniles 8.654 0.981 0 38 25 opossum shrimp, mysid plankton net Jan-Dec 12 8.4 478
30 branchiurans, Argulus spp. 7.084 0.933 0 66 120 fish lice plankton net Jan-Dec 11 15.5 408.4
31 amphipods, gammeridean 13.942 0.902 0 73 93 amphipods plankton net Jan-Dec 12 14.7 521.9
32 Anchoa mitchilli 7.502 0.826 0 36 120 bay anchovy plankton net Jan-Dec 12 15.5 408.4
33 decapod megalopae 11.217 0.790 0 56 39 post-zoea crab larvae plankton net Jan-Dec 10 9.1 611.1
34 Bowmaniella dissimilis 11.164 0.756 0 53 38 opossum shrimp, mysid plankton net Jan-Dec 12 9.2 618.6
35 amphipods, capreliid 9.166 0.737 0 63 94 skeleton shrimps plankton net Jan-Dec 11 14.8 516.6
36 dipterans, chironamid larvae 6.691 0.666 0 59 75 midges plankton net Jan-Dec 12 13.6 601.7
37 Anchoa mitchilli , adults 7.454 0.635 0 45 22 bay anchovy plankton net Jan-Dec 11 7.9 432.7
38 chaetognaths, Sagita spp. 13.114 0.578 0 44 120 arrow worms plankton net Jan-Dec 12 15.5 408.4
39 polychaetes 11.313 0.539 0 69 93 sand worms, tube worms plankton net Jan-Dec 12 14.7 521.9
Abund_w rk.xls
Lag Flow Domain (cfs)Psuedo-Taxa
D:\Anclote\Report\Final\Anclote_MFL_Final.doc Last Save : 2/22/2010 11:02 AM
___________________________________________________________________________________________________ Proposed Minimum Flows and Levels for Anclote River System Biological Characteristics Page 81 of 207
5.3 Mollusks
5.3.1 Descriptive Rapid-survey methods were used between December 12, 2005 and February 10, 2006 to census the mollusk community of the Anclote River estuary from its mouth to 15 kilometers upstream (Estevez and Robbins 2006 - Appendix 10-7). Sub-tidal grab samples were collected using a petite ponar sampler rather than pipe cores to ensure the collection of larger mollusks. Intertidal samples were collected using a spade or petite ponar sampler in areas with substrate unfit for wading. A total of 38 taxa were collected which the authors characterize as a “high” species richness compared to richness values for other southwest Florida estuaries such as Shell Creek with 11, Weeki Wachee River (15), Alafia River (20), Myakka River (20), Peace River (24) and Dona/Roberts Bay (24). The mollusk collections produced small specimens that occurred in low densities and short river reaches. The small size of specimens could not be explained, but it is posited that it may be characteristic of successions of successful recruitment with slow growth or high mortality prior to maturation. Although salinity was not measured during the survey, specimen size may be affected by a dynamic and extreme range in salinity at a location. The decline or “sag” in species richness observed between 1 and 4 kilometers upstream of the mouth may be attributed to the extensive dredging noted in the lower 5.47 kilometers of the estuary, west of US Highway Alternate 19 (Estevez and Robbins 2006).
5.3.2 Relation to Inflow Data collected from surveys of mollusks in six southwest Florida estuaries (Peace, Myakka, Alafia, Weeki Wachee, Shell Creek and Shakett Creek) was evaluated to characterize regional associations with sediment and water quality characteristics (Montagna 2006). Mollusk community parameters were found to be more highly correlated with salinity than with other water-quality constituents or sediment characteristics. A number of the taxa collected from the Anclote River estuary are identified in the regional analysis (Table 5-6). The Asian clam (Corbicula fluminea) is an exotic species introduced to Florida waters. It is the dominant species in the regional study and is attributable to very high densities found in the tidal freshwater reaches of the Peace River (Montagna 2006 – Appendix 10-8). The abundance statistics reported by Montagna (2006) were adjusted to reflect the exclusion of the Asian clam in the comparison of abundance with species collected from the Anclote River.
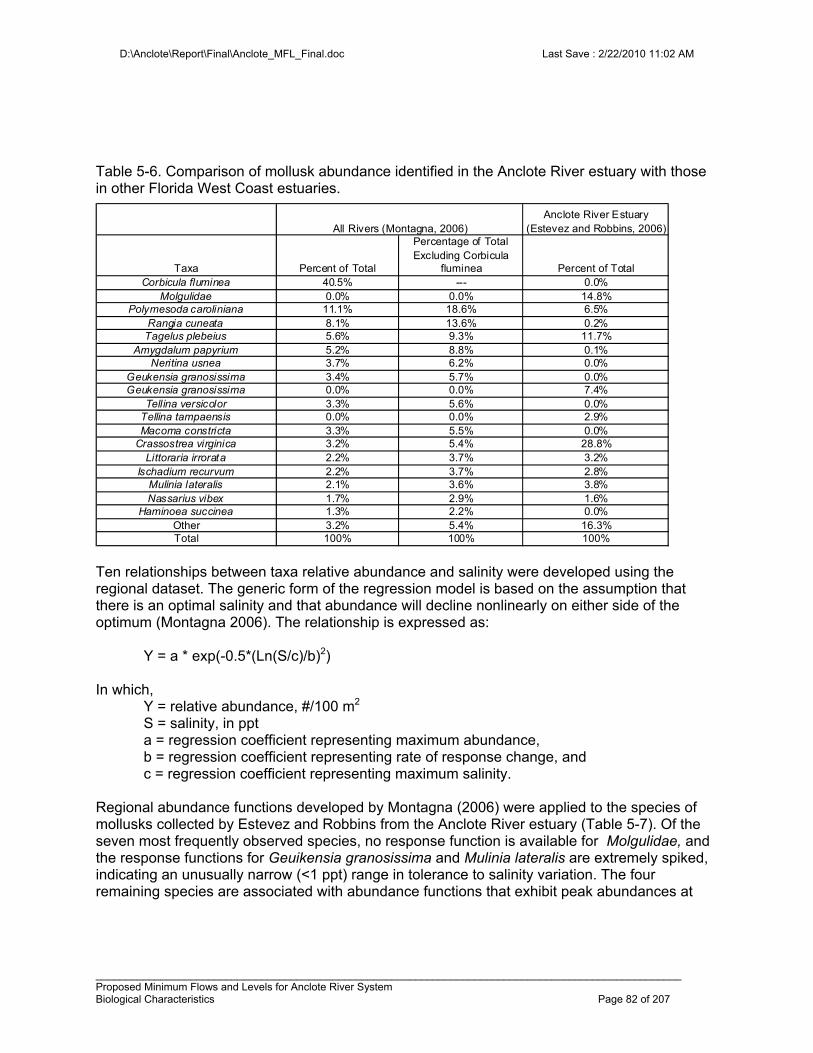
D:\Anclote\Report\Final\Anclote_MFL_Final.doc Last Save : 2/22/2010 11:02 AM
___________________________________________________________________________________________________ Proposed Minimum Flows and Levels for Anclote River System Biological Characteristics Page 82 of 207
Table 5-6. Comparison of mollusk abundance identified in the Anclote River estuary with those in other Florida West Coast estuaries.
Ten relationships between taxa relative abundance and salinity were developed using the regional dataset. The generic form of the regression model is based on the assumption that there is an optimal salinity and that abundance will decline nonlinearly on either side of the optimum (Montagna 2006). The relationship is expressed as: Y = a * exp(-0.5*(Ln(S/c)/b)2) In which, Y = relative abundance, #/100 m2 S = salinity, in ppt
a = regression coefficient representing maximum abundance, b = regression coefficient representing rate of response change, and c = regression coefficient representing maximum salinity.
Regional abundance functions developed by Montagna (2006) were applied to the species of mollusks collected by Estevez and Robbins from the Anclote River estuary (Table 5-7). Of the seven most frequently observed species, no response function is available for Molgulidae, and the response functions for Geuikensia granosissima and Mulinia lateralis are extremely spiked, indicating an unusually narrow (<1 ppt) range in tolerance to salinity variation. The four remaining species are associated with abundance functions that exhibit peak abundances at
Anclote River Estuary (Estevez and Robbins, 2006)
Taxa Percent of Total
Percentage of Total Excluding Corbicula
fluminea Percent of TotalCorbicula fluminea 40.5% --- 0.0%
Molgulidae 0.0% 0.0% 14.8%Polymesoda caroliniana 11.1% 18.6% 6.5%
Rangia cuneata 8.1% 13.6% 0.2%Tagelus plebeius 5.6% 9.3% 11.7%
Amygdalum papyrium 5.2% 8.8% 0.1%Neritina usnea 3.7% 6.2% 0.0%
Geukensia granosissima 3.4% 5.7% 0.0%Geukensia granosissima 0.0% 0.0% 7.4%
Tellina versicolor 3.3% 5.6% 0.0%Tellina tampaensis 0.0% 0.0% 2.9%Macoma constricta 3.3% 5.5% 0.0%
Crassostrea virginica 3.2% 5.4% 28.8%Littoraria irrorata 2.2% 3.7% 3.2%
Ischadium recurvum 2.2% 3.7% 2.8%Mulinia lateralis 2.1% 3.6% 3.8%Nassarius vibex 1.7% 2.9% 1.6%
Haminoea succinea 1.3% 2.2% 0.0%Other 3.2% 5.4% 16.3%Total 100% 100% 100%
All Rivers (Montagna, 2006)
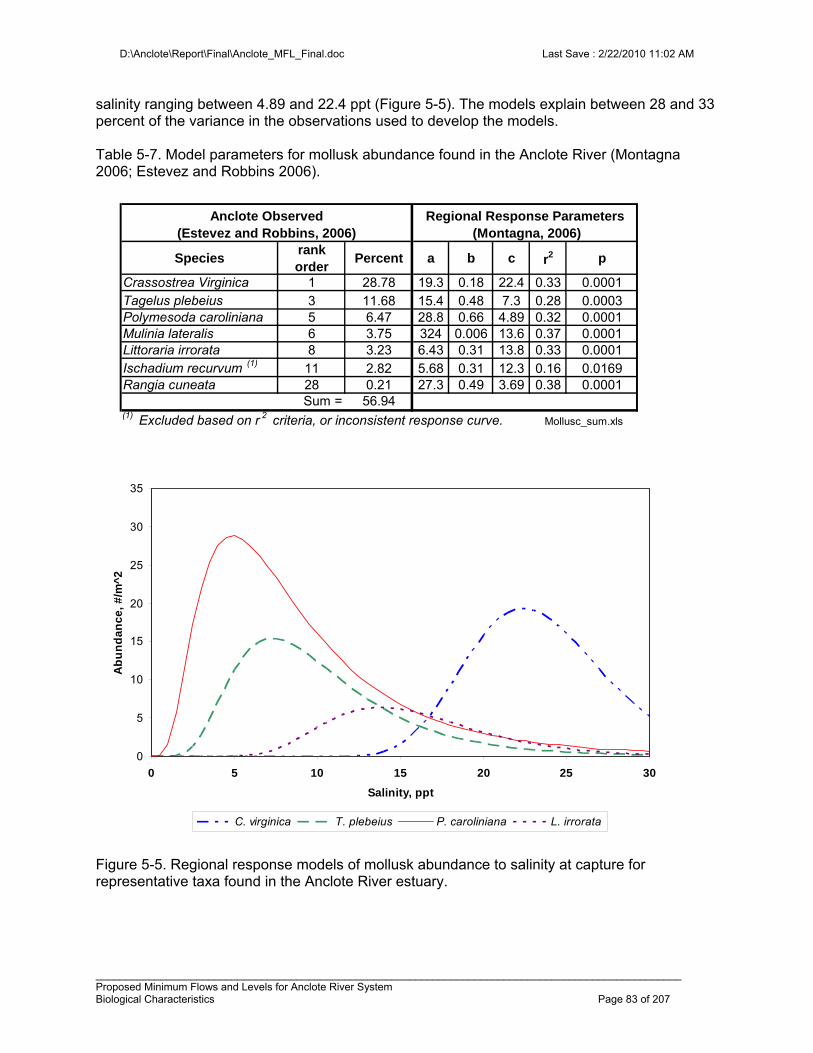
D:\Anclote\Report\Final\Anclote_MFL_Final.doc Last Save : 2/22/2010 11:02 AM
___________________________________________________________________________________________________ Proposed Minimum Flows and Levels for Anclote River System Biological Characteristics Page 83 of 207
salinity ranging between 4.89 and 22.4 ppt (Figure 5-5). The models explain between 28 and 33 percent of the variance in the observations used to develop the models. Table 5-7. Model parameters for mollusk abundance found in the Anclote River (Montagna 2006; Estevez and Robbins 2006).
Figure 5-5. Regional response models of mollusk abundance to salinity at capture for representative taxa found in the Anclote River estuary.
0
5
10
15
20
25
30
35
0 5 10 15 20 25 30
Salinity, ppt
Ab
un
da
nc
e,
#/m
^2
C. virginica T. plebeius P. caroliniana L. irrorata
Speciesrank order
Percent a b c r2 p
Crassostrea Virginica 1 28.78 19.3 0.18 22.4 0.33 0.0001Tagelus plebeius 3 11.68 15.4 0.48 7.3 0.28 0.0003Polymesoda caroliniana 5 6.47 28.8 0.66 4.89 0.32 0.0001Mulinia lateralis 6 3.75 324 0.006 13.6 0.37 0.0001Littoraria irrorata 8 3.23 6.43 0.31 13.8 0.33 0.0001Ischadium recurvum (1) 11 2.82 5.68 0.31 12.3 0.16 0.0169Rangia cuneata 28 0.21 27.3 0.49 3.69 0.38 0.0001
Sum = 56.94(1) Excluded based on r 2 criteria, or inconsistent response curve.
Anclote Observed (Estevez and Robbins, 2006)
Regional Response Parameters (Montagna, 2006)
Mollusc_sum.xls
D:\Anclote\Report\Final\Anclote_MFL_Final.doc Last Save : 2/22/2010 11:02 AM
_____________________________________________________________________________________________ Proposed Minimum Flows and Levels for Anclote River System Resources of Concern Page 84 of 207
CHAPTER 6 - RESOURCES OF CONCERN & CRITERIA
6.1 Overview The resources addressed by the District's minimum flows and levels analyses include the surface waters and biological communities associated with the river system, including the river channel and its floodplain. A river system is physiographically complex, with a meandering channel and associated floodplain wetlands. This hydrologic and physical setting provides habitat for a diverse array of plant and animal populations. Because "[a]quatic species have evolved life history strategies primarily in direct response to the natural flow regimes" (Bunn and Arthington 2002), a primary objective of minimum flows and levels analysis is to provide for the hydrologic requirements of biological communities associated with the river system. Human uses of the natural resources are also an important consideration for the establishment of minimum flows and levels. Such uses include fishing, swimming, wildlife observation, aesthetic enjoyment, and boating. In their peer review report on the upper Peace River, Gore et al. (2002) stated, "[i]n general, instream flow analysts consider a loss of more than 15% habitat, as compared to undisturbed or current conditions, to be a significant impact on that population or assemblage." This recommendation was made in consideration of employing PHABSIM for analyzing flow, water depth and substrate preferences that define aquatic species habitats. With some exceptions (e.g., loss of fish passage or wetted perimeter inflection point), there are few "bright lines" which can be relied upon to judge when "significant harm" occurs. Rather loss of habitat in many cases occurs incrementally as flows decline, often without a clear inflection point or threshold. In the upper river, the District focuses primarily on retaining habitat in the presence of reduced flows. Examples of habitats of concern which the District evaluates include a) maintaining sufficient depth of water for fish passage and recreation, b)maintenance of a productive wetted perimeter and c) providing a sufficient number of days when high flows provide a connection between the river and the flood plain. Downstream in the estuarine system, the District determines the minimum flows necessary to maintain salinity habitats in the form of oligohaline volumes, bottom areas subjected to various salinities and maintenance of salinity regimes for riparian elements. In addition and where possible, the District incorporates direct protective measures for biological resources by limiting the impacts to abundance or diversity resulting from altered flows. Typical life forms evaluated include fish and invertebrates, benthos (with emphasis on mollusk), and manatees in the case of springs that provide a thermal refuge. The remainder of this chapter is devoted to identifying those resources, beginning with the freshwater evaluations.
D:\Anclote\Report\Final\Anclote_MFL_Final.doc Last Save : 2/22/2010 11:02 AM
_____________________________________________________________________________________________ Proposed Minimum Flows and Levels for Anclote River System Resources of Concern Page 85 of 207
6.2 Upper River / Freshwater
6.2.1 Resource Management Goals and Key Habitat Indicators The District approach for setting freshwater minimum flows and levels is habitat-based. Because river systems include a variety of aquatic and wetland habitats that support a diversity of biological communities, it is necessary to identify key habitats for consideration, and, when possible, determine the hydrologic requirements for the specific biotic assemblages associated with the habitats. It is assumed that addressing these management goals will also provide for other ecological functions of the river system that are more difficult to quantify, such as organic matter transport and the maintenance of river channel geomorphology. Resource management goals for the Anclote River addressed by our minimum flows analysis include:
1) maintenance of minimum water depths in the river channel for fish passage and recreational use;
2) maintenance of water depths above inflection points in the wetted perimeter of the river channel to maximize aquatic habitat with the least amount of flow;
3) protection of in-channel habitat for selected fish species and macroinvertebrate assemblages;
4) inundation of woody habitats including snags and exposed roots in the stream channel; and
5) maintenance of seasonal hydrologic connections between the river channel and floodplain to ensure persistence of floodplain structure and function.
These goals are consistent with management goals identified by other researchers as discussed in Chapter 1. The rationale for identifying these goals and the habitats and ecological indicators associated with the goals are addressed in subsequent sections of this chapter. Field and analytical methods used to assess hydrologic requirements associated with the habitats and indicators are presented in Chapter 7, and results of the minimum flows and levels analyses are presented in Chapter 8.
6.2.2 Fish Passage and Recreational Use Ensuring sufficient flows for the passage or movement of fishes is an important component of the development of minimum flows. Maintenance of these flows is expected to ensure continuous flow within the channel or river segment, allow for recreational navigation (e.g., canoeing), improve aesthetics, and avoid or lessen potential negative effects associated with pool isolation (e.g., high water temperatures, low dissolved oxygen concentrations, localized phytoplankton blooms, and increased predatory pressure resulting from loss of habitat/cover). Tharme and King (1998, as cited by Postel and Richter 2003), in developing a "building block" approach for South African rivers, listed the retention of a river's natural perenniality or nonperenniality as one of eight general principles for managing river flows. For many rivers within the District, flows and corresponding water depths adequate for fish passage are currently or were historically maintained by base flow during the dry season (Figure 6-1). For example, in the upper Peace River, historical flows were sufficient for maintaining a naturally
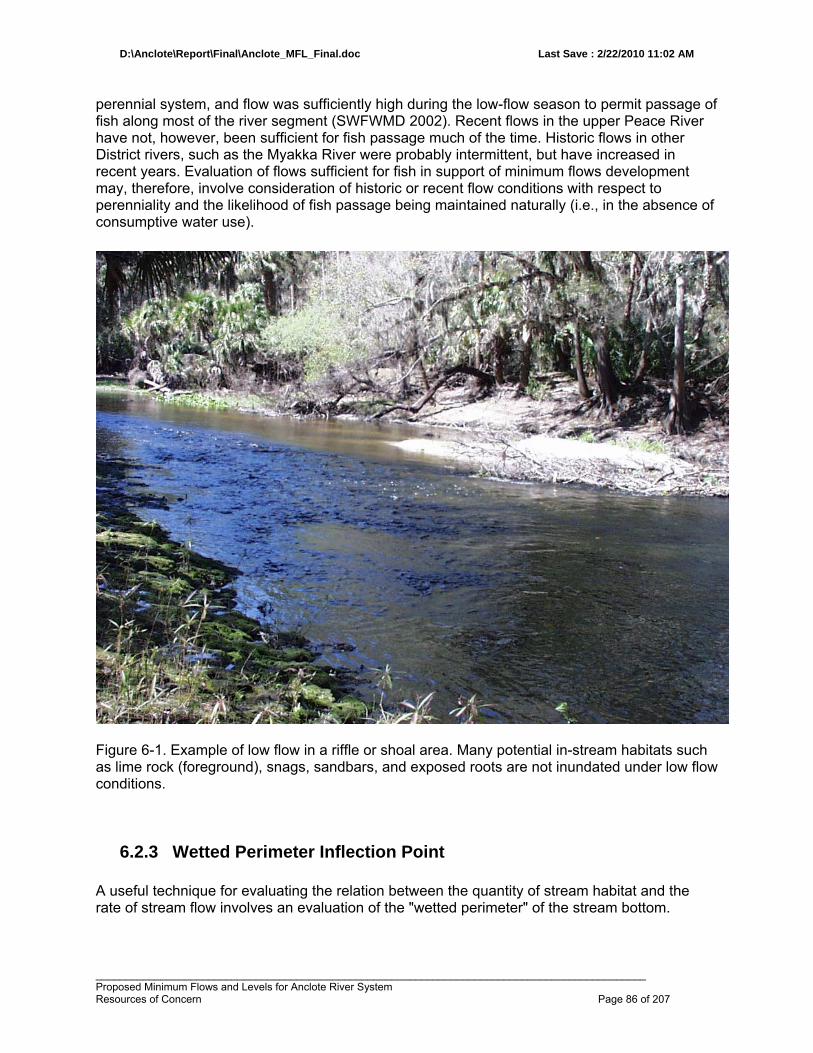
D:\Anclote\Report\Final\Anclote_MFL_Final.doc Last Save : 2/22/2010 11:02 AM
_____________________________________________________________________________________________ Proposed Minimum Flows and Levels for Anclote River System Resources of Concern Page 86 of 207
perennial system, and flow was sufficiently high during the low-flow season to permit passage of fish along most of the river segment (SWFWMD 2002). Recent flows in the upper Peace River have not, however, been sufficient for fish passage much of the time. Historic flows in other District rivers, such as the Myakka River were probably intermittent, but have increased in recent years. Evaluation of flows sufficient for fish in support of minimum flows development may, therefore, involve consideration of historic or recent flow conditions with respect to perenniality and the likelihood of fish passage being maintained naturally (i.e., in the absence of consumptive water use).
Figure 6-1. Example of low flow in a riffle or shoal area. Many potential in-stream habitats such as lime rock (foreground), snags, sandbars, and exposed roots are not inundated under low flow conditions.
6.2.3 Wetted Perimeter Inflection Point A useful technique for evaluating the relation between the quantity of stream habitat and the rate of stream flow involves an evaluation of the "wetted perimeter" of the stream bottom.
D:\Anclote\Report\Final\Anclote_MFL_Final.doc Last Save : 2/22/2010 11:02 AM
_____________________________________________________________________________________________ Proposed Minimum Flows and Levels for Anclote River System Resources of Concern Page 87 of 207
Wetted perimeter is defined as the distance along the streambed and banks at a cross section where there is contact with water. According to Annear and Conder (1984), wetted perimeter methods for evaluating stream flow requirements assume that there is a direct relationship between wetted perimeter and fish habitat. Studies on streams in the southeast have demonstrated that the greatest amount of macroinvertebrate biomass per unit reach of stream occurs on the stream bottom (e.g., Benke et al. 1985). Although production on a unit area basis may be greater on snag and root habitat, the greater area of stream bottom along a reach makes it the most productive habitat under low flow conditions. By plotting the response of wetted perimeter to incremental changes in discharge, an inflection can be identified in the resulting curve where small decreases in flow result in increasingly greater decreases in wetted perimeter. This point on the curve represents a flow at which the water surface recedes from stream banks and fish habitat is lost at an accelerated rate. Stalnaker et al. (1995) describe the wetted perimeter approach as a technique for using "the break" or inflection point in the stream's wetted perimeter versus discharge relation as a surrogate for minimally acceptable habitat. They note that when this approach is applied to riffle (shoal) areas, "the assumption is that minimum flow satisfies the needs for food production, fish passage and spawning." We view the wetted perimeter approach as an important technique for evaluating minimum flows and levels near the low end of the flow regime. The wetted perimeter inflection point in the channel provides for large increases in bottom habitat for relatively small increases of flow. This point is defined as the "lowest wetted perimeter inflection point". It is not assumed that flows associated with the lowest wetted perimeter inflection point meet fish passage needs or address other wetted perimeter inflection points outside the river channel. However, identification of the lowest wetted perimeter inflection point permits evaluation of flows that provide the greatest amount of inundated bottom habitat in the river channel on a per-unit flow basis.
6.2.4 In-Channel Habitats for Fish and Macroinvertebrates Maintenance of flows greater than those allowing for fish passage and maximization of wetted perimeter are needed to provide aquatic biota with sufficient resources for persistence within a river segment. Feeding, reproductive and cover requirements of riverine species have evolved in response to natural flow regimes, and these life history requirements can be used to develop protective minimum flows. To achieve this goal, PHABSIM protocols are included in the District's approach for establishing minimum flows for river systems. PHABSIM provides a means to quantify changes in habitat that are associated with changes in stream flow. PHABSIM is the single most widely used methodology for establishing "minimum flows" on rivers (Postel and Richter 2003), and its use was recommended in the peer review of proposed MFLs for the upper Peace River (Gore et al. 2002). The technique has, however, been criticized, because it is based on the specific requirements of a few select species (typically fish of economic or recreational value), and it is argued that such an approach ignores many ecosystem components. This criticism is overcome in the current District approach for MFLs development, since PHABSIM represents only one of several tools used to evaluate flow requirements. Results of PHABSIM analyses are used to assess flow needs during periods of low to medium flows.
D:\Anclote\Report\Final\Anclote_MFL_Final.doc Last Save : 2/22/2010 11:02 AM
_____________________________________________________________________________________________ Proposed Minimum Flows and Levels for Anclote River System Resources of Concern Page 88 of 207
6.2.5 Woody Habitats Stream ecosystem theory emphasizes the role of instream habitats in maintaining ecosystem integrity. These habitats form a mosaic of geomorphically defined substrate patches (Brussock et al. 1985), each with characteristic disturbance regimes and macroinvertebrate assemblages (Huryn and Wallace 1987). For instance, invertebrate community composition and production in a blackwater river varies greatly among different habitat types, where the habitats are distinguished by substrates of different stability (e.g., sand, mud and woody debris) (Benke et al. 1984, Smock et al. 1985, Smock and Roeding 1986). Ecosystem dynamics are influenced by the relative abundance of these different habitat types. Changes in community composition and function occurring along the river continuum are in part a consequence of the relative abundance of different habitat patches, which are under the control of channel geomorphology and flow. For determining MFLs, we identify key habitats and features that play a significant role in the ecology of a river system using a habitat-based approach that includes a combination of best available data and site-specific field work. Among the various instream habitats that can be influenced by different flow conditions, woody habitats (snags and exposed roots) are especially important. In low-gradient streams of the southeastern U.S.A. coastal plain, wood is recognized as important habitat (Cudney and Wallace 1980; Benke et al. 1984, Wallace and Benke 1984; Thorp et al. 1990; Benke and Wallace 1990). Wood habitats harbor the most biologically diverse instream fauna and are the most productive habitat on a per unit area basis (Benke et al. 1985). Comparisons of different instream habitats in a southeastern stream indicates that production on snags is at least twice as high as that found in any other habitat (Smock et al. 1985). Wood provides advantages as habitat, as it is relatively stable and long lived compared to sand substrata, which constantly shift (Edwards and Meyer 1987). Even bedrock substrates, though the most stable of all, are susceptible to smothering by shifting sand and silt. Wood is a complex structural habitat with microhabitats (such as interstices that increase surface area) that provide cover for a variety of invertebrates. As an organic substrate, wood is also a food resource for utilization by microbial food chains, which in turn supports colonization and production of macroinvertebrates. As physical impediments to flow, woody structures enhance the formation of leaf packs and larger debris dams. These resulting habitats provide the same functions as woody substrata in addition to enhancing habitat diversity instream. Organisms in higher trophic levels such as fish have been shown to also depend on woody structures either for cover, as feeding grounds, or as nesting areas. Since woody habitats are potentially the most important instream habitat for macroinvertebrate production, inundation of these habitats for sufficient periods is considered critical to secondary production (including fish and other wildlife) and the maintenance of aquatic food webs. Not only is inundation considered important, but sustained inundation prior to colonization by invertebrates is necessary to allow for microbial conditioning and periphyton development. Without this preconditioning, the habitat offered by snags and wood is essentially a substrate for attachment without associated food resources. The development of food resources (microbes) on the substrate is needed by the assemblage of macroinvertebrates that typically inhabit these surfaces. After the proper conditioning period, continuous inundation is required for many species to complete development. The inundated woody substrate (both snags and exposed roots) within the stream channel is viewed as an important riverine habitat, and it is assumed
D:\Anclote\Report\Final\Anclote_MFL_Final.doc Last Save : 2/22/2010 11:02 AM
_____________________________________________________________________________________________ Proposed Minimum Flows and Levels for Anclote River System Resources of Concern Page 89 of 207
that withdrawals or diversions of river flow could significantly decrease the availability of this habitat under medium to high flow conditions.
6.2.6 Hydrologic Connections Between the River Channel and Floodplain
A goal of the District's minimum flows and levels approach is to ensure that the hydrologic requirements of biological communities associated with the river floodplain are met during seasonally predictable wet periods. Periodic inundation of riparian floodplains by high flows is closely linked with the overall biological productivity of river ecosystems (Crance 1988, Junk et al., 1989). Many fish and wildlife species associated with rivers utilize both instream and floodplain habitats, and inundation of the river floodplains greatly expands the habitat and food resources available to these organisms (Wharton et al. 1982, Ainsle et al. 1999, Hill and Cichra 2002). Inundation during high flows also provides a subsidy of water and nutrients that supports high rates of primary production in river floodplains (Conner and Day 1979, Brinson et al. 1981). This primary production yields large amounts of organic detritus, which is critical to food webs on the floodplain and within the river channel (Vannote et al. 1980, Gregory et al. 1991). Floodplain inundation also contributes to other physical-chemical processes that can affect biological production, uptake and transformation of macro-nutrients (Kuensler 1989, Walbridge and Lockaby 1994). Soils in river floodplains exhibit physical and chemical properties that are important to the overall function of the river ecosystem (Wharton et al. 1982, Stanturf and Schenholtz 1998). Anaerobic soil conditions can persist in areas where river flooding or soil saturation is of sufficient depth and duration. The decomposition of organic matter is much slower in anaerobic environments, and mucky or peaty organic soils can develop in saturated or inundated floodplain zones (Tate 1980, Brown et al. 1990). Although these soils may dry out on a seasonal basis, typically long hydroperiods contribute to their high organic content. Plant species that grow on flooded, organic soils are tolerant of anoxic conditions and the physical structure of these soils (Hook and Brown 1973, McKevlin et al. 1998). Such adaptations can be an important selective mechanism that determines plant community composition. Because changes in river hydrology can potentially affect the distribution and characteristics of floodplain soils, soil distributions and their relationship to river hydrology are routinely investigated as part of minimum flows and levels determinations for District rivers. Compared to instream evaluations of MFLs requirements, there has been relatively little work done on river flows necessary for meeting the requirements of floodplain species, communities or functions. Our work on the Peace and Alafia Rivers suggests that direct and continuous inundation of floodplain wetlands by river flows is in many cases not sufficient to meet the published inundation needs of the dominant species found in the wetlands. There are probably several reasons for this apparent inconsistency. Some floodplain systems likely include seepage wetlands, dependent on hydrologic processes other than direct inundation from the river. Other wetlands may occur in depressional areas where water is retained after subsidence of river flows. The District's approach to protection of flows associated with floodplain habitats, communities and functions involves consideration of the frequency and duration of direct connection between
D:\Anclote\Report\Final\Anclote_MFL_Final.doc Last Save : 2/22/2010 11:02 AM
_____________________________________________________________________________________________ Proposed Minimum Flows and Levels for Anclote River System Resources of Concern Page 90 of 207
the river channel and the floodplain. As part of this process, plant communities and soils are identified across the river floodplain at a number of sites, and periods of inundation/connection with the river are reconstructed on an annual or seasonal basis. These data are used to characterize the frequency and duration of direct connection/ inundation of these communities to or by the river and to develop criteria for minimum flow development based on temporal loss of habitat (Munson and Delfino 2007).
6.3 Lower River / Estuarine Evaluation criteria were established for habitat (salinity and structural) and biological resources including specific fish/invertebrate taxa, the benthic community at large and dominant mollusk taxa encountered in the Anclote estuary.
6.3.1 Habitats of Concern
6.3.1.1 Salinity Establishment of an MFL requires the identification of biologically-relevant metrics that can be defensibly and quantitatively related to variation in freshwater flows. The results presented in Chapter 4 indicate that there is a quantifiable and defensible relationship between salinity and freshwater flow. Most organisms found in estuaries are tolerant of a range of salinities and the biological relevance of salinity habitat can often be viewed as a continuum (See Figures 5-1 and 5-6). Therefore a range of salinities habitats was assessed. The habitat associated with < 2ppt, < 5 ppt, < 10 ppt and < 15 ppt were evaluated separately using the following metrics:
the volume of water in the system less than a given salinity, since the fishes in the Anclote generally utilize the entire water column,
the bottom area in the system less than a given salinity, since the benthic
macroinvertebrates inhabit the bottom substrate in the Anclote, In addition to the volume and area at a given salinity, maintenance of salinity at a particular fixed habitat is also of concern. The river reach extending from Rkm 5 to Rkm 12 (Figure 6-2) is characterized by numerous islands and a high degree of braiding and for purposes of the estuarine MFL was defined as a habitat of concern. Maintenance of salinity at the end points of this habitat was established as an additional goal of the estuarine MFL.
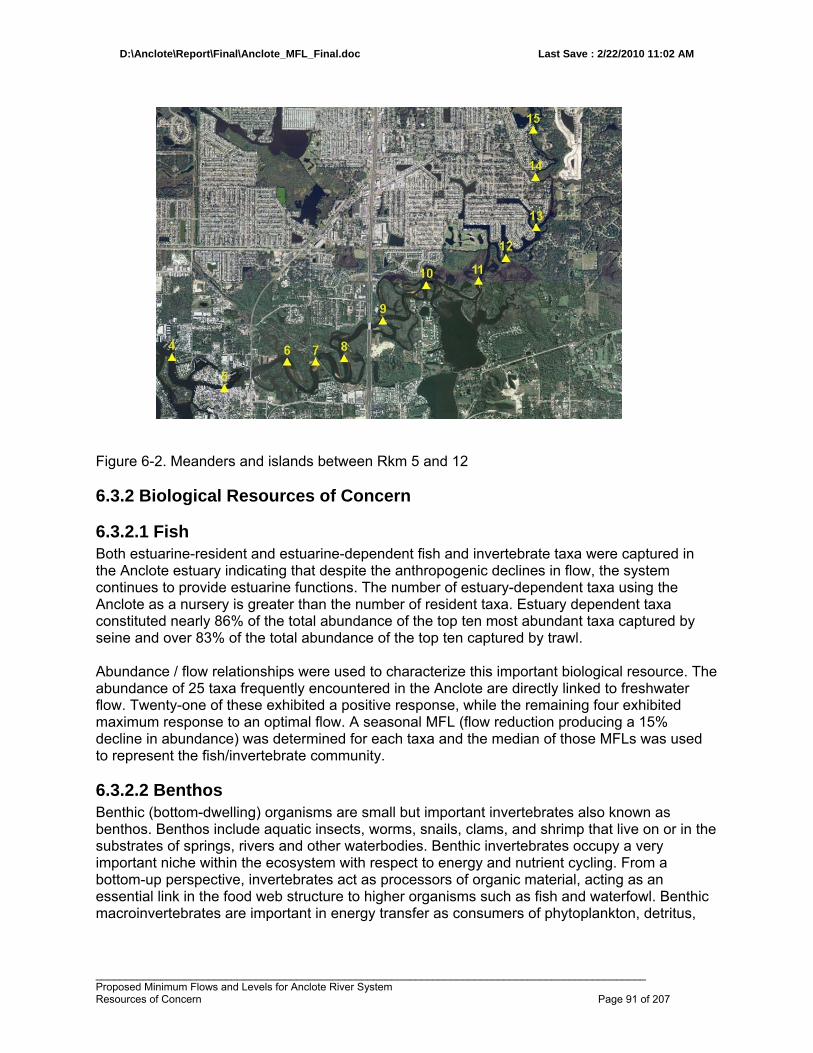
D:\Anclote\Report\Final\Anclote_MFL_Final.doc Last Save : 2/22/2010 11:02 AM
_____________________________________________________________________________________________ Proposed Minimum Flows and Levels for Anclote River System Resources of Concern Page 91 of 207
Figure 6-2. Meanders and islands between Rkm 5 and 12
6.3.2 Biological Resources of Concern
6.3.2.1 Fish Both estuarine-resident and estuarine-dependent fish and invertebrate taxa were captured in the Anclote estuary indicating that despite the anthropogenic declines in flow, the system continues to provide estuarine functions. The number of estuary-dependent taxa using the Anclote as a nursery is greater than the number of resident taxa. Estuary dependent taxa constituted nearly 86% of the total abundance of the top ten most abundant taxa captured by seine and over 83% of the total abundance of the top ten captured by trawl. Abundance / flow relationships were used to characterize this important biological resource. The abundance of 25 taxa frequently encountered in the Anclote are directly linked to freshwater flow. Twenty-one of these exhibited a positive response, while the remaining four exhibited maximum response to an optimal flow. A seasonal MFL (flow reduction producing a 15% decline in abundance) was determined for each taxa and the median of those MFLs was used to represent the fish/invertebrate community.
6.3.2.2 Benthos Benthic (bottom-dwelling) organisms are small but important invertebrates also known as benthos. Benthos include aquatic insects, worms, snails, clams, and shrimp that live on or in the substrates of springs, rivers and other waterbodies. Benthic invertebrates occupy a very important niche within the ecosystem with respect to energy and nutrient cycling. From a bottom-up perspective, invertebrates act as processors of organic material, acting as an essential link in the food web structure to higher organisms such as fish and waterfowl. Benthic macroinvertebrates are important in energy transfer as consumers of phytoplankton, detritus,
D:\Anclote\Report\Final\Anclote_MFL_Final.doc Last Save : 2/22/2010 11:02 AM
_____________________________________________________________________________________________ Proposed Minimum Flows and Levels for Anclote River System Resources of Concern Page 92 of 207
zooplankton, and other benthic organisms, as well as prey for both fishes and birds. Benthic macroinvertebrates also fulfill an important role as bioturbators, in which tubiculous and burrowing species disturb the sediment. Such actions bring suspended sediments into contact with the water column. In this way, sediment nutrients and pollutants may be trans-located and sediments may become more oxygenated. A relationship between benthic diversity and salinity was developed from Anclote estuary samples to represent this important biological resource.
6.3.2.3 Mollusk The mollusk criterion was based on maintaining at least eighty-five percent of the abundance of dominant native taxa that exhibited sufficient response (e.g. r2 > 0.3) to salinity. Six taxa were chosen and the median of the MFL results were used to represent the mollusk community.
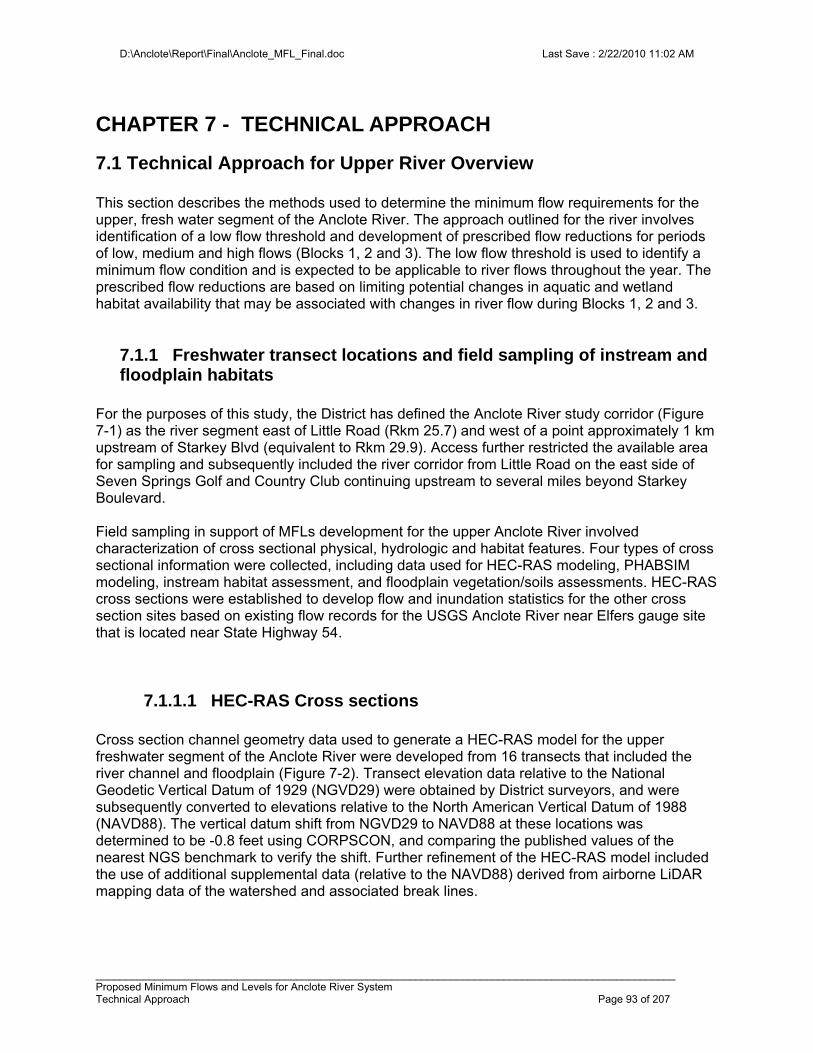
D:\Anclote\Report\Final\Anclote_MFL_Final.doc Last Save : 2/22/2010 11:02 AM
__________________________________________________________________________________________________ Proposed Minimum Flows and Levels for Anclote River System Technical Approach Page 93 of 207
CHAPTER 7 - TECHNICAL APPROACH
7.1 Technical Approach for Upper River Overview This section describes the methods used to determine the minimum flow requirements for the upper, fresh water segment of the Anclote River. The approach outlined for the river involves identification of a low flow threshold and development of prescribed flow reductions for periods of low, medium and high flows (Blocks 1, 2 and 3). The low flow threshold is used to identify a minimum flow condition and is expected to be applicable to river flows throughout the year. The prescribed flow reductions are based on limiting potential changes in aquatic and wetland habitat availability that may be associated with changes in river flow during Blocks 1, 2 and 3.
7.1.1 Freshwater transect locations and field sampling of instream and floodplain habitats
For the purposes of this study, the District has defined the Anclote River study corridor (Figure 7-1) as the river segment east of Little Road (Rkm 25.7) and west of a point approximately 1 km upstream of Starkey Blvd (equivalent to Rkm 29.9). Access further restricted the available area for sampling and subsequently included the river corridor from Little Road on the east side of Seven Springs Golf and Country Club continuing upstream to several miles beyond Starkey Boulevard. Field sampling in support of MFLs development for the upper Anclote River involved characterization of cross sectional physical, hydrologic and habitat features. Four types of cross sectional information were collected, including data used for HEC-RAS modeling, PHABSIM modeling, instream habitat assessment, and floodplain vegetation/soils assessments. HEC-RAS cross sections were established to develop flow and inundation statistics for the other cross section sites based on existing flow records for the USGS Anclote River near Elfers gauge site that is located near State Highway 54.
7.1.1.1 HEC-RAS Cross sections Cross section channel geometry data used to generate a HEC-RAS model for the upper freshwater segment of the Anclote River were developed from 16 transects that included the river channel and floodplain (Figure 7-2). Transect elevation data relative to the National Geodetic Vertical Datum of 1929 (NGVD29) were obtained by District surveyors, and were subsequently converted to elevations relative to the North American Vertical Datum of 1988 (NAVD88). The vertical datum shift from NGVD29 to NAVD88 at these locations was determined to be -0.8 feet using CORPSCON, and comparing the published values of the nearest NGS benchmark to verify the shift. Further refinement of the HEC-RAS model included the use of additional supplemental data (relative to the NAVD88) derived from airborne LiDAR mapping data of the watershed and associated break lines.
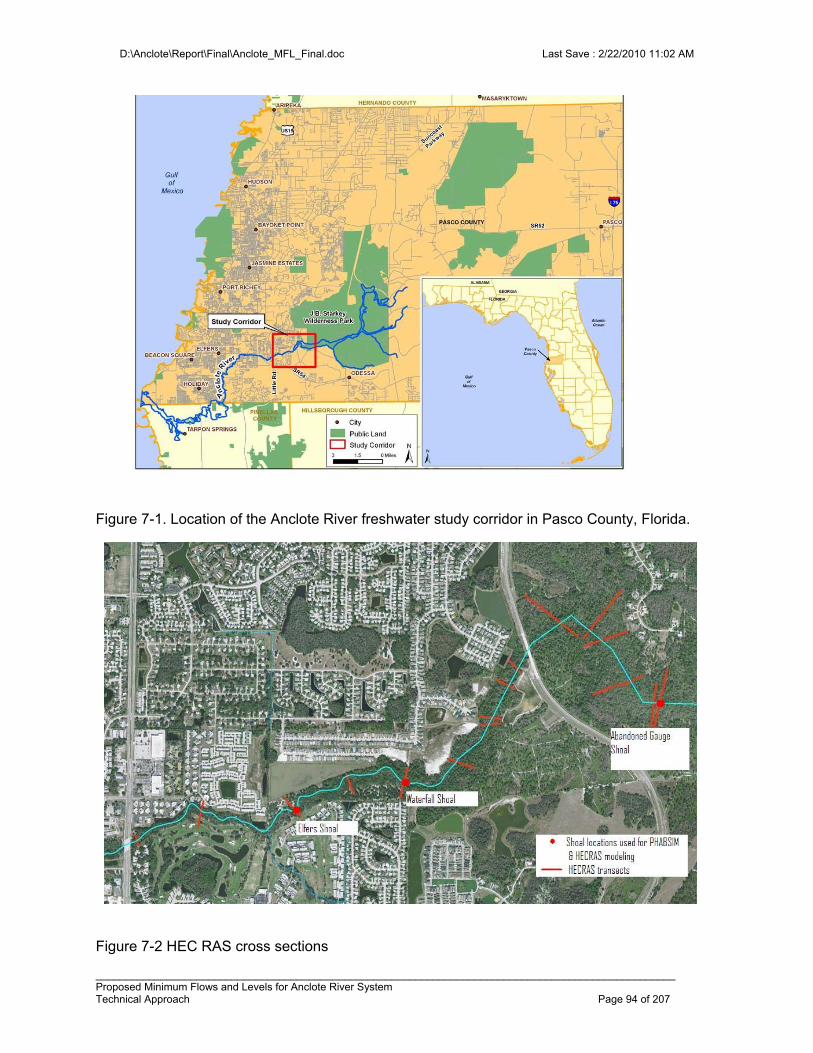
D:\Anclote\Report\Final\Anclote_MFL_Final.doc Last Save : 2/22/2010 11:02 AM
__________________________________________________________________________________________________ Proposed Minimum Flows and Levels for Anclote River System Technical Approach Page 94 of 207
Figure 7-1. Location of the Anclote River freshwater study corridor in Pasco County, Florida.
Figure 7-2 HEC RAS cross sections
D:\Anclote\Report\Final\Anclote_MFL_Final.doc Last Save : 2/22/2010 11:02 AM
__________________________________________________________________________________________________ Proposed Minimum Flows and Levels for Anclote River System Technical Approach Page 95 of 207
7.1.1.2 PHABSIM Cross sections (PHABSIM cross sections, designed to quantify specific habitats for fish and macroinvertebrates at differing flow conditions, were established at three representative sites on the Anclote River. The uppermost site was located a short distance downstream from an old abandoned USGS gauge, at Vegetation Transect 1 (see Figure 7-3 in Section 7.1.1.4). The middle site is located at Vegetation Transect 21 and the lowest PHABSIM site is located just upstream from the USGS Elfers gauge at Little Road. All sites were bounded by 6-8 ft. high banks and the substrata consist mainly of shifting sand and bedrock, distributed among shoal, run and pool areas. Identification of shoal locations in the study reach was important for PHABSIM analyses because these features represent hydraulic controls used in developing hydraulic simulation models with PHABSIM software. The shoals restrict flow and can be sites where loss of hydraulic connection may occur or may present barriers to fish migration or hamper recreational canoeing. Field reconnaissance of shoals in the entire study reach was conducted for selection of the three PHABSIM data collection cross sections. PHABSIM analysis required acquisition of field data concerning channel habitat composition and hydraulics. At each PHABSIM site, tag lines were used to establish three cross sections across the channel to the top of bank on either side of the river. Water velocity was measured with a Marsh-McBirney Model 2000 flow meter and/or a Sontek Flow Tracker Handheld Acoustic Doppler Velocimeter at two or four-foot intervals along each cross section. Stream depth, substrate type and habitat/cover were recorded along the cross sections. Other hydraulic descriptors measured included channel geometry (river bottom-ground elevations), water surface elevations across the channel and water surface slope determined from points upstream and downstream of the cross sections. Elevation data were collected relative to temporary bench marks that were subsequently surveyed by District surveyors to establish absolute elevations, relative to the NGVD29). Data were collected under a range of flow conditions (low, medium and high flows) to provide the necessary information needed to run the PHABSIM model for each stream reach.
7.1.1.3 Instream Habitat Cross sections Cross sections for assessing instream habitats were examined at twelve sites on the Anclote River. Triplicate instream cross sections, from the top of bank on one side of the channel through the river and up to the top of bank on the opposite channel, were established at each site perpendicular to flow in the channel. Typically, one of three instream cross sections at each site was situated along the floodplain vegetation transect line and the other two replicate cross sections were located 50 ft upstream and downstream. However, specific to our work on the Anclote River, only Instream Transect 5 did not have an associated floodplain vegetation transect. This is because the meandering nature at that reach would result in overlapping floodplain communities with Transects 4 and 6 and lead to redundant vegetation analyses. A total of 36 instream cross sections were sampled (12 cross sections x 3 replicates at each site).
D:\Anclote\Report\Final\Anclote_MFL_Final.doc Last Save : 2/22/2010 11:02 AM
__________________________________________________________________________________________________ Proposed Minimum Flows and Levels for Anclote River System Technical Approach Page 96 of 207
For each instream habitat cross section, the range in elevations (feet above the NGVD29 and feet above the NAVD88) and linear extent (along the cross section) for the following habitats were determined:
bottom substrates (which included sand, mud, or bedrock); exposed roots; snags or deadwood; wetland (herbaceous or shrubby) plants; and wetland trees.
Following the collection of cross section substrate/cover/habitat data, additional elevations of woody habitats were also collected at each instream habitat site. Belt transects along the banks of the Anclote River were used to document the elevational distribution of woody habitats such as snags or exposed roots. Live (exposed roots) and dead (snag) woody habitats were measured along both river banks from the center cross section upstream to the upstream cross section. If the elevation change between the two transects do not differ by more than 0.5 feet (taken at the transect center), woody habitat sampling along the banks were collected further upstream by another 50 feet. Elevations for up to 15 samples of exposed root and snag habitat were collected from each bank between the center and upstream cross sections. Measured woody habitats are representative of the vertical distribution of woody habitats in the sample corridor (between the two instream cross sections). The upper and lower vertical extent of each encountered woody habitat sample (referred to as High and Low front shots, respectively) were measured using survey equipment.
7.1.1.4 Floodplain Vegetation/Soils Cross Sections For floodplain vegetation/soils cross section site selection, the river corridor was stratified using criteria described by PBS&J (2007). Eleven representative cross sections were established perpendicular to the river channel within dominant National Wetland Inventory vegetation types (Figure 7-3). Cross sections were established between the 0.5 percent exceedance levels on either side of the river channel, based on previous determinations of the landward extent of floodplain wetlands in the river corridor. Ground elevations, in feet above the NGVD29, were determined by District surveyors at 50-foot intervals along transects using standard surveying equipment, and were measured at shorter intervals where changes in elevation were conspicuous. Measured elevation data were converted to values relative to the NAVD88. To characterize forested vegetation communities along each cross section, changes in dominant vegetation communities were located and used to delineate boundaries between vegetation zones. Trees, rather than shrubs and herbaceous species, were used to define vegetation communities, because relatively long-lived tree species are better integrators of long-term hydrologic conditions. At each change in vegetation zone, plant species composition, density, basal area and diameter at breast height (for woody vegetation with a dbh greater than 1 inch) were recorded. At least three samples located within each vegetation zone were collected using the Point Centered Quarter method (see Cottam and Curtis 1956, as cited in PBS&J 2007).
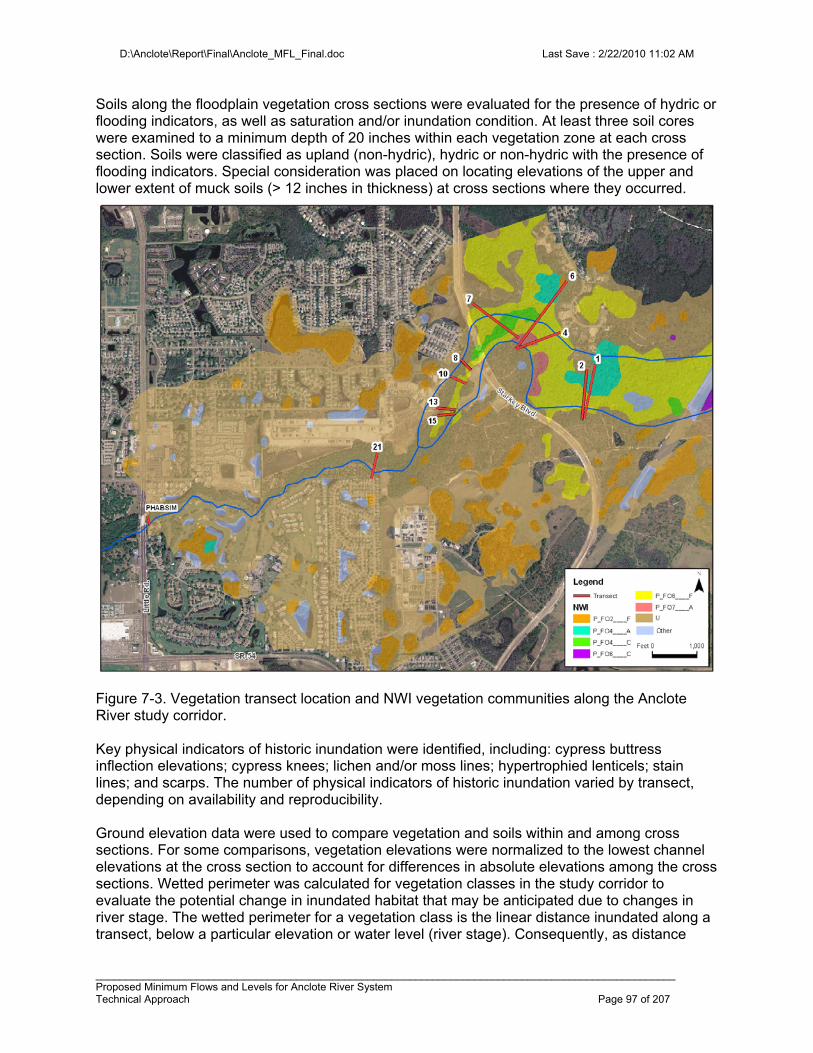
D:\Anclote\Report\Final\Anclote_MFL_Final.doc Last Save : 2/22/2010 11:02 AM
__________________________________________________________________________________________________ Proposed Minimum Flows and Levels for Anclote River System Technical Approach Page 97 of 207
Soils along the floodplain vegetation cross sections were evaluated for the presence of hydric or flooding indicators, as well as saturation and/or inundation condition. At least three soil cores were examined to a minimum depth of 20 inches within each vegetation zone at each cross section. Soils were classified as upland (non-hydric), hydric or non-hydric with the presence of flooding indicators. Special consideration was placed on locating elevations of the upper and lower extent of muck soils (> 12 inches in thickness) at cross sections where they occurred.
Figure 7-3. Vegetation transect location and NWI vegetation communities along the Anclote River study corridor. Key physical indicators of historic inundation were identified, including: cypress buttress inflection elevations; cypress knees; lichen and/or moss lines; hypertrophied lenticels; stain lines; and scarps. The number of physical indicators of historic inundation varied by transect, depending on availability and reproducibility. Ground elevation data were used to compare vegetation and soils within and among cross sections. For some comparisons, vegetation elevations were normalized to the lowest channel elevations at the cross section to account for differences in absolute elevations among the cross sections. Wetted perimeter was calculated for vegetation classes in the study corridor to evaluate the potential change in inundated habitat that may be anticipated due to changes in river stage. The wetted perimeter for a vegetation class is the linear distance inundated along a transect, below a particular elevation or water level (river stage). Consequently, as distance
D:\Anclote\Report\Final\Anclote_MFL_Final.doc Last Save : 2/22/2010 11:02 AM
__________________________________________________________________________________________________ Proposed Minimum Flows and Levels for Anclote River System Technical Approach Page 98 of 207
from the river channel increases, the total wetted perimeter also increases, but can vary among vegetation classes. The HEC-RAS floodplain model (see Section 7.1.1.1) was used to determine corresponding flows at the Anclote River near Elfers gauge that would be necessary to inundate specific floodplain elevations (e.g., median vegetation zone and soils elevations).
7.1.2 Modeling Approaches A variety of modeling approaches was used to develop minimum flows and levels for the Anclote River. A HEC-RAS model was developed to characterize flows at all study sites. PHABSIM was used to characterize potential changes in the availability of fish habitat and macroinvertebrate habitat. Long-term inundation analysis was used to examine inundation durations for specific habitats or floodplain elevations and to also examine changes in inundation patterns that could be expected with changes to the flow regime.
7.1.2.1 HEC-RAS Modeling The HEC-RAS model is a one-dimensional hydraulic model that can be used to analyze river flows. Version 3.1.3 of the HEC-RAS model was released by the U.S. Army Corps of Engineers Hydrologic Engineering Center in May 2005 and supports water surface profile calculations for steady and unsteady flows, including subcritical, supercritical, or mixed flows. Profile computations begin at a cross section with known or assumed starting condition and proceed upstream for subcritical flow or downstream for supercritical flow. The model resolves the one-dimensional energy equation. Energy losses between two neighboring cross sections are computed by the use of Manning's equation in the case of friction losses and derived from a coefficient multiplied by the change in velocity head for contraction/expansion losses. For areas where the water surface profile changes rapidly (e.g., hydraulic jumps, bridges, river confluences), the momentum equation is used (US Army Corps of Engineers 2001). A HEC-RAS model and available flow records for the USGS Anclote River at Elfers and Anclote River near Odessa were used to simulate flows at cross section sites within the Anclote River study area. Data required for performing HEC-RAS simulations included geometric data and steady-flow data. Geometric data used for our analyses consisted of connectivity data for the river system, cross section elevation data for 15 cross sections, reach length, energy loss coefficients due to friction and channel contraction/expansion, stream junction information, and hydraulic structure data, including information for bridges and culverts. Required steady-flow data included the USGS gauge records, and boundary conditions. Elevation data (in feet above the NAVD88) for the 15 cross sections were derived from District surveys and a digital elevation model of the Anclote River. Surveyed cross sections included the 11 floodplain vegetation/soils transects, with measured NGVD29 elevations converted to NAVD 88 elevations based CORPSCON (U.S. Army Corps of Engineers, coordinate conversion software) and comparison with published data for nearby NGS benchmarks. Data for four additional transects specific to the HEC-RAS model were gathered by survey as well. Data for one additional cross section was derived from a digital terrain model created with ESRI ArcView (version 8.3) from Light Detection and Ranging (LiDAR) data, break lines and the surveyed cross sections. LiDAR and break-line elevation data, in feet relative to NAVD88, were obtained from flights in 2003 using an ALS40 LiDAR system flown at an altitude of 1,500 meters, with a
D:\Anclote\Report\Final\Anclote_MFL_Final.doc Last Save : 2/22/2010 11:02 AM
__________________________________________________________________________________________________ Proposed Minimum Flows and Levels for Anclote River System Technical Approach Page 99 of 207
30-degree field of view. Data acquisition/processing involved a 6-feet post-spacing interval, digital one-foot orthophotographs and 2D breakline features necessary to produce a one-foot elevation contour interval product. Vertical accuracy of the LiDAR data was specified at 0.6 feet in well-identified, unobscured terrain. Known water surface elevations were used as downstream boundary conditions from a rating curve, supplied by USGS, to calibrate the HEC-RAS model to the Anclote River near Odessa gauge. All elevation data associated with USGS gauges were converted to a NAVD88 standard when necessary. Calculations for subcritical flow in the HEC-RAS model begin downstream where a boundary condition is applied. For the Anclote River, a known water-surface elevation, read from a USGS rating curve for the Anclote River at Elfers gauge (USGS No. 02310000) was used as a downstream boundary condition. The energy equation is then solved between the first and second (most downstream) cross sections. Once this is achieved, the model repeats this process working its way upstream balancing the energy equation (or momentum equation if appropriate) between adjacent cross sections until the most upstream cross section is reached. Model accuracy is evaluated by comparing calculated water-surface elevations at any gauge location with a stage-discharge relationship derived from historic data for the location. The model is calibrated by adjusting factors in the model until calculated results closely approximate the observed relationship between stage and flow. While expansion and contraction coefficients can be altered, the major parameter altered during the calibration process is typically Manning's roughness coefficient (n), which describes the degree of flow resistance. Flow resistance is a function of a variety of factors including sediment composition, channel geometry, vegetation density, depth of flow and channel meandering. For the Anclote River HEC-RAS model, a rating curve at the most upstream gauge site (Anclote River near Odessa) was not available from USGS. Calibration measures were made against the existing data for this site. The Anclote River HEC-RAS model calculates profiles for a total of 27 steady-flow rates derived from historical flow data measured in the river. The boundary conditions were specified with known water surface elevations for each flow rate at the downstream boundaries. Accuracy of the step-backwater analysis for the Anclote River was determined by comparing the modeled water surface elevations with rated water-surface elevations at the Anclote River near Odessa gauge site. The HEC-RAS model was considered calibrated when calculated water surface elevations were within plus or minus 0.5 ft, in keeping with standard USGS practices, where this range of error is based on the potential error associated with using data collected to a 1-ft contour interval aerial mapping standard for model development (Lewelling 2004). The greatest error associated with the model is likely to be the accuracy of the cross sectional data. It should be noted the while 24 of the 27 flow profiles were calibrated within 0.5 ft the three highest profiles were not and displayed offsets of between 0.6 and 0.8 ft. The HEC-RAS model was run using 27 steady-flow rates to determine stage vs. flow and wetted perimeter versus flow relationships for each surveyed cross section. These relationships were also used to determine inundation characteristics of various habitats at instream habitat and floodplain vegetation cross sections. The peer review panel assessing the "Upper Peace River; An Analysis of Minimum Flows and Levels" found HEC-RAS to be an "appropriate tool" for assessing these relationships and determined this to be a "scientifically reasonable approach" (Gore et al. 2002).
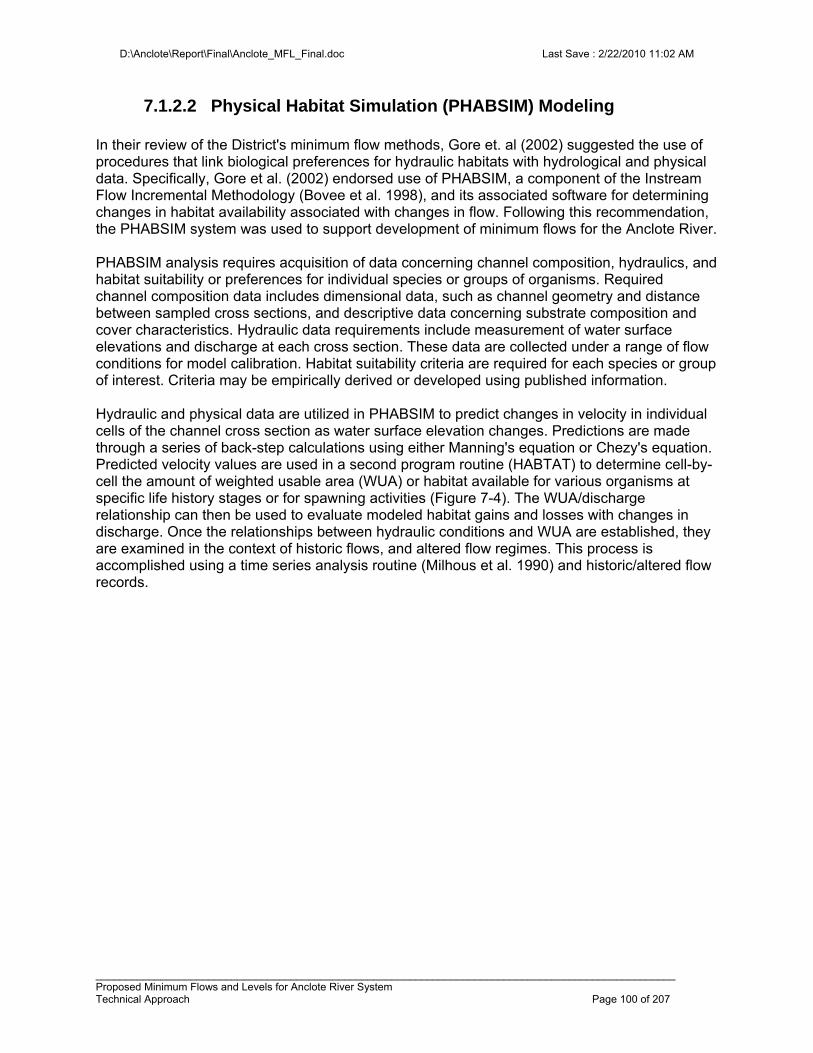
D:\Anclote\Report\Final\Anclote_MFL_Final.doc Last Save : 2/22/2010 11:02 AM
__________________________________________________________________________________________________ Proposed Minimum Flows and Levels for Anclote River System Technical Approach Page 100 of 207
7.1.2.2 Physical Habitat Simulation (PHABSIM) Modeling In their review of the District's minimum flow methods, Gore et. al (2002) suggested the use of procedures that link biological preferences for hydraulic habitats with hydrological and physical data. Specifically, Gore et al. (2002) endorsed use of PHABSIM, a component of the Instream Flow Incremental Methodology (Bovee et al. 1998), and its associated software for determining changes in habitat availability associated with changes in flow. Following this recommendation, the PHABSIM system was used to support development of minimum flows for the Anclote River. PHABSIM analysis requires acquisition of data concerning channel composition, hydraulics, and habitat suitability or preferences for individual species or groups of organisms. Required channel composition data includes dimensional data, such as channel geometry and distance between sampled cross sections, and descriptive data concerning substrate composition and cover characteristics. Hydraulic data requirements include measurement of water surface elevations and discharge at each cross section. These data are collected under a range of flow conditions for model calibration. Habitat suitability criteria are required for each species or group of interest. Criteria may be empirically derived or developed using published information. Hydraulic and physical data are utilized in PHABSIM to predict changes in velocity in individual cells of the channel cross section as water surface elevation changes. Predictions are made through a series of back-step calculations using either Manning's equation or Chezy's equation. Predicted velocity values are used in a second program routine (HABTAT) to determine cell-by-cell the amount of weighted usable area (WUA) or habitat available for various organisms at specific life history stages or for spawning activities (Figure 7-4). The WUA/discharge relationship can then be used to evaluate modeled habitat gains and losses with changes in discharge. Once the relationships between hydraulic conditions and WUA are established, they are examined in the context of historic flows, and altered flow regimes. This process is accomplished using a time series analysis routine (Milhous et al. 1990) and historic/altered flow records.
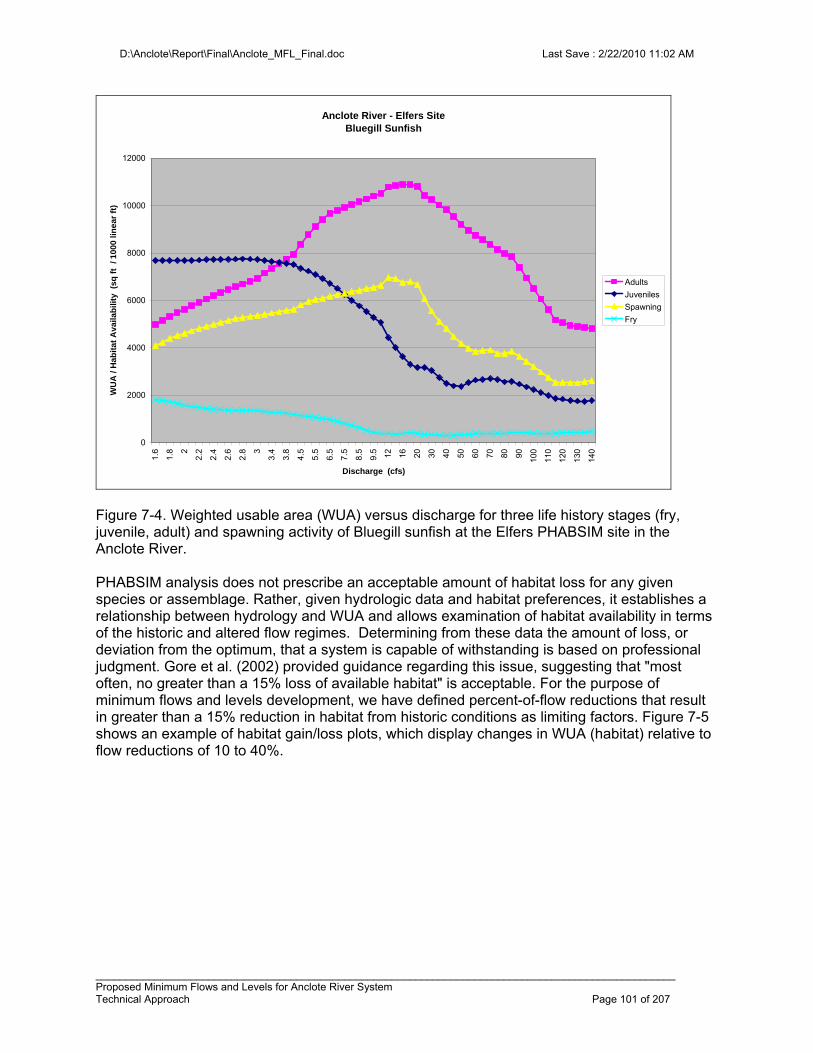
D:\Anclote\Report\Final\Anclote_MFL_Final.doc Last Save : 2/22/2010 11:02 AM
__________________________________________________________________________________________________ Proposed Minimum Flows and Levels for Anclote River System Technical Approach Page 101 of 207
Anclote River - Elfers SiteBluegill Sunfish
0
2000
4000
6000
8000
10000
120001.
6
1.8 2
2.2
2.4
2.6
2.8 3
3.4
3.8
4.5
5.5
6.5
7.5
8.5
9.5 12 16 20 30 40 50 60 70 80 90 100
110
120
130
140
Discharge (cfs)
WU
A /
Hab
itat
Ava
ilab
ility
(sq
ft
/ 10
00 li
ne
ar f
t)
Adults
Juveniles
Spawning
Fry
Figure 7-4. Weighted usable area (WUA) versus discharge for three life history stages (fry, juvenile, adult) and spawning activity of Bluegill sunfish at the Elfers PHABSIM site in the Anclote River. PHABSIM analysis does not prescribe an acceptable amount of habitat loss for any given species or assemblage. Rather, given hydrologic data and habitat preferences, it establishes a relationship between hydrology and WUA and allows examination of habitat availability in terms of the historic and altered flow regimes. Determining from these data the amount of loss, or deviation from the optimum, that a system is capable of withstanding is based on professional judgment. Gore et al. (2002) provided guidance regarding this issue, suggesting that "most often, no greater than a 15% loss of available habitat" is acceptable. For the purpose of minimum flows and levels development, we have defined percent-of-flow reductions that result in greater than a 15% reduction in habitat from historic conditions as limiting factors. Figure 7-5 shows an example of habitat gain/loss plots, which display changes in WUA (habitat) relative to flow reductions of 10 to 40%.
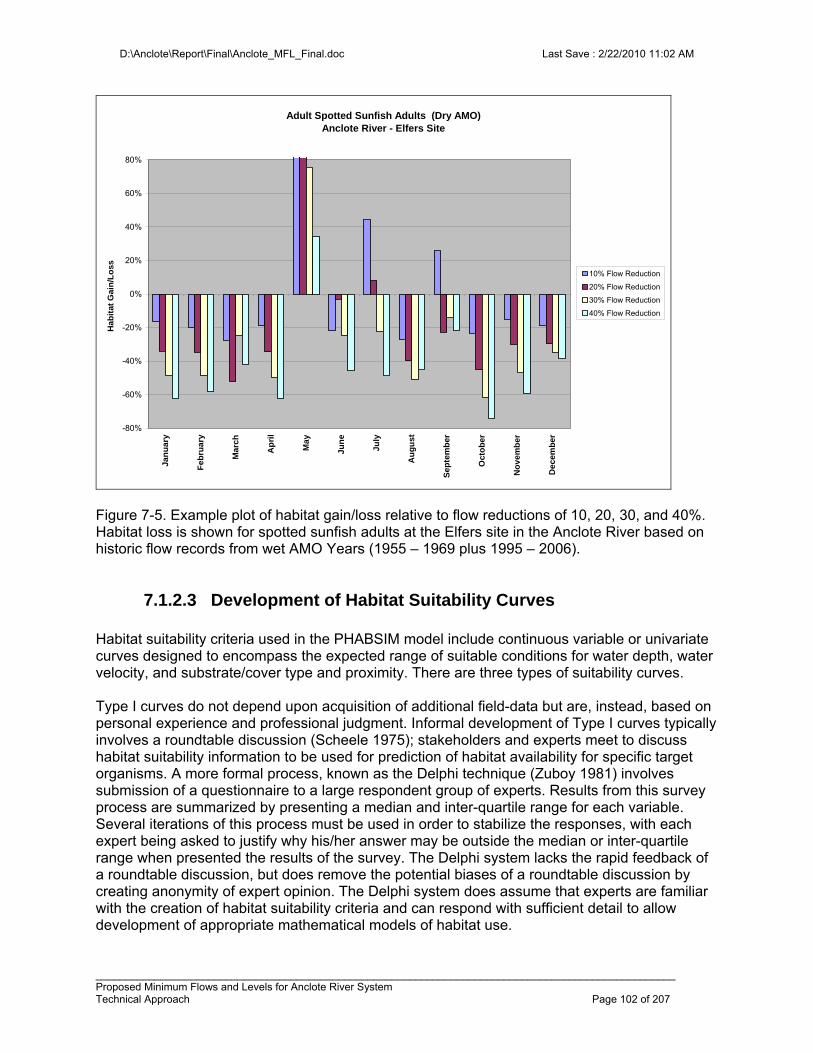
D:\Anclote\Report\Final\Anclote_MFL_Final.doc Last Save : 2/22/2010 11:02 AM
__________________________________________________________________________________________________ Proposed Minimum Flows and Levels for Anclote River System Technical Approach Page 102 of 207
Adult Spotted Sunfish Adults (Dry AMO) Anclote River - Elfers Site
-80%
-60%
-40%
-20%
0%
20%
40%
60%
80%Ja
nu
ary
Feb
ruar
y
Mar
ch
Ap
ril
May
Ju
ne
July
Au
gu
st
Sep
tem
ber
Oct
ob
er
No
vem
ber
Dec
emb
er
Ha
bit
at G
ain
/Lo
ss
10% Flow Reduction
20% Flow Reduction
30% Flow Reduction
40% Flow Reduction
Figure 7-5. Example plot of habitat gain/loss relative to flow reductions of 10, 20, 30, and 40%. Habitat loss is shown for spotted sunfish adults at the Elfers site in the Anclote River based on historic flow records from wet AMO Years (1955 – 1969 plus 1995 – 2006).
7.1.2.3 Development of Habitat Suitability Curves Habitat suitability criteria used in the PHABSIM model include continuous variable or univariate curves designed to encompass the expected range of suitable conditions for water depth, water velocity, and substrate/cover type and proximity. There are three types of suitability curves.
Type I curves do not depend upon acquisition of additional field-data but are, instead, based on personal experience and professional judgment. Informal development of Type I curves typically involves a roundtable discussion (Scheele 1975); stakeholders and experts meet to discuss habitat suitability information to be used for prediction of habitat availability for specific target organisms. A more formal process, known as the Delphi technique (Zuboy 1981) involves submission of a questionnaire to a large respondent group of experts. Results from this survey process are summarized by presenting a median and inter-quartile range for each variable. Several iterations of this process must be used in order to stabilize the responses, with each expert being asked to justify why his/her answer may be outside the median or inter-quartile range when presented the results of the survey. The Delphi system lacks the rapid feedback of a roundtable discussion, but does remove the potential biases of a roundtable discussion by creating anonymity of expert opinion. The Delphi system does assume that experts are familiar with the creation of habitat suitability criteria and can respond with sufficient detail to allow development of appropriate mathematical models of habitat use.
D:\Anclote\Report\Final\Anclote_MFL_Final.doc Last Save : 2/22/2010 11:02 AM
__________________________________________________________________________________________________ Proposed Minimum Flows and Levels for Anclote River System Technical Approach Page 103 of 207
Type II curves are based upon frequency distributions for use of certain variables (e.g., flow), which are measured at locations utilized by the target species. Curves for numerous species have been published by the U.S. Fish and Wildlife Service or the U.S. Geological Survey and are commonly referred to as “blue book” criteria.
Type III curves are derived from direct observation of the utilization and/or preference of target organisms for a range of environmental variables (Manly et al. 1993). These curves are weighted by actual distribution of available environmental conditions in the stream (Bovee et al. 1998). Type III curves assume that the optimal conditions will be “preferred” over all others if individuals are presented equal proportions of less favorable conditions (Johnson 1980). Based on dominance of the spotted sunfish (Lepomis punctatus) in rivers within the District, a habitat suitability curve was created for this species. Since most of the regional experts in fish ecology were unfamiliar with process of developing habitat suitability criteria, a hybrid of the roundtable and Delphi techniques was used to develop a Type I curve. For this effort, a proposed working model of habitat suitability criteria was provided to 14 experts for initial evaluation. The proposed suitability curves were based on flow criteria for redbreast sunfish (Lepomis auritus) (Aho and Terrell 1986) modified according to published literature on the biology of spotted sunfish. Respondents were given approximately 30 days to review the proposed habitat suitability criteria and to suggest modifications. Six of the 14 experts provided comments. In accordance with Delphi techniques, the suggested modifications were incorporated into the proposed curves. Suggested modifications that fell outside of the median and 25% interquartile range of responses were not considered unless suitable justification could be provided. Modified Type II habitat suitability criteria for the largemouth bass (Micropterus salmoides) and bluegill (Lepomis macrochirus), two other common fish species in the Anclote River, were established using USFWS/USGS “blue book” criteria (Stuber et al. 1982). Curves for these species have been widely used in PHABSIM applications.
Type III habitat suitability criteria for macroinvertebrate community diversity were established based on suitability curves published by Gore et al. (2001). Modified substrate and cover codes used for criteria development were established through consultation with District and Florida Fish and Wildlife Conservation Commission staff. For this effort, emphasis was placed on invertebrate preference for macrophytes, inundated woody snags and exposed root habitats. Per recommendation of the peer review panel for the middle Peace River, the District has evaluated and developed additional habitat suitability curves for species of interest. These curves have been utilized for development of minimum flows and levels for the Anclote River. For the Anclote River two new groups of habitat suitability curves were developed. Four new curves were developed for fish habitat guilds and Florida specific curves were developed for largemouth bass and bluegill sunfish. The four habitat guilds developed were shallow slow, shallow fast, deep slow and deep fast. These, have been used in conjunction with the previously developed curves for benthos, bluegill sunfish, largemouth bass and spotted sunfish. In addition to the new guild curves new Florida specific curves were also generated. The new curves for bluegill sunfish and large mouth bass are Type III curves and were generated by direct observation. In most cases observers wearing a dive mask would float downstream and mark the locations where species were observed with beanbags. The bags were then gathered and the habitats noted. The new Type III curves were generated specifically for largemouth bass juvenile and bluegill adults and juvenile. Other life stages are still represented by the previously existing curves. One additional Type III curve was generated, for Cyprinidea. This is a family
D:\Anclote\Report\Final\Anclote_MFL_Final.doc Last Save : 2/22/2010 11:02 AM
__________________________________________________________________________________________________ Proposed Minimum Flows and Levels for Anclote River System Technical Approach Page 104 of 207
level classification, which did not seek to identify specific species of minnow but only noted the presence of a species of Cyprinidea.
7.1.2.4 Long-term Inundation Analyses Long-term inundation analysis is used to identify the number of days during a defined period of record that a specific flow or level (elevation) was equaled or exceeded at individual river cross sections, including stream flow gauging sites. For the analyses, spreadsheets and associated plots are developed using measured elevations for habitats or other features (that were converted from a NGVD29 to a NAVD88 standard), HEC-RAS model output and available flow records. For the purpose of developing minimum flows and levels, percent-of-flow reductions that result in greater than a 15% reduction in the number of days of inundation from historic conditions are determined. In addition to identifying these flow reduction thresholds for specific target elevations (e.g., mean elevations of floodplain vegetation classes), flow reductions are also calculated for flows throughout the natural flow range and results are plotted (e.g., see Figure 7-6). Inspection of the plots allows identification of percent-of-flow reductions that can be associated with specific ranges of flow. These flow reductions identify potentially acceptable temporal habitat losses and also provide for wetland habitat protection on a spatial basis (Munson and Delfino 2007).
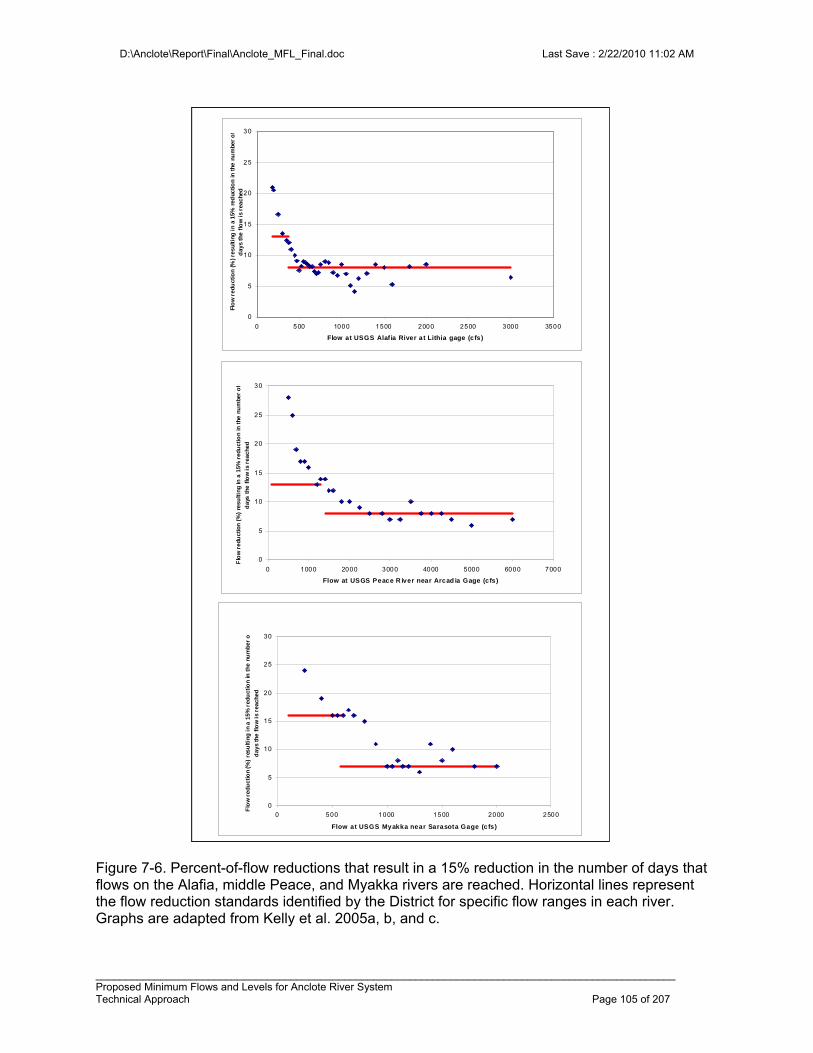
D:\Anclote\Report\Final\Anclote_MFL_Final.doc Last Save : 2/22/2010 11:02 AM
__________________________________________________________________________________________________ Proposed Minimum Flows and Levels for Anclote River System Technical Approach Page 105 of 207
Figure 7-6. Percent-of-flow reductions that result in a 15% reduction in the number of days that flows on the Alafia, middle Peace, and Myakka rivers are reached. Horizontal lines represent the flow reduction standards identified by the District for specific flow ranges in each river. Graphs are adapted from Kelly et al. 2005a, b, and c.
0
5
10
15
20
25
30
0 500 1000 1500 2000 2500
Flow at USGS Myakka near Sarasota Gage (cfs)
Flo
w r
ed
uct
ion
(%
) re
su
ltin
g i
n a
15
% r
edu
cti
on
in t
he
nu
mb
er
o
da
ys
the
flo
w i
s r
eac
hed
0
5
10
15
20
25
30
0 500 1000 1500 2000 2500 3000 3500
Flow at USGS Alaf ia River at Lithia gage (cfs)
Flo
w r
ed
uct
ion
(%
) re
su
ltin
g i
n a
15%
red
uc
tio
n in
th
e n
um
be
r o
fd
ay
s th
e f
low
is
rea
ch
ed
0
5
10
15
20
25
30
0 1000 2000 3000 4000 5000 6000 7000
Flow at USGS Peace R iver near Arcad ia Gage (cfs)
Flo
w r
edu
ctio
n (%
) re
sulti
ng
in a
15%
red
uct
ion
in t
he
nu
mb
er o
f
da
ys t
he
flo
w i
s r
ea
ch
ed
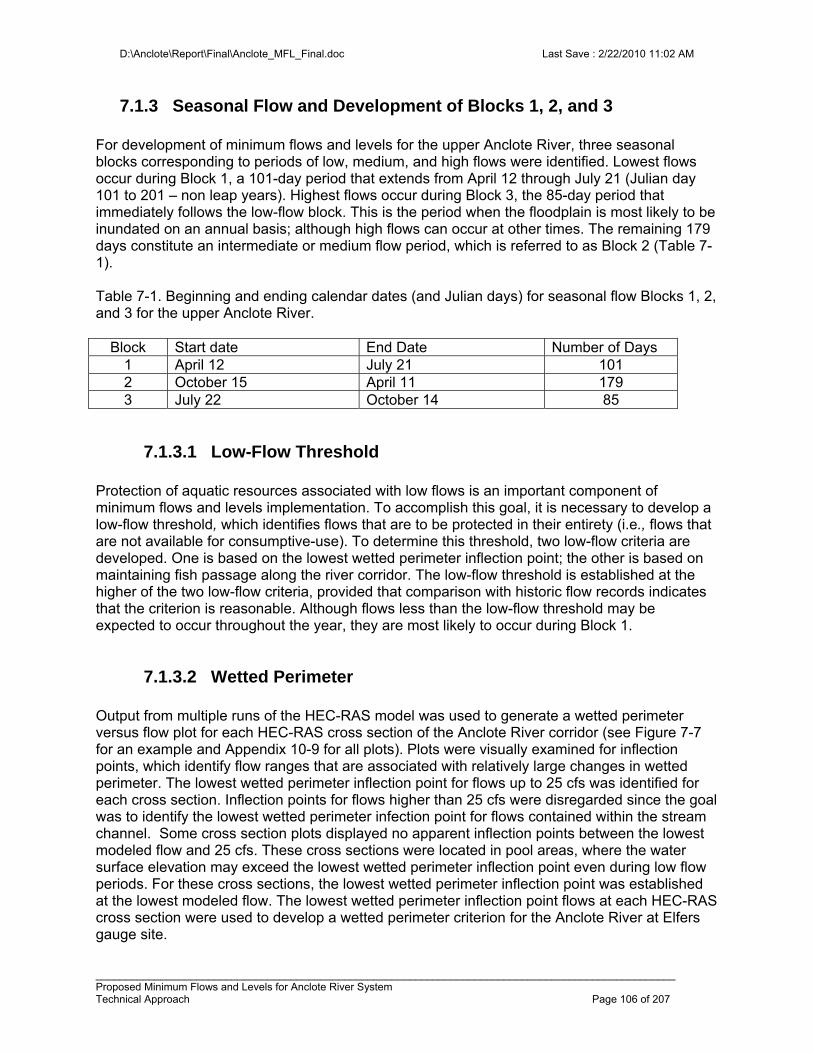
D:\Anclote\Report\Final\Anclote_MFL_Final.doc Last Save : 2/22/2010 11:02 AM
__________________________________________________________________________________________________ Proposed Minimum Flows and Levels for Anclote River System Technical Approach Page 106 of 207
7.1.3 Seasonal Flow and Development of Blocks 1, 2, and 3 For development of minimum flows and levels for the upper Anclote River, three seasonal blocks corresponding to periods of low, medium, and high flows were identified. Lowest flows occur during Block 1, a 101-day period that extends from April 12 through July 21 (Julian day 101 to 201 – non leap years). Highest flows occur during Block 3, the 85-day period that immediately follows the low-flow block. This is the period when the floodplain is most likely to be inundated on an annual basis; although high flows can occur at other times. The remaining 179 days constitute an intermediate or medium flow period, which is referred to as Block 2 (Table 7-1). Table 7-1. Beginning and ending calendar dates (and Julian days) for seasonal flow Blocks 1, 2, and 3 for the upper Anclote River.
Block Start date End Date Number of Days 1 April 12 July 21 101 2 October 15 April 11 179 3 July 22 October 14 85
7.1.3.1 Low-Flow Threshold Protection of aquatic resources associated with low flows is an important component of minimum flows and levels implementation. To accomplish this goal, it is necessary to develop a low-flow threshold, which identifies flows that are to be protected in their entirety (i.e., flows that are not available for consumptive-use). To determine this threshold, two low-flow criteria are developed. One is based on the lowest wetted perimeter inflection point; the other is based on maintaining fish passage along the river corridor. The low-flow threshold is established at the higher of the two low-flow criteria, provided that comparison with historic flow records indicates that the criterion is reasonable. Although flows less than the low-flow threshold may be expected to occur throughout the year, they are most likely to occur during Block 1.
7.1.3.2 Wetted Perimeter Output from multiple runs of the HEC-RAS model was used to generate a wetted perimeter versus flow plot for each HEC-RAS cross section of the Anclote River corridor (see Figure 7-7 for an example and Appendix 10-9 for all plots). Plots were visually examined for inflection points, which identify flow ranges that are associated with relatively large changes in wetted perimeter. The lowest wetted perimeter inflection point for flows up to 25 cfs was identified for each cross section. Inflection points for flows higher than 25 cfs were disregarded since the goal was to identify the lowest wetted perimeter infection point for flows contained within the stream channel. Some cross section plots displayed no apparent inflection points between the lowest modeled flow and 25 cfs. These cross sections were located in pool areas, where the water surface elevation may exceed the lowest wetted perimeter inflection point even during low flow periods. For these cross sections, the lowest wetted perimeter inflection point was established at the lowest modeled flow. The lowest wetted perimeter inflection point flows at each HEC-RAS cross section were used to develop a wetted perimeter criterion for the Anclote River at Elfers gauge site.
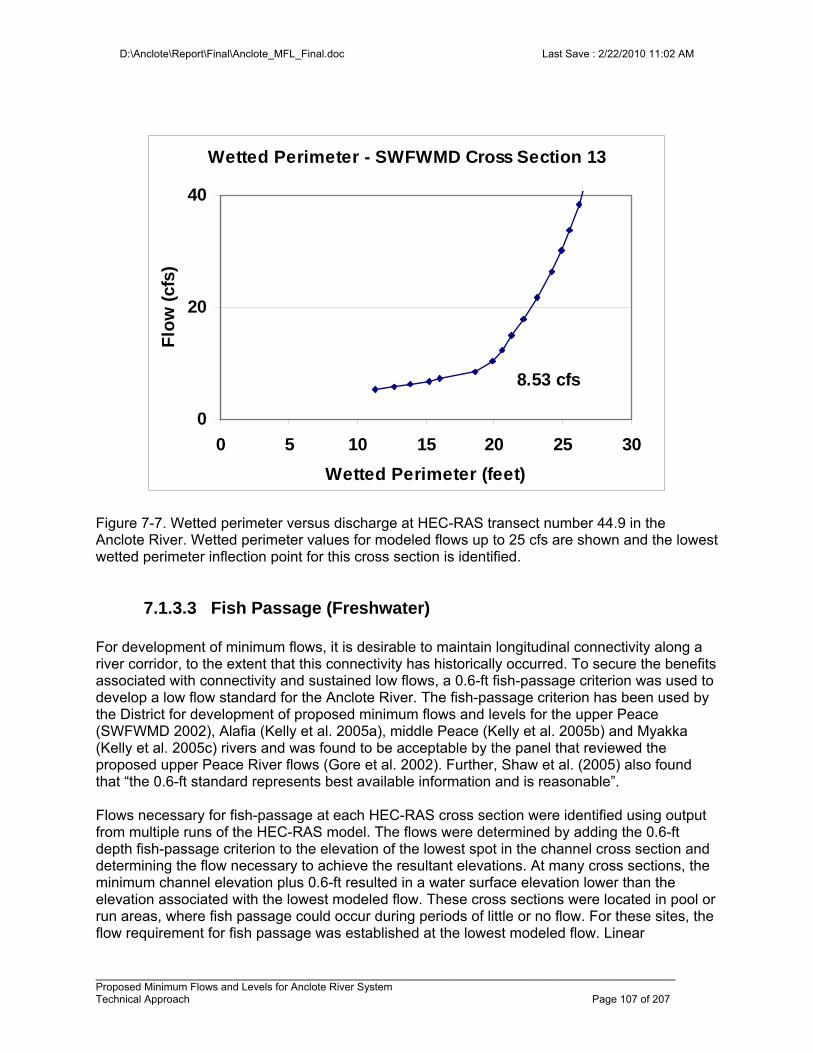
D:\Anclote\Report\Final\Anclote_MFL_Final.doc Last Save : 2/22/2010 11:02 AM
__________________________________________________________________________________________________ Proposed Minimum Flows and Levels for Anclote River System Technical Approach Page 107 of 207
Wetted Perimeter - SWFWMD Cross Section 13
0
20
40
0 5 10 15 20 25 30
Wetted Perimeter (feet)
Flo
w (
cfs)
8.53 cfs
Figure 7-7. Wetted perimeter versus discharge at HEC-RAS transect number 44.9 in the Anclote River. Wetted perimeter values for modeled flows up to 25 cfs are shown and the lowest wetted perimeter inflection point for this cross section is identified.
7.1.3.3 Fish Passage (Freshwater) For development of minimum flows, it is desirable to maintain longitudinal connectivity along a river corridor, to the extent that this connectivity has historically occurred. To secure the benefits associated with connectivity and sustained low flows, a 0.6-ft fish-passage criterion was used to develop a low flow standard for the Anclote River. The fish-passage criterion has been used by the District for development of proposed minimum flows and levels for the upper Peace (SWFWMD 2002), Alafia (Kelly et al. 2005a), middle Peace (Kelly et al. 2005b) and Myakka (Kelly et al. 2005c) rivers and was found to be acceptable by the panel that reviewed the proposed upper Peace River flows (Gore et al. 2002). Further, Shaw et al. (2005) also found that “the 0.6-ft standard represents best available information and is reasonable”. Flows necessary for fish-passage at each HEC-RAS cross section were identified using output from multiple runs of the HEC-RAS model. The flows were determined by adding the 0.6-ft depth fish-passage criterion to the elevation of the lowest spot in the channel cross section and determining the flow necessary to achieve the resultant elevations. At many cross sections, the minimum channel elevation plus 0.6-ft resulted in a water surface elevation lower than the elevation associated with the lowest modeled flow. These cross sections were located in pool or run areas, where fish passage could occur during periods of little or no flow. For these sites, the flow requirement for fish passage was established at the lowest modeled flow. Linear
D:\Anclote\Report\Final\Anclote_MFL_Final.doc Last Save : 2/22/2010 11:02 AM
__________________________________________________________________________________________________ Proposed Minimum Flows and Levels for Anclote River System Technical Approach Page 108 of 207
interpolation between modeled flows was used to determine flows at the Anclote River at Elfers gauge that corresponded to the target fish-passage elevation at the cross sections.
7.1.3.4 Prescribed Flow Reduction for Block 1
When flows exceed the low-flow threshold during Block 1, it may be that some portion of the flows can be withdrawn for consumptive use without causing significant harm. To identify these quantities, the availability of aquatic habitat for selected fish species and macroinvertebrate populations for low flow periods can be estimated using PHABSIM.
7.1.3.4.1 PHABSIM – Application for Block 1 PHABSIM was used to evaluate potential changes in habitat associated with variation in low flows in the upper Anclote River. For the analyses, historic time series data from the Anclote at Elfers gauge site were used to model changes in habitat at two representative sites. Flows for two benchmark periods, the wet AMO Years (1955 – 1969 plus 1995 – 2006) and the dry AMO Years (1970 – 1994), were used for the analyses. Simulations were conducted for various life-history stages of spotted sunfish, largemouth bass, bluegill, and for macroinvertebrate diversity at both sites on the Anclote River. Flow reductions during Block 1, (i.e., from April 12 through July 21) that resulted in no more than a 15% reduction in habitat from historic conditions for either benchmark period were determined to be limiting factors. These factors were used to derive prescribed flow reductions, which identify acceptable flow requirements for the Anclote River at Elfers gauge site during Block 1 when flows exceed the low-flow threshold.
7.1.3.5 Prescribed Flow Reduction for Block 2 During Block 2, flows are typically higher than in Block 1, but are typically contained within the channel. Minimum flows and levels are established for Block 2 for flows that exceed the low-flow threshold using PHABSIM to evaluate potential habitat losses, and through the use of HEC-RAS model output and long-term inundation analyses to evaluate potential changes in the wetting of woody habitats. Results from the two modeling approaches define limiting factors, the most conservative of which is used to develop a prescribed flow reduction for Block 2.
7.1.3.5.1 PHABSIM – Application for Block 2 PHABSIM was used to evaluate potential changes in habitat associated with variation in medium flows. For the analyses, historic time series data from the Anclote River at Elfers gauge site were used. The two benchmark periods utilized for PHABSIM represented the wet AMO Years (1955 – 1969 plus 1995 – 2006) and the dry AMO Years (1970 – 1994). Simulations were conducted for various life-history stages of spotted sunfish, largemouth bass, bluegill, and macroinvertebrate diversity at two representative sites on the Anclote River. Maximum flow reductions that resulted in no more than a 15% reduction in habitat from historic
D:\Anclote\Report\Final\Anclote_MFL_Final.doc Last Save : 2/22/2010 11:02 AM
__________________________________________________________________________________________________ Proposed Minimum Flows and Levels for Anclote River System Technical Approach Page 109 of 207
conditions during Block 2, which runs from October 15 of one year though April 11 of the following calendar year, were determined to be limiting factors. These factors were used to derive prescribed flow reductions, which identify acceptable flow requirements for the Anclote River at Elfers gauge site during Block 2, when flows exceed the low flow thresholds.
7.1.3.5.2 Snag and Exposed Root Habitat Analyses – Application for Block 2
Mean elevations of snag and exposed root habitats were determined for 11 instream habitat cross section sites in the Anclote River. Flows at the cross section sites and corresponding flows at the Anclote River at Elfers gauge that would result in inundation of the mean habitat elevations at each cross section were determined using the HEC-RAS model. Long-term inundation analyses was used to determine the number of days that the mean elevations for the snag or root habitat were inundated. Flow records from two benchmark periods were examined to identify percent-of-flow reductions that would result in no more than a 15% loss of habitat defined as a reduction of no more than 15% of the number of days of inundation from direct river flow for the entire year, after prescribed flow reductions for Blocks 1 and 3 were applied. Although we acknowledge that a 15% change in habitat availability based on a reduction in spatial extent of habitat may not be equivalent to a 15% change in habitat availability based on number of days a particular habitat is inundated (Munson and Delfino 2007), the peer review panel for the middle Peace River MFLs noted, “that the 15% threshold selected for preventing significant harm is appropriate” (Shaw et al. 2005). Loss of days of direct connection with river flows was evaluated for the entire year since woody habitats in the river are expected to be inundated during periods of high flow (Block 3) and may also be inundated by flows occurring during Block 1 in some years. The percent-of-flow reductions derived for Block 2 flows at the gauge site were considered to be limiting factors and evaluated for development of prescribed flow reductions for Block 2 for the Anclote River at Elfers gauge site when flows exceed the low-flow threshold.
7.1.3.6 Prescribed Flow Reduction for Block 3 Junk et al. (1989) note that the “driving force responsible for the existence, productivity, and interactions of the major river-floodplain systems is the flood pulse”. Floodplain vegetation development and persistence does not, however, necessarily depend wholly on inundation from the river channel. Groundwater seepage, hyporheic inputs, discharge from local tributaries, and precipitation can also lead to floodplain inundation (Mertes 1997). However, because river channel-floodplain connections are important, can be influenced by water use, and may be a function of out-of-bank flows, it is valuable to characterize this connectivity for development of minimum flows and levels. Highest flows, including out-of-bank flows, are most likely to occur during Block 3, which for the Anclote River extends from July 22 through October 14. Minimum flows developed for this period are intended to protect ecological resources and values associated with the floodplain by maintaining hydrologic connections between the river channel and the floodplain and maintaining the natural variability of the flow regime. This goal is accomplished through HEC-RAS modeling and use of long-term inundation analyses to evaluate floodplain feature
D:\Anclote\Report\Final\Anclote_MFL_Final.doc Last Save : 2/22/2010 11:02 AM
__________________________________________________________________________________________________ Proposed Minimum Flows and Levels for Anclote River System Technical Approach Page 110 of 207
inundation patterns associated with channel-floodplain connectivity. Based on these analyses, a prescribed flow reduction for Block 3 can be developed.
7.1.3.6.1 Floodplain Connection Analyses – Application for Block 3 HEC-RAS model output and long-term inundation analyses were used to evaluate floodplain inundation patterns associated with river flows at the 15 floodplain vegetation cross sections and associated flows at the Anclote River at Elfers gauge site. Inundation of elevations associated with floodplain features, including vegetation classes and soils, was evaluated to establish percent-of-flow reductions that would result in no more than a 15% reduction in the number of days of inundation during Block 3, based on flows during two benchmark periods (wet and dry AMO cycles). The percent-of-flow reductions were considered to be limiting factors and used at Elfers gauge site during Block 3.
7.2 Technical Approach for Lower River / Estuary Overview As in the upper river freshwater evaluation, protection of habitat plays a major role in the District's determination of estuarine minimum flows and levels. A range of salinity isohalines is defined and the flow reduction responsible for fifteen percent loss of the salinity metric (volume, bottom area or length of shoreline habitat) is determined. In addition to habitat, direct loss of biological resources was determined for fish / invertebrates, mollusk and general benthic communities.
7.2.1 Fish / Invertebrate Technical Approach The response of fishes and invertebrates to a change in freshwater inflow was evaluated as a change in the abundance of select taxa using response functions developed by Greenwood et al. (2006). These responses, and some of the inherent difficulties in application have been described in Section 5.2.2.2. Taxa and inflow responses deemed suitable for inclusion in the estuarine MFL were presented in Table 5-5. The allowable flow reduction (e.g. one that results in a 15% reduction from baseline abundance) was calculated for each gear/pseudo-taxa responses in Table 5-5. Stepwise examples of the approach are given in Table 7-2 and summarized below..
1) Beginning with a prescribed flow such as the 9.6 cfs Block 1 unimpacted median daily flow, transform the flow value and calculate the abundance using the appropriate regression equation. In the example, the abundance of opossum shrimp corresponding to 9.6 cfs is 31,120 organisms and the relative abundance of Brook silverside is 0.861 organisms per 100 m2. 2) Reduce the calculated abundance by a prescribed amount (15% in this example results in abundances of 26,454 and 0.732, respectively) and compute the natural logarithm of the reduced abundance (10.18 and -0.3123).

D:\Anclote\Report\Final\Anclote_MFL_Final.doc Last Save : 2/22/2010 11:02 AM
__________________________________________________________________________________________________ Proposed Minimum Flows and Levels for Anclote River System Technical Approach Page 111 of 207
3) Use the regression model to calculate the flow (i.e. LnF) that yields the reduced abundance. Solutions for the quadratic forms were calculated using the Excel Solver procedure. 4) Calculate the antilog of the step 3 solution and the relative change in flow compared to the flow assumed in step 1. The reduced flows in this example are 8.72 and 8.74 cfs, respectively, which are associated with relative reductions of 9.1% and 8.9% Repeat steps 1 through 4 to evaluate additional block flows.
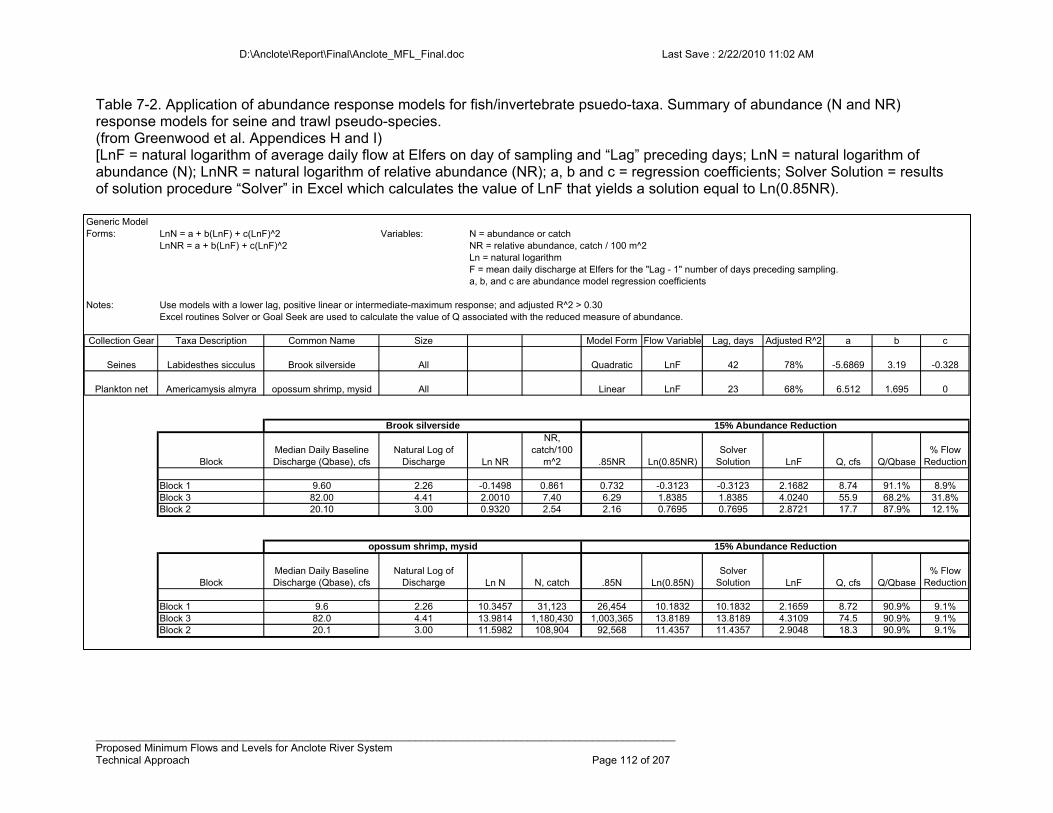
D:\Anclote\Report\Final\Anclote_MFL_Final.doc Last Save : 2/22/2010 11:02 AM
__________________________________________________________________________________________________ Proposed Minimum Flows and Levels for Anclote River System Technical Approach Page 112 of 207
Table 7-2. Application of abundance response models for fish/invertebrate psuedo-taxa. Summary of abundance (N and NR) response models for seine and trawl pseudo-species. (from Greenwood et al. Appendices H and I) [LnF = natural logarithm of average daily flow at Elfers on day of sampling and “Lag” preceding days; LnN = natural logarithm of abundance (N); LnNR = natural logarithm of relative abundance (NR); a, b and c = regression coefficients; Solver Solution = results of solution procedure “Solver” in Excel which calculates the value of LnF that yields a solution equal to Ln(0.85NR).
Generic Model Forms: LnN = a + b(LnF) + c(LnF)^2 Variables: N = abundance or catch
LnNR = a + b(LnF) + c(LnF)^2 NR = relative abundance, catch / 100 m^2Ln = natural logarithmF = mean daily discharge at Elfers for the "Lag - 1" number of days preceding sampling.a, b, and c are abundance model regression coefficients
Notes: Use models with a lower lag, positive linear or intermediate-maximum response; and adjusted R^2 > 0.30Excel routines Solver or Goal Seek are used to calculate the value of Q associated with the reduced measure of abundance.
Collection Gear Taxa Description Common Name Size Model Form Flow Variable Lag, days Adjusted R^2 a b c
Seines Labidesthes sicculus Brook silverside All Quadratic LnF 42 78% -5.6869 3.19 -0.328
Plankton net Americamysis almyra opossum shrimp, mysid All Linear LnF 23 68% 6.512 1.695 0
BlockMedian Daily Baseline Discharge (Qbase), cfs
Natural Log of Discharge Ln NR
NR, catch/100
m^2 .85NR Ln(0.85NR)Solver
Solution LnF Q, cfs Q/Qbase% Flow
Reduction
Block 1 9.60 2.26 -0.1498 0.861 0.732 -0.3123 -0.3123 2.1682 8.74 91.1% 8.9%Block 3 82.00 4.41 2.0010 7.40 6.29 1.8385 1.8385 4.0240 55.9 68.2% 31.8%Block 2 20.10 3.00 0.9320 2.54 2.16 0.7695 0.7695 2.8721 17.7 87.9% 12.1%
BlockMedian Daily Baseline Discharge (Qbase), cfs
Natural Log of Discharge Ln N N, catch .85N Ln(0.85N)
Solver Solution LnF Q, cfs Q/Qbase
% Flow Reduction
Block 1 9.6 2.26 10.3457 31,123 26,454 10.1832 10.1832 2.1659 8.72 90.9% 9.1%Block 3 82.0 4.41 13.9814 1,180,430 1,003,365 13.8189 13.8189 4.3109 74.5 90.9% 9.1%Block 2 20.1 3.00 11.5982 108,904 92,568 11.4357 11.4357 2.9048 18.3 90.9% 9.1%
15% Abundance ReductionBrook silverside
opossum shrimp, mysid 15% Abundance Reduction
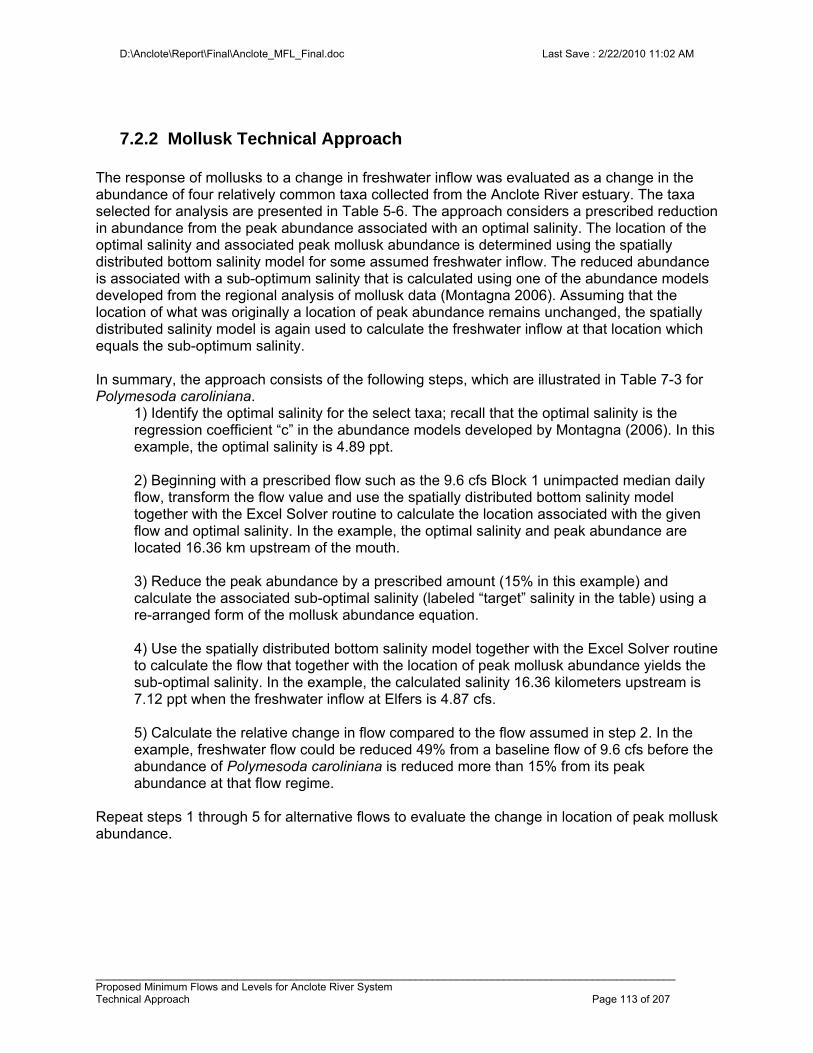
D:\Anclote\Report\Final\Anclote_MFL_Final.doc Last Save : 2/22/2010 11:02 AM
__________________________________________________________________________________________________ Proposed Minimum Flows and Levels for Anclote River System Technical Approach Page 113 of 207
7.2.2 Mollusk Technical Approach The response of mollusks to a change in freshwater inflow was evaluated as a change in the abundance of four relatively common taxa collected from the Anclote River estuary. The taxa selected for analysis are presented in Table 5-6. The approach considers a prescribed reduction in abundance from the peak abundance associated with an optimal salinity. The location of the optimal salinity and associated peak mollusk abundance is determined using the spatially distributed bottom salinity model for some assumed freshwater inflow. The reduced abundance is associated with a sub-optimum salinity that is calculated using one of the abundance models developed from the regional analysis of mollusk data (Montagna 2006). Assuming that the location of what was originally a location of peak abundance remains unchanged, the spatially distributed salinity model is again used to calculate the freshwater inflow at that location which equals the sub-optimum salinity. In summary, the approach consists of the following steps, which are illustrated in Table 7-3 for Polymesoda caroliniana.
1) Identify the optimal salinity for the select taxa; recall that the optimal salinity is the regression coefficient “c” in the abundance models developed by Montagna (2006). In this example, the optimal salinity is 4.89 ppt. 2) Beginning with a prescribed flow such as the 9.6 cfs Block 1 unimpacted median daily flow, transform the flow value and use the spatially distributed bottom salinity model together with the Excel Solver routine to calculate the location associated with the given flow and optimal salinity. In the example, the optimal salinity and peak abundance are located 16.36 km upstream of the mouth. 3) Reduce the peak abundance by a prescribed amount (15% in this example) and calculate the associated sub-optimal salinity (labeled “target” salinity in the table) using a re-arranged form of the mollusk abundance equation. 4) Use the spatially distributed bottom salinity model together with the Excel Solver routine to calculate the flow that together with the location of peak mollusk abundance yields the sub-optimal salinity. In the example, the calculated salinity 16.36 kilometers upstream is 7.12 ppt when the freshwater inflow at Elfers is 4.87 cfs. 5) Calculate the relative change in flow compared to the flow assumed in step 2. In the example, freshwater flow could be reduced 49% from a baseline flow of 9.6 cfs before the abundance of Polymesoda caroliniana is reduced more than 15% from its peak abundance at that flow regime.
Repeat steps 1 through 5 for alternative flows to evaluate the change in location of peak mollusk abundance.
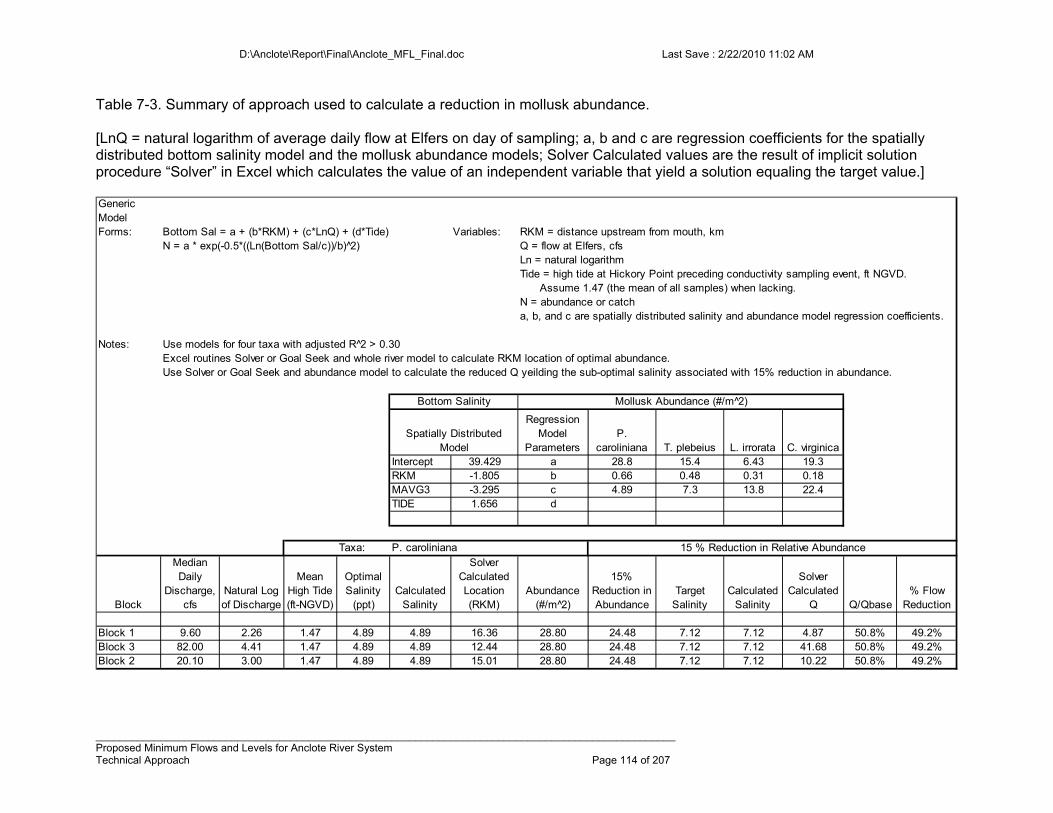
D:\Anclote\Report\Final\Anclote_MFL_Final.doc Last Save : 2/22/2010 11:02 AM
__________________________________________________________________________________________________ Proposed Minimum Flows and Levels for Anclote River System Technical Approach Page 114 of 207
Table 7-3. Summary of approach used to calculate a reduction in mollusk abundance. [LnQ = natural logarithm of average daily flow at Elfers on day of sampling; a, b and c are regression coefficients for the spatially distributed bottom salinity model and the mollusk abundance models; Solver Calculated values are the result of implicit solution procedure “Solver” in Excel which calculates the value of an independent variable that yield a solution equaling the target value.] Generic Model Forms: Bottom Sal = a + (b*RKM) + (c*LnQ) + (d*Tide) Variables: RKM = distance upstream from mouth, km
N = a * exp(-0.5*((Ln(Bottom Sal/c))/b) 2̂) Q = flow at Elfers, cfsLn = natural logarithmTide = high tide at Hickory Point preceding conductivity sampling event, ft NGVD. Assume 1.47 (the mean of all samples) when lacking.N = abundance or catcha, b, and c are spatially distributed salinity and abundance model regression coefficients.
Notes: Use models for four taxa with adjusted R^2 > 0.30Excel routines Solver or Goal Seek and whole river model to calculate RKM location of optimal abundance.Use Solver or Goal Seek and abundance model to calculate the reduced Q yeilding the sub-optimal salinity associated with 15% reduction in abundance.
Regression Model
ParametersP.
caroliniana T. plebeius L. irrorata C. virginicaIntercept 39.429 a 28.8 15.4 6.43 19.3RKM -1.805 b 0.66 0.48 0.31 0.18MAVG3 -3.295 c 4.89 7.3 13.8 22.4TIDE 1.656 d
Taxa: P. caroliniana
Block
Median Daily
Discharge, cfs
Natural Log of Discharge
Mean High Tide (ft-NGVD)
Optimal Salinity
(ppt)Calculated
Salinity
Solver Calculated Location (RKM)
Abundance (#/m 2̂)
15% Reduction in Abundance
Target Salinity
Calculated Salinity
Solver Calculated
Q Q/Qbase% Flow
Reduction
Block 1 9.60 2.26 1.47 4.89 4.89 16.36 28.80 24.48 7.12 7.12 4.87 50.8% 49.2%Block 3 82.00 4.41 1.47 4.89 4.89 12.44 28.80 24.48 7.12 7.12 41.68 50.8% 49.2%Block 2 20.10 3.00 1.47 4.89 4.89 15.01 28.80 24.48 7.12 7.12 10.22 50.8% 49.2%
Bottom Salinity
Spatially Distributed Model
15 % Reduction in Relative Abundance
Mollusk Abundance (#/m^2)

D:\Anclote\Report\Final\Anclote_MFL_Final.doc Last Save : 2/22/2010 11:02 AM
__________________________________________________________________________________________________ Proposed Minimum Flows and Levels for Anclote River System Technical Approach Page 115 of 207
7.2.3 Benthos Technical Approach The response of the benthic community to a change in freshwater inflow was evaluated as a change in the diversity of taxa using a response function developed by Grabe and Janicki (2007). The approach considers a prescribed reduction in number of taxa from the peak diversity associated with an optimal salinity. The location of the optimal salinity and associated peak diversity is determined using the spatially distributed bottom salinity model for some assumed freshwater inflow. The reduced diversity is associated with a sub-optimal salinity that is calculated using the diversity model described in section 5. Assuming that the location of what was originally a location of peak diversity remains unchanged, the spatially distributed salinity model is again used to calculate the freshwater inflow at that location which yields the sub-optimum salinity. Application of the approach is limited to the wet season because the dry season model is not significant. In summary, the approach is similar to that used to evaluate mollusks and consists of the following steps illustrated in Table 7-4.
1) From the benthos response function, select the salinity associated with the maximum diversity. In this case, the optimal salinity is 7.0 ppt and the maximum number of taxa is 235 organisms (associated with Ymax = 5.46). 2) Beginning with a prescribed flow such as the 82.0 cfs Block 3 unimpacted median daily flow, transform the flow value and use the spatially distributed bottom salinity model together with the Excel Solver routine to implicitly calculate the location associated with the given flow and optimal salinity. In the example, the optimal salinity and peak diversity are located 11.27 km upstream of the mouth. 3) Reduce the peak diversity by a prescribed amount. In this example, a 15% reduction reduces diversity to 200 organisms. 4) Transform the reduced diversity value into an equivalent reduced value of Y and use the benthos diversity model to determine the sub-optimal salinity associated with the reduced Y. 5) Use the spatially distributed bottom salinity model to calculate the flow that together with the location of peak benthos diversity yields the sub-optimal salinity. In the example, the calculated salinity 11.27 kilometers upstream is 8.30 ppt when the freshwater inflow at Elfers is 55.3 cfs. 6) Calculate the relative change in flow compared to the flow assumed in step 2. In the example, freshwater flow could be reduced 33% from a baseline flow of 82.0 cfs before benthic diversity is reduced more than 15% from its peak diversity at that flow regime.
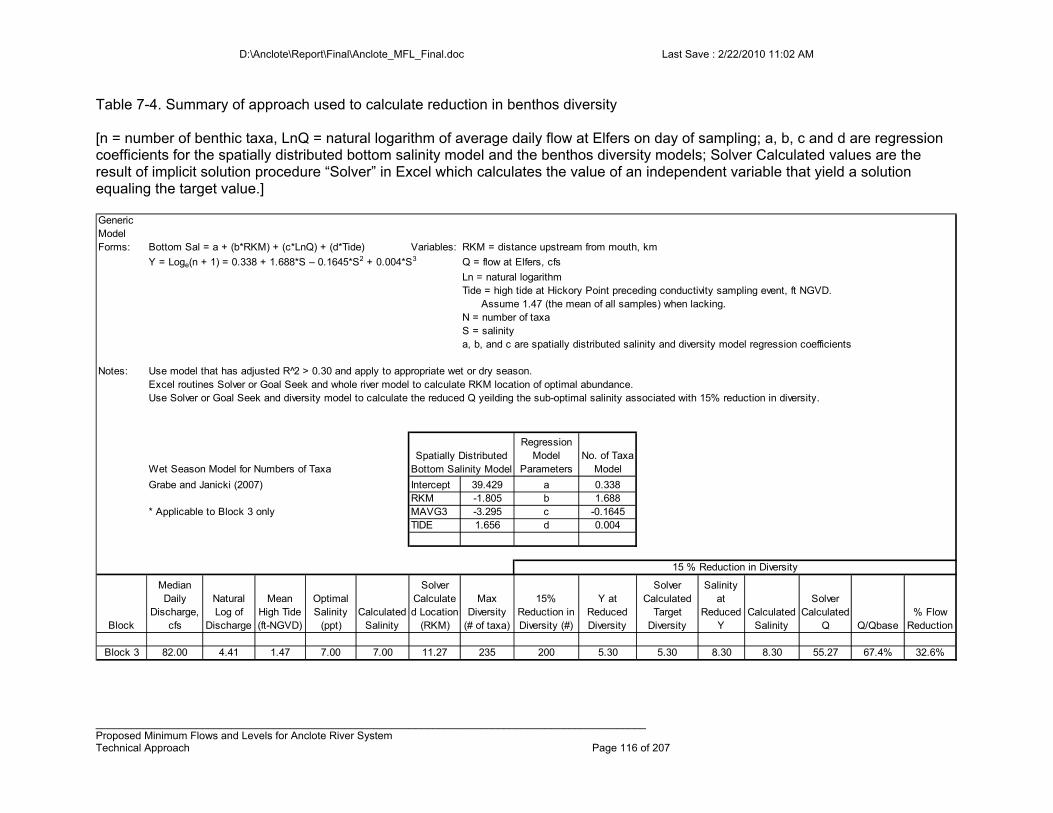
D:\Anclote\Report\Final\Anclote_MFL_Final.doc Last Save : 2/22/2010 11:02 AM
_____________________________________________________________________________________________ Proposed Minimum Flows and Levels for Anclote River System Technical Approach Page 116 of 207
Table 7-4. Summary of approach used to calculate reduction in benthos diversity [n = number of benthic taxa, LnQ = natural logarithm of average daily flow at Elfers on day of sampling; a, b, c and d are regression coefficients for the spatially distributed bottom salinity model and the benthos diversity models; Solver Calculated values are the result of implicit solution procedure “Solver” in Excel which calculates the value of an independent variable that yield a solution equaling the target value.] Generic Model Forms: Bottom Sal = a + (b*RKM) + (c*LnQ) + (d*Tide) Variables: RKM = distance upstream from mouth, km
Y = Loge(n + 1) = 0.338 + 1.688*S – 0.1645*S2 + 0.004*S3 Q = flow at Elfers, cfs
Ln = natural logarithmTide = high tide at Hickory Point preceding conductivity sampling event, ft NGVD. Assume 1.47 (the mean of all samples) when lacking.N = number of taxaS = salinitya, b, and c are spatially distributed salinity and diversity model regression coefficients
Notes: Use model that has adjusted R^2 > 0.30 and apply to appropriate wet or dry season.Excel routines Solver or Goal Seek and whole river model to calculate RKM location of optimal abundance.Use Solver or Goal Seek and diversity model to calculate the reduced Q yeilding the sub-optimal salinity associated with 15% reduction in diversity.
Wet Season Model for Numbers of Taxa
Regression Model
ParametersNo. of Taxa
Model
Grabe and Janicki (2007) Intercept 39.429 a 0.338RKM -1.805 b 1.688
* Applicable to Block 3 only MAVG3 -3.295 c -0.1645TIDE 1.656 d 0.004
Block
Median Daily
Discharge, cfs
Natural Log of
Discharge
Mean High Tide (ft-NGVD)
Optimal Salinity
(ppt)Calculated
Salinity
Solver Calculated Location
(RKM)
Max Diversity
(# of taxa)
15% Reduction in Diversity (#)
Y at Reduced Diversity
Solver Calculated
Target Diversity
Salinity at
Reduced Y
Calculated Salinity
Solver Calculated
Q Q/Qbase% Flow
Reduction
Block 3 82.00 4.41 1.47 7.00 7.00 11.27 235 200 5.30 5.30 8.30 8.30 55.27 67.4% 32.6%
15 % Reduction in Diversity
Spatially Distributed Bottom Salinity Model

D:\Anclote\Report\Final\Anclote_MFL_Final.doc Last Save : 2/22/2010 11:02 AM
_________________________________________________________________________________________________ Proposed Minimum Flows and Levels for Anclote River System Technical Approach Page 117 of 207
7.2.4 Salinity Habitat Technical Approach Salinity habitat is characterized as the volume and bottom area of the area upstream from a prescribed isohaline. The location of the isohaline is determined for a given baseline freshwater inflow and isohaline, and the estuary volume and bottom area upstream of that location are calculated. The volume and bottom area are reduced by a prescribed amount, and the locations associated with these reduced habitat measures are calculated. The flow associated with the new locations and prescribed isohaline are then calculated and compared to the baseline flow. For purposes of the Anclote evaluation, this approach was applied for the 2, 5, 10 and 15 ppt isohaline for each of the three seasonal blocks. The Block 2 baseline median flow of 82.0 cfs and the 2 ppt isohaline are used to explain the technical approach used to evaluate habitat reductions are summarized below and illustrated in Figure 7-8. Use the appropriate isohaline regression model to calculate the location of the designated isohaline (Kmbaseline). In the example, the 2 ppt isohaline is located 11.64 kilometers upstream of the mouth when flow at Elfers is 82 cfs. [Regression parameters for other isohalines are given in Table 4-3] Use the volume-location equation to calculate the estuary volume upstream of the location Kmbaseline. The estuary volume with 2 ppt or less salinity is 499,486 m3. Reduce the upstream volume by fifteen percent, leaving a volume of 424,563 m3. Use the volume-location equation to calculate the adjusted location associated with the reduced upstream volume (Kmadjusted =12.15 km). Use the isohaline regression model to determine the adjusted flow (Qadjusted) that yields a location equaling kmadjusted. In the example, Qadjusted = 63.07 cfs. Calculate the relative reduction in flow from the prescribed baseline flow to the adjusted flow associated with a 15% reduction in volume. In the example, the baseline flow of 82.0 cfs is reduced by 23.1% to 63.07 cfs.
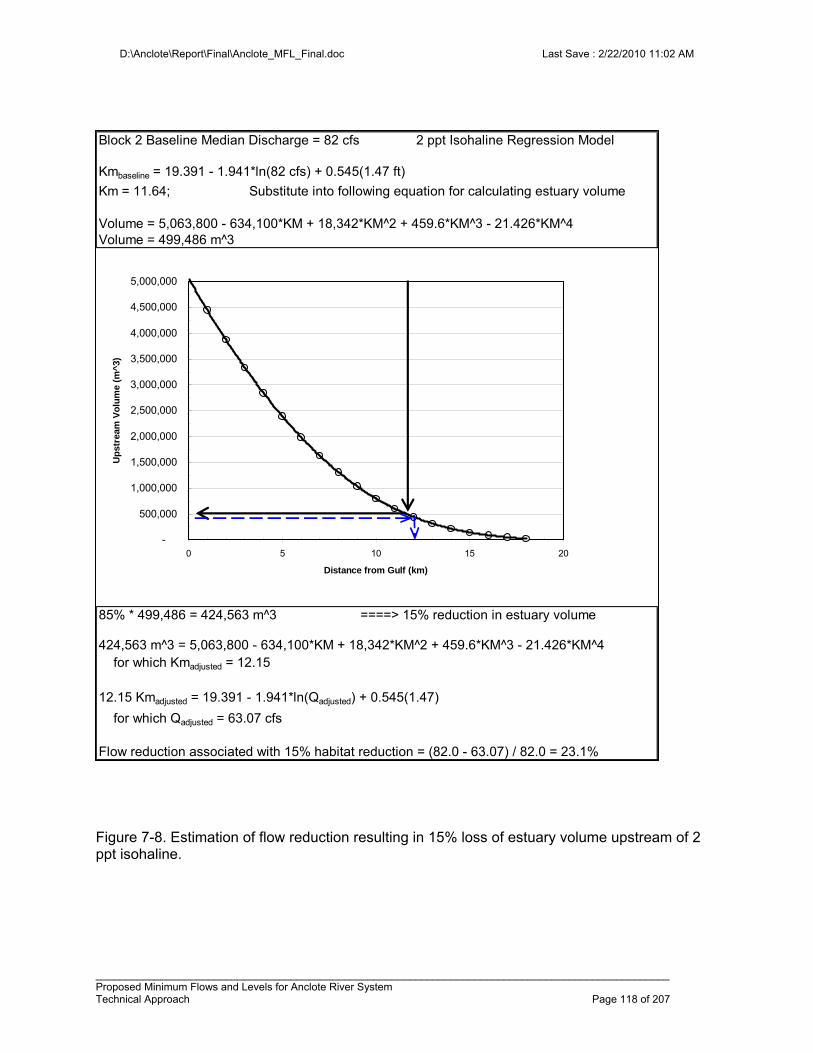
D:\Anclote\Report\Final\Anclote_MFL_Final.doc Last Save : 2/22/2010 11:02 AM
_________________________________________________________________________________________________ Proposed Minimum Flows and Levels for Anclote River System Technical Approach Page 118 of 207
Figure 7-8. Estimation of flow reduction resulting in 15% loss of estuary volume upstream of 2 ppt isohaline.
Block 2 Baseline Median Discharge = 82 cfs 2 ppt Isohaline Regression Model
Kmbaseline = 19.391 - 1.941*ln(82 cfs) + 0.545(1.47 ft)
Km = 11.64; Substitute into following equation for calculating estuary volume
Volume = 5,063,800 - 634,100*KM + 18,342*KM^2 + 459.6*KM^3 - 21.426*KM^4Volume = 499,486 m^3
85% * 499,486 = 424,563 m^3 ====> 15% reduction in estuary volume
424,563 m^3 = 5,063,800 - 634,100*KM + 18,342*KM^2 + 459.6*KM^3 - 21.426*KM^4 for which Kmadjusted = 12.15
12.15 Kmadjusted = 19.391 - 1.941*ln(Qadjusted) + 0.545(1.47)
for which Qadjusted = 63.07 cfs
Flow reduction associated with 15% habitat reduction = (82.0 - 63.07) / 82.0 = 23.1%
-
500,000
1,000,000
1,500,000
2,000,000
2,500,000
3,000,000
3,500,000
4,000,000
4,500,000
5,000,000
0 5 10 15 20
Distance from Gulf (km)
Up
stre
am V
olu
me
(m^
3)
D:\Anclote\Report\Final\Anclote_MFL_Final.doc Last Save : 2/22/2010 11:02 AM
_________________________________________________________________________________________________ Proposed Minimum Flows and Levels for Anclote River System Technical Approach Page 119 of 207
7.2.5 Braided Segment Technical Approach The sub-reach extending from about 5.47 to 11.98 kilometers upstream of the mouth is a mid-estuary, braided segment of the Anclote River. The shoreline and bottom along this segment and the associated riparian and submerged aquatic vegetation are more natural than reaches above and below the segment. The predominant emergent vegetation identified within this sub reach include the halophytes Avicinnia germinans which was absent upstream of Rkm 9.5, Distichlis spicata (absent above Rkm 10), Rhizopora mangle (absent above Rkm 11), and Juncus roemerianus (Grabe and Janicki 2007). The influence of freshwater flow reductions on the salinity at the upstream and downstream ends of the braided segment was evaluated using an approach similar to the salinity habitat technical approach. However instead of using the isohaline regression models to evaluate the change in isohaline location, the spatially distributed bottom-salinity regression model is used to evaluate the change in salinity associated with different inflows. Sbottom = 39.429 -1.804(Rkm) – 3.295(AVG3) + 1.656(TIDE) In which Sbottom = bottom salinity in ppt, Rkm = 5.47 or 11.98 km, AVG3 = natural logarithm of 3-day average daily flow at Elfers, and TIDE = 1.47 feet NGVD29. In practice the model is iterated until the baseline salinity at the end members increases by 15%. For a given baseline freshwater inflow, the change in salinity associated with prescribed reductions in freshwater inflow is determined using the following approach. The Block 3 Baseline Median flow of 82 cfs is used as an example illustrated in Table 7-5.
1) Beginning with 82 cfs, use the spatially distributed model to calculate the bottom salinity at distances 5.47 and 11.98 kilometers upstream from the mouth. 2) Reduce flow by a prescribed amount (2% in this example), and calculate end-member bottom salinities. For example, a 10% reduction in baseline discharge is associated with endpoint salinities of 17.8 and 6.1 ppt at distances of 5.47 and 11.98 kilometers, respectively. 3) Compare the results of step 2 with step 1, and calculate the absolute and relative change in end-member salinities. Compared to the baseline endpoint salinities of 17.5 and 5.7 ppt, the salinities calculated in step 2 are 2% and 6% greater than the baseline salinities. 4) Repeat steps 2 and 3.
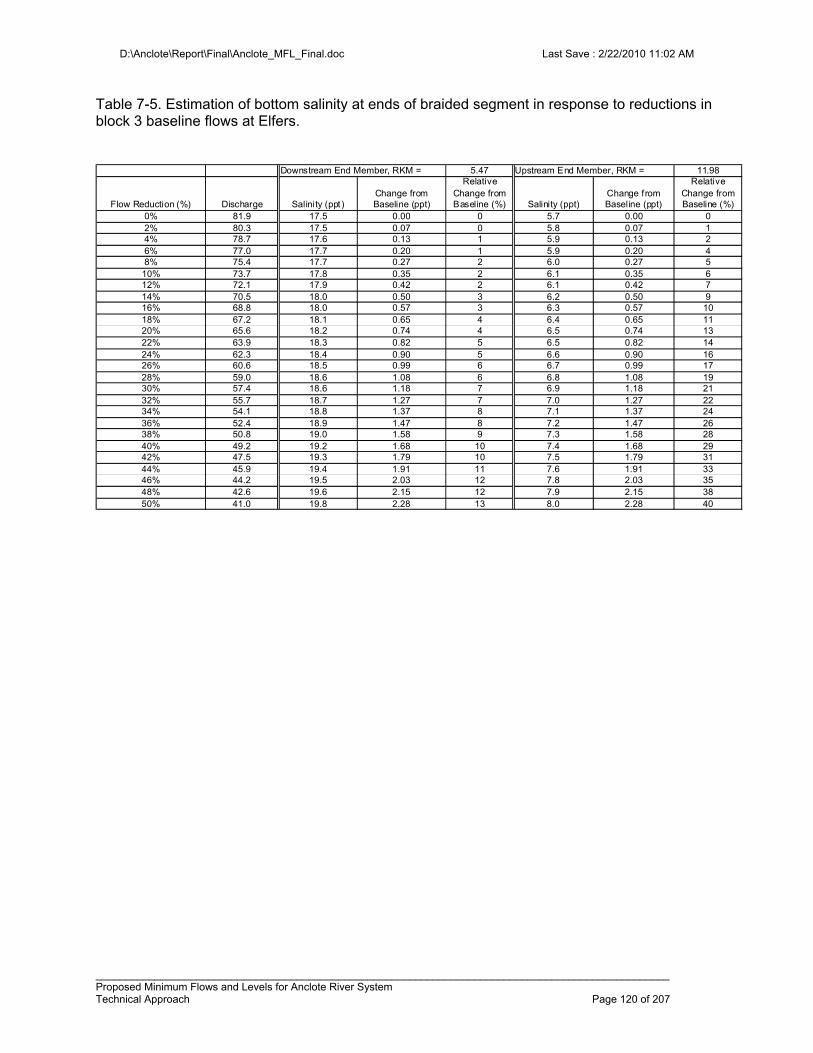
D:\Anclote\Report\Final\Anclote_MFL_Final.doc Last Save : 2/22/2010 11:02 AM
_________________________________________________________________________________________________ Proposed Minimum Flows and Levels for Anclote River System Technical Approach Page 120 of 207
Table 7-5. Estimation of bottom salinity at ends of braided segment in response to reductions in block 3 baseline flows at Elfers.
Downstream End Member, RKM = 5.47 Upstream End Member, RKM = 11.98
Flow Reduction (%) Discharge Salinity (ppt)Change from Baseline (ppt)
Relative Change from Baseline (%) Salinity (ppt)
Change from Baseline (ppt)
Relative Change from Baseline (%)
0% 81.9 17.5 0.00 0 5.7 0.00 02% 80.3 17.5 0.07 0 5.8 0.07 14% 78.7 17.6 0.13 1 5.9 0.13 26% 77.0 17.7 0.20 1 5.9 0.20 48% 75.4 17.7 0.27 2 6.0 0.27 5
10% 73.7 17.8 0.35 2 6.1 0.35 612% 72.1 17.9 0.42 2 6.1 0.42 714% 70.5 18.0 0.50 3 6.2 0.50 916% 68.8 18.0 0.57 3 6.3 0.57 1018% 67.2 18.1 0.65 4 6.4 0.65 1120% 65.6 18.2 0.74 4 6.5 0.74 1322% 63.9 18.3 0.82 5 6.5 0.82 1424% 62.3 18.4 0.90 5 6.6 0.90 1626% 60.6 18.5 0.99 6 6.7 0.99 1728% 59.0 18.6 1.08 6 6.8 1.08 1930% 57.4 18.6 1.18 7 6.9 1.18 2132% 55.7 18.7 1.27 7 7.0 1.27 2234% 54.1 18.8 1.37 8 7.1 1.37 2436% 52.4 18.9 1.47 8 7.2 1.47 2638% 50.8 19.0 1.58 9 7.3 1.58 2840% 49.2 19.2 1.68 10 7.4 1.68 2942% 47.5 19.3 1.79 10 7.5 1.79 3144% 45.9 19.4 1.91 11 7.6 1.91 3346% 44.2 19.5 2.03 12 7.8 2.03 3548% 42.6 19.6 2.15 12 7.9 2.15 3850% 41.0 19.8 2.28 13 8.0 2.28 40
D:\Anclote\Report\Final\Anclote_MFL_Final.doc Last Save : 2/22/2010 11:02 AM
_________________________________________________________________________________________________ Proposed Minimum Flows and Levels for Anclote River System Conclusions and Recommendations Page 121 of 207
CHAPTER 8 - CONCLUSIONS AND RECOMMENDATIONS FOR MFL
8.1 Recommended Minimum Flows and Levels Separate MFL's were developed for the freshwater upper reaches of the river and for the lower, estuarine portion. In both cases, a separate MFL is proposed for each Block, or season. Sections 8.2 and 8.3 describe development of the freshwater MFL, while the basis for the estuarine MFL is described in Section 8.4. Finally, the two are contrasted in Section 8.5 and the most conservative identified.
8.2 Upper River Overview Results from modeling and field investigations on the Anclote River were assessed to develop minimum flow criteria/standards for the freshwater portion of the River to ensure that ecological functions associated with various flows and levels are protected from significant harm. A low-flow threshold based on historic flows is recommended for the USGS Anclote River at Elfers FL gauge site, along with prescribed flow reductions for Blocks 1, 2, and 3. Based on the low-flow threshold and prescribed flow reductions, short-term and long-term hydrologic expectations are identified for evaluating minimum flows and levels for the upper Anclote River.
8.2.1 Low-Flow Threshold The low-flow threshold defines flows that are to be protected throughout the year. The low-flow threshold is established at the higher of two flow criteria, which are based on maintaining fish passage and maximizing wetted perimeter for the least amount of flow in the river channel. The low flow must also be historically appropriate. For the freshwater Anclote River, the low-flow threshold was developed for the USGS Anclote River at Elfers gauge site. The low-flow threshold is used to both limit surface water withdrawals and to identify the maximum expected extent of impact on low flows from groundwater withdrawals.
8.2.1.1 Fish Passage Criteria Flows necessary to reach a minimum water depth of 0.6 foot to allow for fish passage at each cross section in the HEC-RAS model of the Anclote River between the USGS Anclote River near Odessa and Anclote River at Elfers gauge sites are shown in Figure 8-1. At most cross sections, the minimum water surface elevation that would allow for fish passage was lower than the elevation associated with the lowest modeled flow. These cross sections were located in pool or run areas, where fish passage would be possible during low-flow periods. Inspection of the data indicated that flows equal to or greater than 28.84 cfs at the Anclote River at Elfers gauge would be sufficient for fish passage at all sampled sites. However, one single site (site 4)
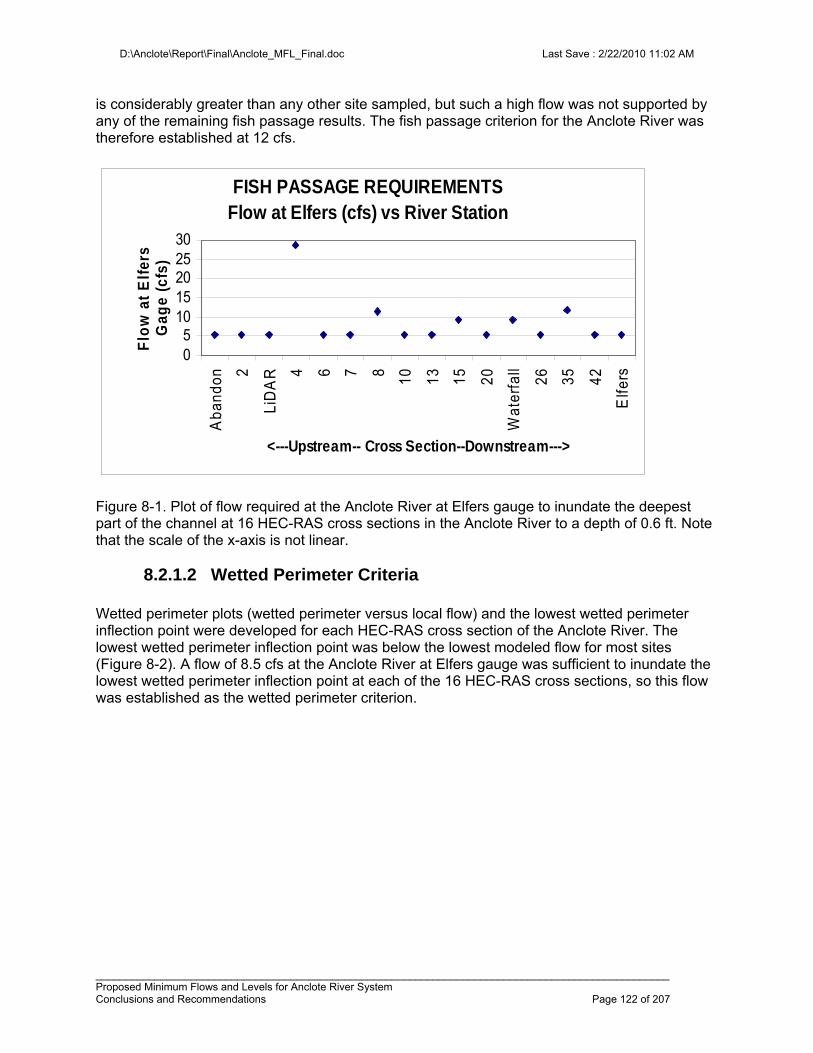
D:\Anclote\Report\Final\Anclote_MFL_Final.doc Last Save : 2/22/2010 11:02 AM
_________________________________________________________________________________________________ Proposed Minimum Flows and Levels for Anclote River System Conclusions and Recommendations Page 122 of 207
is considerably greater than any other site sampled, but such a high flow was not supported by any of the remaining fish passage results. The fish passage criterion for the Anclote River was therefore established at 12 cfs.
FISH PASSAGE REQUIREMENTSFlow at Elfers (cfs) vs River Station
05
1015202530
Aba
ndon 2
LiD
AR 4 6 7 8 10 13 15 20
Wat
erfa
ll
26 35 42
Elfe
rs
<---Upstream-- Cross Section--Downstream--->
Flo
w a
t E
lfer
s G
age
(cfs
)
Figure 8-1. Plot of flow required at the Anclote River at Elfers gauge to inundate the deepest part of the channel at 16 HEC-RAS cross sections in the Anclote River to a depth of 0.6 ft. Note that the scale of the x-axis is not linear.
8.2.1.2 Wetted Perimeter Criteria Wetted perimeter plots (wetted perimeter versus local flow) and the lowest wetted perimeter inflection point were developed for each HEC-RAS cross section of the Anclote River. The lowest wetted perimeter inflection point was below the lowest modeled flow for most sites (Figure 8-2). A flow of 8.5 cfs at the Anclote River at Elfers gauge was sufficient to inundate the lowest wetted perimeter inflection point at each of the 16 HEC-RAS cross sections, so this flow was established as the wetted perimeter criterion.
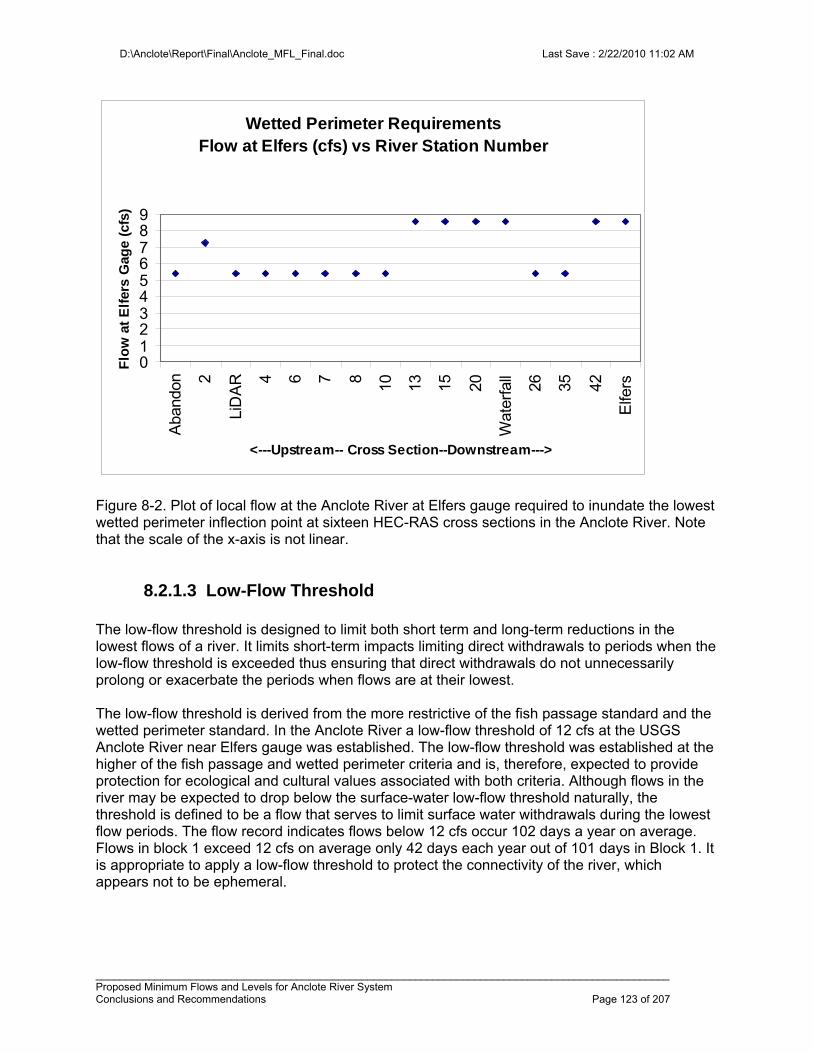
D:\Anclote\Report\Final\Anclote_MFL_Final.doc Last Save : 2/22/2010 11:02 AM
_________________________________________________________________________________________________ Proposed Minimum Flows and Levels for Anclote River System Conclusions and Recommendations Page 123 of 207
Wetted Perimeter RequirementsFlow at Elfers (cfs) vs River Station Number
0123456789
Aba
ndon 2
LiD
AR 4 6 7 8 10 13 15 20
Wat
erfa
ll
26 35 42
Elfe
rs
<---Upstream-- Cross Section--Downstream--->
Flo
w a
t E
lfer
s G
age
(cfs
)
Figure 8-2. Plot of local flow at the Anclote River at Elfers gauge required to inundate the lowest wetted perimeter inflection point at sixteen HEC-RAS cross sections in the Anclote River. Note that the scale of the x-axis is not linear.
8.2.1.3 Low-Flow Threshold The low-flow threshold is designed to limit both short term and long-term reductions in the lowest flows of a river. It limits short-term impacts limiting direct withdrawals to periods when the low-flow threshold is exceeded thus ensuring that direct withdrawals do not unnecessarily prolong or exacerbate the periods when flows are at their lowest. The low-flow threshold is derived from the more restrictive of the fish passage standard and the wetted perimeter standard. In the Anclote River a low-flow threshold of 12 cfs at the USGS Anclote River near Elfers gauge was established. The low-flow threshold was established at the higher of the fish passage and wetted perimeter criteria and is, therefore, expected to provide protection for ecological and cultural values associated with both criteria. Although flows in the river may be expected to drop below the surface-water low-flow threshold naturally, the threshold is defined to be a flow that serves to limit surface water withdrawals during the lowest flow periods. The flow record indicates flows below 12 cfs occur 102 days a year on average. Flows in block 1 exceed 12 cfs on average only 42 days each year out of 101 days in Block 1. It is appropriate to apply a low-flow threshold to protect the connectivity of the river, which appears not to be ephemeral.
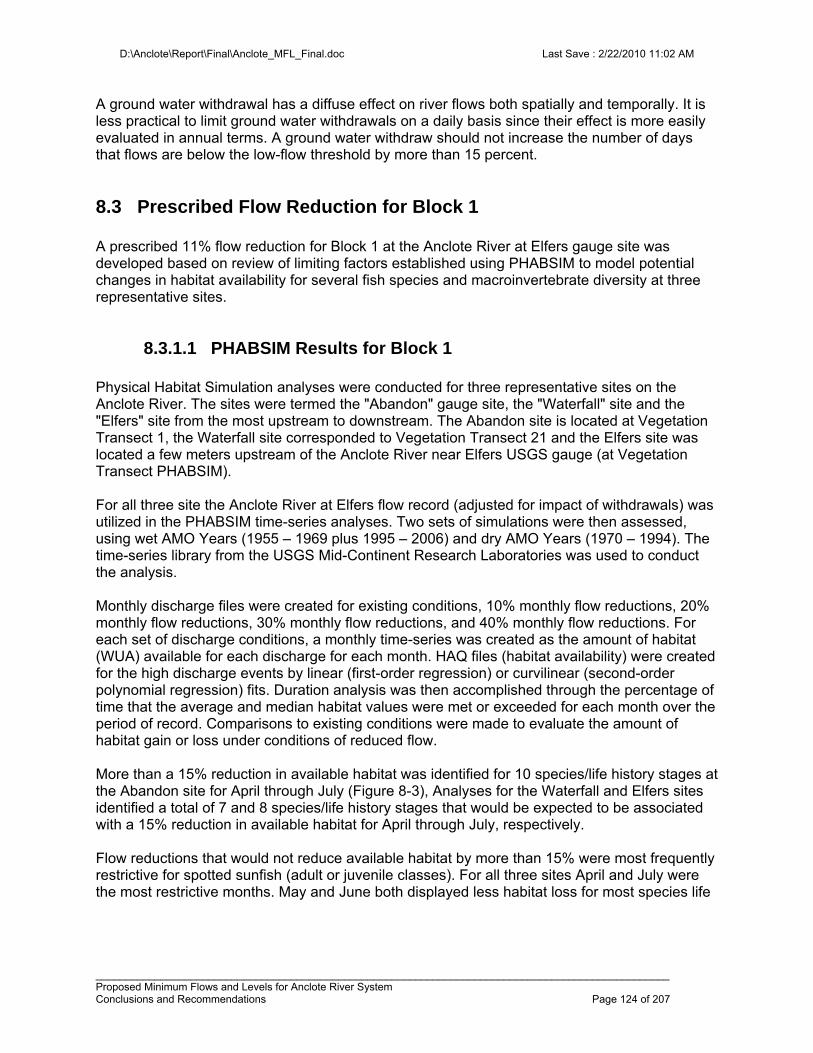
D:\Anclote\Report\Final\Anclote_MFL_Final.doc Last Save : 2/22/2010 11:02 AM
_________________________________________________________________________________________________ Proposed Minimum Flows and Levels for Anclote River System Conclusions and Recommendations Page 124 of 207
A ground water withdrawal has a diffuse effect on river flows both spatially and temporally. It is less practical to limit ground water withdrawals on a daily basis since their effect is more easily evaluated in annual terms. A ground water withdraw should not increase the number of days that flows are below the low-flow threshold by more than 15 percent.
8.3 Prescribed Flow Reduction for Block 1 A prescribed 11% flow reduction for Block 1 at the Anclote River at Elfers gauge site was developed based on review of limiting factors established using PHABSIM to model potential changes in habitat availability for several fish species and macroinvertebrate diversity at three representative sites.
8.3.1.1 PHABSIM Results for Block 1 Physical Habitat Simulation analyses were conducted for three representative sites on the Anclote River. The sites were termed the "Abandon" gauge site, the "Waterfall" site and the "Elfers" site from the most upstream to downstream. The Abandon site is located at Vegetation Transect 1, the Waterfall site corresponded to Vegetation Transect 21 and the Elfers site was located a few meters upstream of the Anclote River near Elfers USGS gauge (at Vegetation Transect PHABSIM). For all three site the Anclote River at Elfers flow record (adjusted for impact of withdrawals) was utilized in the PHABSIM time-series analyses. Two sets of simulations were then assessed, using wet AMO Years (1955 – 1969 plus 1995 – 2006) and dry AMO Years (1970 – 1994). The time-series library from the USGS Mid-Continent Research Laboratories was used to conduct the analysis. Monthly discharge files were created for existing conditions, 10% monthly flow reductions, 20% monthly flow reductions, 30% monthly flow reductions, and 40% monthly flow reductions. For each set of discharge conditions, a monthly time-series was created as the amount of habitat (WUA) available for each discharge for each month. HAQ files (habitat availability) were created for the high discharge events by linear (first-order regression) or curvilinear (second-order polynomial regression) fits. Duration analysis was then accomplished through the percentage of time that the average and median habitat values were met or exceeded for each month over the period of record. Comparisons to existing conditions were made to evaluate the amount of habitat gain or loss under conditions of reduced flow. More than a 15% reduction in available habitat was identified for 10 species/life history stages at the Abandon site for April through July (Figure 8-3), Analyses for the Waterfall and Elfers sites identified a total of 7 and 8 species/life history stages that would be expected to be associated with a 15% reduction in available habitat for April through July, respectively. Flow reductions that would not reduce available habitat by more than 15% were most frequently restrictive for spotted sunfish (adult or juvenile classes). For all three sites April and July were the most restrictive months. May and June both displayed less habitat loss for most species life
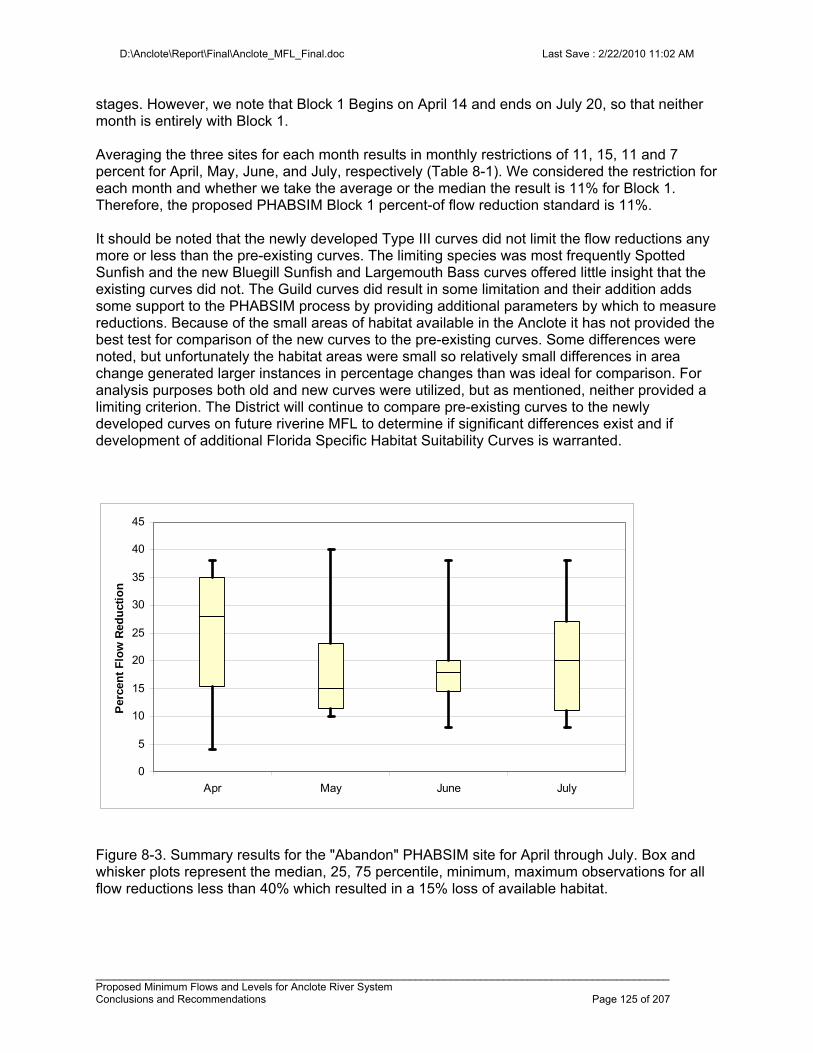
D:\Anclote\Report\Final\Anclote_MFL_Final.doc Last Save : 2/22/2010 11:02 AM
_________________________________________________________________________________________________ Proposed Minimum Flows and Levels for Anclote River System Conclusions and Recommendations Page 125 of 207
stages. However, we note that Block 1 Begins on April 14 and ends on July 20, so that neither month is entirely with Block 1. Averaging the three sites for each month results in monthly restrictions of 11, 15, 11 and 7 percent for April, May, June, and July, respectively (Table 8-1). We considered the restriction for each month and whether we take the average or the median the result is 11% for Block 1. Therefore, the proposed PHABSIM Block 1 percent-of flow reduction standard is 11%. It should be noted that the newly developed Type III curves did not limit the flow reductions any more or less than the pre-existing curves. The limiting species was most frequently Spotted Sunfish and the new Bluegill Sunfish and Largemouth Bass curves offered little insight that the existing curves did not. The Guild curves did result in some limitation and their addition adds some support to the PHABSIM process by providing additional parameters by which to measure reductions. Because of the small areas of habitat available in the Anclote it has not provided the best test for comparison of the new curves to the pre-existing curves. Some differences were noted, but unfortunately the habitat areas were small so relatively small differences in area change generated larger instances in percentage changes than was ideal for comparison. For analysis purposes both old and new curves were utilized, but as mentioned, neither provided a limiting criterion. The District will continue to compare pre-existing curves to the newly developed curves on future riverine MFL to determine if significant differences exist and if development of additional Florida Specific Habitat Suitability Curves is warranted.
0
5
10
15
20
25
30
35
40
45
Apr May June July
Per
cen
t F
low
Red
uct
ion
Figure 8-3. Summary results for the "Abandon" PHABSIM site for April through July. Box and whisker plots represent the median, 25, 75 percentile, minimum, maximum observations for all flow reductions less than 40% which resulted in a 15% loss of available habitat.
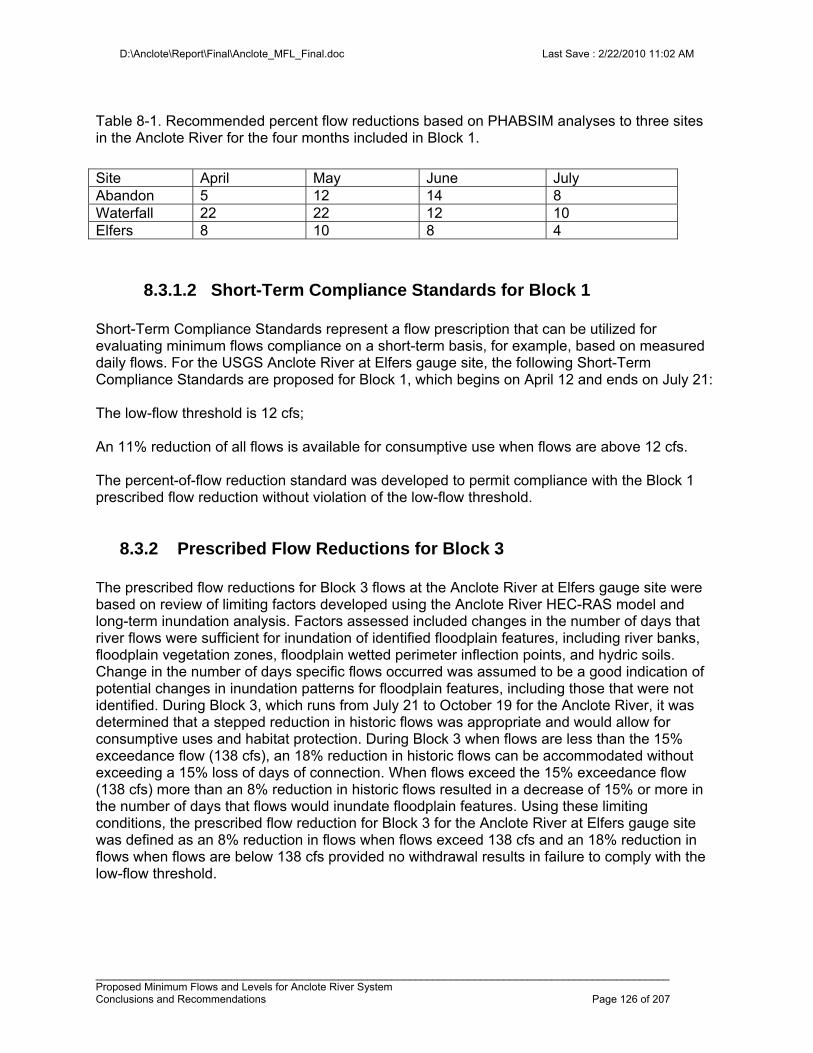
D:\Anclote\Report\Final\Anclote_MFL_Final.doc Last Save : 2/22/2010 11:02 AM
_________________________________________________________________________________________________ Proposed Minimum Flows and Levels for Anclote River System Conclusions and Recommendations Page 126 of 207
Table 8-1. Recommended percent flow reductions based on PHABSIM analyses to three sites in the Anclote River for the four months included in Block 1.
8.3.1.2 Short-Term Compliance Standards for Block 1 Short-Term Compliance Standards represent a flow prescription that can be utilized for evaluating minimum flows compliance on a short-term basis, for example, based on measured daily flows. For the USGS Anclote River at Elfers gauge site, the following Short-Term Compliance Standards are proposed for Block 1, which begins on April 12 and ends on July 21: The low-flow threshold is 12 cfs; An 11% reduction of all flows is available for consumptive use when flows are above 12 cfs. The percent-of-flow reduction standard was developed to permit compliance with the Block 1 prescribed flow reduction without violation of the low-flow threshold.
8.3.2 Prescribed Flow Reductions for Block 3 The prescribed flow reductions for Block 3 flows at the Anclote River at Elfers gauge site were based on review of limiting factors developed using the Anclote River HEC-RAS model and long-term inundation analysis. Factors assessed included changes in the number of days that river flows were sufficient for inundation of identified floodplain features, including river banks, floodplain vegetation zones, floodplain wetted perimeter inflection points, and hydric soils. Change in the number of days specific flows occurred was assumed to be a good indication of potential changes in inundation patterns for floodplain features, including those that were not identified. During Block 3, which runs from July 21 to October 19 for the Anclote River, it was determined that a stepped reduction in historic flows was appropriate and would allow for consumptive uses and habitat protection. During Block 3 when flows are less than the 15% exceedance flow (138 cfs), an 18% reduction in historic flows can be accommodated without exceeding a 15% loss of days of connection. When flows exceed the 15% exceedance flow (138 cfs) more than an 8% reduction in historic flows resulted in a decrease of 15% or more in the number of days that flows would inundate floodplain features. Using these limiting conditions, the prescribed flow reduction for Block 3 for the Anclote River at Elfers gauge site was defined as an 8% reduction in flows when flows exceed 138 cfs and an 18% reduction in flows when flows are below 138 cfs provided no withdrawal results in failure to comply with the low-flow threshold.
Site April May June July Abandon 5 12 14 8 Waterfall 22 22 12 10 Elfers 8 10 8 4
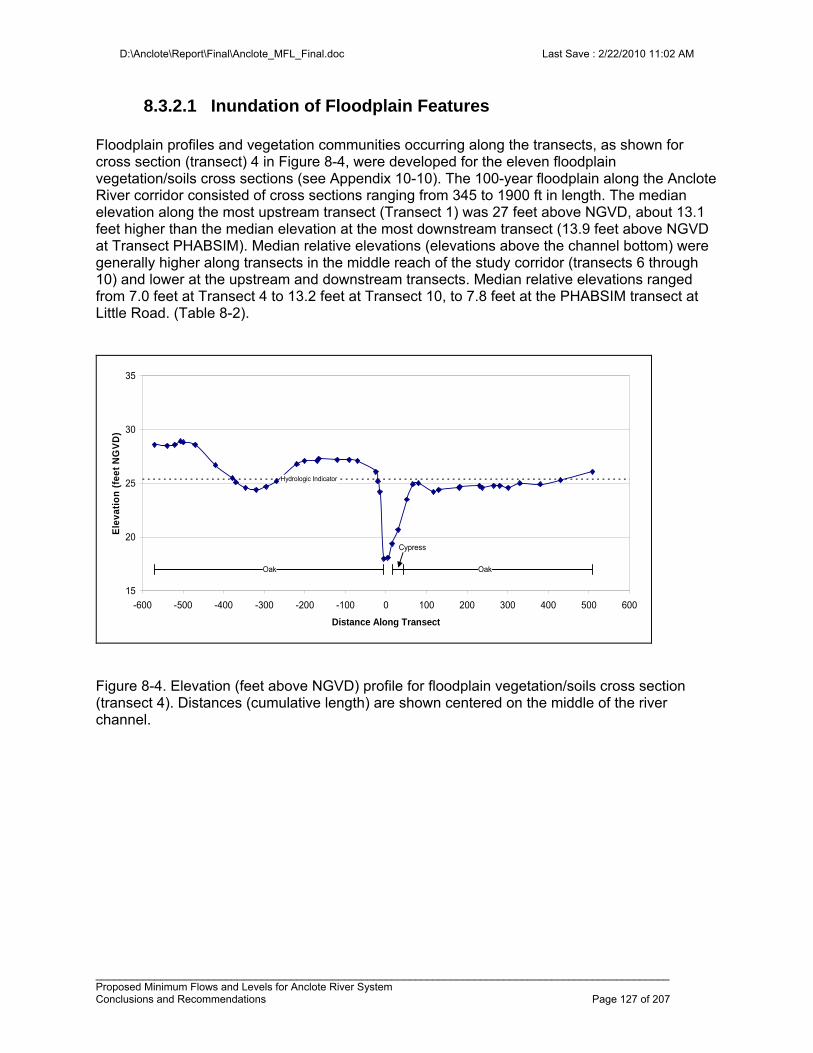
D:\Anclote\Report\Final\Anclote_MFL_Final.doc Last Save : 2/22/2010 11:02 AM
_________________________________________________________________________________________________ Proposed Minimum Flows and Levels for Anclote River System Conclusions and Recommendations Page 127 of 207
8.3.2.1 Inundation of Floodplain Features Floodplain profiles and vegetation communities occurring along the transects, as shown for cross section (transect) 4 in Figure 8-4, were developed for the eleven floodplain vegetation/soils cross sections (see Appendix 10-10). The 100-year floodplain along the Anclote River corridor consisted of cross sections ranging from 345 to 1900 ft in length. The median elevation along the most upstream transect (Transect 1) was 27 feet above NGVD, about 13.1 feet higher than the median elevation at the most downstream transect (13.9 feet above NGVD at Transect PHABSIM). Median relative elevations (elevations above the channel bottom) were generally higher along transects in the middle reach of the study corridor (transects 6 through 10) and lower at the upstream and downstream transects. Median relative elevations ranged from 7.0 feet at Transect 4 to 13.2 feet at Transect 10, to 7.8 feet at the PHABSIM transect at Little Road. (Table 8-2).
Hydrologic Indicator
Oak
Cypress
Oak
15
20
25
30
35
-600 -500 -400 -300 -200 -100 0 100 200 300 400 500 600
Distance Along Transect
Ele
vati
on
(fe
et N
GV
D)
Figure 8-4. Elevation (feet above NGVD) profile for floodplain vegetation/soils cross section (transect 4). Distances (cumulative length) are shown centered on the middle of the river channel.
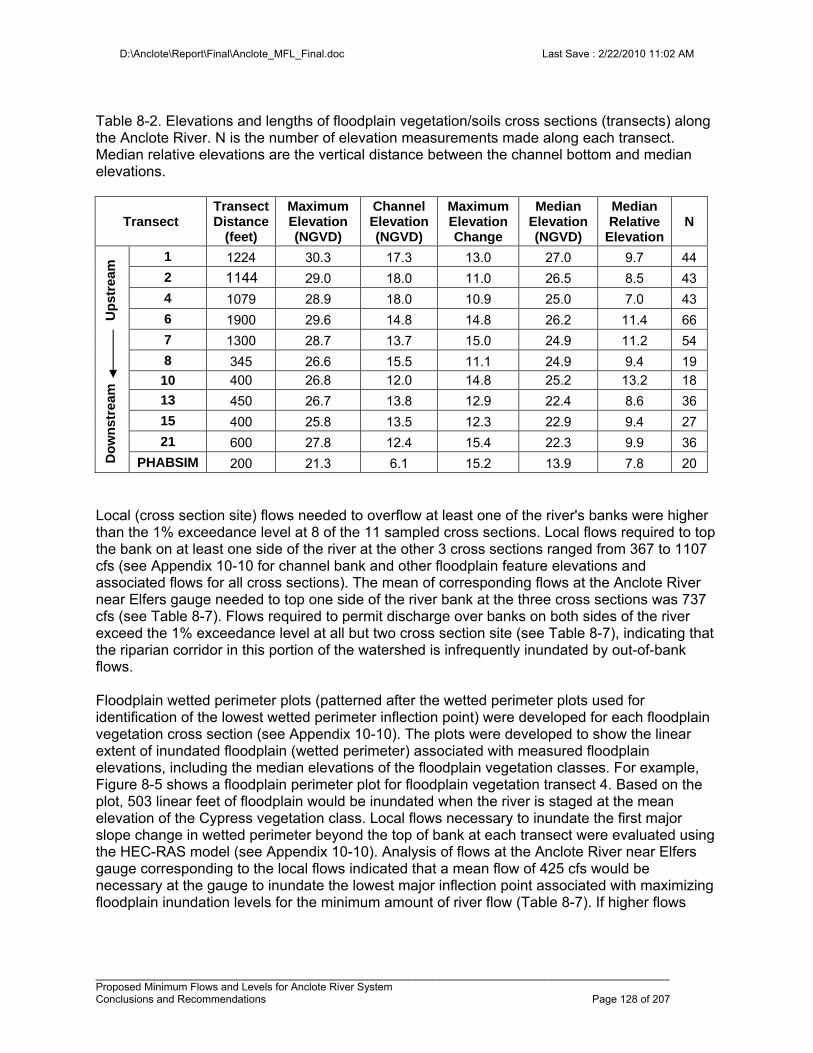
D:\Anclote\Report\Final\Anclote_MFL_Final.doc Last Save : 2/22/2010 11:02 AM
_________________________________________________________________________________________________ Proposed Minimum Flows and Levels for Anclote River System Conclusions and Recommendations Page 128 of 207
Table 8-2. Elevations and lengths of floodplain vegetation/soils cross sections (transects) along the Anclote River. N is the number of elevation measurements made along each transect. Median relative elevations are the vertical distance between the channel bottom and median elevations.
Transect Transect Distance
(feet)
Maximum Elevation (NGVD)
Channel Elevation (NGVD)
Maximum Elevation Change
Median Elevation (NGVD)
Median Relative
ElevationN
Do
wn
stre
am
Up
stre
am 1 1224 30.3 17.3 13.0 27.0 9.7 44
2 1144 29.0 18.0 11.0 26.5 8.5 43
4 1079 28.9 18.0 10.9 25.0 7.0 43
6 1900 29.6 14.8 14.8 26.2 11.4 66
7 1300 28.7 13.7 15.0 24.9 11.2 54
8 345 26.6 15.5 11.1 24.9 9.4 19
10 400 26.8 12.0 14.8 25.2 13.2 18
13 450 26.7 13.8 12.9 22.4 8.6 36
15 400 25.8 13.5 12.3 22.9 9.4 27
21 600 27.8 12.4 15.4 22.3 9.9 36
PHABSIM 200 21.3 6.1 15.2 13.9 7.8 20 Local (cross section site) flows needed to overflow at least one of the river's banks were higher than the 1% exceedance level at 8 of the 11 sampled cross sections. Local flows required to top the bank on at least one side of the river at the other 3 cross sections ranged from 367 to 1107 cfs (see Appendix 10-10 for channel bank and other floodplain feature elevations and associated flows for all cross sections). The mean of corresponding flows at the Anclote River near Elfers gauge needed to top one side of the river bank at the three cross sections was 737 cfs (see Table 8-7). Flows required to permit discharge over banks on both sides of the river exceed the 1% exceedance level at all but two cross section site (see Table 8-7), indicating that the riparian corridor in this portion of the watershed is infrequently inundated by out-of-bank flows. Floodplain wetted perimeter plots (patterned after the wetted perimeter plots used for identification of the lowest wetted perimeter inflection point) were developed for each floodplain vegetation cross section (see Appendix 10-10). The plots were developed to show the linear extent of inundated floodplain (wetted perimeter) associated with measured floodplain elevations, including the median elevations of the floodplain vegetation classes. For example, Figure 8-5 shows a floodplain perimeter plot for floodplain vegetation transect 4. Based on the plot, 503 linear feet of floodplain would be inundated when the river is staged at the mean elevation of the Cypress vegetation class. Local flows necessary to inundate the first major slope change in wetted perimeter beyond the top of bank at each transect were evaluated using the HEC-RAS model (see Appendix 10-10). Analysis of flows at the Anclote River near Elfers gauge corresponding to the local flows indicated that a mean flow of 425 cfs would be necessary at the gauge to inundate the lowest major inflection point associated with maximizing floodplain inundation levels for the minimum amount of river flow (Table 8-7). If higher flows
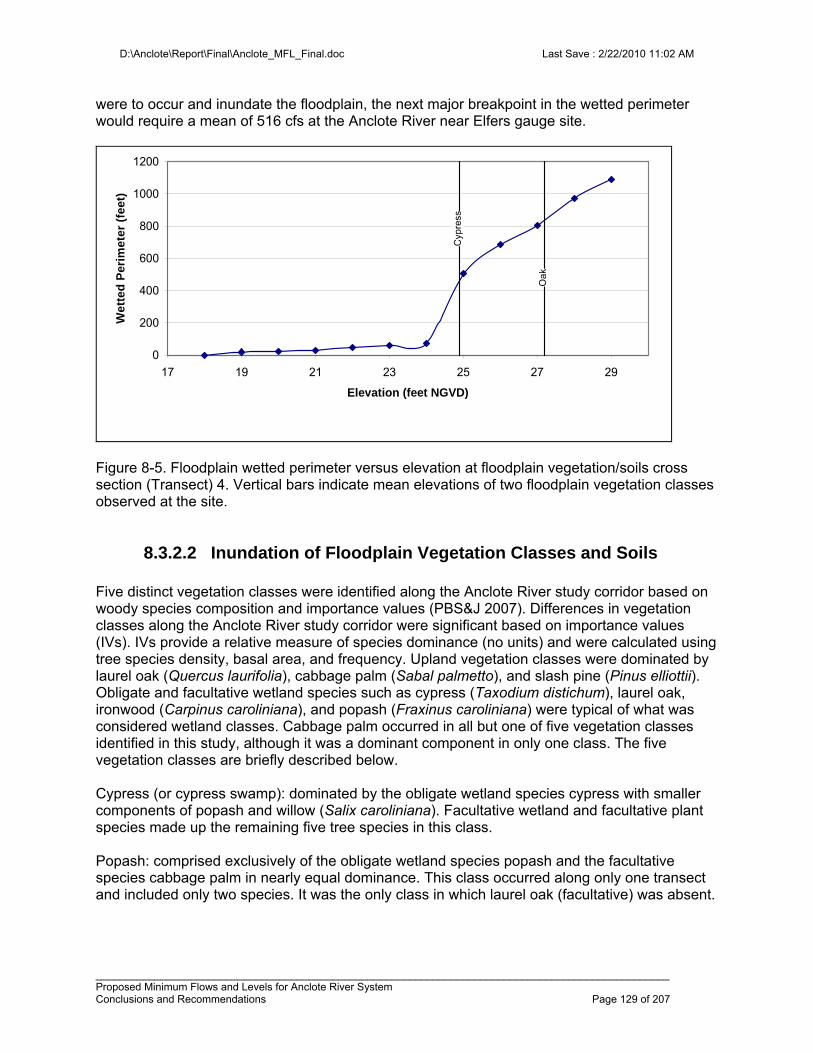
D:\Anclote\Report\Final\Anclote_MFL_Final.doc Last Save : 2/22/2010 11:02 AM
_________________________________________________________________________________________________ Proposed Minimum Flows and Levels for Anclote River System Conclusions and Recommendations Page 129 of 207
were to occur and inundate the floodplain, the next major breakpoint in the wetted perimeter would require a mean of 516 cfs at the Anclote River near Elfers gauge site.
Oak
Cyp
ress
0
200
400
600
800
1000
1200
17 19 21 23 25 27 29
Elevation (feet NGVD)
Wet
ted
Per
imet
er (
feet
)
Figure 8-5. Floodplain wetted perimeter versus elevation at floodplain vegetation/soils cross section (Transect) 4. Vertical bars indicate mean elevations of two floodplain vegetation classes observed at the site.
8.3.2.2 Inundation of Floodplain Vegetation Classes and Soils Five distinct vegetation classes were identified along the Anclote River study corridor based on woody species composition and importance values (PBS&J 2007). Differences in vegetation classes along the Anclote River study corridor were significant based on importance values (IVs). IVs provide a relative measure of species dominance (no units) and were calculated using tree species density, basal area, and frequency. Upland vegetation classes were dominated by laurel oak (Quercus laurifolia), cabbage palm (Sabal palmetto), and slash pine (Pinus elliottii). Obligate and facultative wetland species such as cypress (Taxodium distichum), laurel oak, ironwood (Carpinus caroliniana), and popash (Fraxinus caroliniana) were typical of what was considered wetland classes. Cabbage palm occurred in all but one of five vegetation classes identified in this study, although it was a dominant component in only one class. The five vegetation classes are briefly described below. Cypress (or cypress swamp): dominated by the obligate wetland species cypress with smaller components of popash and willow (Salix caroliniana). Facultative wetland and facultative plant species made up the remaining five tree species in this class. Popash: comprised exclusively of the obligate wetland species popash and the facultative species cabbage palm in nearly equal dominance. This class occurred along only one transect and included only two species. It was the only class in which laurel oak (facultative) was absent.
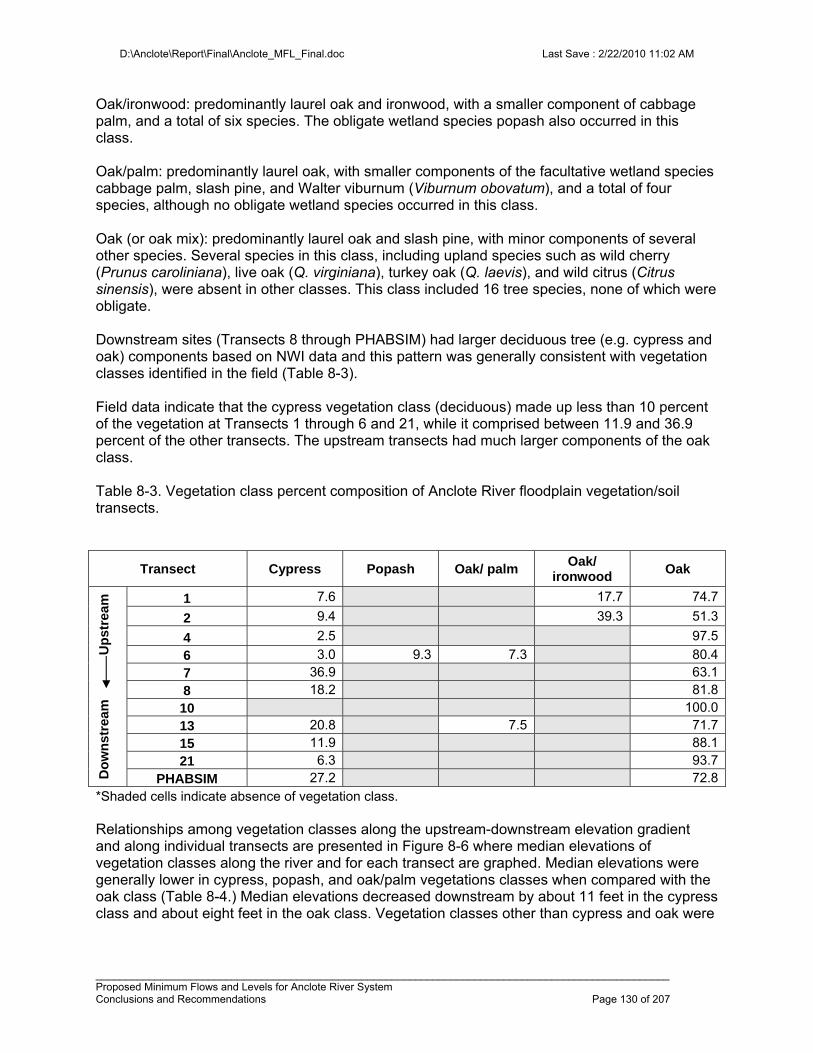
D:\Anclote\Report\Final\Anclote_MFL_Final.doc Last Save : 2/22/2010 11:02 AM
_________________________________________________________________________________________________ Proposed Minimum Flows and Levels for Anclote River System Conclusions and Recommendations Page 130 of 207
Oak/ironwood: predominantly laurel oak and ironwood, with a smaller component of cabbage palm, and a total of six species. The obligate wetland species popash also occurred in this class. Oak/palm: predominantly laurel oak, with smaller components of the facultative wetland species cabbage palm, slash pine, and Walter viburnum (Viburnum obovatum), and a total of four species, although no obligate wetland species occurred in this class. Oak (or oak mix): predominantly laurel oak and slash pine, with minor components of several other species. Several species in this class, including upland species such as wild cherry (Prunus caroliniana), live oak (Q. virginiana), turkey oak (Q. laevis), and wild citrus (Citrus sinensis), were absent in other classes. This class included 16 tree species, none of which were obligate. Downstream sites (Transects 8 through PHABSIM) had larger deciduous tree (e.g. cypress and oak) components based on NWI data and this pattern was generally consistent with vegetation classes identified in the field (Table 8-3). Field data indicate that the cypress vegetation class (deciduous) made up less than 10 percent of the vegetation at Transects 1 through 6 and 21, while it comprised between 11.9 and 36.9 percent of the other transects. The upstream transects had much larger components of the oak class. Table 8-3. Vegetation class percent composition of Anclote River floodplain vegetation/soil transects.
Relationships among vegetation classes along the upstream-downstream elevation gradient and along individual transects are presented in Figure 8-6 where median elevations of vegetation classes along the river and for each transect are graphed. Median elevations were generally lower in cypress, popash, and oak/palm vegetations classes when compared with the oak class (Table 8-4.) Median elevations decreased downstream by about 11 feet in the cypress class and about eight feet in the oak class. Vegetation classes other than cypress and oak were
Transect Cypress Popash Oak/ palm Oak/
ironwood Oak
Do
wn
stre
am
U
pst
ream
1 7.6 17.7 74.7
2 9.4 39.3 51.3
4 2.5 97.5
6 3.0 9.3 7.3 80.47 36.9 63.1
8 18.2 81.810 100.013 20.8 7.5 71.715 11.9 88.121 6.3 93.7
PHABSIM 27.2 72.8*Shaded cells indicate absence of vegetation class.
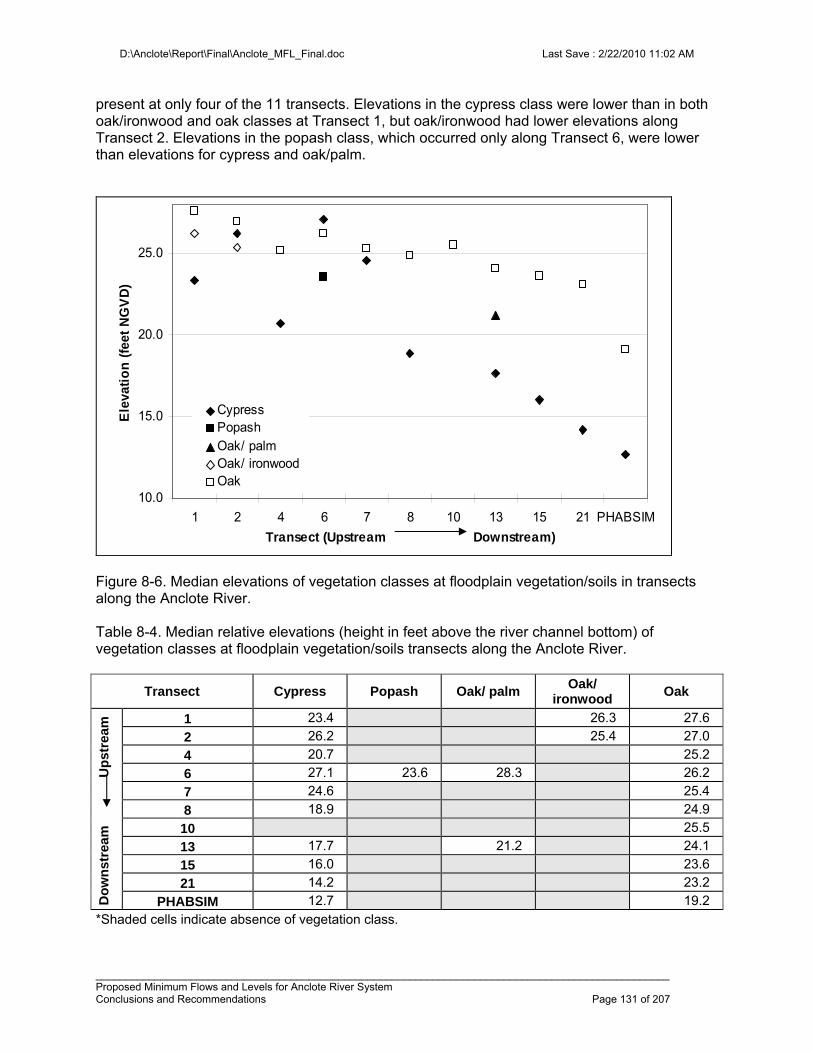
D:\Anclote\Report\Final\Anclote_MFL_Final.doc Last Save : 2/22/2010 11:02 AM
_________________________________________________________________________________________________ Proposed Minimum Flows and Levels for Anclote River System Conclusions and Recommendations Page 131 of 207
present at only four of the 11 transects. Elevations in the cypress class were lower than in both oak/ironwood and oak classes at Transect 1, but oak/ironwood had lower elevations along Transect 2. Elevations in the popash class, which occurred only along Transect 6, were lower than elevations for cypress and oak/palm.
10.0
15.0
20.0
25.0
1 2 4 6 7 8 10 13 15 21 PHABSIM
Transect (Upstream Downstream)
Ele
vati
on
(fe
et N
GV
D)
CypressPopashOak/ palmOak/ ironwoodOak
Figure 8-6. Median elevations of vegetation classes at floodplain vegetation/soils in transects along the Anclote River. Table 8-4. Median relative elevations (height in feet above the river channel bottom) of vegetation classes at floodplain vegetation/soils transects along the Anclote River.
Transect Cypress Popash Oak/ palm Oak/
ironwood Oak
Do
wn
stre
am
U
pst
ream
1 23.4 26.3 27.6
2 26.2 25.4 27.0
4 20.7 25.2
6 27.1 23.6 28.3 26.2
7 24.6 25.4
8 18.9 24.9
10 25.5
13 17.7 21.2 24.1
15 16.0 23.6
21 14.2 23.2
PHABSIM 12.7 19.2
*Shaded cells indicate absence of vegetation class.
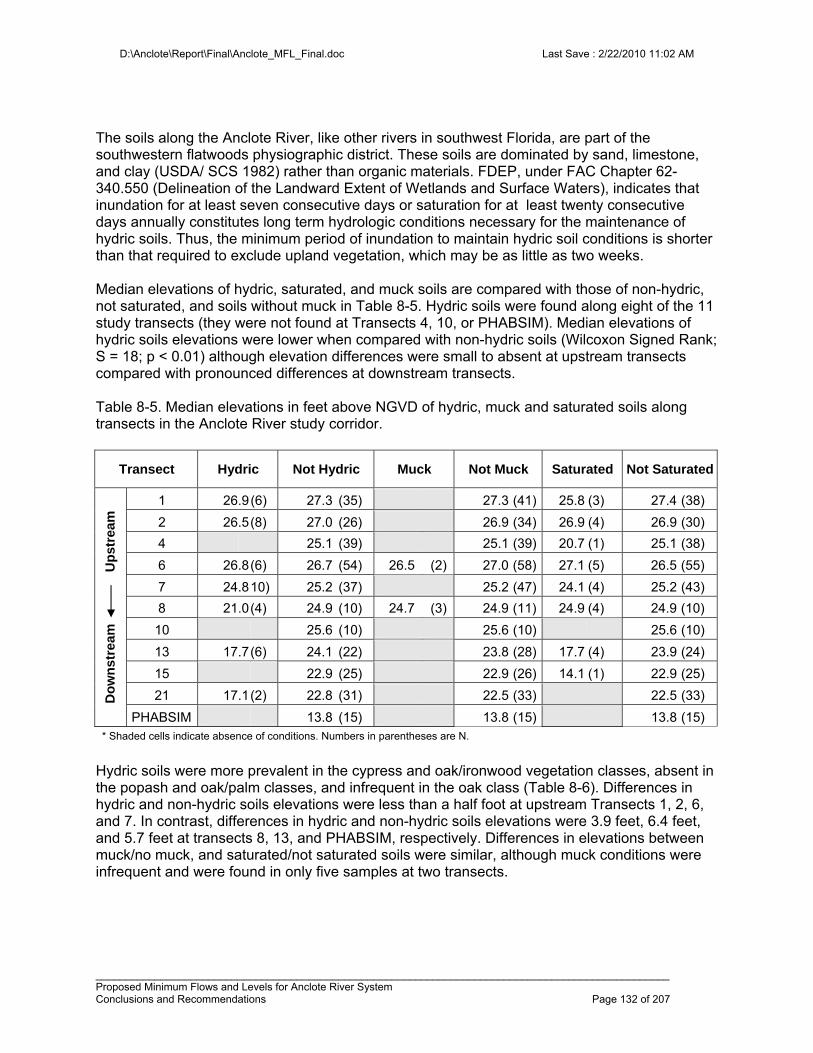
D:\Anclote\Report\Final\Anclote_MFL_Final.doc Last Save : 2/22/2010 11:02 AM
_________________________________________________________________________________________________ Proposed Minimum Flows and Levels for Anclote River System Conclusions and Recommendations Page 132 of 207
The soils along the Anclote River, like other rivers in southwest Florida, are part of the southwestern flatwoods physiographic district. These soils are dominated by sand, limestone, and clay (USDA/ SCS 1982) rather than organic materials. FDEP, under FAC Chapter 62-340.550 (Delineation of the Landward Extent of Wetlands and Surface Waters), indicates that inundation for at least seven consecutive days or saturation for at least twenty consecutive days annually constitutes long term hydrologic conditions necessary for the maintenance of hydric soils. Thus, the minimum period of inundation to maintain hydric soil conditions is shorter than that required to exclude upland vegetation, which may be as little as two weeks. Median elevations of hydric, saturated, and muck soils are compared with those of non-hydric, not saturated, and soils without muck in Table 8-5. Hydric soils were found along eight of the 11 study transects (they were not found at Transects 4, 10, or PHABSIM). Median elevations of hydric soils elevations were lower when compared with non-hydric soils (Wilcoxon Signed Rank; S = 18; p < 0.01) although elevation differences were small to absent at upstream transects compared with pronounced differences at downstream transects. Table 8-5. Median elevations in feet above NGVD of hydric, muck and saturated soils along transects in the Anclote River study corridor.
Hydric soils were more prevalent in the cypress and oak/ironwood vegetation classes, absent in the popash and oak/palm classes, and infrequent in the oak class (Table 8-6). Differences in hydric and non-hydric soils elevations were less than a half foot at upstream Transects 1, 2, 6, and 7. In contrast, differences in hydric and non-hydric soils elevations were 3.9 feet, 6.4 feet, and 5.7 feet at transects 8, 13, and PHABSIM, respectively. Differences in elevations between muck/no muck, and saturated/not saturated soils were similar, although muck conditions were infrequent and were found in only five samples at two transects.
Transect Hydric Not Hydric Muck Not Muck Saturated Not Saturated
Do
wn
stre
am
U
pst
ream
1 26.9 (6) 27.3 (35) 27.3 (41) 25.8 (3) 27.4 (38)
2 26.5 (8) 27.0 (26) 26.9 (34) 26.9 (4) 26.9 (30)
4 25.1 (39) 25.1 (39) 20.7 (1) 25.1 (38)
6 26.8 (6) 26.7 (54) 26.5 (2) 27.0 (58) 27.1 (5) 26.5 (55)
7 24.8 10) 25.2 (37) 25.2 (47) 24.1 (4) 25.2 (43)
8 21.0 (4) 24.9 (10) 24.7 (3) 24.9 (11) 24.9 (4) 24.9 (10)
10 25.6 (10) 25.6 (10) 25.6 (10)
13 17.7 (6) 24.1 (22) 23.8 (28) 17.7 (4) 23.9 (24)
15 22.9 (25) 22.9 (26) 14.1 (1) 22.9 (25)
21 17.1 (2) 22.8 (31) 22.5 (33) 22.5 (33)
PHABSIM 13.8 (15) 13.8 (15) 13.8 (15) * Shaded cells indicate absence of conditions. Numbers in parentheses are N.
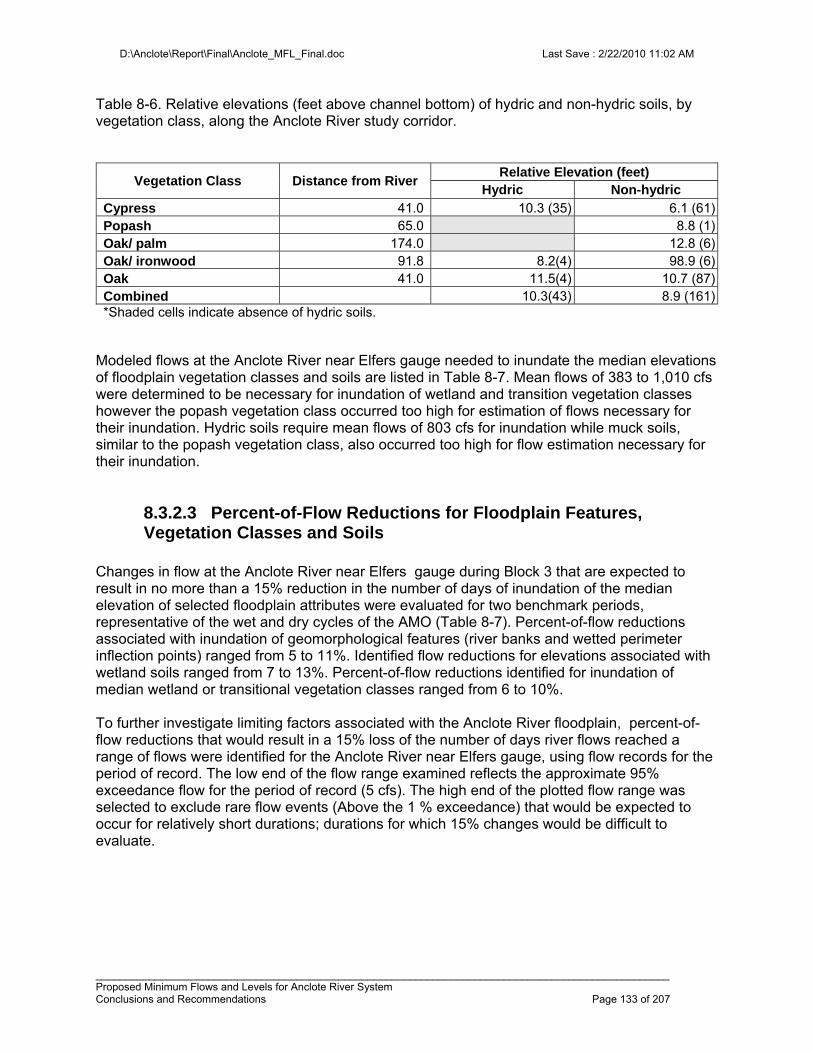
D:\Anclote\Report\Final\Anclote_MFL_Final.doc Last Save : 2/22/2010 11:02 AM
_________________________________________________________________________________________________ Proposed Minimum Flows and Levels for Anclote River System Conclusions and Recommendations Page 133 of 207
Table 8-6. Relative elevations (feet above channel bottom) of hydric and non-hydric soils, by vegetation class, along the Anclote River study corridor.
Vegetation Class Distance from River Relative Elevation (feet)
Hydric Non-hydric Cypress 41.0 10.3 (35) 6.1 (61)Popash 65.0 8.8 (1)Oak/ palm 174.0 12.8 (6)Oak/ ironwood 91.8 8.2(4) 98.9 (6)Oak 41.0 11.5(4) 10.7 (87)Combined 10.3(43) 8.9 (161)*Shaded cells indicate absence of hydric soils.
Modeled flows at the Anclote River near Elfers gauge needed to inundate the median elevations of floodplain vegetation classes and soils are listed in Table 8-7. Mean flows of 383 to 1,010 cfs were determined to be necessary for inundation of wetland and transition vegetation classes however the popash vegetation class occurred too high for estimation of flows necessary for their inundation. Hydric soils require mean flows of 803 cfs for inundation while muck soils, similar to the popash vegetation class, also occurred too high for flow estimation necessary for their inundation.
8.3.2.3 Percent-of-Flow Reductions for Floodplain Features, Vegetation Classes and Soils
Changes in flow at the Anclote River near Elfers gauge during Block 3 that are expected to result in no more than a 15% reduction in the number of days of inundation of the median elevation of selected floodplain attributes were evaluated for two benchmark periods, representative of the wet and dry cycles of the AMO (Table 8-7). Percent-of-flow reductions associated with inundation of geomorphological features (river banks and wetted perimeter inflection points) ranged from 5 to 11%. Identified flow reductions for elevations associated with wetland soils ranged from 7 to 13%. Percent-of-flow reductions identified for inundation of median wetland or transitional vegetation classes ranged from 6 to 10%. To further investigate limiting factors associated with the Anclote River floodplain, percent-of-flow reductions that would result in a 15% loss of the number of days river flows reached a range of flows were identified for the Anclote River near Elfers gauge, using flow records for the period of record. The low end of the flow range examined reflects the approximate 95% exceedance flow for the period of record (5 cfs). The high end of the plotted flow range was selected to exclude rare flow events (Above the 1 % exceedance) that would be expected to occur for relatively short durations; durations for which 15% changes would be difficult to evaluate.
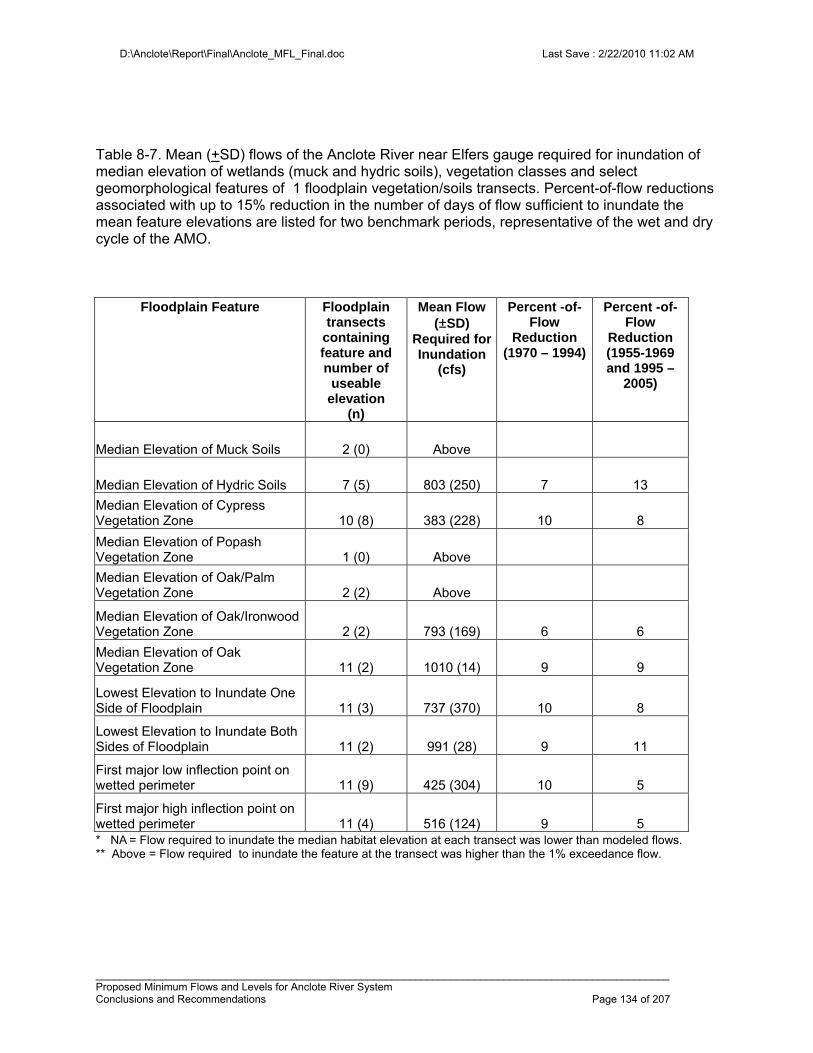
D:\Anclote\Report\Final\Anclote_MFL_Final.doc Last Save : 2/22/2010 11:02 AM
_________________________________________________________________________________________________ Proposed Minimum Flows and Levels for Anclote River System Conclusions and Recommendations Page 134 of 207
Table 8-7. Mean (+SD) flows of the Anclote River near Elfers gauge required for inundation of median elevation of wetlands (muck and hydric soils), vegetation classes and select geomorphological features of 1 floodplain vegetation/soils transects. Percent-of-flow reductions associated with up to 15% reduction in the number of days of flow sufficient to inundate the mean feature elevations are listed for two benchmark periods, representative of the wet and dry cycle of the AMO.
Floodplain Feature Floodplain transects
containing feature and number of
useable elevation
(n)
Mean Flow (±SD)
Required for Inundation
(cfs)
Percent -of- Flow
Reduction (1970 – 1994)
Percent -of- Flow
Reduction (1955-1969 and 1995 –
2005)
Median Elevation of Muck Soils 2 (0) Above
Median Elevation of Hydric Soils 7 (5) 803 (250) 7 13
Median Elevation of Cypress Vegetation Zone 10 (8) 383 (228) 10 8
Median Elevation of Popash Vegetation Zone 1 (0) Above
Median Elevation of Oak/Palm Vegetation Zone 2 (2) Above
Median Elevation of Oak/Ironwood Vegetation Zone 2 (2) 793 (169) 6 6
Median Elevation of Oak Vegetation Zone 11 (2) 1010 (14) 9 9
Lowest Elevation to Inundate One Side of Floodplain 11 (3) 737 (370) 10 8
Lowest Elevation to Inundate Both Sides of Floodplain 11 (2) 991 (28) 9 11
First major low inflection point on wetted perimeter 11 (9) 425 (304) 10 5
First major high inflection point on wetted perimeter 11 (4) 516 (124) 9 5 * NA = Flow required to inundate the median habitat elevation at each transect was lower than modeled flows.** Above = Flow required to inundate the feature at the transect was higher than the 1% exceedance flow.
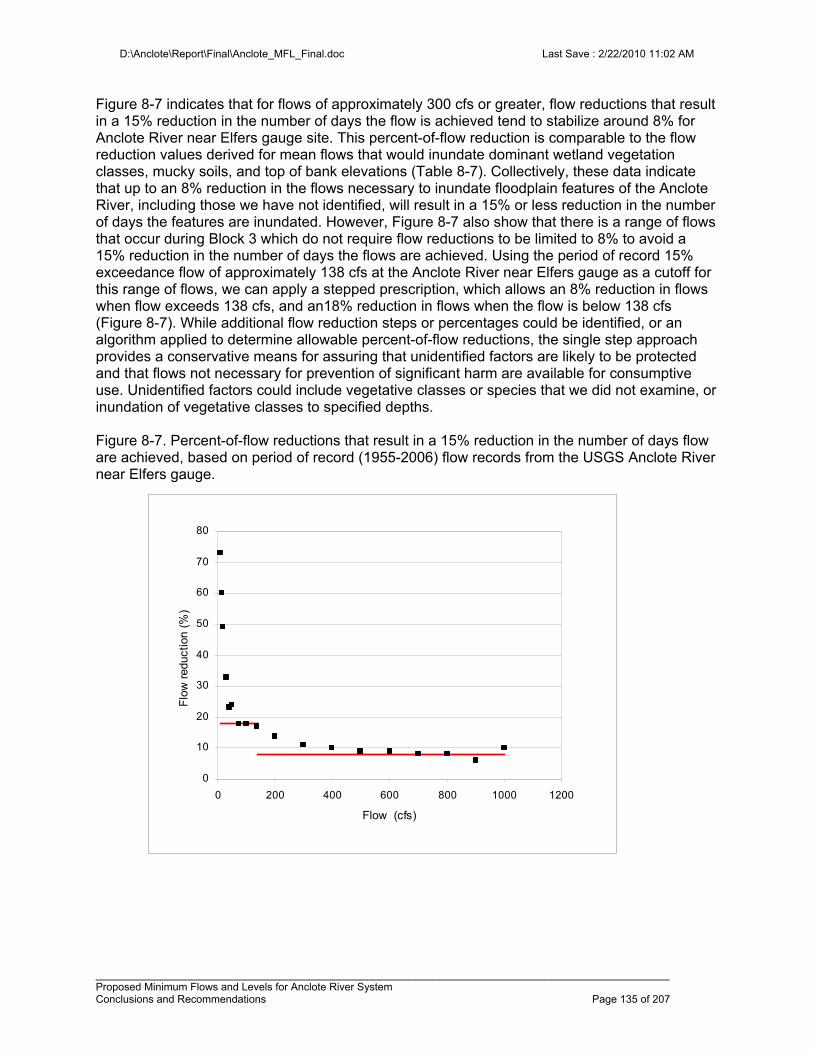
D:\Anclote\Report\Final\Anclote_MFL_Final.doc Last Save : 2/22/2010 11:02 AM
_________________________________________________________________________________________________ Proposed Minimum Flows and Levels for Anclote River System Conclusions and Recommendations Page 135 of 207
Figure 8-7 indicates that for flows of approximately 300 cfs or greater, flow reductions that result in a 15% reduction in the number of days the flow is achieved tend to stabilize around 8% for Anclote River near Elfers gauge site. This percent-of-flow reduction is comparable to the flow reduction values derived for mean flows that would inundate dominant wetland vegetation classes, mucky soils, and top of bank elevations (Table 8-7). Collectively, these data indicate that up to an 8% reduction in the flows necessary to inundate floodplain features of the Anclote River, including those we have not identified, will result in a 15% or less reduction in the number of days the features are inundated. However, Figure 8-7 also show that there is a range of flows that occur during Block 3 which do not require flow reductions to be limited to 8% to avoid a 15% reduction in the number of days the flows are achieved. Using the period of record 15% exceedance flow of approximately 138 cfs at the Anclote River near Elfers gauge as a cutoff for this range of flows, we can apply a stepped prescription, which allows an 8% reduction in flows when flow exceeds 138 cfs, and an18% reduction in flows when the flow is below 138 cfs (Figure 8-7). While additional flow reduction steps or percentages could be identified, or an algorithm applied to determine allowable percent-of-flow reductions, the single step approach provides a conservative means for assuring that unidentified factors are likely to be protected and that flows not necessary for prevention of significant harm are available for consumptive use. Unidentified factors could include vegetative classes or species that we did not examine, or inundation of vegetative classes to specified depths. Figure 8-7. Percent-of-flow reductions that result in a 15% reduction in the number of days flow are achieved, based on period of record (1955-2006) flow records from the USGS Anclote River near Elfers gauge.
0
10
20
30
40
50
60
70
80
0 200 400 600 800 1000 1200
Flow (cfs)
Flo
w r
educ
tion
(%)
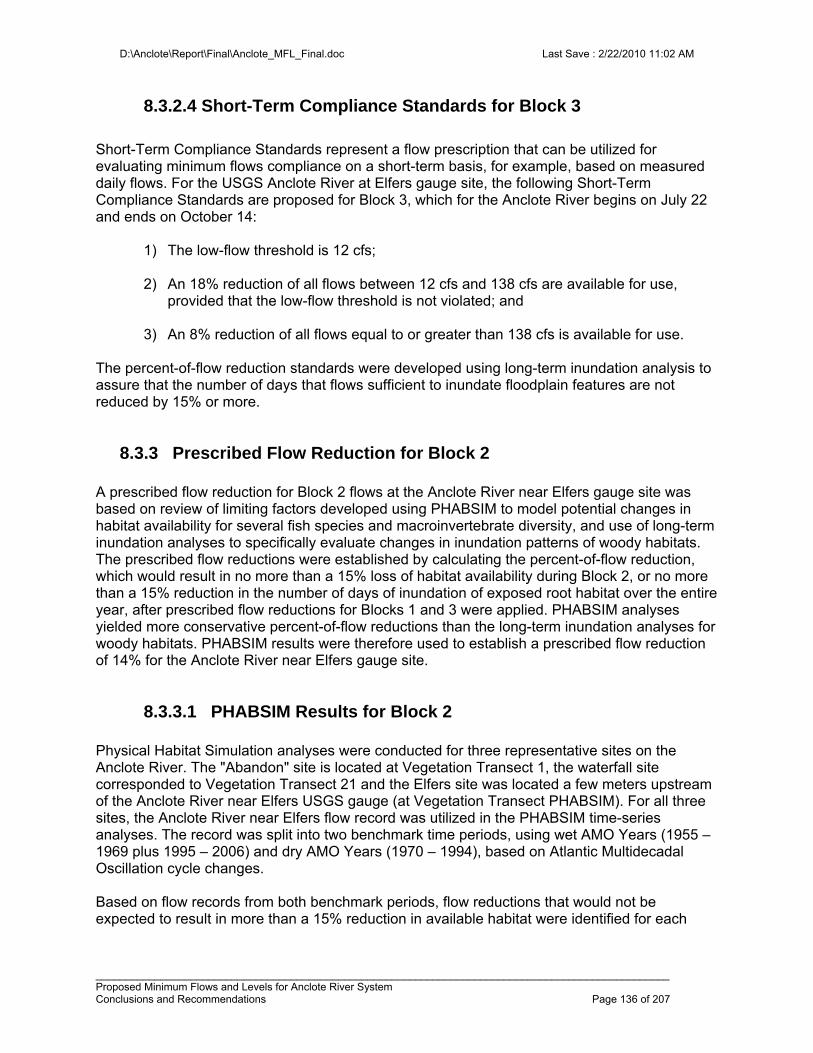
D:\Anclote\Report\Final\Anclote_MFL_Final.doc Last Save : 2/22/2010 11:02 AM
_________________________________________________________________________________________________ Proposed Minimum Flows and Levels for Anclote River System Conclusions and Recommendations Page 136 of 207
8.3.2.4 Short-Term Compliance Standards for Block 3
Short-Term Compliance Standards represent a flow prescription that can be utilized for evaluating minimum flows compliance on a short-term basis, for example, based on measured daily flows. For the USGS Anclote River at Elfers gauge site, the following Short-Term Compliance Standards are proposed for Block 3, which for the Anclote River begins on July 22 and ends on October 14:
1) The low-flow threshold is 12 cfs; 2) An 18% reduction of all flows between 12 cfs and 138 cfs are available for use,
provided that the low-flow threshold is not violated; and
3) An 8% reduction of all flows equal to or greater than 138 cfs is available for use. The percent-of-flow reduction standards were developed using long-term inundation analysis to assure that the number of days that flows sufficient to inundate floodplain features are not reduced by 15% or more.
8.3.3 Prescribed Flow Reduction for Block 2 A prescribed flow reduction for Block 2 flows at the Anclote River near Elfers gauge site was based on review of limiting factors developed using PHABSIM to model potential changes in habitat availability for several fish species and macroinvertebrate diversity, and use of long-term inundation analyses to specifically evaluate changes in inundation patterns of woody habitats. The prescribed flow reductions were established by calculating the percent-of-flow reduction, which would result in no more than a 15% loss of habitat availability during Block 2, or no more than a 15% reduction in the number of days of inundation of exposed root habitat over the entire year, after prescribed flow reductions for Blocks 1 and 3 were applied. PHABSIM analyses yielded more conservative percent-of-flow reductions than the long-term inundation analyses for woody habitats. PHABSIM results were therefore used to establish a prescribed flow reduction of 14% for the Anclote River near Elfers gauge site.
8.3.3.1 PHABSIM Results for Block 2 Physical Habitat Simulation analyses were conducted for three representative sites on the Anclote River. The "Abandon" site is located at Vegetation Transect 1, the waterfall site corresponded to Vegetation Transect 21 and the Elfers site was located a few meters upstream of the Anclote River near Elfers USGS gauge (at Vegetation Transect PHABSIM). For all three sites, the Anclote River near Elfers flow record was utilized in the PHABSIM time-series analyses. The record was split into two benchmark time periods, using wet AMO Years (1955 – 1969 plus 1995 – 2006) and dry AMO Years (1970 – 1994), based on Atlantic Multidecadal Oscillation cycle changes. Based on flow records from both benchmark periods, flow reductions that would not be expected to result in more than a 15% reduction in available habitat were identified for each
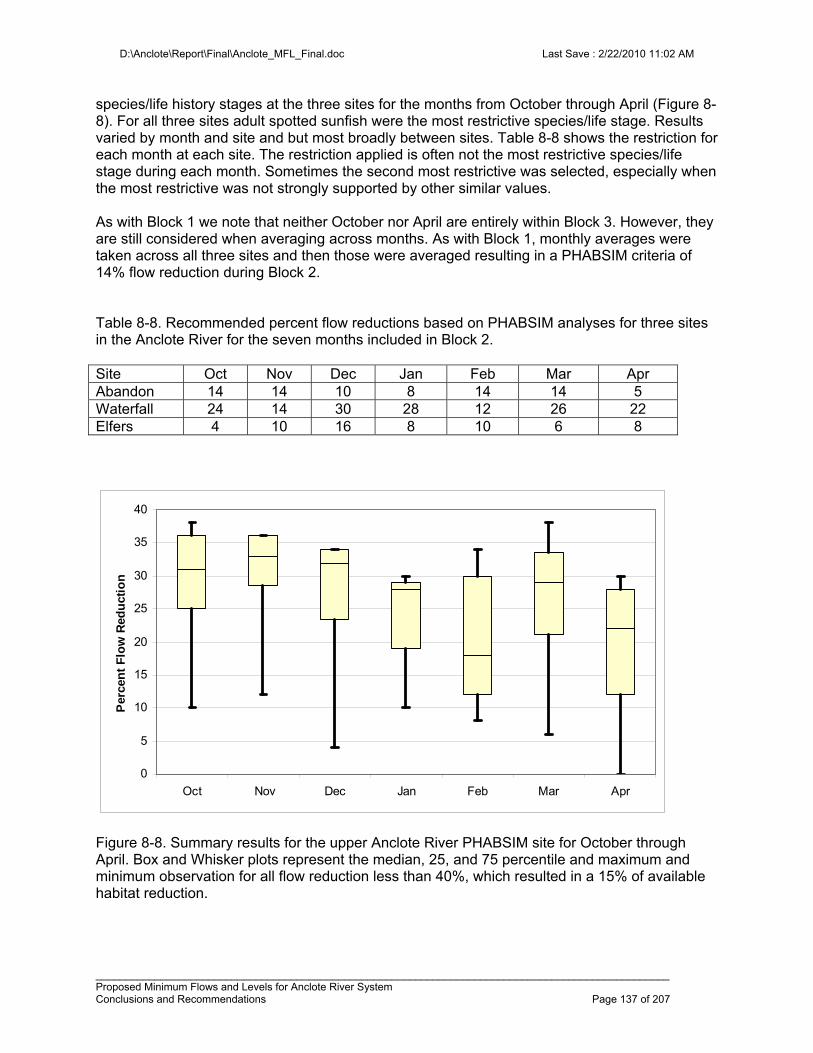
D:\Anclote\Report\Final\Anclote_MFL_Final.doc Last Save : 2/22/2010 11:02 AM
_________________________________________________________________________________________________ Proposed Minimum Flows and Levels for Anclote River System Conclusions and Recommendations Page 137 of 207
species/life history stages at the three sites for the months from October through April (Figure 8-8). For all three sites adult spotted sunfish were the most restrictive species/life stage. Results varied by month and site and but most broadly between sites. Table 8-8 shows the restriction for each month at each site. The restriction applied is often not the most restrictive species/life stage during each month. Sometimes the second most restrictive was selected, especially when the most restrictive was not strongly supported by other similar values. As with Block 1 we note that neither October nor April are entirely within Block 3. However, they are still considered when averaging across months. As with Block 1, monthly averages were taken across all three sites and then those were averaged resulting in a PHABSIM criteria of 14% flow reduction during Block 2. Table 8-8. Recommended percent flow reductions based on PHABSIM analyses for three sites in the Anclote River for the seven months included in Block 2. Site Oct Nov Dec Jan Feb Mar Apr Abandon 14 14 10 8 14 14 5 Waterfall 24 14 30 28 12 26 22 Elfers 4 10 16 8 10 6 8
0
5
10
15
20
25
30
35
40
Oct Nov Dec Jan Feb Mar Apr
Per
cen
t F
low
Red
uct
ion
Figure 8-8. Summary results for the upper Anclote River PHABSIM site for October through April. Box and Whisker plots represent the median, 25, and 75 percentile and maximum and minimum observation for all flow reduction less than 40%, which resulted in a 15% of available habitat reduction.
D:\Anclote\Report\Final\Anclote_MFL_Final.doc Last Save : 2/22/2010 11:02 AM
_________________________________________________________________________________________________ Proposed Minimum Flows and Levels for Anclote River System Conclusions and Recommendations Page 138 of 207
8.3.3.2 Instream Habitats Bottom substrates, such as bedrock, sand and mud were the dominant instream habitats, based on the linear extent of the habitat along the twelve instream habitat cross sections evaluated upstream of the USGS Anclote River near Elfers gauge (Figure 8-9). This was followed by exposed roots, which appear to more prominent in the middle transects of the study corridor. Snags and wetland trees, though ubiquitous in all the cross sections, were less dominant at most cross section sites, in terms of the extent of linear habitat. Relative elevations of the habitats were consistent among the cross sections (Figures 8-10). Wetland trees were typically situated near the top of the banks with wetland plants and exposed roots occurring at slightly lower elevations. Predictably, snags were found in association with the bottom substrates. The occurrence of exposed roots at relatively high elevations is important because inundation of this habitat results in inundation of habitats located at lower elevations. Maintaining a mosaic of aquatic and wetland habitats provides the greatest potential for stream productivity and ecosystem integrity (Pringle et al. 1988).
12
45
67
810
1315
21Elfers
TREES
WETLAND PLANTS
EXPOSED ROOTS
SNAG
BOTTOM
0
10
20
30
40
50
60
% D
om
ina
nce
Sites
TREES
WETLAND PLANTS
EXPOSED ROOTS
SNAG
BOTTOM
Figure 8-9. Percent dominance of instream habitats based on linear extent of the habitats along twelve cross sections on the Anclote River.
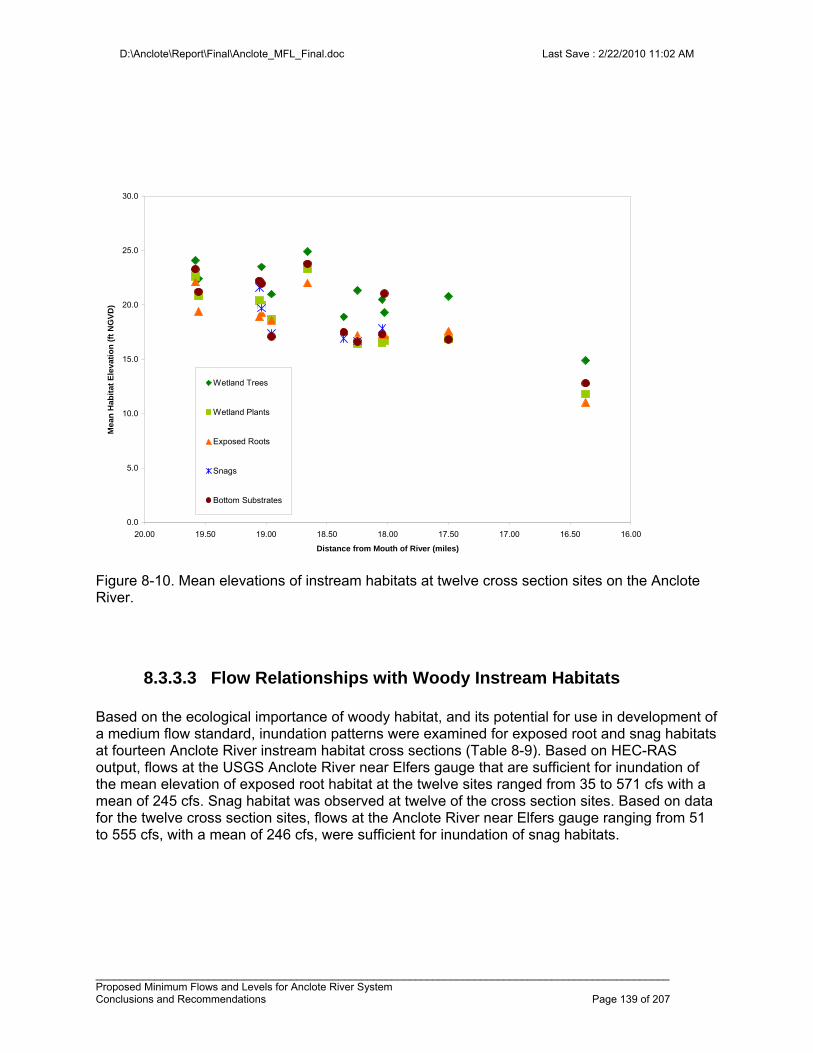
D:\Anclote\Report\Final\Anclote_MFL_Final.doc Last Save : 2/22/2010 11:02 AM
_________________________________________________________________________________________________ Proposed Minimum Flows and Levels for Anclote River System Conclusions and Recommendations Page 139 of 207
0.0
5.0
10.0
15.0
20.0
25.0
30.0
16.0016.5017.0017.5018.0018.5019.0019.5020.00
Distance from Mouth of River (miles)
Mea
n H
abit
at E
leva
tio
n (
ft N
GV
D)
Wetland Trees
Wetland Plants
Exposed Roots
Snags
Bottom Substrates
Figure 8-10. Mean elevations of instream habitats at twelve cross section sites on the Anclote River.
8.3.3.3 Flow Relationships with Woody Instream Habitats Based on the ecological importance of woody habitat, and its potential for use in development of a medium flow standard, inundation patterns were examined for exposed root and snag habitats at fourteen Anclote River instream habitat cross sections (Table 8-9). Based on HEC-RAS output, flows at the USGS Anclote River near Elfers gauge that are sufficient for inundation of the mean elevation of exposed root habitat at the twelve sites ranged from 35 to 571 cfs with a mean of 245 cfs. Snag habitat was observed at twelve of the cross section sites. Based on data for the twelve cross section sites, flows at the Anclote River near Elfers gauge ranging from 51 to 555 cfs, with a mean of 246 cfs, were sufficient for inundation of snag habitats.
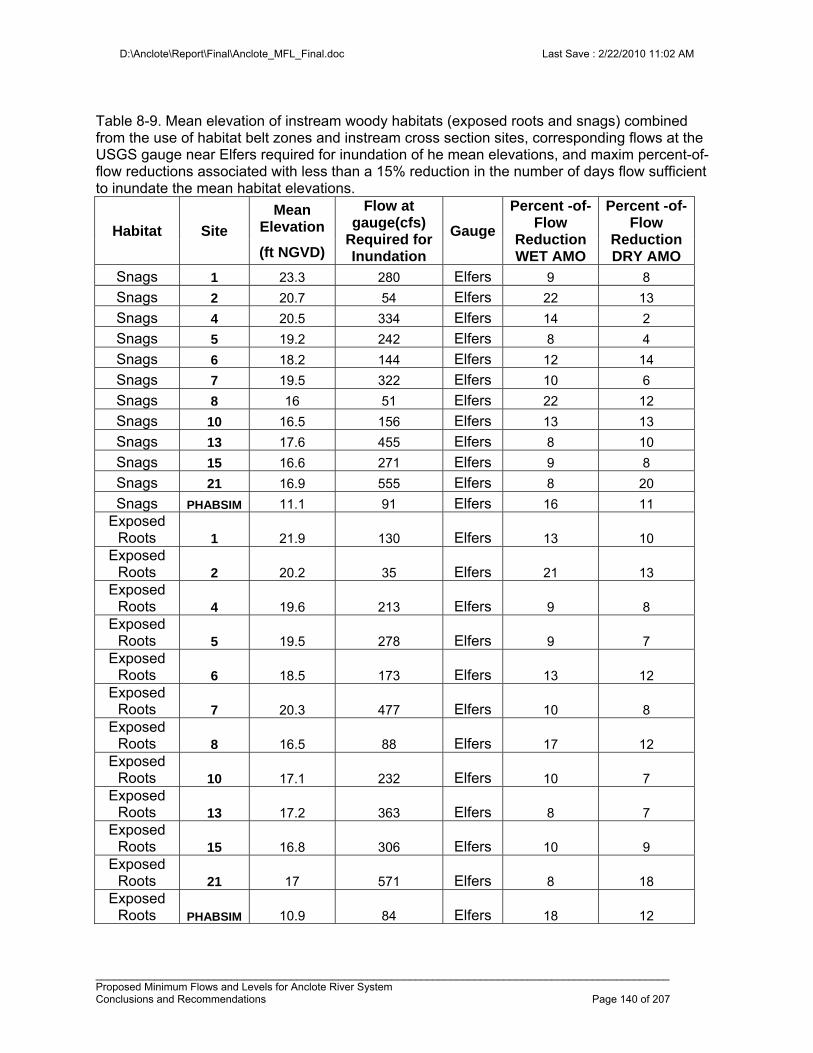
D:\Anclote\Report\Final\Anclote_MFL_Final.doc Last Save : 2/22/2010 11:02 AM
_________________________________________________________________________________________________ Proposed Minimum Flows and Levels for Anclote River System Conclusions and Recommendations Page 140 of 207
Table 8-9. Mean elevation of instream woody habitats (exposed roots and snags) combined from the use of habitat belt zones and instream cross section sites, corresponding flows at the USGS gauge near Elfers required for inundation of he mean elevations, and maxim percent-of-flow reductions associated with less than a 15% reduction in the number of days flow sufficient to inundate the mean habitat elevations.
Habitat Site
Mean Elevation
Flow at gauge(cfs)
Required for Inundation
Gauge
Percent -of- Flow
Reduction WET AMO
Percent -of- Flow
Reduction DRY AMO (ft NGVD)
Snags 1 23.3 280 Elfers 9 8
Snags 2 20.7 54 Elfers 22 13
Snags 4 20.5 334 Elfers 14 2
Snags 5 19.2 242 Elfers 8 4
Snags 6 18.2 144 Elfers 12 14
Snags 7 19.5 322 Elfers 10 6
Snags 8 16 51 Elfers 22 12
Snags 10 16.5 156 Elfers 13 13
Snags 13 17.6 455 Elfers 8 10
Snags 15 16.6 271 Elfers 9 8
Snags 21 16.9 555 Elfers 8 20
Snags PHABSIM 11.1 91 Elfers 16 11 Exposed
Roots 1 21.9 130 Elfers 13 10 Exposed
Roots 2 20.2 35 Elfers 21 13 Exposed
Roots 4 19.6 213 Elfers 9 8 Exposed
Roots 5 19.5 278 Elfers 9 7 Exposed
Roots 6 18.5 173 Elfers 13 12 Exposed
Roots 7 20.3 477 Elfers 10 8 Exposed
Roots 8 16.5 88 Elfers 17 12 Exposed
Roots 10 17.1 232 Elfers 10 7 Exposed
Roots 13 17.2 363 Elfers 8 7 Exposed
Roots 15 16.8 306 Elfers 10 9 Exposed
Roots 21 17 571 Elfers 8 18 Exposed
Roots PHABSIM 10.9 84 Elfers 18 12
D:\Anclote\Report\Final\Anclote_MFL_Final.doc Last Save : 2/22/2010 11:02 AM
_________________________________________________________________________________________________ Proposed Minimum Flows and Levels for Anclote River System Conclusions and Recommendations Page 141 of 207
Based on historic flow records for the USGS Anclote River near Elfers gauge, inundation of exposed roots in the river may not often be expected during Block 2, but is more likely to occur during Block 3 when flows are higher. Percent-of-flow reductions during Block 2 were derived for each site by calculating the flow reduction that would result in no more than a 15% loss of days of inundation of woody habitat during Block 2. Based on these criteria, percent-of-flow reductions of 2 to 22% were identified for woody habitats for mean flows required to inundate woody habitat on the Anclote River for the two benchmark periods. However, it should be recognized that the mean snag habitat elevation requires a flow above the 10% exceedance flow to be inundated. Further, the mean exposed root habitat required flows above the 10% exceedance flow for inundation. In both cases the flows are above the normal median flows that occur during Block 2 and therefore, inundation of woody habitat is primarily a high-flow (Block 3) event in the Anclote River. The result is that some of these numbers are not useful because of the very small number of days that are being reduced by 15%. For example, a flow of 477 cfs only occurred in Block 2 for an annual average of 0.8 days. Therefore, the number of days that a flow is reached is reduced, the incremental step becomes large as the number of days become small. The percentages lose the ability to describe changes at small intervals, as a single day becomes a larger proportion of the total. Therefore, what should be focused upon in Table 8-9 is not the low percentages associated with the high flows but the higher percentages generated by the lower flows.
8.3.3.4 Selection of the Prescribed Flow Reductions for Block 2 Percent-of-flow reductions associated with PHABSIM modeling and long-term inundation analyses of woody habitats were compared for identification of prescribed flow reductions. Prescribed flow reductions were established for the Anclote River near Elfers gauge site based on percent-of-flow reductions derived from PHABSIM analyses. These analyses indicated that up to an 14% reduction in flow would be acceptable, and the analyses of the inundation of woody habitat supported the choice of 14% based on the percent of flow reductions generated for the lower flow requirement which are most appropriate during Block 2.
8.3.3.5 Short-Term Compliance Standards for Block 2 Short-Term Compliance Standards represent a flow prescription that can be utilized for evaluating minimum flows compliance on a short-term basis, for example, based on measured daily flows. For the USGS Anclote River near Elfers gauge site, the following Short-Term Compliance Standards are proposed for Block 2, which for the Anclote River begins on October 15 and ends on April 11 of the subsequent year:
1) The low-flow threshold is 12 cfs. No withdrawal may reduce streamflow below this level.
2) Up to a 14% reduction of all flows is available for consumptive use when flows are below 138 cfs and above 12 cfs – No withdrawal may reduce streamflow below this level.
3) An 8% reduction of all flows is available for consumptive use when flows are equal to or
greater than 138 cfs.
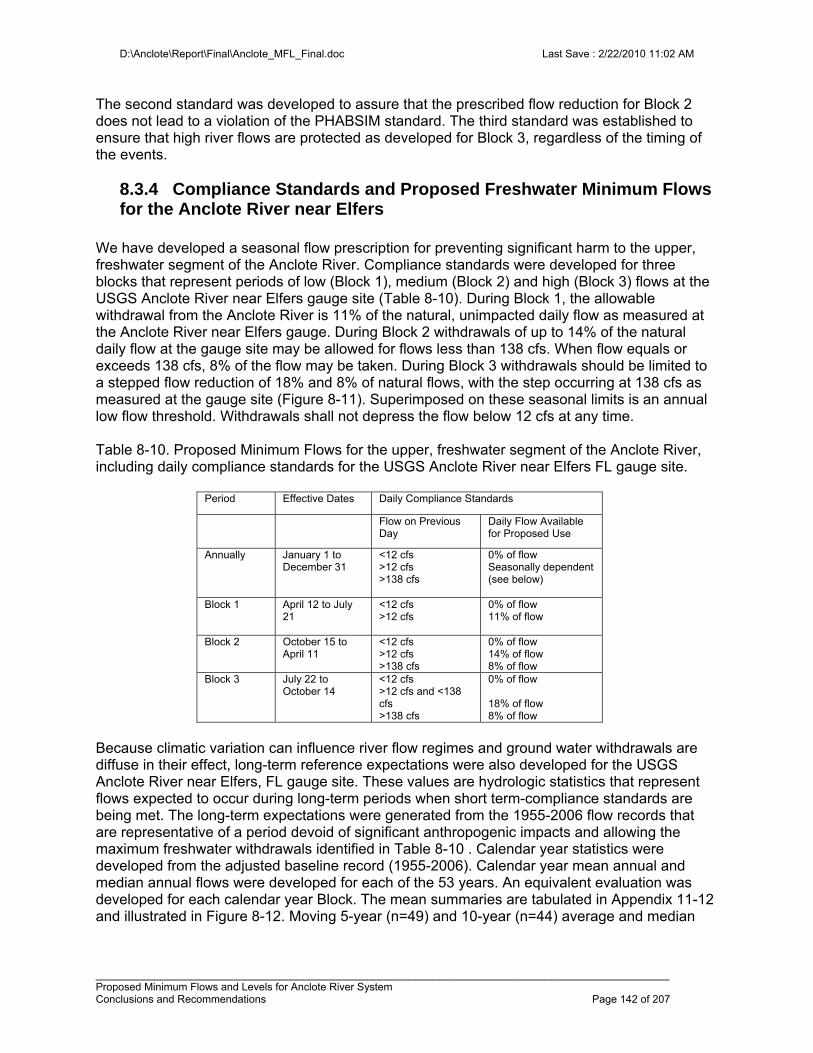
D:\Anclote\Report\Final\Anclote_MFL_Final.doc Last Save : 2/22/2010 11:02 AM
_________________________________________________________________________________________________ Proposed Minimum Flows and Levels for Anclote River System Conclusions and Recommendations Page 142 of 207
The second standard was developed to assure that the prescribed flow reduction for Block 2 does not lead to a violation of the PHABSIM standard. The third standard was established to ensure that high river flows are protected as developed for Block 3, regardless of the timing of the events.
8.3.4 Compliance Standards and Proposed Freshwater Minimum Flows for the Anclote River near Elfers
We have developed a seasonal flow prescription for preventing significant harm to the upper, freshwater segment of the Anclote River. Compliance standards were developed for three blocks that represent periods of low (Block 1), medium (Block 2) and high (Block 3) flows at the USGS Anclote River near Elfers gauge site (Table 8-10). During Block 1, the allowable withdrawal from the Anclote River is 11% of the natural, unimpacted daily flow as measured at the Anclote River near Elfers gauge. During Block 2 withdrawals of up to 14% of the natural daily flow at the gauge site may be allowed for flows less than 138 cfs. When flow equals or exceeds 138 cfs, 8% of the flow may be taken. During Block 3 withdrawals should be limited to a stepped flow reduction of 18% and 8% of natural flows, with the step occurring at 138 cfs as measured at the gauge site (Figure 8-11). Superimposed on these seasonal limits is an annual low flow threshold. Withdrawals shall not depress the flow below 12 cfs at any time. Table 8-10. Proposed Minimum Flows for the upper, freshwater segment of the Anclote River, including daily compliance standards for the USGS Anclote River near Elfers FL gauge site.
Period Effective Dates Daily Compliance Standards
Flow on Previous Day
Daily Flow Available for Proposed Use
Annually January 1 to December 31
<12 cfs >12 cfs >138 cfs
0% of flow Seasonally dependent (see below)
Block 1 April 12 to July 21
<12 cfs >12 cfs
0% of flow 11% of flow
Block 2
October 15 to April 11
<12 cfs >12 cfs >138 cfs
0% of flow 14% of flow 8% of flow
Block 3 July 22 to October 14
<12 cfs >12 cfs and <138 cfs >138 cfs
0% of flow 18% of flow 8% of flow
Because climatic variation can influence river flow regimes and ground water withdrawals are diffuse in their effect, long-term reference expectations were also developed for the USGS Anclote River near Elfers, FL gauge site. These values are hydrologic statistics that represent flows expected to occur during long-term periods when short term-compliance standards are being met. The long-term expectations were generated from the 1955-2006 flow records that are representative of a period devoid of significant anthropogenic impacts and allowing the maximum freshwater withdrawals identified in Table 8-10 . Calendar year statistics were developed from the adjusted baseline record (1955-2006). Calendar year mean annual and median annual flows were developed for each of the 53 years. An equivalent evaluation was developed for each calendar year Block. The mean summaries are tabulated in Appendix 11-12 and illustrated in Figure 8-12. Moving 5-year (n=49) and 10-year (n=44) average and median
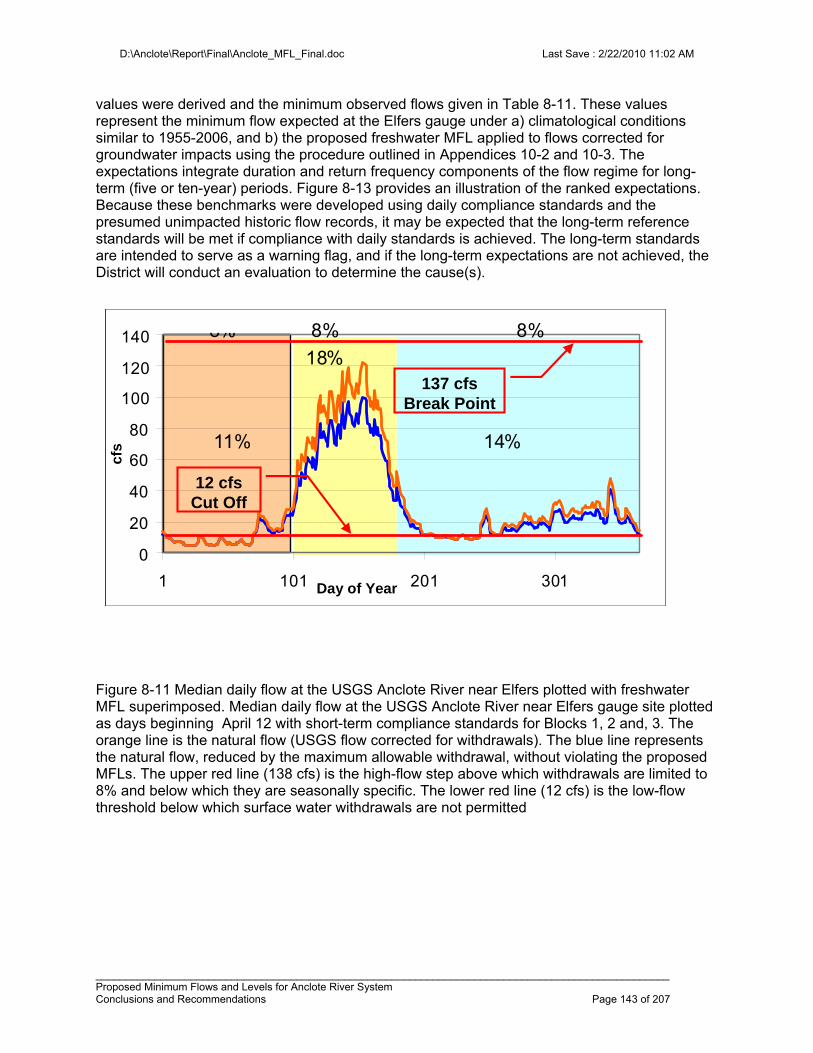
D:\Anclote\Report\Final\Anclote_MFL_Final.doc Last Save : 2/22/2010 11:02 AM
_________________________________________________________________________________________________ Proposed Minimum Flows and Levels for Anclote River System Conclusions and Recommendations Page 143 of 207
values were derived and the minimum observed flows given in Table 8-11. These values represent the minimum flow expected at the Elfers gauge under a) climatological conditions similar to 1955-2006, and b) the proposed freshwater MFL applied to flows corrected for groundwater impacts using the procedure outlined in Appendices 10-2 and 10-3. The expectations integrate duration and return frequency components of the flow regime for long-term (five or ten-year) periods. Figure 8-13 provides an illustration of the ranked expectations. Because these benchmarks were developed using daily compliance standards and the presumed unimpacted historic flow records, it may be expected that the long-term reference standards will be met if compliance with daily standards is achieved. The long-term standards are intended to serve as a warning flag, and if the long-term expectations are not achieved, the District will conduct an evaluation to determine the cause(s).
Figure 8-11 Median daily flow at the USGS Anclote River near Elfers plotted with freshwater MFL superimposed. Median daily flow at the USGS Anclote River near Elfers gauge site plotted as days beginning April 12 with short-term compliance standards for Blocks 1, 2 and, 3. The orange line is the natural flow (USGS flow corrected for withdrawals). The blue line represents the natural flow, reduced by the maximum allowable withdrawal, without violating the proposed MFLs. The upper red line (138 cfs) is the high-flow step above which withdrawals are limited to 8% and below which they are seasonally specific. The lower red line (12 cfs) is the low-flow threshold below which surface water withdrawals are not permitted
0
20
40
60
80
100
120
140
1 101 201 301
11%
8%
14%
8% 8%
18%
0
20
40
60
80
100
120
140
1 101 201 301
0
20
40
60
80
100
120
140
1 101 201 301
11%
8%
14%
8% 8%
18%
12 cfs Cut Off
137 cfs Break Point
Day of Year
cfs
0
20
40
60
80
100
120
140
1 101 201 301
11%
8%
14%
8% 8%
18%
0
20
40
60
80
100
120
140
1 101 201 301
0
20
40
60
80
100
120
140
1 101 201 301
11%
8%
14%
8% 8%
18%
12 cfs Cut Off
137 cfs Break Point
Day of Year
cfs
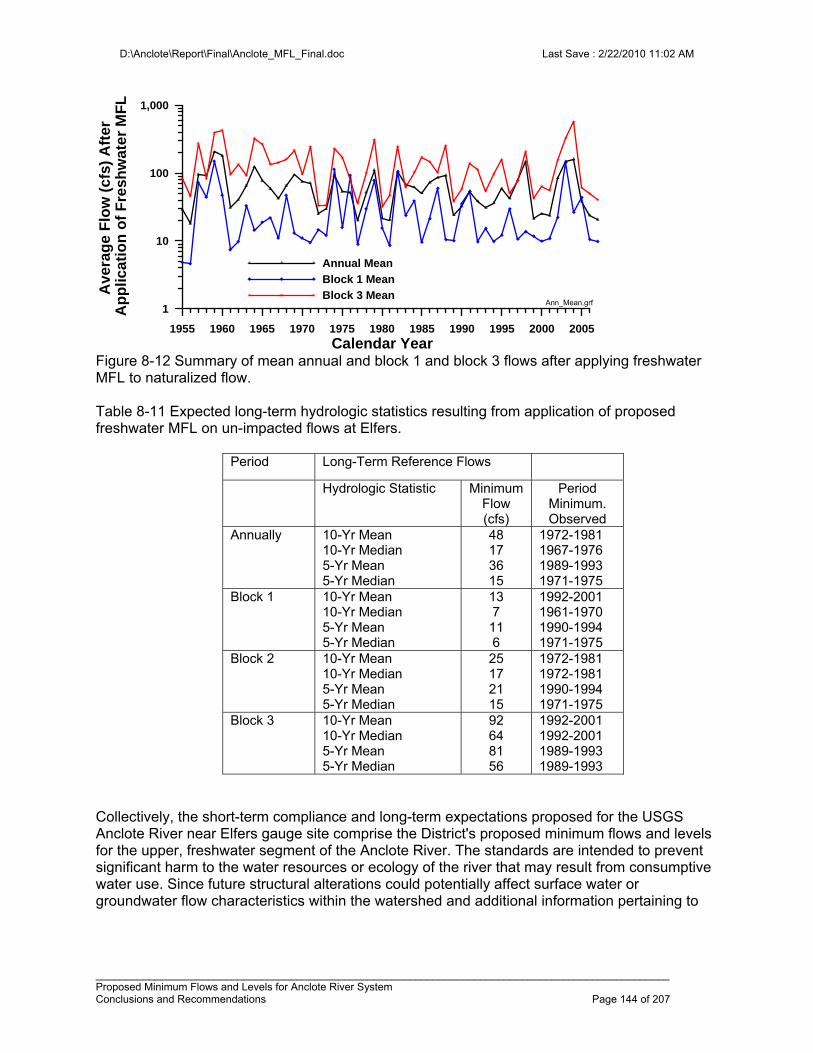
D:\Anclote\Report\Final\Anclote_MFL_Final.doc Last Save : 2/22/2010 11:02 AM
_________________________________________________________________________________________________ Proposed Minimum Flows and Levels for Anclote River System Conclusions and Recommendations Page 144 of 207
1955 1960 1965 1970 1975 1980 1985 1990 1995 2000 2005
Calendar Year
1
10
100
1,000A
vera
ge
Flo
w (
cfs)
Aft
er
Ap
plic
ati
on
of
Fre
shw
ate
r M
FL
Annual Mean
Block 1 Mean
Block 3 MeanAnn_Mean.grf
Figure 8-12 Summary of mean annual and block 1 and block 3 flows after applying freshwater MFL to naturalized flow. Table 8-11 Expected long-term hydrologic statistics resulting from application of proposed freshwater MFL on un-impacted flows at Elfers.
Period Long-Term Reference Flows
Hydrologic Statistic Minimum Flow (cfs)
Period Minimum. Observed
Annually 10-Yr Mean 10-Yr Median 5-Yr Mean 5-Yr Median
48 17 36 15
1972-1981 1967-1976 1989-1993 1971-1975
Block 1 10-Yr Mean 10-Yr Median 5-Yr Mean 5-Yr Median
13 7 11 6
1992-2001 1961-1970 1990-1994 1971-1975
Block 2
10-Yr Mean 10-Yr Median 5-Yr Mean 5-Yr Median
25 17 21 15
1972-1981 1972-1981 1990-1994 1971-1975
Block 3 10-Yr Mean 10-Yr Median 5-Yr Mean 5-Yr Median
92 64 81 56
1992-2001 1992-2001 1989-1993 1989-1993
Collectively, the short-term compliance and long-term expectations proposed for the USGS Anclote River near Elfers gauge site comprise the District's proposed minimum flows and levels for the upper, freshwater segment of the Anclote River. The standards are intended to prevent significant harm to the water resources or ecology of the river that may result from consumptive water use. Since future structural alterations could potentially affect surface water or groundwater flow characteristics within the watershed and additional information pertaining to
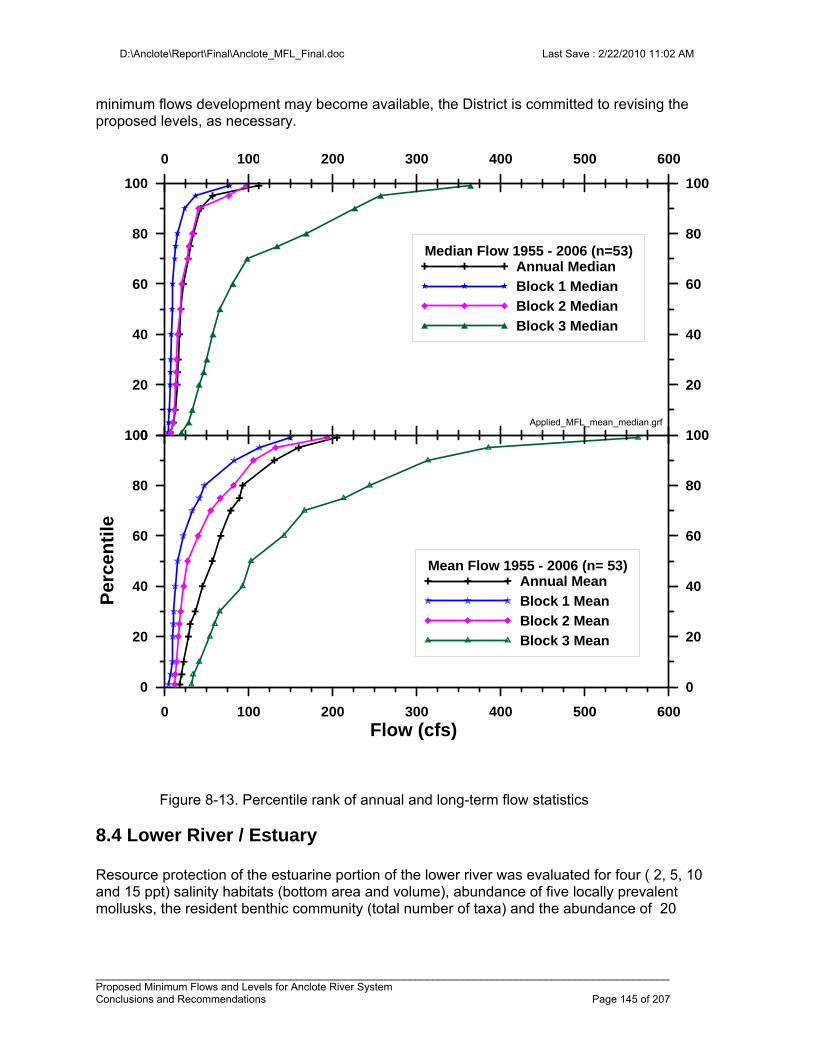
D:\Anclote\Report\Final\Anclote_MFL_Final.doc Last Save : 2/22/2010 11:02 AM
_________________________________________________________________________________________________ Proposed Minimum Flows and Levels for Anclote River System Conclusions and Recommendations Page 145 of 207
minimum flows development may become available, the District is committed to revising the proposed levels, as necessary.
Figure 8-13. Percentile rank of annual and long-term flow statistics
8.4 Lower River / Estuary Resource protection of the estuarine portion of the lower river was evaluated for four ( 2, 5, 10 and 15 ppt) salinity habitats (bottom area and volume), abundance of five locally prevalent mollusks, the resident benthic community (total number of taxa) and the abundance of 20
0 100 200 300 400 500 600
Flow (cfs)
0
20
40
60
80
100
Per
cen
tile
0
20
40
60
80
100
Mean Flow 1955 - 2006 (n= 53)Annual Mean
Block 1 Mean
Block 2 Mean
Block 3 Mean
0
20
40
60
80
100
20
40
60
80
100
0 100 200 300 400 500 600
Median Flow 1955 - 2006 (n=53)Annual Median
Block 1 Median
Block 2 Median
Block 3 Median
Applied_MFL_mean_median.grf
D:\Anclote\Report\Final\Anclote_MFL_Final.doc Last Save : 2/22/2010 11:02 AM
_________________________________________________________________________________________________ Proposed Minimum Flows and Levels for Anclote River System Conclusions and Recommendations Page 146 of 207
pseudo-taxa of fish and invertebrates found in the Anclote River. In addition, the impact of reduced flows on the salinity at endpoints of a significant habitat reach of the river characterized by significant, meandering, braiding and the presence of numerous islands was quantified. These results, expressed as a percentage reduction of median baseline (naturalized) flow are given in Table 8-12 In order to avoid setting the MFL on a single taxa, the results of all mollusk taxa and of all the fish/invertebrates pseudo-taxa were summarized as seasonal medians to represent the class of resource. The response of individual taxa and the median are given in Table 8-12. The minimum allowable reduction in each Block is highlighted. The allowable dry season (Block 1) reduction is 11.5% and the wet season (Block 3) reduction is 18.5%. The allowable reduction in naturalized, baseline flows for the intermediate flow conditions (Block 2) is 15.8%. Figures 8-12 and 8-13 present the individual components for Block 1 and Block 3 respectively.
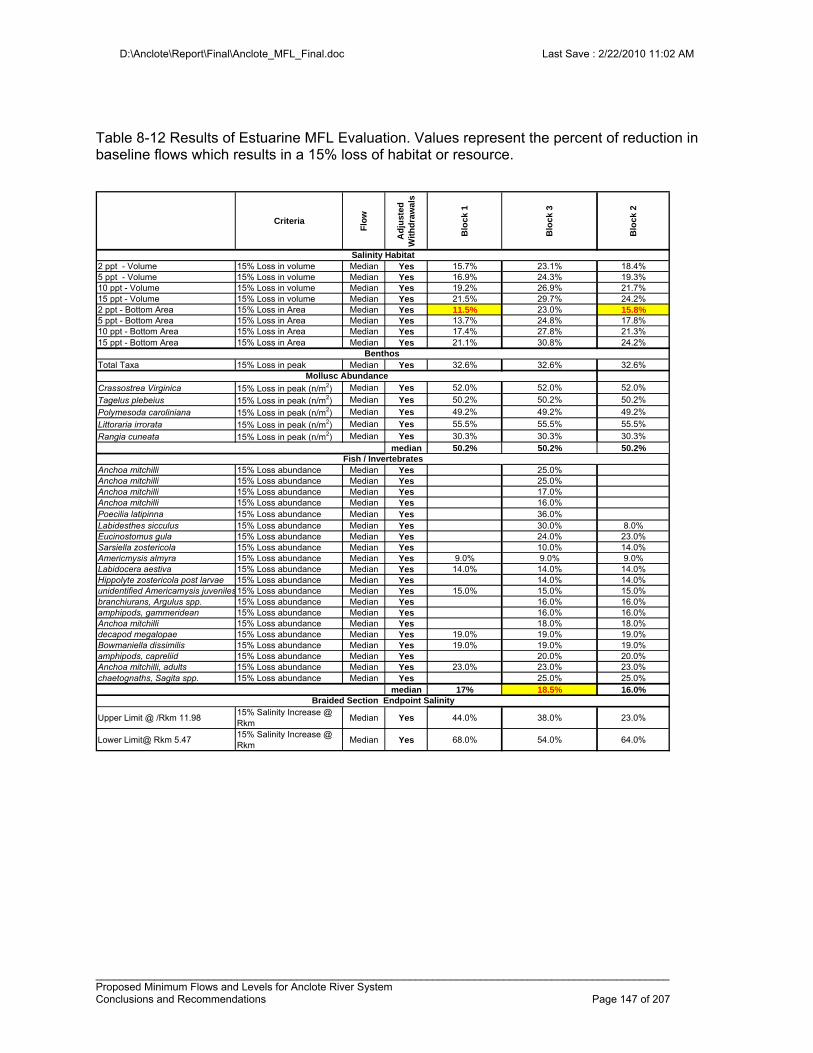
D:\Anclote\Report\Final\Anclote_MFL_Final.doc Last Save : 2/22/2010 11:02 AM
_________________________________________________________________________________________________ Proposed Minimum Flows and Levels for Anclote River System Conclusions and Recommendations Page 147 of 207
Table 8-12 Results of Estuarine MFL Evaluation. Values represent the percent of reduction in baseline flows which results in a 15% loss of habitat or resource.
Criteria
Flo
w
Ad
just
ed
Wit
hd
raw
als
Blo
ck 1
Blo
ck 3
Blo
ck 2
2 ppt - Volume 15% Loss in volume Median Yes 15.7% 23.1% 18.4%5 ppt - Volume 15% Loss in volume Median Yes 16.9% 24.3% 19.3%10 ppt - Volume 15% Loss in volume Median Yes 19.2% 26.9% 21.7%15 ppt - Volume 15% Loss in volume Median Yes 21.5% 29.7% 24.2%2 ppt - Bottom Area 15% Loss in Area Median Yes 11.5% 23.0% 15.8%5 ppt - Bottom Area 15% Loss in Area Median Yes 13.7% 24.8% 17.8%10 ppt - Bottom Area 15% Loss in Area Median Yes 17.4% 27.8% 21.3%15 ppt - Bottom Area 15% Loss in Area Median Yes 21.1% 30.8% 24.2%
Total Taxa 15% Loss in peak Median Yes 32.6% 32.6% 32.6%
Crassostrea Virginica 15% Loss in peak (n/m2) Median Yes 52.0% 52.0% 52.0%
Tagelus plebeius 15% Loss in peak (n/m2) Median Yes 50.2% 50.2% 50.2%
Polymesoda caroliniana 15% Loss in peak (n/m2) Median Yes 49.2% 49.2% 49.2%
Littoraria irrorata 15% Loss in peak (n/m2) Median Yes 55.5% 55.5% 55.5%
Rangia cuneata 15% Loss in peak (n/m2) Median Yes 30.3% 30.3% 30.3%median 50.2% 50.2% 50.2%
Anchoa mitchilli 15% Loss abundance Median Yes 25.0%Anchoa mitchilli 15% Loss abundance Median Yes 25.0%Anchoa mitchilli 15% Loss abundance Median Yes 17.0%Anchoa mitchilli 15% Loss abundance Median Yes 16.0%Poecilia latipinna 15% Loss abundance Median Yes 36.0%Labidesthes sicculus 15% Loss abundance Median Yes 30.0% 8.0%Eucinostomus gula 15% Loss abundance Median Yes 24.0% 23.0%Sarsiella zostericola 15% Loss abundance Median Yes 10.0% 14.0%Americmysis almyra 15% Loss abundance Median Yes 9.0% 9.0% 9.0%Labidocera aestiva 15% Loss abundance Median Yes 14.0% 14.0% 14.0%Hippolyte zostericola post larvae 15% Loss abundance Median Yes 14.0% 14.0%unidentified Americamysis juveniles15% Loss abundance Median Yes 15.0% 15.0% 15.0%branchiurans, Argulus spp. 15% Loss abundance Median Yes 16.0% 16.0%amphipods, gammeridean 15% Loss abundance Median Yes 16.0% 16.0%Anchoa mitchilli 15% Loss abundance Median Yes 18.0% 18.0%decapod megalopae 15% Loss abundance Median Yes 19.0% 19.0% 19.0%Bowmaniella dissimilis 15% Loss abundance Median Yes 19.0% 19.0% 19.0%amphipods, capreliid 15% Loss abundance Median Yes 20.0% 20.0%Anchoa mitchilli, adults 15% Loss abundance Median Yes 23.0% 23.0% 23.0%chaetognaths, Sagita spp. 15% Loss abundance Median Yes 25.0% 25.0%
median 17% 18.5% 16.0%
Upper Limit @ /Rkm 11.9815% Salinity Increase @ Rkm
Median Yes 44.0% 38.0% 23.0%
Lower Limit@ Rkm 5.4715% Salinity Increase @ Rkm
Median Yes 68.0% 54.0% 64.0%
Braided Section Endpoint Salinity
Mollusc Abundance
Benthos
Salinity Habitat
Fish / Invertebrates
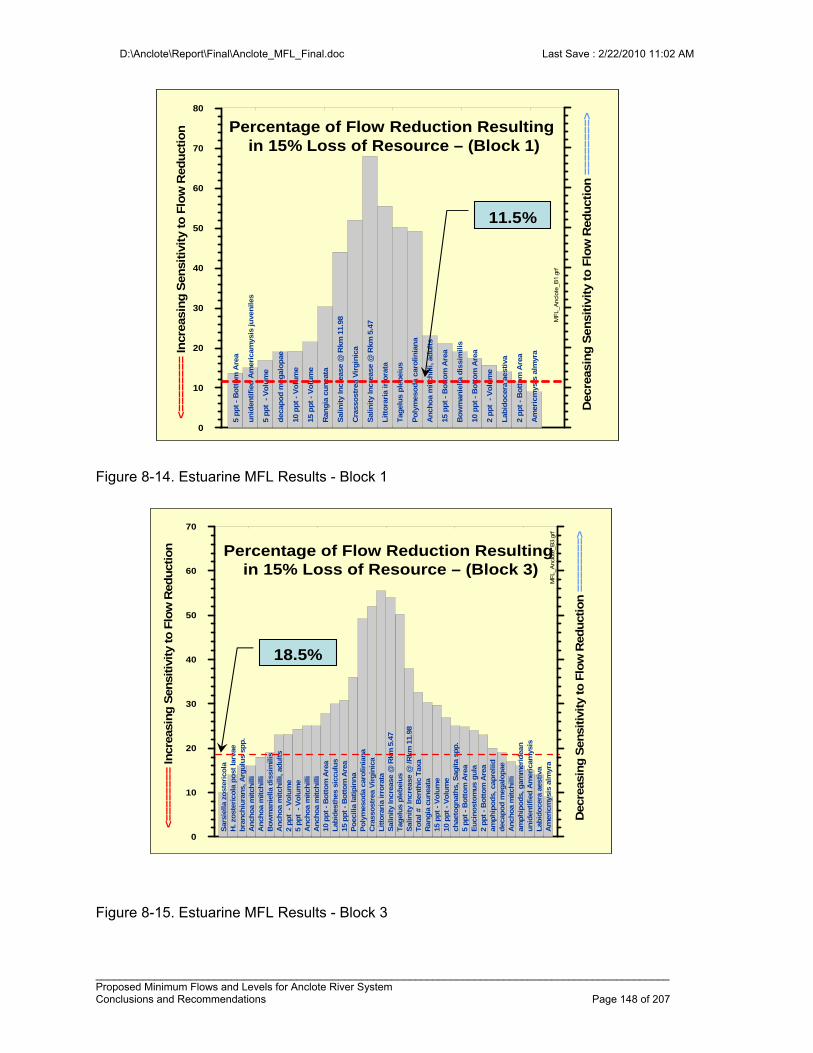
D:\Anclote\Report\Final\Anclote_MFL_Final.doc Last Save : 2/22/2010 11:02 AM
_________________________________________________________________________________________________ Proposed Minimum Flows and Levels for Anclote River System Conclusions and Recommendations Page 148 of 207
Figure 8-14. Estuarine MFL Results - Block 1
Figure 8-15. Estuarine MFL Results - Block 3
0
10
20
30
40
50
60
70
<======== In
crea
sing S
ensi
tivi
ty to F
low
Red
uctio
n
Am
eric
mysi
s al
myr
a
Sar
siel
la z
ost
eric
ola
Lab
ido
cera
aes
tiva
H. z
ost
eric
ola
po
st la
rvae
un
iden
tifi
ed A
meri
cam
ysis
bra
nch
iura
ns,
Arg
ulu
s sp
p.
amp
hip
od
s, g
amm
erid
ean
An
cho
a m
itch
illi
An
cho
a m
itch
illi
An
cho
a m
itch
illi
dec
apo
d m
egal
op
ae
Bo
wm
anie
lla
dis
sim
ilis
amp
hip
od
s, c
apre
liid
An
cho
a m
itch
illi, a
du
lts
2 p
pt
- B
ott
om
Are
a
2 p
pt
- V
olu
me
Eu
cin
ost
om
us g
ula
5 p
pt
- V
olu
me
5 p
pt
- B
ott
om
Are
a
An
cho
a m
itch
illi
chae
tog
nat
hs,
Sag
ita
spp
.
An
cho
a m
itch
illi
10 p
pt
- V
olu
me
10
pp
t -
Bo
tto
m A
rea
15 p
pt
- V
olu
me
Lab
ides
thes
sic
culu
s
Ran
gia
cu
nea
ta
15
pp
t -
Bo
tto
m A
rea
To
tal #
Ben
thic
Tax
a
Po
ecili
a la
tip
inn
a
Sal
init
y In
cre
ase
@ /R
km 1
1.98
Po
lym
eso
da
caro
linia
na
Tag
elu
s p
leb
eiu
s
Cra
sso
stre
a V
irg
inic
a
Sal
init
y In
cre
ase
@ R
km 5
.47
Lit
tora
ria
irro
rata
D
ecre
asin
g S
ensi
tivity
to F
low
Red
uct
ion
========>
MFL_A
nclo
te_B
3.gr
fPercentage of Flow Reduction Resulting
in 15% Loss of Resource – (Block 3)
18.5%
0
10
20
30
40
50
60
70
80
<======== In
creas
ing
Sen
siti
vity
to
Flo
w R
ed
uct
ion
5 p
pt
- B
ott
om
Are
a
un
iden
tifi
ed A
mer
icam
ysis
juve
niles
5 p
pt
- V
olu
me
dec
apo
d m
eg
alo
pae
10 p
pt
- V
olu
me
15 p
pt
- V
olu
me
Ran
gia
cu
neat
a
Salin
ity In
cre
ase
@ R
km 1
1.9
8
Cra
sso
stre
a V
irg
inic
a
Salin
ity In
cre
ase
@ R
km 5
.47
Lit
tora
ria irr
ora
ta
Tag
elu
s p
leb
eiu
s
Po
lym
eso
da
car
olin
ian
a
An
ch
oa m
itch
illi, a
dult
s
15 p
pt
- B
ott
om
Are
a
Bo
wm
anie
lla d
issi
milis
10 p
pt
- B
ott
om
Are
a
2 p
pt
- V
olu
me
Lab
ido
cera
aest
iva
2 p
pt
- B
ott
om
Are
a
Am
eric
mys
is a
lmyr
a
D
ecre
asin
g S
en
sit
ivit
y to
Flo
w R
edu
cti
on
========>
MF
L_A
nclo
te_B
1.g
rf
Percentage of Flow Reduction Resultingin 15% Loss of Resource – (Block 1)
11.5%
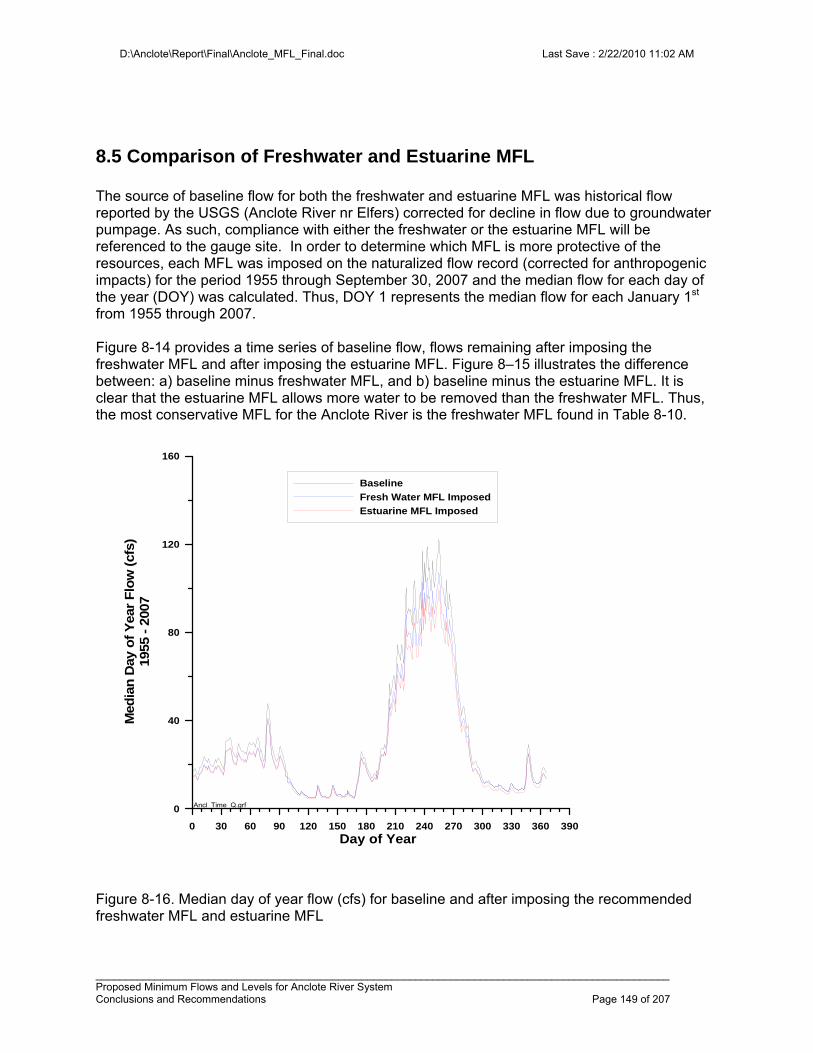
D:\Anclote\Report\Final\Anclote_MFL_Final.doc Last Save : 2/22/2010 11:02 AM
_________________________________________________________________________________________________ Proposed Minimum Flows and Levels for Anclote River System Conclusions and Recommendations Page 149 of 207
8.5 Comparison of Freshwater and Estuarine MFL The source of baseline flow for both the freshwater and estuarine MFL was historical flow reported by the USGS (Anclote River nr Elfers) corrected for decline in flow due to groundwater pumpage. As such, compliance with either the freshwater or the estuarine MFL will be referenced to the gauge site. In order to determine which MFL is more protective of the resources, each MFL was imposed on the naturalized flow record (corrected for anthropogenic impacts) for the period 1955 through September 30, 2007 and the median flow for each day of the year (DOY) was calculated. Thus, DOY 1 represents the median flow for each January 1st from 1955 through 2007. Figure 8-14 provides a time series of baseline flow, flows remaining after imposing the freshwater MFL and after imposing the estuarine MFL. Figure 8–15 illustrates the difference between: a) baseline minus freshwater MFL, and b) baseline minus the estuarine MFL. It is clear that the estuarine MFL allows more water to be removed than the freshwater MFL. Thus, the most conservative MFL for the Anclote River is the freshwater MFL found in Table 8-10.
Figure 8-16. Median day of year flow (cfs) for baseline and after imposing the recommended freshwater MFL and estuarine MFL
0 30 60 90 120 150 180 210 240 270 300 330 360 390
Day of Year
0
40
80
120
160
Med
ian
Day
of
Year
Flo
w (
cfs)
1955
- 2
007
Baseline
Fresh Water MFL Imposed
Estuarine MFL Imposed
Ancl_Time_Q.grf
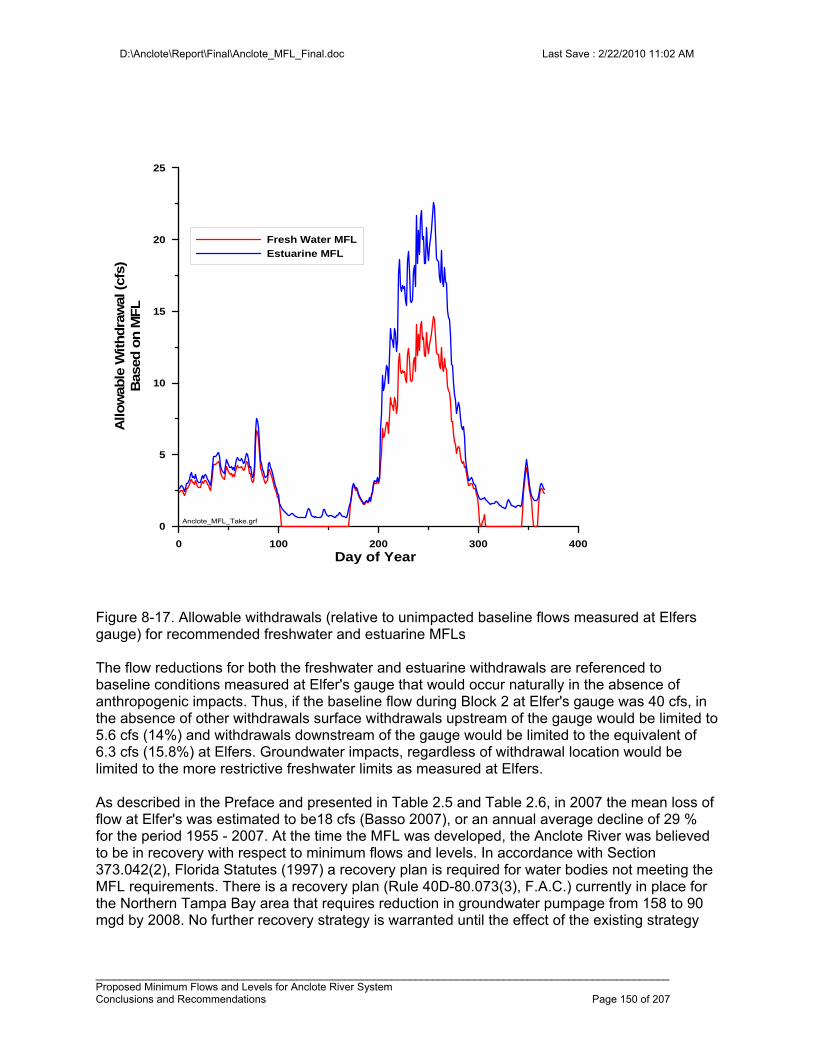
D:\Anclote\Report\Final\Anclote_MFL_Final.doc Last Save : 2/22/2010 11:02 AM
_________________________________________________________________________________________________ Proposed Minimum Flows and Levels for Anclote River System Conclusions and Recommendations Page 150 of 207
Figure 8-17. Allowable withdrawals (relative to unimpacted baseline flows measured at Elfers gauge) for recommended freshwater and estuarine MFLs The flow reductions for both the freshwater and estuarine withdrawals are referenced to baseline conditions measured at Elfer's gauge that would occur naturally in the absence of anthropogenic impacts. Thus, if the baseline flow during Block 2 at Elfer's gauge was 40 cfs, in the absence of other withdrawals surface withdrawals upstream of the gauge would be limited to 5.6 cfs (14%) and withdrawals downstream of the gauge would be limited to the equivalent of 6.3 cfs (15.8%) at Elfers. Groundwater impacts, regardless of withdrawal location would be limited to the more restrictive freshwater limits as measured at Elfers. As described in the Preface and presented in Table 2.5 and Table 2.6, in 2007 the mean loss of flow at Elfer's was estimated to be18 cfs (Basso 2007), or an annual average decline of 29 % for the period 1955 - 2007. At the time the MFL was developed, the Anclote River was believed to be in recovery with respect to minimum flows and levels. In accordance with Section 373.042(2), Florida Statutes (1997) a recovery plan is required for water bodies not meeting the MFL requirements. There is a recovery plan (Rule 40D-80.073(3), F.A.C.) currently in place for the Northern Tampa Bay area that requires reduction in groundwater pumpage from 158 to 90 mgd by 2008. No further recovery strategy is warranted until the effect of the existing strategy
0 100 200 300 400
Day of Year
0
5
10
15
20
25
Allow
able
Withdra
wal
(cf
s)
Bas
ed o
n M
FL
Fresh Water MFL
Estuarine MFL
Anclote_MFL_Take.grf

D:\Anclote\Report\Final\Anclote_MFL_Final.doc Last Save : 2/22/2010 11:02 AM
_________________________________________________________________________________________________ Proposed Minimum Flows and Levels for Anclote River System Conclusions and Recommendations Page 151 of 207
can be fully evaluated. For example, evaluation of recent data by Basso (2009) indicates that the Anclote River would no longer be in recovery, if the 2008 pumpage and well rotation schedule can be maintained in the future.
D:\Anclote\Report\Final\Anclote_MFL_Final.doc Last Save : 2/22/2010 11:02 AM
_________________________________________________________________________________________________ Proposed Minimum Flows and Levels for Anclote River System Literature Cited Page 152 of 207
CHAPTER 9 - LITERATURE CITED Literature Cited Aho, J..M. and J.W.Terrell. 1986. Habitat suitability index models and instream flow suitability curves. Redbreast sunfish. U.S. Fish and Wildlife Service Biological Report. 82(10.119) Ainsle, W.B., B.A. Pruitt, R.D. Smith, T.H. Roberts, E.J. Sparks and M. Miller. 1999. A regional guidebook for assessing the functions of low gradient riverine wetlands in western Kentucky. U.S. Army Corps of Engineers Waterways Experiment Station. Technical Report WRP-DE-17. Vicksburg, MS. Anderson, J., E. Hardy, J. Roach and R. Witmer. 1976. A land use and land cover classification system for use with remote sensor data. Geological Survey Professional Paper 964. United States Government Printing Office, Washington, D.C Annear, T.C. and A.L. Condor. 1984. Relative bias of several fisheries instream flow methods. North American Journal of Fisheries Management. 4:531-539. ATSDR (Agency for Toxic Substances & Disease Registry, Center for Disease Control / Dept of Health and Human Services), undated. http://www.atsdr.cdc.gov/hac/PHA/staufpha/sta_p1.html Accessed 1/15/2009. Basso, R., 2007. Predicted groundwater withdrawal impacts to the Anclote River based on numerical model results. Draft Technical Memorandum to Dr. Marty. Kelly September 10, 2007 Southwest Florida Water Management District, 16 p. Basso, R., 2009. Predicted groundwater withdrawal impacts to the Anclote River based on numerical model results. Final Technical Memorandum to Dr. Marty Kelly June 9, 2009 Southwest Florida Water Management District, 16 p (See Appendix 10-2) Beecher, H. 1990 Standards for Instream Flows. Rivers 1(2); 97-09 Benke, A.C. and J.B. Wallace. 1990. Wood dynamics in coastal plain blackwater streams. Canadian Journal of Fisheries and Aquatic Sciences 47: 92-99. Benke, A.C., R.L.Hentry III, D.M. Gillespie and R.J. Hunter. 1985. Importance of the snag habitat for animal production in a Southeastern stream. Fisheries 10:8-13 Benke, A.C., T.C. Van Arsdall, Jr., D.M. Gillespie and F.K. Parrish. 1984. Invertebrate productivity in a subtropical blackwater river: the importance of habitat and life history. Ecological Monographs 54:25-63.
D:\Anclote\Report\Final\Anclote_MFL_Final.doc 2/22/2010 11:02 AM
_____________________________________________________________________________________________ Proposed Minimum Flows and Levels for Anclote River System Appendices Page 153 of 207
Bovee, K.D., B.L. Lamb, J.M. Barholow, C.B. Stalnaker, J. Taylor and J. Hendrickson. 1998. Sream habitat analysis using the instream flow incremental methodology. U.S. Geological Survey, Biological Resources Division Information and Technology Report USGS./BRD-998-0004. Brinson, M.M., B.L. Swift, R.C. Plantico and J.S. Barclay. 1981. Riparian ecosystems: their ecology and status. U.S. Fish and Wildlife Service, Biological Services Program Report FWS/OBS-81-17. Washington, D.C. Brown, M.T., J.M. Schaefer and K.H. Brandt. 1990. Buffer zones for water, wetlands and wildlife in East Central Florida. CFW Publication #89-07. Florida Agricultural Experimental Stations Journal Series No. T-00061. East Central Florida Regional Planning Council. Brussock, P.P., A.V. Brown and J.C. Dixon. 1985. Channel form and stream ecosystem models. Water Resources Bulletin 21: 859 – 866. Bunn, S.E and A.H. Arthinton. 2002. Basic principles and ecologic consequences of altered flow regimes for aquatic biodiversity. Environmental Management. 30: 492-507. Cherry, R. N., J.W. Stewart and J.A. Mann. 1970 General Hydrology of the Middle Gulf Area. Florida Department of Natural Resources, Bureau of Geology. Report of Investigation No. 56. Tallahassee, Fl. Cited in Coble, 1973 Coble, R,.W. 1973. The Anclote and Pithlachascotee Rivers as Water-Supply Sources. Map Series No. 61. Prepared by United States Geological Survey in cooperation with Southwest Florida Water Management District and Bureau of Geology Florida Department of Natural Resources. Conner, W.H. and J.W.Day. 1979. Productivity and composition of a bald cypress-water tupelo site and a bottomland hardwood site in a Louisiana swamp. American Journal of Botany 63: 1354-1364. Cottam, G. and J.T. Curtis. 1956. The use of distance measures in phytosociological sampling. Ecology 37(3): 451-460. Cox, R. A., F. Culkin, and J.P. Riley. 1967, The Electrical Conductivity / Chlorinity Relationship in Natural Seawater, Deep Sea Research, V. 15, p. 203-220. Crance, J.H. 1988. Relationships between palustrine foreste wetlands of forested riparian floodplains and fishery resources: a review. Biological Report 88(32). U.S. Fish and Wildlife Service. Washington, D.C. Cudney, M.D. and J.D. Wallace. 1980. Life cycles, microdistribution and production dynamics of six net-spinning caddisflies in a large southeastern (USA) river. Holartic Ecology 3: 69-182.
D:\Anclote\Report\Final\Anclote_MFL_Final.doc 2/22/2010 11:02 AM
_____________________________________________________________________________________________ Proposed Minimum Flows and Levels for Anclote River System Appendices Page 154 of 207
Dunbar, M.J., A.Gustard, M.C. Acreman and C.R. Elliot. 1998 Overseas approaches to setting river flow objectives. Institute of Hydrology. R&D Technical Report W6-161. Oxon, England. 83 pp. Edwards, R.T. and J.L. Meyer. 1987. Metabolism of a sub-tropical low gradient blackwater river. Freshwater Biology 7: 251-263. Estevez, E.D and B.D. Robbins, B.D., 2006, Anclote River Mollusk and Vegetation Survey, Contract 05PC0001646 report prepared for Southwest Florida Water Management District, 62 p. FDEP 2005. Ecosummary for the Anclote River – headwaters in Starky Wilderness Park. Published by the Florida Department of Environmental Protection. Tallahassee, Fl. May 11, 2005. (http://water.dep.state.fl.us/eswizard/ecosummary.asp?id=750. Fernandez, M., Jr., 1990, Surface-Water Hydrology and Salinity of the Anclote River Estuary, Florida, USGS Water-Resources Investigations Report 89-4046, 34 p. Flannery, M.S., E.B. Peebles and R.T. Montgomery. 2002. A Percent-of-Flow approach to managing reductions in freshwater inflows from unimpounded rivers to Southwest Florida estuaries. Estuaries 25(68); 1318-1332 Florida Department of Transportation. (FDOT) 1999. Florida land use, cover and forms classification. Handbook. 3rd Edition. Florida Department of Transportation, Survey and Mapping Office. Geographic Mapping Section. FPC (Florida Power Corporation), 1977. Post-Operational Ecological Monitoring Program, 1976. Anclote Unit 1, Final Report. Volume IV Section 6: Benthos, Parts 1, 2 and 3. Cited in VHB 2002. FPC (Florida Power Corporation), 1983. Anclote Units 1 and 2 Monitoring Program, Final Report. In Response to NPDES Permit No. FL0002922 Cited in VHB 2002. FPC (Florida Power Corporation), 1992. Plan of Study for Biological Monitoring, Permit Condition III.E. In response to NPDES Permit No. FL 0002992. Cited in VHB 2002. Friedemann, M. and J. Hand. 1989. Typical Water Quality Values for Florida's Lakes, Streams, and Estuaries. Standards and Monitoring Section. Bureau of Surface Water Management. 13pp. Geraghty & Miller, Inc., 1976, Management of the Water Resources of the Pinellas-Anclote and Northwest Hillsborough Basins West-Central Florida, contract report prepared for Southwest Florida Water Management District Pinellas-Anclote Basin Board & Northwest Hillsborough Basin Board. Gore, J.A., J.B. Layzer and J. Mead. 2001. Macroinvertebrate instream flow studies after 20 years: a role in stream and river restoration. Regulated Rivers 17:527-542.
D:\Anclote\Report\Final\Anclote_MFL_Final.doc 2/22/2010 11:02 AM
_____________________________________________________________________________________________ Proposed Minimum Flows and Levels for Anclote River System Appendices Page 155 of 207
Gore, J. A., C. Dahm, and C. Klimas, 2002, A review of "Upper Peace River: An analysis of minimum flows and levels". Peer review report prepared for the Southwest Florida Water Management District. Brooksville, Florida. Grabe, S.A. and A. Janicki, 2007, Analysis of Benthic Community Structure and Its Relationship to Freshwater Inflows in the Anclote River, Contract 05PC0001660 report prepared for Southwest Florida Water Management District. Greenwood, M.F.D., E.B. Peebles, T.C. MacDonald, S.E. Burghart, R.E. Matheson, Jr. and R.H. McMichael, Jr. 2006 Freshwater Inflow Effects on Fishes and Invertebrates in the Anclote River Estuary, Contract 04CON000137 report prepared for Southwest Florida Water Management District by Florida Fish and Wildlife Conservation Commission and University of South Florida. Gregory, S.V., F.J. Swanson, W.A. McKee and K.W. Cummins. 1991. An ecosystem perspective on riparian zones. Bioscience 41: 540-551. Healy, H.G. 1975 Terraces and shorelines of Florida. Florida Bureau of Geology. Heyl, M.G. 2008.Weeki Wachee River Recommended Minimum Flows and Levels. Final Report / Ecologic Evaluation Section. Southwest Florida Water Management District. 123 pp + appendices. Hill, J.E.and C.E.Cichra. 2002. Minimum flows and levels criteria development. Evaluation of the importance of water depth and frequency of water levels / flows on fish population dynamics, literature review and summary: the effects of water levels on fish populations. Institute of Agricultural Sciences, Department of Fisheries and Aquatic Sciences. University of Florida. Gainesville, Fl. 40 pp. Hill, M.T., W.S. Platts, and R.L. Beschta. 1991. Ecological and geological concepts for instream and out-of-channel flow requirements. Rivers 2(3): 198-210. Hook, D.D. and C.L.Brown. 1973. Root adaptions and relative flood tolerance of five hardwood species. Forest Science 19(3): 225-229. HSW Engineering (HSW), 2007, Anclote River Salinity Regressions, Contract 05PC0001645-1 report prepared for Southwest Florida Water Management District. Huryn, A.D. and J.B. Wallace. 1987. Local geomorphology as a determinant of macrofaunal production in a mountain stream. Ecology 68: 1932-1942. Instream Flow Council, 2002. Instream Flows for Riverine Resource Stewardship. Instream Flow Council. 411 pp. Instream Flow Council. 2009. Integrated Approaches to Riverine Resource Stewardship. Case Studies, Science, Law, People and Policy. http://www.instreamflowcouncil.org/ifcbook3.htm
D:\Anclote\Report\Final\Anclote_MFL_Final.doc 2/22/2010 11:02 AM
_____________________________________________________________________________________________ Proposed Minimum Flows and Levels for Anclote River System Appendices Page 156 of 207
Janicki Environmental, Inc. 2003. Tampa Bay Water Gulf Coast Desalination Environmental Assessment – a) An Ecological Characterization of Aquatic and Wetland Habitats in the Anclote River Estuary and Adjacent Inshore and Offshore Waters of West-Central Florida. b) Salinity Tolerances for the Major Biotic Components within the Anclote River and Anchorage and Nearby Coastal Waters. c) A Hydrodynamic Model of the Nearshore and Offshore Waters Adjacent to he Proposed Tampa Bay Water Gulf Coast Desalination Facility. Prepared for Tampa Bay Water. October 2003. Johnson, D.H. 1980. The comparison of usage and availability measurements for evaluating resource preference. Ecology 69:125-134. Jones, G.W., K.F. Scott, K.F.and M.D.Barcelo. 2006. Regional Water Supply Plan, Southwest Florida Water Management District. Junk, W.P., P.B. Bayley and R.E. Sparks. 1989. The flood pulse concept in river-floodplain systems. Pp 110-127 in D.P. Dodge (ed.), Proceedings of the International Large River Symposium. Special Publication of the Canadian Journal of Fisheries and Aquatic Sciences 106. Kelly, M.H., A.B. Munson, J. Morales and D.A. Leeper. 2005a Proposed minimum flows for the middle segment of the Peace River, from Zolfo Springs to Arcadia. Ecologic Evaluation Section. Southwest Florida Water Management District. Brooksville, Fl. 157 pp + appendix . Kelly, M.H., A.B. Munson, J. Morales and D.A. Leeper. 2005a Proposed minimum flows for the upper segment of the Myakka River, from Myakka City to SR 72. Evaluation Section. Southwest Florida Water Management District. Brooksville, Fl. 143 pp + appendix. Kelly, M.H., A.B. Munson, J. Morales and D.A. Leeper. 2005b Alafia River minimum flows and levels; freshwater segment including Lithia and Buckhorn Springs. Ecologic Evaluation Section. Southwest Florida Water Management District. Brooksville, Fl. 180 pp + appendix. Kuensler, E.J. 1989. Values of forested wetlands as filters for sediments and nutrients. Pp. 85-96 In D.D. Hook and R. Lea (eds.), Proceedings of the Symposium: the forested wetlands of the United States. USDA Forest Service, Southeastern Forest Experimental Station, General Technical Report SE-50. Lewelling, B.R. 2004. Extent of areal inundation of riverine wetlands along five river systems in the upper Hillsborough River watershed, west-central Florida. U.S. Geological Survey Water Resources Investigations Report 2004-533. 76 pp. Manly, B.F.J., L.L. McDonald and D.L. Thomas.1993. Resource selection by animals: statistical design and analysis for field studies. Chapman and Hall, London. McKevelin, M.R., D.D. Hook and A.A. Rozelle.1998. Adaptations of plants to flooding and soil waterlogging. Pp 73-204. In Messina, M.G. and W.H. Conners (eds.) Southern Forested Wetlands: Ecology and Management. Lewis Publishers.
D:\Anclote\Report\Final\Anclote_MFL_Final.doc 2/22/2010 11:02 AM
_____________________________________________________________________________________________ Proposed Minimum Flows and Levels for Anclote River System Appendices Page 157 of 207
Mertes, L.A.K. 1997. Documenation and significance of the perirheic zone on inundated floodplains. Water Resources Research 33(7): 749-1762. Millhouse, R.T., J.M. Bartholow, M.A. Updike and A.R. Moos. 1990. Reference manual for generation and analysis of habitat time series – Version II. U.S. Fish and Wildlife Service, Biological Report 90 (16) MML (Mote Marine Laboratory), 1991 Anclote Power Plant Monitoring Studies, Final Report. Cited in VHB 2002. Montagna, Paul, 2006, A Multivariate Statistical Analysis of Relationships Between Freshwater Inflows and Mollusk Distributions in Tidal Rivers in Southwest Florida, contract report prepared by Harte Research Institute for Gulf of Mexico Studies, Texas A&M University for Southwest Florida Water Management District. Munson. A.B. and J.J.Delfino. 2007. Minimum wet-season flows and levels in Southwest Florida Rivers. Journal of the American Water Resources Association 43:(2). PB Water (A Division of Parsons Brinckerhoff Quade & Douglas, Inc.) 2001. Tampa Bay Water Gulf Coast Desalination, Final Feasibility Study Report. Prepared for Tampa Bay Water. PBS&J. 2007. Characterization of woody wetland vegetation communities along the Anclote River. Prepared by PBSJ Tampa, Florida for the Southwest Florida Water Management District. PBSJ, 1999. Impact Analysis of the Anclote Desalination Water Supply Project – Final Report. Prepared for Tampa Bay Water. March, 1999. Postel, S. and B.Richter. 2003. Rivers for life: Managing water for people and nature. Island Press. Washington, D.C. pp. 253 Powell, G.L, J. Matsumoto and D.A. Brock. 2002. Methods for determining minimum freshwater inflow needs of Texas bays and estuaries. Estuaries 25: 1262-1274 Pringle, C.M., R. Naimain, G. Bretchko, J. Karr, M. Oswood, J. Webster, R. Welcomme and M.J. Winterbourn.1988. Patch dynamics in lotic ecosystems: the stream as a mosaic. Journal of the American Benthological Society 7: 503-524. Reiser, D.W., T.A. Wesche and C. Estes. 1989. Status of instream flow legislation and practices in North America. Fisheries 14(2): 22-29. Richter, B.D., J.V. Baumgartner, J. Powell, and D.P. Braun.1996. A Method for assessing hydrologic alteration within ecosystems. Conservation Biology 10(4); 1163-1174. Rosenau, J. C. et al. 1977 Springs of Florida. United States Geological Survey Bulletin No. 31. Tallahassee, Florida. Rosenau, J.C., G.L. Faulkner, C.W. Hendry, Jr and R.H. Hull. 1977. Springs of Florida: Florida Geological Survey Bulletin 31, Revised. 461 p.
D:\Anclote\Report\Final\Anclote_MFL_Final.doc 2/22/2010 11:02 AM
_____________________________________________________________________________________________ Proposed Minimum Flows and Levels for Anclote River System Appendices Page 158 of 207
Scheele, D.S. 1975. Reality construction as a product of Delphi interaction. Pp 37-41 In Linstone, H.A. and M. Turoff (eds.). The Dephi method: techniques and application. Addison-Wesley, Reading, MA. Seerley, Dana W., J.E. Kundell, M. Myszewski. 2006. Balancing Instream and Offstream Uses: Instream Flows, Surface Storage and Aquifer Management. A Report to the Georgia Environmental Protection Division. Prepared by Carl Vinson Institute of Government. University of Georgia. Athens, Ga. In Mulvaney, T.M. and A.J. Park. Opportunities for Protecting Instream Flows in Mississippi. NOAA award number NA06OAR4170078 Shaw, D.T., C.N. Dahm and S.W. Golladay. 2005 .A review of "Proposed minimum flows and levels for the middle segment of the Peace River, from Zolfo Springs to Arcadia". Sourhwest Florida Water Management District, Brooksville, Fl. 23pp. Smock, L.A. and C.E. Roeding. 1986. The trophic basis of production of the macroinvertebrate community of a sourheastern U.S.A. blackwater sream. Holartic Ecology 9: 165-74. Smock, L.A., E. Gilinsky and D.L. Stoneburner. 1985. Macroinvertebrate production in a sourheastern U.S. blackwater stream. Ecology 66: 149-1503. Southwest Florida Water Management District. 2002a. Upper Peace River: an analysis of minimum flows and levels. Draft. Ecologic Evaluation Section. Resource Conservation and Development Department. Brooksville, Florida. Southwest Florida Water Management District. 2002b. Tampa Bay/Anclote River: Comprehensive Watershed Management Plan. Tampa Bay/Anclote River Comprehensive Watershed Management Team. Brooksville, Florida. Stalknaker, C.B., .L. Lamb, J. Henriksen, K. Bovee and J. Bartholow. 1995. The Instream Flow Incremental Methodology: a primer fro IFIM. Bological Report 29. U.S. Department of the Interior. National Biological Service. Washington, D.C. 46 pp. Stalnaker, C.B. 1990 Minimum flow is a myth. Pp 3-33 in M.B. Bain (ed.), Ecology and assessment of warmwater streams: workshop synopsis. Biological Report 90(5). U.S. Fish and Wildlife Service. Washington, D.C. Stanford, J.A., J.V. Ward, W.J. Liss, C.A. Frissell, R.N. Williams, J.A. Lichatowitch and C.C. Coutant. 1996. A general protocol for restoration of regulated rivers. Regulated Rivers 12: 39-413. Stanturf, J.A. and S.H. Schoenholtz. 1998. Soils and landform. p 123-147. In M.G. Messina and W.H. Conner (eds.) Southern Forested Wetlands: Ecology and Management. Lewis Publishers., Boca Raton, FL. Tate, R.L. III. 1980. Microbiological oxidation of organic matter in Histosols. Advances in Microbial Ecology 4: 169-201.
D:\Anclote\Report\Final\Anclote_MFL_Final.doc 2/22/2010 11:02 AM
_____________________________________________________________________________________________ Proposed Minimum Flows and Levels for Anclote River System Appendices Page 159 of 207
Tharme, R.E. and J..M. King. 1998. Development of the building block methodology for instream flow assessments and supporting research on the effects of different magnitude flows on riverine ecosystems. Cape Town, South Africa Water Research Commission. Cited in Postel and Richter, 2003. Thorp, J.H., E.M. McEwan, M.F. Hunt and F.R. Hauer. 1990. Invertebrate colonization of submerged wood in a cypress-tupelo swamp and blackwater stream. American Midland Naturalist 113:56-68. USDA (United States Department of Agriculture).1986. Soil Conservation Service Soil Survey of Hillsborough County, Florida USDA/SCS 1982. Soil Survey of Pasco County, Florida Published by the USDA Soil Conservation Service in cooperation with the University of Florida Institute of Food and Agricultural Sciences. Agricultural Experiment Stations, Soil Science Department and the Florida Department of Agriculture and Consumer Services. 231 p. US Army Corp of Engineers. 2001. HEC-RAS River Analysis System; Hydraulic Reference Manual, Ver. 3.0. USACOE, Davis, California. Vannote, R.L., G.W. Minshall, K.W. Cummins, J.R. Sedell and C.E. Cushing. 1980. The river continuum concept. Canadian Journal of Fisheries and Aquatic Sciences 37: 130-137. Venice System (1959). The final resolution of the symposium on the classification of brackish water. Archo. Oceanogr. Limno., 11 (suppl): pg 243-248. VHB (Van Hangen Brustlin, Inc), 2002. Seagrass Study at the Anclote Power Plant Tarpon Springs, Fl. Final Report to Florida Power Corporation. January, 2002. Walbridge, M.R. and B.G.Lockaby. 1994. Effect of forest management of biogeochemical functions in southern forested wetlands. Wetlands 11: 47-439. Wallace, J.B. and A.C. Benke. 1984. Quantification of woody habitat in subtropical Coastal Plain streams. Canadian Journal of Fisheries and Aquatic Sciences 41: 1643-1652. Wharton, C.H., W.M. Kitchens, E.C. Pendleton and T.W. Sipe. 1982. The ecology of bottomland hardwood swamps of he southeast: a community profile. U.S. Fish and Wildlife Service FWX/OBS-81/37. 133pp. White, W.A. 1970. The geomorphology of the Florida peninsula. Florida Bureau of Geology Bulletin No. 51. 164 pp. Zuboy, J.R. 1981. A new tool for fisheries managers: the Delphi technique. North American Journal of Fisheries Management 1: 55-59
D:\Anclote\Report\Final\Anclote_MFL_Final.doc 2/22/2010 11:02 AM
_____________________________________________________________________________________________ Proposed Minimum Flows and Levels for Anclote River System Appendices Page 160 of 207
CHAPTER 10 - REPORT REVIEWS AND DISTRICT RESPONSES
_____________________________________________________________________________________________ Proposed Minimum Flows and Levels for Anclote River System Appendices Page 161 of 207
10.1 Peer Review Panel and Responses
SCIENTIFIC REVIEW OF THE ANCLOTE RIVER SYSTEM RECOMMENDED MINIMUM FLOWS AND LEVELS
Scientific Peer Review Report
October 31, 2009
Prepared For: Southwest Florida Water Management District
2379 Broad Street Brooksville, Florida 34609-6899
Prepared By: Scientific Peer Review Panel
Panel Chair and Report Editor:
Gary L. Powell, President Aquatic Science Associates
8308 Elander Drive Austin, TX 78750
Panel Members:
Courtney T. Hackney, Ph.D. Director of Coastal Biology and Biology Department Chair
University of North Florida, 1 UNF Drive Jacksonville, FL 32224
Barney N. Austin, Ph.D., P.E. Director of Hydrological Services
1812 Centre Creek Drive, Suite 300 Austin, TX 78754
_____________________________________________________________________________________________ Proposed Minimum Flows and Levels for Anclote River System Appendices Page 162 of 207
Scientific Peer Review of Proposed Minimum Flows and Levels for the Anclote River System, Florida
EXECUTIVE SUMMARY
These studies were conducted by the Southwest Florida Water Management District (the District) because Florida Statutes (§373.042) mandate the District’s evaluation of minimum flows and levels (MFLs) for the purpose of protecting the water resources and the ecology of the Anclote River and Estuary System from “significant harm” that might result from continued reductions of freshwater inflows from the contributing watersheds in the future. With appropriate water management, including science-based MFL rules for environmentally safe operation of water supply projects from ground and surface water resources, the District can ensure that the Anclote River and Estuary System, and their associated tidal (estuarine) marshes and brackish wetlands will continue to provide essential food and cover for the myriad of marine and estuarine-dependent fish and wildlife that need them for survival, growth and reproduction in these waters of interest. The District is to be commended for voluntarily committing to independent scientific peer review of its MFLs determinations. The Scientific Review Panel (the Panel) finds that the District’s goals, data, methods and conclusions, as developed and explained in the MFL report, are reasonable and appropriate. The District’s multi-species approach is to be applauded because it does not ignore species with variable life history requirements. The District approached this analysis in an appropriately holistic manner; that is, with attention paid to both the ecological requirements of the river system and to the various segments of the landscape already modified by humans. While the District clearly spent substantial time and effort in expanding the surveys of biota, there appears to be little data on this river system before water withdrawals began, making the MFL analyses more difficult for the District. Nevertheless, the Panel supports the District’s finding that changes in the shallow-water distribution of estuarine-dependent fishes and shellfish is related to freshwater inflow and salinity regimes. Freshwater discharges attract these organisms, particularly the young-of-the-year, into areas that provide habitat (i.e., food and cover) in which they can survive and grow. In particular, the Panel notes that the estuarine portion of the river contains several important nursery habitat areas including multiple channels and shorelines in braided reaches, such as along river mile 3.1 (river km 5) through river mile 7.5 (river km 12) that deserve special consideration and protection. The Panel also agrees with the presented scientific study results that indicate the highest potential to impact many species in the Anclote River and Estuary System would appear to be from June through October, although every month of the year contains species with young-of-the-year in the water column. This means that it is important to consider freshwater inflow needs during all months/seasons of the year. From a practical perspective, the Panel finds that the District’s flow recommendation are ecologically sound primarily because they are based on a small alteration to the naturalized flow regime; however, the District would be hard pressed to defend it based on the hydraulic model’s results. This is because the hydraulic model has an error of at least +/- 0.5 feet in water surface elevation, yet the District’s flow recommendation is based, in part, on there being 0.6 feet of
_____________________________________________________________________________________________ Proposed Minimum Flows and Levels for Anclote River System Appendices Page 163 of 207
water or more at some point across all of the river’s cross-sections. This problem is not unusual where 1-D models are used because the investigator really doesn’t know what’s going on between cross-sections – especially at low flows where the channel bathymetry is so important. If having sufficient water for fish passage is so important, and the Panel agrees, then the District needs to consider going out with a surveying rod when the flow is at or near 12 cfs for the purposes of verifying that the depth of water is at least 0.6 feet over the entire reach (or at least across all cross-sections). Until then, the Panel recommends that the District follow the Precautionary Principle and establish the initially recommended MFLs based on best available data and analyses until more and better scientific information is available in the future to better understand how changes in inflow, both quantity and quality, will affect the Anclote River and Estuary System. As the District moves forward to plan and supply water in the future to the people of the region, their economy and their environment, the Panel strongly recommends that the District continue to monitor the system for the purpose of verifying that the MFL is having its intended effect of maintaining the ecological health and productivity of this waterway. The verification monitoring should include streamflows, tidal flows, basic water quality, salinity, DO, chlorophyll, wetland vegetation, benthos and fisheries, particularly during the dry season, which coincides with the initial peak utilization of nursery habitats by estuarine-dependent fish and shellfish species.
INTRODUCTION The Southwest Florida Water Management District (the District) is mandated by Florida statutes to establish minimum flows and levels (MFLs) for state surface waters and aquifers within its boundaries for the purpose of protecting water resources and the ecology of the area from “significant harm” (Florida Statutes, 1972 as amended, Chapter 373, §373.042). The District implements the statute directives by periodically updating a list of priority water bodies for which MFLs are to be established and identifying which of these will undergo a voluntarily independent scientific review. Under the statutes, MFLs are defined as follows:
1. A minimum flow is the flow of a watercourse below which further water withdrawals will cause significant harm to the water resources or ecology of the area; and
2. A minimum level is the level of water in an aquifer or surface water body at which further water withdrawals will cause significant harm to the water resources of the area.
Revised in 1997, the Statutes also provide for the MFLs to be established using the “best available information,” for the MFLs “to reflect seasonal variations,” and for the District’s Board, at its discretion, to provide for “the protection of nonconsumptive uses.” In addition, §373.0421 of the Florida Statutes states that the District’s Board “shall consider changes and structural alterations to watersheds, surface waters and aquifers, and the effects such changes or alterations have had, and the constraints such changes or alterations have placed on the hydrology of the affected watershed, surface water, or aquifer….” As a result, the District generally identifies a baseline condition that realistically considers the changes and structural alterations in the hydrologic system when determining MFLs. While this is always important, it is especially important in the Anclote River and Estuary System where the headwaters are in a vast well field that provides water supplies for the Tampa region’s growing water needs. This has resulted in the dewatering of contributing springs and seeps of the groundwater aquifer,
_____________________________________________________________________________________________ Proposed Minimum Flows and Levels for Anclote River System Appendices Page 164 of 207
reducing river flows by an annual average of 29% with much greater effects (50-60%) in the dry season. Current state water policy, as expressed by the State Water Resources Implementation Rule (Chapter 62-40.473, Florida Administrative Code) contains additional guidance for the establishment of MFLs, providing that “…consideration shall be given to the protection of water resources, natural seasonal fluctuations, in water flows or levels, and environmental values associated with coastal, estuarine, aquatic and wetlands ecology, including:
1. Recreation in and on the water; 2. Fish and wildlife habitats and the passage of fish; 3. Estuarine resources; 4. Transfer of detrital material; 5. Maintenance of freshwater storage and supply; 6. Aesthetic and scenic attributes; 7. Filtration and absorption of nutrients and other pollutants; 8. Sediment loads; 9. Water quality; and 10. Navigation.”
After a site visit on August 4, 2009 to perform a reconnaissance survey of the Anclote River and Estuary System, the Panel held an initial meeting, discussed the scope of work and subsequently prepared their independent scientific reviews of the June 2009 draft report and associated study documents. The peer reviews were compiled by the Panel Chair and edited by all Panel Members into the consensus report presented herein.
BACKGROUND
The quantity, quality and timing of freshwater input are characteristics that define an estuary. Freshwater inflows affect estuarine (tidal) areas at all levels; that is, with physical, chemical and biological effects that create a vast and complicated network of ecological relationships (Longley 1994). The effects of changes in inflows to estuaries are also described in Sklar and Browder (1998) and reviewed in Alber (2002). This scientific literature describes and illustrates how changing freshwater inflows can have a profound impact on estuarine conditions: circulation and salinity patterns, stratification and mixing, transit and residence times, the size and shape of the estuary. In the end, the distribution of dissolved and particulate materials, including nutrients and sediments, may all be altered in ways that negatively affect the ecological health and productivity of coastal bays and estuaries. Inflow-related changes in estuarine conditions consequently will affect living estuarine resources, both directly and indirectly. Many estuarine organisms are directly linked to salinity, which determines the distribution of plants, benthic organisms and fishery species (Drinkwater and Frank 1994, Ardisson and Bourget 1997). If the distributions become uncoupled from their food source or preferred habitat, estuarine biota may be restricted to areas that are no longer suitable habitat for their survival, growth and reproduction. Potential effects of human activities, particularly reductions in fresh ground and surface water resources, on the adult and larval stages of fish and invertebrates include impacts on migration patterns, spawning and nursery habitats, species diversity and distribution, and production of lower trophic level (food) organisms (Drinkwater and Frank 1994, Longley 1994). Changes in inflow will also affect the
_____________________________________________________________________________________________ Proposed Minimum Flows and Levels for Anclote River System Appendices Page 165 of 207
delivery of nutrients, organic matter and sediments, which in turn can indirectly affect estuarine productivity rates and trophic structure (Longley 1994). There are a number of approaches for setting freshwater inflow requirements of an estuary. The District has selected to use a “percent-withdrawal” method that sets upstream limits on water supply diversions as a proportion of river flow. This links daily withdrawals to daily inflows, thereby preserving natural streamflow variations to a large extent. This type of inflow-based policy is very much in keeping with the approach that is often advocated for river management, where flow is considered a master variable because it is correlated with many other factors in the ecosystem (Poff et al. 1997; Richter et al. 1997). In this case, the emphasis is on maintaining the natural flow regime while skimming off flows along the way to meet water supply needs. Normally, regulations are designed to prevent impacts to estuarine resources during sensitive low-inflow periods and to allow water supplies to become gradually more available as inflow increases. The rationale for the District’s MFL setting, along with some of the underlying biological studies that support the percent-of-flow approach, is detailed in Flannery et al. (2002).
REVIEW Developing minimum flow rules requires several steps: (1) setting appropriate management goals; (2) identifying indicators to measure characteristics that can be mechanistically linked to the management goals; (3) reviewing existing data and collecting new data on the indicators; and (4) assembling conceptual, qualitative, and quantitative models to predict behavior of the indicators under varying flow regimes. The first two steps above represent the overall approach to setting the minimum flow rule. The District’s management goal for the Anclote River and Estuary System is to maintain ecosystem integrity and, thereby, protect ecological health and productivity. As a result, the District’s MFLs were developed to limit potential changes in aquatic and wetland habitat availability associated with reductions in seasonal blocks of freshwater inflows (SWFWMD 2009). When “breakpoints” in physical, chemical, biological and ecological responses were not found, as is often the case in field studies, a criterion of no more than a 15% loss of habitat or other resources, as compared to the estuary’s baseline condition, was used as the threshold for “significant harm.” While the use of 15% as a threshold is a more or less arbitrary management decision, the Panel agrees that it is a reasonable approach for avoiding the most serious negative impacts, particularly where the ecosystem has not been as well studied and has little historical data available. The remainder of this report is focused on review of data, methods and analyses used as a basis for the District’s recommended MFL. Specifically, the District’s proposed MFL was determined based on the following procedure:
1. The Anclote River is located north of Tampa Bay and drains approximately 112 square miles (~71,680 acres) of coastal Pasco and northern Pinellas counties through 29.8 river miles (48 river kilometers), the first 14.1 river miles of which are tidally affected and connected to the Gulf of Mexico (Figure 1). As a result, the District opted to perform separate MFL studies on the upper freshwater portion and the lower estuarine portion of the river.
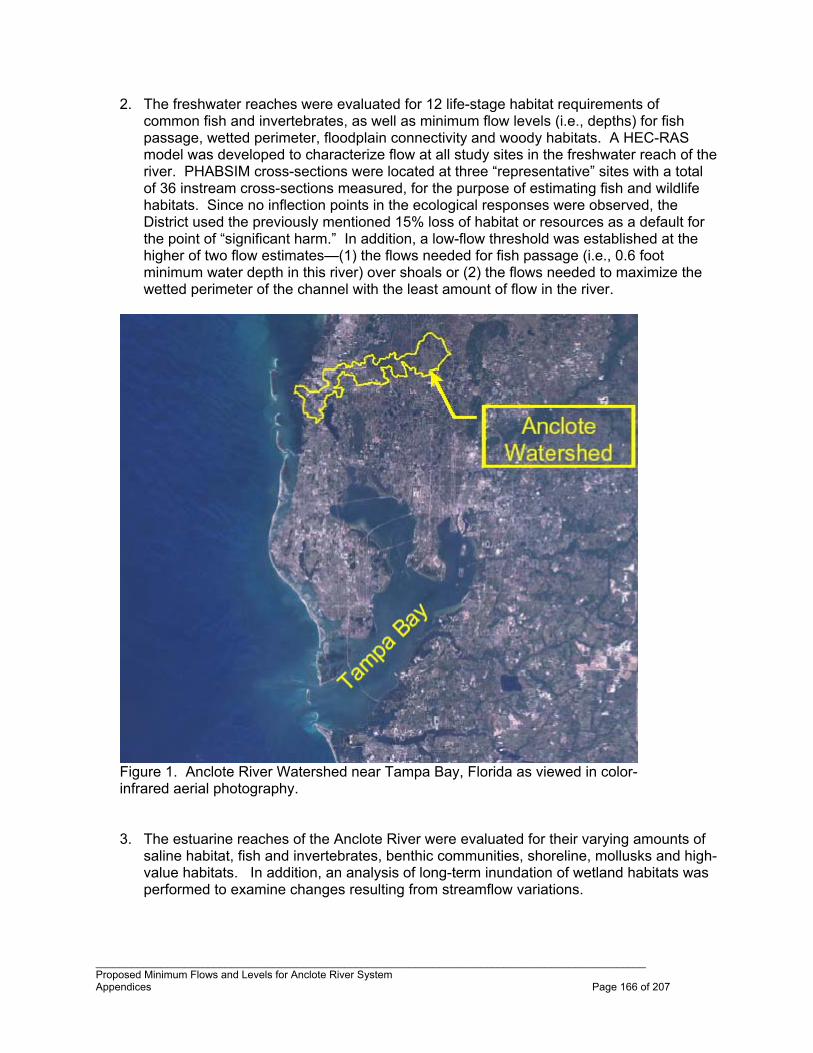
_____________________________________________________________________________________________ Proposed Minimum Flows and Levels for Anclote River System Appendices Page 166 of 207
2. The freshwater reaches were evaluated for 12 life-stage habitat requirements of common fish and invertebrates, as well as minimum flow levels (i.e., depths) for fish passage, wetted perimeter, floodplain connectivity and woody habitats. A HEC-RAS model was developed to characterize flow at all study sites in the freshwater reach of the river. PHABSIM cross-sections were located at three “representative” sites with a total of 36 instream cross-sections measured, for the purpose of estimating fish and wildlife habitats. Since no inflection points in the ecological responses were observed, the District used the previously mentioned 15% loss of habitat or resources as a default for the point of “significant harm.” In addition, a low-flow threshold was established at the higher of two flow estimates—(1) the flows needed for fish passage (i.e., 0.6 foot minimum water depth in this river) over shoals or (2) the flows needed to maximize the wetted perimeter of the channel with the least amount of flow in the river.
Figure 1. Anclote River Watershed near Tampa Bay, Florida as viewed in color- infrared aerial photography.
3. The estuarine reaches of the Anclote River were evaluated for their varying amounts of saline habitat, fish and invertebrates, benthic communities, shoreline, mollusks and high-value habitats. In addition, an analysis of long-term inundation of wetland habitats was performed to examine changes resulting from streamflow variations.
_____________________________________________________________________________________________ Proposed Minimum Flows and Levels for Anclote River System Appendices Page 167 of 207
4. Wet, dry and intermediate seasonal flow blocks were delineated in a “building block”
approach to the river’s flow regime. A low-flow season in the spring from April 12 through July 21 was defined as Block 1. A high-flow season in the summer from July 22 through October 14 was defined as Block 3. And intermediate flows during the rest of the year, from October 15 through April 11, were defined as Block 2. The seasonal flow blocks were evaluated separately for allowable flow reductions from a baseline condition of naturalized flows with human impacts removed.
5. The MFLs for the freshwater reach of the river were based on 129 component scores
representing individual taxa or habitat availabilities. The results would allow instream flow reductions no larger than 8% of the baseline flow in Block 1 (low flow season) when flows are above 137 cfs and 11% when flows are below 137 cfs, with a low-flow cutoff of 12 cfs that was derived from the more restrictive requirements for maintaining fish passage and the wetted perimeter of the upper river. Indeed, the District notes that streamflows exceed 12 cfs on average only 42 days out of a total 101 days (41.6% of the time) in Block 1. Similarly, the allowable instream flow reductions are no larger than 8% of the baseline flow in Block 3 (high flow season) when flows are above 137 cfs and 18% when flows are below 137 cfs, but above the 12 cfs cutoff. During the intermediate flow season (Block 2), reductions are allowed to be no larger than 8% of baseline flows when streamflows are above 137 cfs and 14% when streamflows are between 12 and 137 cfs.
6. The MFLs for the tidal (read: estuarine) portion of the river were based on 89 component
scores representing individual taxa or habitat availabilities. The results, expressed as a percentage reduction of median naturalized flows, suggested to the District that allowable reductions from the baseline were 11.5% in the dry season Block 1, 18.5% in the wetter Block 3, and 15.8% during the intermediate Block 2 seasonal flow conditions. No low-flow threshold was identified to use as a cutoff for allowable flow reductions in the estuarine river segment, although prime nursery habitats for many estuarine-dependent species are known to have salinities less than ~50% seawater (17.5 ppt), primarily because they offer shallow habitats with plenty of food and cover, including protection from marine predators, parasites and disease organisms, particularly at or below brackish conditions of around a 1% salt solution (i.e., 10 ppt; the ocean is a 3.5% salt solution). This includes the braided reaches of the lower Anclote River at river mile 3.1 (river kilometer 5.0) through river mile 7.5 (river kilometer 12) which have multiple channels and shorelines (i.e., ecotonal opportunities) for enhanced production of these ecologically characteristic and economically important coastal fishery species, and the lower food-chain species upon which they are dependent.
7. Since the present impacts on Anclote River flows from human activities are larger than
the recommended MFLs for the baseline condition, the District is required to develop a “recovery plan” to restore streamflows under Section 373.042(2) of the Florida Statutes (1997). The District notes that a recovery plan is already in place for the Northern Tampa Bay Area; therefore, no further recovery strategy is recommended by the District until the existing strategy can be fully evaluated in the future with regard to its success at increasing flows in the Anclote River. The Panel believes that this matter should evaluated year-to-year, with major reviews every five (5) years or so.
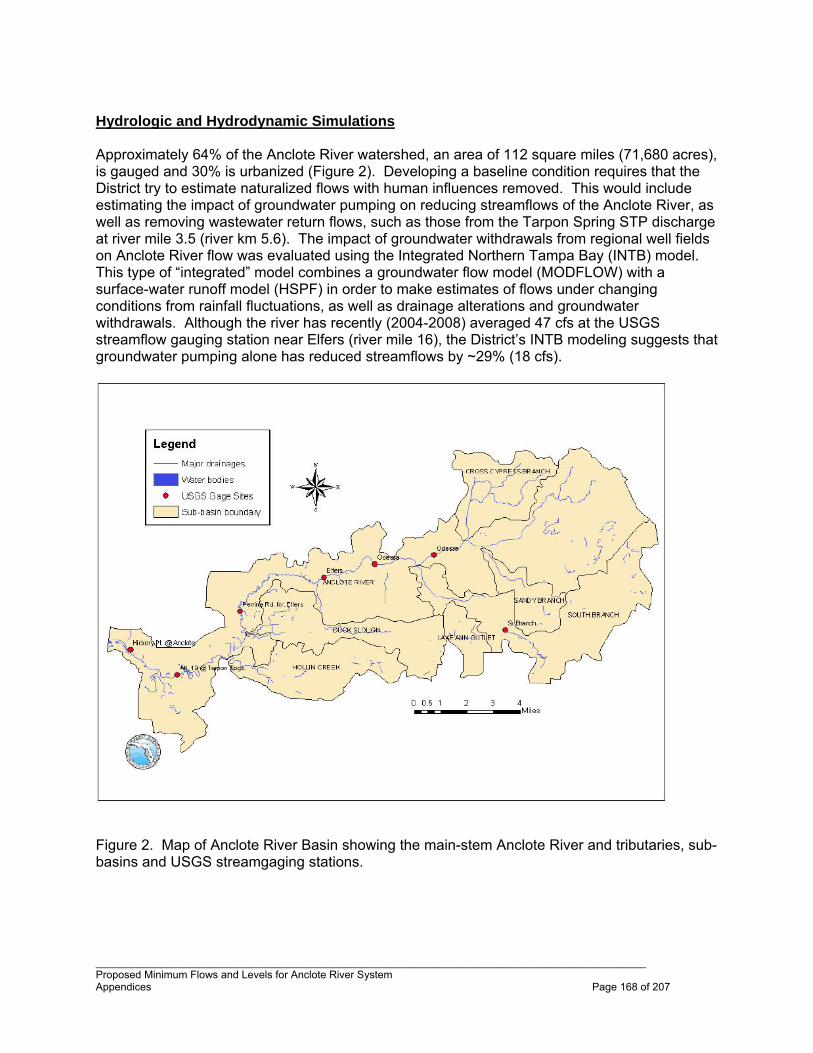
_____________________________________________________________________________________________ Proposed Minimum Flows and Levels for Anclote River System Appendices Page 168 of 207
Hydrologic and Hydrodynamic Simulations Approximately 64% of the Anclote River watershed, an area of 112 square miles (71,680 acres), is gauged and 30% is urbanized (Figure 2). Developing a baseline condition requires that the District try to estimate naturalized flows with human influences removed. This would include estimating the impact of groundwater pumping on reducing streamflows of the Anclote River, as well as removing wastewater return flows, such as those from the Tarpon Spring STP discharge at river mile 3.5 (river km 5.6). The impact of groundwater withdrawals from regional well fields on Anclote River flow was evaluated using the Integrated Northern Tampa Bay (INTB) model. This type of “integrated” model combines a groundwater flow model (MODFLOW) with a surface-water runoff model (HSPF) in order to make estimates of flows under changing conditions from rainfall fluctuations, as well as drainage alterations and groundwater withdrawals. Although the river has recently (2004-2008) averaged 47 cfs at the USGS streamflow gauging station near Elfers (river mile 16), the District’s INTB modeling suggests that groundwater pumping alone has reduced streamflows by ~29% (18 cfs).
Figure 2. Map of Anclote River Basin showing the main-stem Anclote River and tributaries, sub-basins and USGS streamgaging stations.
_____________________________________________________________________________________________ Proposed Minimum Flows and Levels for Anclote River System Appendices Page 169 of 207
The District selected the U.S. Army Corps of Engineers HEC-RAS software to model the hydraulics of the Upper Anclote River (i.e., above the zone of tidal influence). HEC-RAS is a one-dimensional (1-D) mathematical code in the public domain that is widely used in floodplain mapping and the study of steady-state channel hydraulics. The software has the ability to model subcritical as well as supercritical flow, which makes it highly desirable for use on rivers with varying gradients. HEC-RAS is easy to use and key parameters that must be set are readily found online and in the published literature. Boundary conditions are defined by observed (quantitatively measured) streamflow and water stage height. Calibration is typically performed by adjusting channel roughness (Manning or Chezy) coefficients. One-dimensional (1-D) hydraulic models require land elevation information along chosen cross-sections. These cross-sections are placed at interesting features in the river, such as bends, constrictions, river widening or braiding, etc. The cross-sections are placed perpendicular to the direction of flow, close enough together to capture any interesting hydrodynamics, and extended high enough up the floodplain to allow the user to model the highest flows of interest. Bridge abutments and culverts can be handled by the software, but must be built into the model explicitly, especially if they influence the water velocity (and therefore the stage). The same is true for shoals, a problem area on this river because they can act as hydraulic controls on streamflows, particularly during moderate to low flows. The HEC-RAS model built for this study simulates velocity and stage for an 8.8 river-mile stretch, at 27 different prescribed flow rates. The range of flows chosen is broad, from flows below the minimum flow recommendation to flows as high as the 0.25% exceedance probability flood event. The District has recognized that it is very important to consider the entire hydrologic regime in setting minimum flows and levels. Sixteen HEC-RAS cross-sections were selected and surveyed in order to apply the model to the Anclote River. The hydraulic model is an integral part of this study, allowing the District to determine low flow thresholds to protect fish passage and maintain wetted perimeter, which is assumed to be a key indicator of biological habitat, as well as the frequency and extent of floodplain inundation necessary for preservation of riparian habitat. The hydraulic model is also the backbone of PHABSIM, a somewhat controversial and error-prone habitat simulation technique found in the instream flow incremental methodology (IFIM) developed decades ago by the U.S. Fish and Wildlife Service (Milhous et al. 1984). The PHABSIM was used in lieu of the application of more modern methods and advanced 2-D and 3-D hydraulic models, which were considered either too difficult or too expensive for fisheries workers to employ (the Panel acknowledges that an interdisciplinary team of scientists and engineers is best). The velocity and depth information from HEC-RAS was used to determine the amount of habitat available for the various species of interest here. Concerns about and disadvantages of the PHABSIM include, but are not limited to, the following:
There are sampling issues associated with using data collected at transects to represent river reaches. There is no ability to account for conditions upstream or downstream of transects and, therefore, selection of transect location heavily influences results. Unless transects are truly biologically representative of the remainder of the river, small biases (e.g., particularly low or high amount of habitat at one location) in the results at one
_____________________________________________________________________________________________ Proposed Minimum Flows and Levels for Anclote River System Appendices Page 170 of 207
transect are multiplied during the extrapolation. The more complexity in a river system, the greater the risk of bias. This is typically addressed by increasing the number of transects in complex (e.g., high gradient) systems.
There is limited ability to address hydraulic conditions where the water surface
elevations vary across a transect (e.g., split channels or high gradient riffles).
The researcher can only simultaneously account for a limited set of habitat values (depth, velocity and a channel index, such as substrate or cover).
Hydraulic modeling typically occurs at a coarser scale than that at which organisms
respond to their hydraulic environment; therefore, a mismatch in scale occurs when combining results from hydraulic models with habitat suitability or preference data collected on a finer scale. Suitability criteria are also often biased because they are based on site-specific habitat conditions and use of vertically-averaged velocities, and the criteria fail to account for habitat preferences that vary based on the scale that is considered. For example, the "nose" water velocities used by a fish are often much lower than the average water velocity at the same location.
There is a weak tie to population response, and interpretation of results almost always
assumes that minimum flows limit the abundance and/or distribution of populations. There is a limited ability to integrate results with a limiting factors analysis, so discerning which species or life-stage should drive flow selection is unreliable. The PHABSIM does not provide a total amount of preferred or usable habitat available at varying flows, so the data can not be used in population studies.
Integrating WUA results with other analyses (e.g. limiting factors analysis) is
problematic, since the metric serves mostly as a relative index to compare various flows.
Application of the model requires subjective “professional judgments” regarding how well the habitat portion of the model actually fits what is being modeled.
1-D PHABSIM models rely on the assumption of a simple channel with either gradual
variation in flow or uniform flow, which is atypical for some habitat types.
The technique is not reliable in hydraulically complex areas due to limited ability to address spatial shifts in water velocity as flows change. IFIM and similar 1-D approaches are best applied in systems without substantial bed roughness, or without hydraulic complexity. For example, it works well in deep pools that have consistent average velocities, but if pools are also hydraulically complex, the results are also less reliable.
The technique has not been widely applied in spring-dominated streams and may not
adequately address aquatic habitats there.
In study areas with long stream reaches, or a variety of stream channels (e.g., side channels) to be assessed, such as in biologically important braided reaches, an
_____________________________________________________________________________________________ Proposed Minimum Flows and Levels for Anclote River System Appendices Page 171 of 207
extensive number of transects are needed to adequately characterize habitat-flow relationships.
And finally, the technique does not allow calculations of statistical error bounds on the
predicted habitat-flow relationships, so the reliability of the results cannot be estimated and considered when making management decisions (Castleberry et al. 1996).
More recently, Railsback and Kadvany (2008) have made a compelling case for the use of “demonstration flow assessments” (DFAs), an empirical two-dimensional (2-D) habitat modeling method they used to evaluate a stream restoration project on the Trinity River, California. This was originally viewed as an improvement over the 1-D PHABSIM technique. Unfortunately, Gard (2009) was able to show that the DFA does not give reproducible results, finding substantial disparity between replicate surveys in the total quantity and spatial distribution of habitat, a significant drawback relative to a well-applied 2-D hydraulic model’s estimate of aquatic habitat availability. Modification of the DFA to give more reproducible results involves increasing time, money and manpower, and probably decreasing the length of stream that can be assessed. In the end, 2-D hydraulic modeling may be a more accurate and cost-effective method of instream flow analysis. The District’s study of minimum flows and levels on the Anclote River was also hampered somewhat by the lack of surface water data. Two U.S. Geological Survey (USGS) streamflow monitoring stations were used for this study: one near Odessa, 24.8 river miles from the river mouth (USGS gage number 02309740), the other near Elfers, 16 river miles from the mouth (USGS gage number 02310000). The Odessa gage has two periods of record: one period from 1983 to 1994 when both stage and flow were measured, and a more recent period (June 2004 to present) during which only stage was measured. Unfortunately, the gage was relocated between periods so comparisons are ill-advised. The new gage location has been moved further up the channel, and it appears there are culverts located between the two sites with a significant gradient between old and new sites. For modeling purposes, the 1983 to 1994 records were chosen because flow and stage data were available both at the upstream and downstream boundaries of the model for this period. The measured streamflows at Elfers are also used in the analysis of inflow needs in the lower estuarine portion of the river. Discharge measurements by the USGS are rated as Excellent, Good, Fair or Poor with Excellent being within 2% of the "true" discharge, Good at 5%, Fair at 8% and Poor being above 8%. These ratings are based on the conditions found at the site during the measurement and not based on the ability of the hydrographer. A discharge record is also rated as Excellent, Good, Fair or Poor, but this is based on slightly different criteria: Excellent: 95% of daily discharges are within 5% of "true" discharge Good: 95% within 10% Fair: 95% within 15% Poor: less than fair Both the Odessa and Elfers gauges are rated in the range of “Good to Poor,” with no measurements rated “Excellent.” Surface water modelers and water resource managers should be cognizant of these accuracy ratings when making decisions regarding the future of the water bodies they have been charged to protect. For example, errors in the analysis may mean you
_____________________________________________________________________________________________ Proposed Minimum Flows and Levels for Anclote River System Appendices Page 172 of 207
can’t tell whether a threshold should be set at 12 cfs or 15 cfs. To ensure that the threshold is competent, managers may have to opt for a higher estimate because it includes these standard errors. Verification monitoring is also in order. The District has chosen to “correct” measured flows to what would have occurred historically without anthropogenic effects (i.e., naturalized flows). To do this, the District used the previously discussed INTB model, which covers 4,000 square miles of the northern Tampa Bay region, including the entire Anclote River Basin. Alteration of the natural flow of the river is due primarily to groundwater withdrawals from five large regional well fields, the effects of which are simulated by the integrated model. The adjustment performed takes into account the gradually increasing influence this pumping had on flows in the Anclote River over the last few decades. The low-flow cutoff recommendation is based on two criteria: minimum depth for fish passage and lowest wetted perimeter inflection point. The minimum depth for fish passage is stated as 0.6 feet and can be readily ascertained from the output of the hydraulic model, but model error (±0.5 feet) is still a concern. To determine the inflection point, the District plots flows versus wetted perimeter (from multiple HEC-RAS model simulations) for all the modeled cross-sections and chooses the point on the curve at which a small change in flow leads to a larger change in wetted perimeter. For most cross-sections, no inflections points are visible, so the lowest modeled flow that meets the objective is chosen. Highlights of the Study--The District should be commended for its proactive approach to protecting the Anclote River. This water body has no surface water impoundments, major wastewater returns, channelization or significant bank stabilization outside the urbanized reach, yet the stream has been significantly impacted by groundwater pumping in and around the watershed and is in danger of losing its ecological integrity in the future. Several features of the District’s study deserve highlighting:
1. The District has chosen to use baseline flows (naturalized flows) as a starting point for determining current impacts and for developing minimum flow and level recommendations. This increases the likelihood that the Anclote River will be enjoyed by future generations.
2. The choice of a 15 % loss threshold for change in habitat enables the District to develop
a more or less objective numerical process for arriving at their flow recommendations. There is a clear path from the data and models to the recommendations in the report, making the process more easily understood by stakeholders (and peer reviewers). The clear and transparent way the process is laid out in the report will make the flow recommendations more defensible.
3. The District has recognized the importance of woody habitat in this study. While often
referred to as the single most important habitat feature of a river, many instream flow studies simply ignore woody habitat, because of the complexity of dealing with what is essentially a geomorphic (and transitory) feature of the river. The District has tackled the challenge of dealing with this habitat type comprehensively and quantitatively.
4. The District has considered the full hydrologic regime, from drought conditions to
extreme flood events. Many instream flow studies are focused on a much narrower
_____________________________________________________________________________________________ Proposed Minimum Flows and Levels for Anclote River System Appendices Page 173 of 207
range of flows. This approach allows the District to consider flows into the floodplain, minimum flows required for fish passage and preservation of the wetted perimeter, and all flows in between.
5. The District has divided Anclote River flows into three distinct seasonal “blocks” for wet,
dry and intermediate intervals. While clearly more work, this approach makes sense both from biological and engineering perspectives. It is acknowledged that partioning data in time or space for analysis is one of the first ways scientists and engineers use to increase the resolution of their work.
6. The District has taken great pains to “correct” Anclote River flows to take into account
groundwater withdrawals from five regional well fields, using an integrated groundwater – surface water model. These naturalized flows with human influences removed are, in turn, used as a starting point for the minimum flows and levels study. The Panel agrees that the procedure used to adjust the gauged record is basically sound. There is some question about whether flow augmentations other than surface agricultural runoff from groundwater irrigation, such as the wastewater return flows from the Tarpon Springs STP plant at river mile 3.5 (river km 5.6), were likewise removed from the flow record. The Panel also found some references to dredging by the Corps of Engineers in the early part of the 20th Century, but most of this occurred in the lower river and the dredging was for vessels getting in and out of the harbor. Since every part of the MFL calculation relates to the baseline condition, the estimated naturalized flow is a potential source for error that deserves some careful consideration.
Opportunities for Improvement--While the approach taken to modeling the hydrology and hydraulics is conventional and adequate given the availability of data, the following section describes areas that could be improved and should be considered in future minimum flows and levels studies. The HEC-RAS model was calibrated to within +/- 0.5 feet at all 27 flow rates except the highest three. Getting a model to simulate water surface elevations within six inches of observations at high flow events is not particularly useful in a low flow analysis. Therefore, modeled water surface elevations that are out by as much as six inches at critically low flows are of concern to the Panel. Engineers should be able to calibrate the model to reproduce water surface elevation differences within a couple of inches, or better, using the channel roughness factor as applied at cross-sections. It is very important to get the water surface elevations exactly right for this study because the stated minimum fish passage requirement is 0.6 feet, only slightly more than the stated model accuracy. Lack of accuracy in the channel and floodplain topography is not a good reason for not calibrating the model to better than a half foot of observed water surface elevation. What is important here is the depth of water, rather than the absolute or relative elevation of the land or water. Steady state hydraulic models can get the water surface elevation differences between cross-sections exactly right, using channel roughness for calibration. Water depths across the channel at particular flow rates can and should be verified during field visits. This verification is not apparent here. One of the problems faced by District staff is that the flow data being used for the study is some 20 years earlier than when the cross-sections were surveyed. There does not appear to have been any major channel-altering events since 1983 on the Anclote River, but it is probably safe
_____________________________________________________________________________________________ Proposed Minimum Flows and Levels for Anclote River System Appendices Page 174 of 207
to say that none of the channel cross-sections are exactly the same as they were during the 1983 to 1994 period. The District is aware of this as a source of uncertainty. Interestingly, one of the PHABSIM survey sites was called “Waterfall” (page 124, SWFWMD 2009). If indeed a waterfall is present on the main stem of the Anclote River, it would seem to be a greater impediment to fish migration than the deepest point of a channel cross-section being shallower than 0.6 feet. Furthermore, while HEC-RAS can simulate supercritical flow, the model has no way of knowing if this feature is in the river unless there are cross-sections immediately upstream and downstream of the feature. Unfortunately, while the District surveyed some 16 cross-sections for the hydraulic model, water surface elevation monitoring has not been conducted at any of the cross-sections, except at the boundaries by the USGS. It is very difficult to determine the accuracy of the model and impossible to verify cross-section depths or water surface elevations without this monitoring data. Instream flow studies usually involve the deployment of depth-sounders or pressure transducers at intervals along the study reach. These instruments monitor variations in water surface elevation and, in addition to being good sources of information for model verification, also allow scientists and engineers to tie bathymetric measurements to a local datum (note: the pressure transducers need to be “tied in” by survey for this to take place). Pressure transducers can be set up to log incoming data at a finer temporal resolution than the USGS streamflow monitoring stations typically report and can, thus, be used for determining travel time and flood attenuation as well. Short-term deployments (e.g., month or less between servicing is common) do not typically require the infrastructure used by the USGS for their stations. The report states that the identification of shoal locations is the study reach was important for PHABSIM analyses (page 95), yet it is unclear if HEC-RAS cross-sections have been set up at these locations. Cross-sections in one-dimensional models should be set at locations where there is a noticeable change in the physical shape of the channel, either longitudinally or laterally. Shoal areas are important to capture from a hydrodynamic perspective, but also biologically for determining whether they present an impediment to fish passage. For this study, initial values for cross-section Manning’s n were obtained from other models developed for the District. To get water surface elevation values from the model to match observed data, the channel roughness was reduced (simultaneously for all cross-sections), while the flood plain roughness values were held constant. The model calibrated within 0.5 feet at all flows, except the three extreme highs, as noted earlier, where the model slightly over-predicted. This leads the Panel to believe that the model is under-predicting at the lower range of flows. If this is the case, the model might be producing unrealistically low water surface elevations (and corresponding depths) for low-flow simulations, and consequently conservative flow recommendations. In calibrating the HEC-RAS model, the District adjusted the roughness coefficient simultaneously across all cross-sections and the full range of flows. Given the importance of getting the low-flow water surface elevations just right, it would seem sensible to focus the calibration on the low flows and adjust the roughness for higher flows, if necessary. While it is not ideal to adjust roughness values between flow rates to get water surface elevations to match observed data, it provides more accuracy for the wetted perimeter and fish passage criteria.
_____________________________________________________________________________________________ Proposed Minimum Flows and Levels for Anclote River System Appendices Page 175 of 207
Channel roughness values can be developed and supported by visual inspection of the channel substrate. To ensure they are protecting aquatic resources at the low range of flows, the District uses two low-flow criteria: lowest wetted perimeter inflection point and maintenance of fish passage. In the end, the fish passage criterion (i.e., 12 cfs) for the Anclote River was the higher of the two. With respect to the discussion above, it is recommended that District visit cross-sections 4, 8, 15, Waterfall and 35 when the Anclote River is flowing at or around 12 cfs to verify depth of water in the channel. Lastly, the report makes very little mention of the geomorphology of the river, other than the woody debris and substrate type. It would be useful to determine if the physical features of the river are essentially stable or not. River channels in some states are incised and starved of sediment due to upstream impoundments or significant changes to the hydrological regime. A review of the draft Texas Instream Flow Program Technical Overview document by the National Academy of Sciences (2005) emphasized the importance of considering geomorphology, it being one of the four key scientific disciplines involved in the determination of environmental flow recommendations, along with water chemistry, hydrology and hydraulics, and biology. Biota and Ecology of the Anclote River The Panel found that the transition zone in the Anclote River from fresh to estuarine waters was important because this part of the riverine continuum can be related to specific indicator organisms (both plants and animals) that were collected during the studies conducted by the District, since increasing or decreasing flows moves this zone downstream or upstream, respectively. Further, the estuarine portion of the river contains several important nursery habitat areas including multiple channels and shorelines (i.e., ecotones) in the braided reaches at river mile 3.1 (river km 5) and river mile 7.5 (river km 12) that deserve protection. While the District clearly spent substantial time and effort in expanding the faunal survey, there appears to be little data on the fauna of this river system before withdrawals began. There may be useful data from specimens collected and tucked away in a museum before the Anclote River was utilized as a water source; however, if there are, the Panel found they were not readily available via Internet search. The significance to the system would not likely be seen in fauna capable of reinvading (e.g., insects with flying stages, estuarine residents or transients), but rather in obligate freshwater species (e.g., Unionid mussels). Extreme low water caused by past aquifer draw-downs and droughts could have led to their extermination. This is especially troubling since they are ideal indicator species for both water quality and streamflows, but were not mentioned in any of the documents reviewed by the Panel. According to the District’s report (Figure 2-15, SWFWMD 2009), as much as 50-60% of the river’s flow has been removed from some seasons during the past 50 years. This alone might explain the lack or loss of native, non-motile species. It is possible that the entire upper reaches of the river dried up causing a loss of the Unionid bivalves and the fishes that are their intermediate hosts. This small, coastal river is tidal for about half of its reach and benefits from the fact that there are no structures (i.e., dams or weirs) that limit or block flow other than the natural shoals mentioned before. The faunal surveys done as part of the study, as well as previous studies, suggest that this river remains rich in the fauna one would expect to find in this part of Florida. Notable was the absence of the exotic Asian clam (Corbicula) from the survey of mollusks,
_____________________________________________________________________________________________ Proposed Minimum Flows and Levels for Anclote River System Appendices Page 176 of 207
except for dead Corbicula material (e.g., shells) found at river mile 7.0 (river km 11.3) by Estevez and Robbins (2006), who concluded that the species may not occur in the upper reaches of the Anclote River because of the steep channel banks and the unsuitable sediment conditions at depth. The invasive organism is found throughout rivers and lakes along Florida’s southwest coast and would likely be a strong competitor for native species. This exotic species spread east from the Pacific Coast in 1924 to the Gulf states and the Florida panhandle by 1960, and on to southern Florida by 1967 (Blalock and Herod 1999). The lack of occurrence of Corbicula suggests either the freshwater portion of the Anclote River was not sampled well enough or that Corbicula had never been introduced to this river, a finding surprising to the Panel. It is worth noting that these Asian clams are consumed mainly by fish and crayfish. In Florida, they have been reported (Bass and Hitt 1974, McMahon 1983) as major prey items of the following species of fish: red ear sunfish (Lepomis microlophus), spotted bullhead (Ameirus serracanthus), bluegill (Lepomis macrochirus), spotted sucker (Minytrema melanops), sturgeon (Accipenser spp.), channel catfish (Ictalurus punctatus), common carp (Cyprinus carpio), freshwater drum (Aplodinotus grunniens), smallmouth buffalo (Ictiobus bubalus), black buffalo (I. niger), and blue catfish (Ictalurus furcatus). One possible explanation for the non-occurrence of Corbicula is that the river was once fed by significant subterranean sources that interact with limestone strata. The subsequent artesian springs and other subterranean discharges would be alkaline (i.e., pH above 7.0). A drop in flows from springs because of groundwater pumping would lead to a higher proportion of the streamflow coming from the surficial drainage, resulting in a lower pH, perhaps acidic enough to limit native molluscan fauna or at least to severely restrict their abundance and distribution. Unionid mollusks, in particular, require freshwater that is basic or near neutral (pH ≥7.0) and their life cycle requires freshwater fish as hosts for their parasitic glochidia larvae. They all could have been eliminated if historic flows had periods of very low water levels with acidic water quality that affected either them or their fish hosts, or both. The Panel requested additional pH data available on the river system and the District responded in a timely manner with their available records. While limited in scope, the additional data did provide the Panel with some ability to better interpret the potential for pH to be a major biological issue. There is clear evidence that pH just above river km 10 is influenced by seawater both in wet and dry years. Based on pH alone, there is also indication that there is enough flow during some wet years to push saltwater almost totally out of the river. Upstream of river km 10, there is some evidence that the wet season lowers pH. This is not unusual and suggests that there is a subsurface contribution (e.g., springs) that is relatively constantly expressed in the data records. When springflows are low, the addition of rainwater dilutes the contribution of groundwater, resulting in acidic conditions. Limitations on data interpretation include a data set based on what are termed historic conditions that occurred when aquifer recharge was probably smaller than the amount being pumped. The Panel did not find any trend within the pH data set supplied by the District for river mile 15.9 (river km 25.7), which covered a period from the early 1960s to about 2001. It is possible that the major historic groundwater discharge points were downstream of that point in the river, as the District’s MFL report mentions springs that once existed in the Anclote River that have stopped flowing. The presence and/or increase in flow of these springs may be
_____________________________________________________________________________________________ Proposed Minimum Flows and Levels for Anclote River System Appendices Page 177 of 207
another indicator of the successful recovery of the aquifer that supplies freshwater inflows to the Anclote River and Estuary System. A second limitation is the lack of faunal data over a longer timeframe. When the faunal study began in October 2004, rainfall was declining to a historic low. Some of the data collected during this period with respect to benthic communities may reflect a transition from a more fresh to a more saline community. Nevertheless, the approach in the analysis included the entire freshwater to saltwater zone, so it probably included most species that would have been found in either flow state. In an ideal world, these data would include high flow, low flow and normal flow years. The District approached this analysis in an appropriately holistic manner; that is, with attention paid to both the ecological requirements of the river system and to the various segments of the landscape already modified by humans. Based on data in the report, the appendices and the Panel’s observations, it is clear that the river has extensive areas of natural vegetation and fish habitats, as well as hardened or otherwise modified edges of lesser value to the natural ecosystem, especially in the lower parts of the river as it flows through the City of Tarpon Springs. The primary impacts that could be predicted from a decrease in flow resulting from well field withdrawals are potential pH changes in the upper river, the upper edge of the saline zone in the river, and within the soils at the upper edge of the riparian wetland zone. Animals and plants within the tidal estuarine zone are typically tolerant of salinity fluctuations on a variety of short- and long-term scales, and if impacted by changes in flows, would have quickly re-colonized. While models of the non-resident species of epifauna seem well constructed, the Panel has questioned their value to the ecological analysis because they are so highly capable of reoccupying habitat after disturbance. These generalized, motile species are capable of moving quickly and use a variety of habitats and food sources. They would be expected to be found in the tidal portion of the river no matter whether flows were increased or decreased. Their distribution would vary up and down the river, depending on flows and salinity at the time. The examination of larval abundance was noteworthy, since the abundance or absence of many estuarine epifauna is dependent on currents capable of transporting planktonic larvae upstream to appropriate habitats. The dredging of the lower river early in the 20th Century likely improved the efficient transport of marine and estuarine post-larvae upstream, a change that had nothing to do with aquifer withdrawals that merely increased the total amount of estuarine water in the system, not the volume exchanged in the daily tidal prism. If only one faunal group were to be studied in the future, it could be the molluscan community. These species are not capable of moving away from changes in salinity and represent a variety of different reproductive cycles. Many are also species that live for several years (read: decades) and, thus, are better indicators/integrators of habitat suitability than other members of the benthic community with short life spans (e.g., oligochaete and polychaete worms) that are capable of rapid (i.e., weeks to months) colonization during favorable conditions. Benthic Invertebrates
_____________________________________________________________________________________________ Proposed Minimum Flows and Levels for Anclote River System Appendices Page 178 of 207
The numbers of benthic (bottom dwelling) invertebrate taxa varied seasonally and longitudinally within the Anclote River with dry season values higher than wet season values throughout most of the river. Grabe and Janicki (2007) noted that in the Anclote and the Little Manatee Rivers, crustaceans comprise a significant portion of the benthic community as opposed to the predominance of polychaete worms in nearby impounded rivers, such as the Lower Hillsborough River and Tampa Bypass Canal. Location in the river (i.e., river mile from the mouth) was the single abiotic variable with the highest rank correlation coefficient to multivariate community structure in the Anclote River. Secondary factors included temperature and mean sediment grain size. Salinity measured at the time of collection was not among the key variables associated with community structure. The benthic community was characterized as rich with many species reported in the District’s report. One suite of these species was best characterized as associates of the oyster and the other of oligohaline species. Both groups are useful in understanding current conditions and potential changes that would result from altering flow. However, biological community change would only come from a major change in salinity, since these are species that can handle short-term salinity fluxes extremely well. For example, the bivalve, Polymesoda caroliniana, used as an indicator by the District, can survive in salinities from near 0 to full strength seawater (~35 ppt). The District’s model correctly identified its ideal salinity zone, but this species would not be impacted by changes in salinity unless they were over multi-year scales. Individual Polymesoda were all small, which says something important about survival of the species in the river since Polymesoda is a slow-growing species that can live for several decades. Their size can also be limited by available food, but that does seem likely to the Panel based on its observation of the river. On the other hand, Rangia cuneata, a valuable clam of the estuarine zone with fluctuating salinities is a larger species that occupies a similar salinity zone (from 0 to 15 ppt), but it is more sensitive to high salinity and is known to respond to passing freshets by spawning. The small numbers of Rangia found and the small size of Polymesoda taken by the District’s surveys suggest that salinity may have been reduced in recent years and that this system is now in some stage of natural recovery related to restoration of freshwater flow levels in the river system after the 1999-2001 drought. The Panel agrees with Grabe and Janicki (2007) that for the purposes of setting an MFL, several of these benthic species may provide more information to the District than others. According to the researchers, Edotia montosa and Xenanthura brevitelson showed evidence of moving upstream during the dry season, when antecedent flows are typically lower than during the wet season and downstream during the wet season. Whereas, Laeonereis culveri showed some evidence of only being able to establish populations in the Anclote River during the dry season. The researchers suggest that subtidal populations of Polymesoda, perhaps more than intertidal populations, may expand their distribution upstream under reduced flows. In a previous District study of several southwest Florida rivers that did not include the nearby Anclote River, Corbicula fluminea, Rangia cuneata, and Neritina usnea were the only common species that occurred at salinities below 1 ppt (Montagna 2006). In these other rivers, C. fluminea was deemed the best indicator of freshwater habitat because densities were highest below 2 ppt. C. fluminea is an introduced exotic bivalve species that can survive salinities up to 13 ppt, though most occur in freshwater. R. cuneata has been noted as an indicator of a fresh-
_____________________________________________________________________________________________ Proposed Minimum Flows and Levels for Anclote River System Appendices Page 179 of 207
to brackish-water with an estimated tolerance of up to 20 ppt and a proclivity to reproduce after passing freshets. N. usnea is a gastropod that is also common in fresh- to brackish-water salinities. Polymesoda caroliniana is a native brackish water bivalve also from the Corbiculidae family. P. caroliniana was present at salinities between 1 and 20 ppt (Montagna 2006). P. caroliniana is a good indicator because it was present in all creeks sampled. The bivalve stout, Tagelus plebius, the oyster, Crassostrea virginica, as well as Mulinea lateralis, Littoraria irrorata, and Ischadium recurvum were also suggested as good indicators for brackish to seawater salinities. The wetland community adjacent to the river would likely also show signs of recovery after a drought or other restoration of freshwater streamflows, such as the conversion of brackish marsh to tidal fresh water swamp. There were no data provided in the District’s report that would help in understanding if this were occurring in response to some restoration of freshwater flow or other reason. This is important because the recommended minimum flows exceed the current management target for low flow in the seasonal Block 1 period. There were no obvious invasions of salt-sensitive vascular species into brackish or oligohaline marsh observed during the Panel’s visit to the site. In fact, the opposite was observed. An examination of aerial images of the river extending back before the large-scale removal of water from the aquifer might reveal if the process of change from freshwater swamp to brackish marsh preceded or occurred coincidentally with aquifer withdrawals through the wellfields. Ichthyoplankton and Fishes The general objective of the District’s fish analysis was to identify patterns of estuarine habitat use and organism abundance under variable freshwater inflow conditions and to evaluate responses. Systematic monitoring was performed by Greenwood et al. (2006) and the data used in the development of statistical regression equations that describe variation in organism distribution and abundance as a function of inflow variations. The regression models were evaluated with regard to their ability to predict the geographic center of abundance, the abundance of total organisms, and the relative abundance of a particular species, all as a function of freshwater inflow variations. The main limitation of the study was that it only involved a 12-month period from October 2004 to September 2005. Moreover, it contained an atypical “wet” season flow average of 505 cfs from July to September in 2004, while the average in the same seasonal flow block in 2005 was only 57 cfs. Greenwood et al. (2006) divided the tidal Anclote River and nearby Gulf of Mexico into six zones from which plankton net, seine net and trawl samples were taken on a monthly basis. Larval gobies and anchovies dominated the plankton net’s larval fish catch, including specifically Gobiosoma and Microgobius, the bay anchovy (Anchoa mitchilli, the silversides (Menidia spp.) and the skilletfish (Gobiesox strumosus). Interestingly, the researchers noted that juvenile spot (Leiostomus xanthurus), which are spawned far offshore and move landward during the late larval and early juvenile stages, were quite abundant relative to other tidal rivers they have sampled in west-central Florida. The plankton-net invertebrate catch was dominated by gammaridean amphipods, larval crabs (decapod zoeae), larval shrimps (decapod mysis) and by river plume taxa such as the copepods Acartia tonsa and Labidocera aestiva, the chaetognaths Sagitta spp., the planktonic shrimp Lucifer faxoni, and the ostracod Parasterope pollex.
_____________________________________________________________________________________________ Proposed Minimum Flows and Levels for Anclote River System Appendices Page 180 of 207
Seine fish collections were dominated by spot (Leiostomus xanuthurus), pinfish (Lagodon rhomboides), bay anchovy (Anchoa mitchilli), and mojarras (Eucinostomus spp.), which comprised over 84% of total seine catch of fishes. Fish collections from deeper, trawled areas were dominated by pinfish, spot, bay anchovy, and mojarras, which comprised over 86% of total trawl catch of fishes. The number of estuary-dependent species using the study area as a nursery was somewhat greater than resident taxa. Moreover, the researchers report that estuarine-dependents constituted nearly 86% of the total abundance of the top ten most abundant taxa in seined areas, and over 83% of total abundance of top ten taxa in trawled areas. These estuarine-dependents were mostly offshore spawners and included taxa of commercial importance (i.e., pink shrimp) and taxa of ecological importance due to high abundance (i.e., spot, pinfish, mojarras, and silver jenny). The juvenile nursery habitats for selected species were characterized by Greenwood et al. (2006) from seine and trawl data in terms of preference for shallower or deeper areas, zone of the study area, type of shoreline, and salinity. Based on plankton-net data, alteration of flows appear to have the lowest potential for impacting many taxa during the period from December through March, which is the period when the fewest estuarine taxa were present (Greenwood et al. 2006). The highest potential to impact many species would appear to be from June through October. Nearly 90 percent of the statistically significant responses produced by Greenwood et al. (2006) were negative (i.e., animals moved upstream with decreasing freshwater inflow). According to the researchers, the centers of abundance for these organisms may have shifted downstream during sampling periods that had higher inflows because individuals were seeking areas with more suitable salinities, then moved back upstream as freshwater inflows diminished. However, all 16 (42%) of the 38 plankton-net taxa exhibited positive statistical responses (i.e., increased abundance with increased inflow). None of the time lags in the plankton-net distribution responses were short enough to be considered a catchability response (i.e., organisms fleeing the effects of sudden floods and thereby becoming more vulnerable to collection) according to the researchers. A few lags were seasonal in nature, but most occurred over time frames that would be expected from true population responses. Among the 38 total taxa evaluated by Greenwood et al. (2006), the abundances of 60.5% were significantly related to average inflow. The researchers speculate that at low flows opportunities for either chemical detection of tidal nursery habitats or selective tidal-stream transport may be reduced, and at high flows, physical displacement may occur, or perhaps undesirable properties of fresher water (e.g., low pH) become more prominent. The Panel finds that the sampling of ichthyoplankton, fish and macroinvertebrates was thorough and appropriate, and data analyses and regression models were well developed. However, the effort was temporally limited to only one 12-month period and lacks the year-to-year variations necessary to really detect meaningful responses in longer lived organisms like fish, which are considered integrators of their environment’s fluctuations. Panel Recommendations for Future MFL Studies of the Anclote River
1. Water surface elevation measurements should be taken at all or many HEC-RAS cross-sections. As discussed previously, this is most easily done through surveying and
_____________________________________________________________________________________________ Proposed Minimum Flows and Levels for Anclote River System Appendices Page 181 of 207
installation of pressure transducers. Temporary benchmarks can be set up on the river bank, near the instruments.
2. Water depths at low flows. Fish passage is a problem if there is a feature (oxbow, lake,
nursery, gravel bar, etc.) that the fish are trying to get to and cannot because there is insufficient depth of water. All rivers are shallow in their upper reaches. Most fish migrate in and out of these areas only at certain times of the year; however, the 0.6-foot criterion is applied across all three seasonal blocks for the entire year. This is appropriate where species spawn at different times or at all times during the year. It would be useful to better understand the spawning and migratory habits of the species for which the 0.6 foot criterion was developed.
3. The District should consider use of two-dimensional (2-D) hydrodynamic models for its
minimum flows and levels studies. Data requirements for 2-D models are a little more onerous, but usually far less than the biological data requirements. A 2-D model requires good spatial coverage of the bathymetry through the entire model reach. For really shallow rivers this is not practical. For very long river segments, the CPU requirements for 2-D modeling need to be weighed against the potential benefits. 2-D models are much better at determining habitat connectivity and are more likely to get the in-channel hydrodynamics right for the fishes, macroinvertebrates, aquatic insects and plants that are so important to the riverine ecosystem.
4. An oft quoted statement by George Box says that “all models are wrong, but some are
useful.” In recognition of this fact, and a couple centuries of experience, the U.S. Army Corps of Engineers has instructed all its Districts to consider uncertainty in their projects, particularly those related to flood alleviation and ecosystem restoration. Determining the level of uncertainty in a model, or a cascade of models, is a normal procedure in some scientific disciplines, but it is only just beginning to be applied to water resources projects. The District should consider conducting quantitative uncertainty analyses on the models it uses for flow recommendations.
5. A detailed survey of the bivalves in the freshwater portion of the river should be
conducted periodically to verify the existence of native species and/or exotic bivalves.
6. There may need to be some metrics developed for the fauna and flora, including the freshwater fauna of the headwaters. How will their abundances and distributions change when river flows are restored under the recovery plan?
7. Aerial images of the river should be examined to determine if the loss of swamp forest
preceded the major withdrawal of water from the aquifer. The current status could be determined by conducting additional aerial images coupled with ground-truth data points for future reference.
8. The increasing salinities bring with them more marine conditions, including the invasion
of marine predators, parasites and disease organisms (Overstreet 1978 and Overstreet and Howse 1977). Theoretically, the District’s proposed MFL should help mitigate any negative impacts on the young of estuarine-dependent fish species from low flows during their peak seasonal utilization of estuarine nursery habitats in the springtime.
_____________________________________________________________________________________________ Proposed Minimum Flows and Levels for Anclote River System Appendices Page 182 of 207
Other Panel Comments The District is to be commended for their thorough response to the questions and data requests from the Panel Members after their initial reading of the District’s draft report. As the District moves forward to plan and supply water in the future to the people, their economy and their environment, the Panel strongly recommends that the District continue to monitor the system for the purpose of verifying that the MFL is having its intended effect of maintaining ecological health and productivity of the Anclote River and Estuary System. The verification monitoring should include streamflows, tidal flows, basic water quality (including temperature, salinity, pH, DO and chlorophyll), wetland vegetation, benthos, fish and shellfish, particularly during the dry season, which coincides with the beginning of peak utilization of nursery habitats by estuarine-dependent fish and shellfish species.
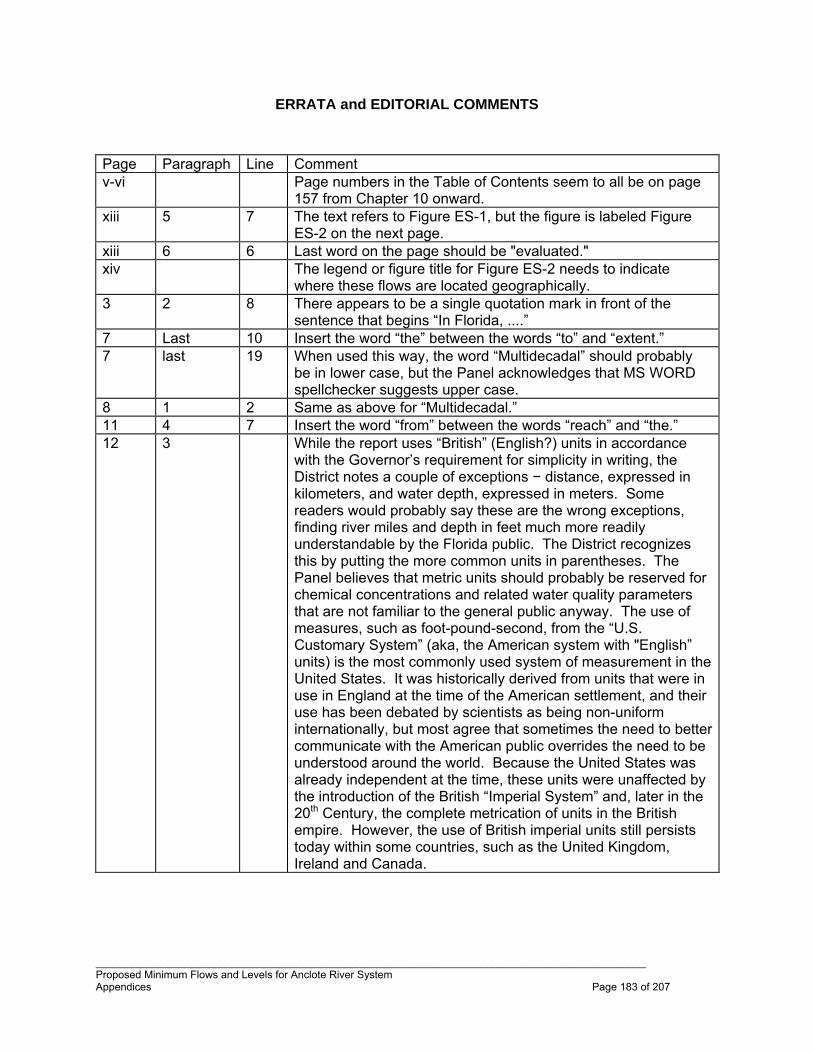
_____________________________________________________________________________________________ Proposed Minimum Flows and Levels for Anclote River System Appendices Page 183 of 207
ERRATA and EDITORIAL COMMENTS
Page Paragraph Line Comment v-vi Page numbers in the Table of Contents seem to all be on page
157 from Chapter 10 onward. xiii 5 7 The text refers to Figure ES-1, but the figure is labeled Figure
ES-2 on the next page. xiii 6 6 Last word on the page should be "evaluated." xiv The legend or figure title for Figure ES-2 needs to indicate
where these flows are located geographically. 3 2 8 There appears to be a single quotation mark in front of the
sentence that begins “In Florida, ....” 7 Last 10 Insert the word “the” between the words “to” and “extent.” 7 last 19 When used this way, the word “Multidecadal” should probably
be in lower case, but the Panel acknowledges that MS WORD spellchecker suggests upper case.
8 1 2 Same as above for “Multidecadal.” 11 4 7 Insert the word “from” between the words “reach” and “the.” 12 3 While the report uses “British” (English?) units in accordance
with the Governor’s requirement for simplicity in writing, the District notes a couple of exceptions − distance, expressed in kilometers, and water depth, expressed in meters. Some readers would probably say these are the wrong exceptions, finding river miles and depth in feet much more readily understandable by the Florida public. The District recognizes this by putting the more common units in parentheses. The Panel believes that metric units should probably be reserved for chemical concentrations and related water quality parameters that are not familiar to the general public anyway. The use of measures, such as foot-pound-second, from the “U.S. Customary System” (aka, the American system with "English” units) is the most commonly used system of measurement in the United States. It was historically derived from units that were in use in England at the time of the American settlement, and their use has been debated by scientists as being non-uniform internationally, but most agree that sometimes the need to better communicate with the American public overrides the need to be understood around the world. Because the United States was already independent at the time, these units were unaffected by the introduction of the British “Imperial System” and, later in the 20th Century, the complete metrication of units in the British empire. However, the use of British imperial units still persists today within some countries, such as the United Kingdom, Ireland and Canada.
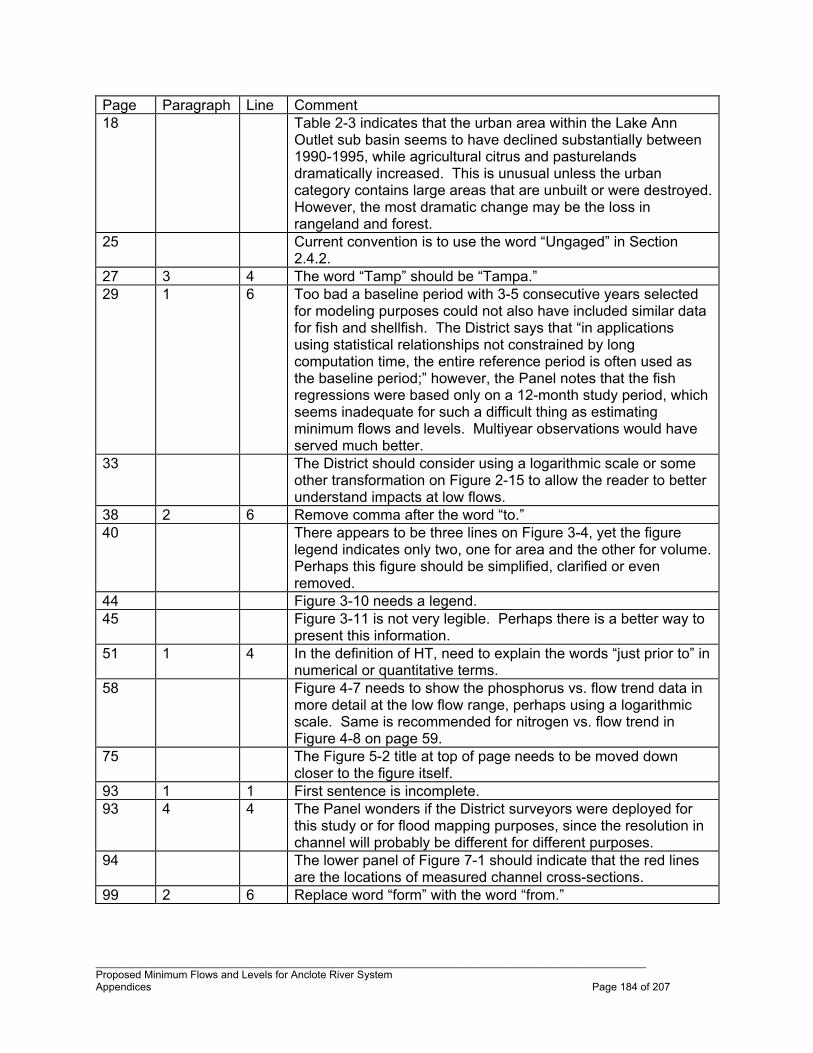
_____________________________________________________________________________________________ Proposed Minimum Flows and Levels for Anclote River System Appendices Page 184 of 207
Page Paragraph Line Comment 18 Table 2-3 indicates that the urban area within the Lake Ann
Outlet sub basin seems to have declined substantially between 1990-1995, while agricultural citrus and pasturelands dramatically increased. This is unusual unless the urban category contains large areas that are unbuilt or were destroyed. However, the most dramatic change may be the loss in rangeland and forest.
25 Current convention is to use the word “Ungaged” in Section 2.4.2.
27 3 4 The word “Tamp” should be “Tampa.” 29 1 6 Too bad a baseline period with 3-5 consecutive years selected
for modeling purposes could not also have included similar data for fish and shellfish. The District says that “in applications using statistical relationships not constrained by long computation time, the entire reference period is often used as the baseline period;” however, the Panel notes that the fish regressions were based only on a 12-month study period, which seems inadequate for such a difficult thing as estimating minimum flows and levels. Multiyear observations would have served much better.
33 The District should consider using a logarithmic scale or some other transformation on Figure 2-15 to allow the reader to better understand impacts at low flows.
38 2 6 Remove comma after the word “to.” 40 There appears to be three lines on Figure 3-4, yet the figure
legend indicates only two, one for area and the other for volume. Perhaps this figure should be simplified, clarified or even removed.
44 Figure 3-10 needs a legend. 45 Figure 3-11 is not very legible. Perhaps there is a better way to
present this information. 51 1 4 In the definition of HT, need to explain the words “just prior to” in
numerical or quantitative terms. 58 Figure 4-7 needs to show the phosphorus vs. flow trend data in
more detail at the low flow range, perhaps using a logarithmic scale. Same is recommended for nitrogen vs. flow trend in Figure 4-8 on page 59.
75 The Figure 5-2 title at top of page needs to be moved down closer to the figure itself.
93 1 1 First sentence is incomplete. 93 4 4 The Panel wonders if the District surveyors were deployed for
this study or for flood mapping purposes, since the resolution in channel will probably be different for different purposes.
94 The lower panel of Figure 7-1 should indicate that the red lines are the locations of measured channel cross-sections.
99 2 6 Replace word “form” with the word “from.”
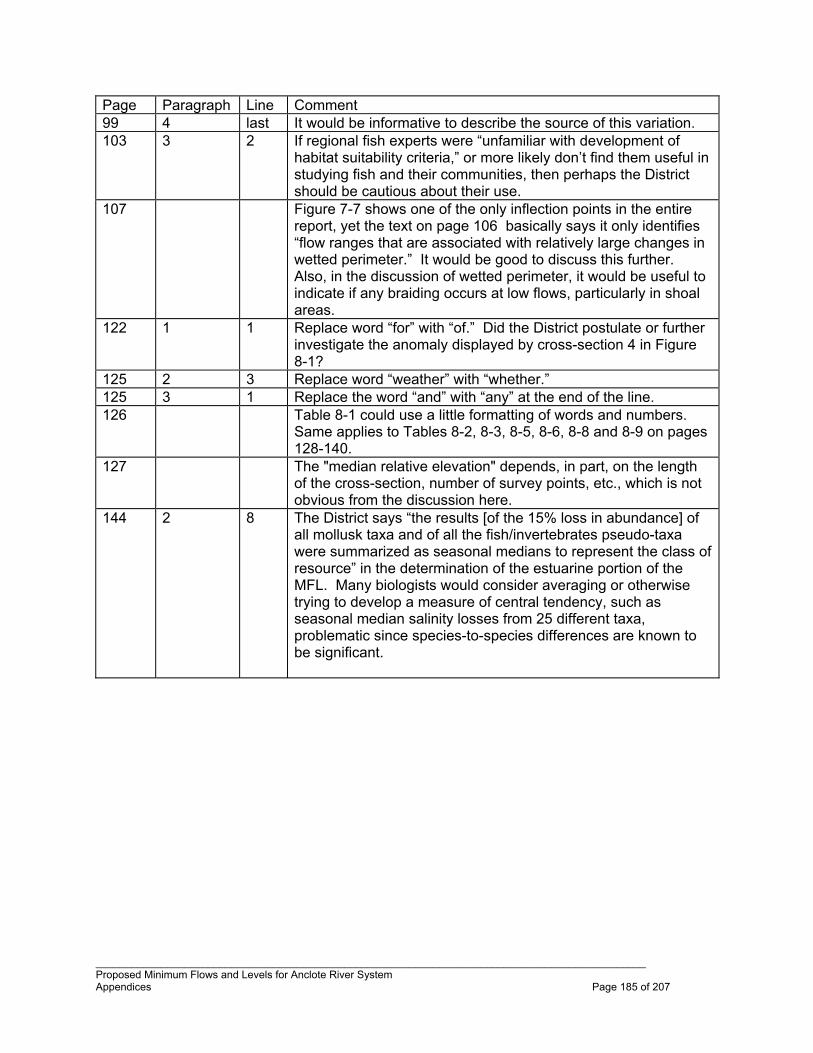
_____________________________________________________________________________________________ Proposed Minimum Flows and Levels for Anclote River System Appendices Page 185 of 207
Page Paragraph Line Comment 99 4 last It would be informative to describe the source of this variation. 103 3 2 If regional fish experts were “unfamiliar with development of
habitat suitability criteria,” or more likely don’t find them useful in studying fish and their communities, then perhaps the District should be cautious about their use.
107 Figure 7-7 shows one of the only inflection points in the entire report, yet the text on page 106 basically says it only identifies “flow ranges that are associated with relatively large changes in wetted perimeter.” It would be good to discuss this further. Also, in the discussion of wetted perimeter, it would be useful to indicate if any braiding occurs at low flows, particularly in shoal areas.
122 1 1 Replace word “for” with “of.” Did the District postulate or further investigate the anomaly displayed by cross-section 4 in Figure 8-1?
125 2 3 Replace word “weather” with “whether.” 125 3 1 Replace the word “and” with “any” at the end of the line. 126 Table 8-1 could use a little formatting of words and numbers.
Same applies to Tables 8-2, 8-3, 8-5, 8-6, 8-8 and 8-9 on pages 128-140.
127 The "median relative elevation" depends, in part, on the length of the cross-section, number of survey points, etc., which is not obvious from the discussion here.
144 2 8 The District says “the results [of the 15% loss in abundance] of all mollusk taxa and of all the fish/invertebrates pseudo-taxa were summarized as seasonal medians to represent the class of resource” in the determination of the estuarine portion of the MFL. Many biologists would consider averaging or otherwise trying to develop a measure of central tendency, such as seasonal median salinity losses from 25 different taxa, problematic since species-to-species differences are known to be significant.
_____________________________________________________________________________________________ Proposed Minimum Flows and Levels for Anclote River System Appendices Page 186 of 207
REFERENCES
Alber, M. 2002. A Conceptual Model of Estuarine Inflow Management. Estuaries 25: 1246-1261.
Ardisson, P.-L., and E. Bourget. 1997. A study of the relationship between freshwater runoff
and benthos abundance: a scale-oriented approach. Estuarine, Coastal and Shelf Science 45: 535-545.
Bass, D. G., Jr., and V. G. Hitt. 1974. Utilization of the Asiatic clam, Corbicula marzilertsis, by
game fishes in Florida. Unplublished report, Florida Game and Fresh Water Fish Commission, Lake City. 7 pp.
Blalock, H.N., and J.J. Herod. 1999. A Comparative Study of Stream Habitat and Substrate
Utilized by Corbicula fluminea in the New River, Florida. Florida Scientist 62:145-151. Castleberry, D. T., J. J. Cech, Jr., D. C. Erman, D. Hankin, M. Healey, G. M. Kondolf, M.
Mangel, M. Mohr, P. B. Moyle, J. Nielsen, T. P. Speed, and J. G. Williams. 1996. Uncertainty and instream flow standards. Fisheries 21: 20-21.
Drinkwater, K. F., and K. T. Frank. 1994. Effects of river regulation and diversion on marine fish
and invertebrates. Aquatic Conservation: Freshwater and Marine Ecosystems 4: 135-151.
Estevez, E.D., and B.D. Robbins. 2006. Anclote River Mollusk and Vegetation Survey.
Submitted to the Southwest Florida Water Management District by the Mote Marine Laboratory, Sarasota, FL. 62 pp.
Flannery, M. S., E. B. Peebles and R. T. Montgomery. 2002. A Percentage-of-Streamflow
Approach for Managing Reductions of Freshwater Inflows from Unimpounded Rivers to Southwest Florida Estuaries. Estuaries 25: 1318-1332.
Gabe, S.A., and A. Janicki. 2007. Analysis of Benthic Community Structure and its Relationship
to Freshwater Inflows in the Anclote River. Submitted to the Southwest Florida Water Management District by Janicki Environmental, Inc.,
St. Petersburg, FL. 31 pp. Gard, M. 2009. Demonstration Flow Assessment and 2-D Modeling: Perspectives Based on
Instream Flow Studies and Evaluation of Restoration Projects. Fisheries 34: 320-329. Greenwood, M.F.D., E.B. Peebles, T.C. MacDonald, S.E. Burghart, R.E. Matheson, Jr. and R.H.
McMichael, Jr. 2006. Freshwater Inflow Effects on Fishes and Invertebrates in the Anclote River Estuary. Submitted to the Southwest Florida Water Management District by the Florida Fish and Wildlife Conservation Commission and the University of South Florida at St. Petersburg, FL. 56 pp.

_____________________________________________________________________________________________ Proposed Minimum Flows and Levels for Anclote River System Appendices Page 187 of 207
Longley, William L., (ed.) et al. 1994. Freshwater Inflows to Texas Bays and Estuaries:
Ecological Relationships and Methods for Determination of Needs. Texas Water Development Board and Texas Parks and Wildlife Department, Austin, TX. 386 pp.
McMahon, R. F. 1983. Ecology of an invasive pest bivalve, Corbicula. pp. 505-561 in W. D.
Russell-Hunter, editor. The mollusca. Ecology. Academic Press, New York. Milhous, R. T., D. L. Wegner, and T. Waddle. 1984. User's guide to the Physical Habitat
Simulation System (PHABSIM). Instream Flow Information Paper No. 11, FWS/OBS-81/43 Revised. Prepared by Instream Flow and Aquatic Systems Group, U. S. Fish and Wildlife Service, Fort Collins, Colorado and U. S. Bureau of Reclamation, Upper Colorado Region, Salt Lake City, Utah for U. S. Fish and Wildlife Service, Washington, D. C.
Montagna, Paul, 2006, A Multivariate Statistical Analysis of Relationships Between Freshwater
Inflows and Mollusk Distributions in Tidal Rivers in Southwest Florida. Submitted by Harte Research Institute for Gulf of Mexico Studies, Texas A&M University to the Southwest Florida Water Management District, Brooksville, FL. 50 pp.
National Academy of Science. 2005. The Science of Instream Flows: A Review of the Texas
Instream Flow Program. Submitted by the Committee on Review of Methods for Establishing Instream Flows for Texas Rivers, Water Science and Technology Board, Division on Earth and Life Studies, National Research Council, Wash., D.C. 126 pp.
Overstreet, R. M., and H. D. Howse. 1977. Some Parasites and Diseases of Estuarine Fishes
in Polluted Habitats of Mississippi. Annals of the New York Academy of Sciences, 298: 427-462.
Overstreet, R. M. 1978. Marine Maladies: Worms, Germs, and Other Symbionts From the
Northern Gulf of Mexico. Mississippi-Alabama Sea Grant Consortium, MASGP-78-021, 140 pp.
Poff, N. L., J. D. Allan, M. B. Bain, J. R. Karr, K. L. Prestegaard, B. D. Richter, R. E. Sparks and
J. C. Stromberg. 1997. The Natural Flow Regime: A Paradigm for River Conservation and Restoration. BioScience 47: 769-784.
Railsback, S.F., and J. Kadvany. 2008. Demonstration Flow Assessment: Judgment and
Visual Observation in Instream Flow Studies. Fisheries 33: 217-227. Richter, B. D., J. V. Baumgartner, R. Wigington and D. P. Braun. 1997. How Much Water Does
a River Need? Freshwater Biology 37: 231-249. Sklar, F. H., and J. A. Browder. 1998. Coastal Environmental Impacts Brought About by
Alterations to Freshwater Flow in the Gulf of Mexico. Environmental Management 22: 547-562.
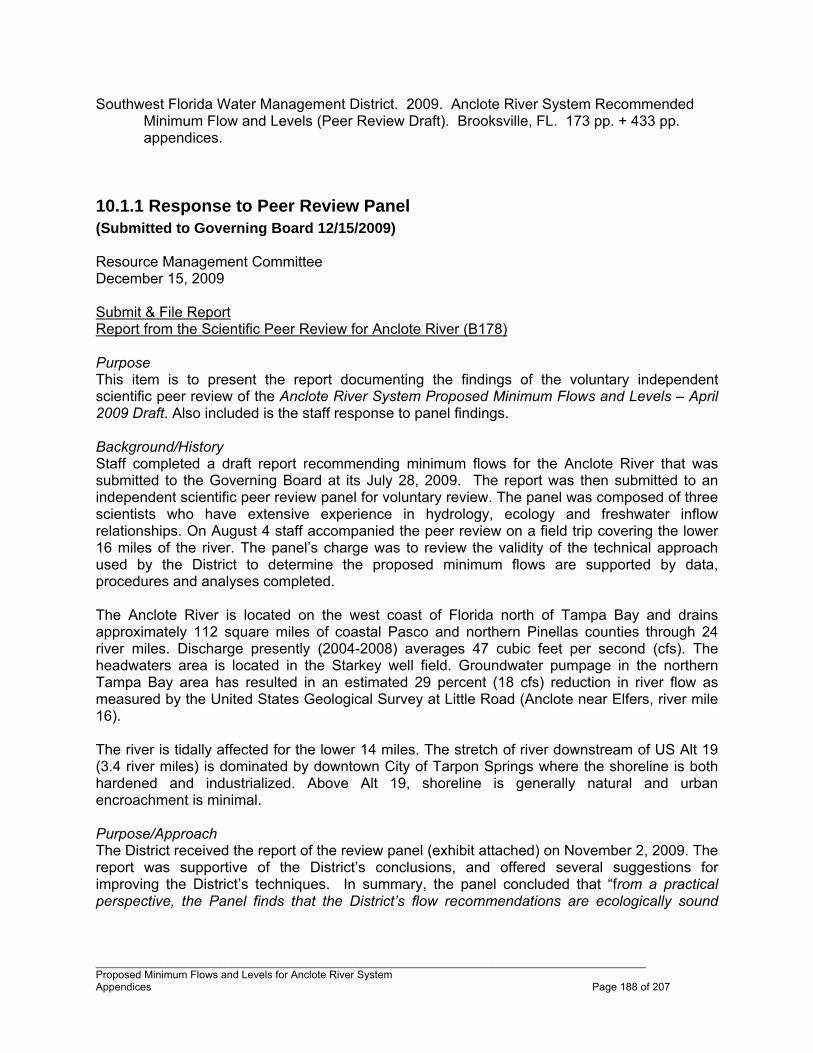
_____________________________________________________________________________________________ Proposed Minimum Flows and Levels for Anclote River System Appendices Page 188 of 207
Southwest Florida Water Management District. 2009. Anclote River System Recommended Minimum Flow and Levels (Peer Review Draft). Brooksville, FL. 173 pp. + 433 pp. appendices.
10.1.1 Response to Peer Review Panel (Submitted to Governing Board 12/15/2009) Resource Management Committee December 15, 2009 Submit & File Report Report from the Scientific Peer Review for Anclote River (B178) Purpose This item is to present the report documenting the findings of the voluntary independent scientific peer review of the Anclote River System Proposed Minimum Flows and Levels – April 2009 Draft. Also included is the staff response to panel findings. Background/History Staff completed a draft report recommending minimum flows for the Anclote River that was submitted to the Governing Board at its July 28, 2009. The report was then submitted to an independent scientific peer review panel for voluntary review. The panel was composed of three scientists who have extensive experience in hydrology, ecology and freshwater inflow relationships. On August 4 staff accompanied the peer review on a field trip covering the lower 16 miles of the river. The panel’s charge was to review the validity of the technical approach used by the District to determine the proposed minimum flows are supported by data, procedures and analyses completed. The Anclote River is located on the west coast of Florida north of Tampa Bay and drains approximately 112 square miles of coastal Pasco and northern Pinellas counties through 24 river miles. Discharge presently (2004-2008) averages 47 cubic feet per second (cfs). The headwaters area is located in the Starkey well field. Groundwater pumpage in the northern Tampa Bay area has resulted in an estimated 29 percent (18 cfs) reduction in river flow as measured by the United States Geological Survey at Little Road (Anclote near Elfers, river mile 16). The river is tidally affected for the lower 14 miles. The stretch of river downstream of US Alt 19 (3.4 river miles) is dominated by downtown City of Tarpon Springs where the shoreline is both hardened and industrialized. Above Alt 19, shoreline is generally natural and urban encroachment is minimal. Purpose/Approach The District received the report of the review panel (exhibit attached) on November 2, 2009. The report was supportive of the District’s conclusions, and offered several suggestions for improving the District’s techniques. In summary, the panel concluded that “from a practical perspective, the Panel finds that the District’s flow recommendations are ecologically sound
_____________________________________________________________________________________________ Proposed Minimum Flows and Levels for Anclote River System Appendices Page 189 of 207
primarily because they are based on a small alteration to the naturalized flow regime. . . The District approached this analysis in an appropriately holistic manner; that is, with attention paid to both the ecological requirements of the river system and to the various segments of the landscape already modified by humans.” The report goes to state, “The Panel finds that the District’s goals, data, methods and conclusions, as developed and explained in the MFL report, are reasonable and appropriate. The District’s multi-species approach is to be applauded because it does not ignore species with variable life history requirements. “ The Panel did, however question whether the District had obtained sufficient flow data to calibrate the hydraulic model used to establish the low flow threshold and questioned whether the uncertainty of the model calibration was sufficient for this use. The Panel also suggested that the District consider alternatives to the modeling approached used to establish the freshwater MFLs. And as previous review panels have suggested . . . “the Panel strongly recommends that the District continue to monitor the system for the purpose of verifying that the MFL is having its intended effect of maintaining the ecological health and production of this waterway.” District Response to Peer Review Recommendations “The District notes that a recovery plan is already in place for the Northern Tampa Bay Area; therefore, no further recovery strategy is recommended by the District until the existing strategy can be fully evaluated in the future with regard to its success at increasing flows in the Anclote River. The Panel believes that this matter should be evaluated year-to-year, with major reviews every five (5) years or so.” The District monitors groundwater pumpage affecting the Anclote River on a monthly basis and will update the impacts to flow on an annual basis. “With regard to the limitations of the hydraulic model : This is because the hydraulic model has an error of at least +/- 0.5 feet in water surface elevation, yet the District’s flow recommendation is based, in part, on there being 0.6 feet of water or more at some point across all of the river’s cross-sections. If having sufficient water for fish passage is so important, and the Panel agrees, then the District needs to go out with a surveying rod when the flow is at or near 12 cfs for the purposes of verifying that the depth of water is at least 0.6 feet for the entire reach (or all cross-sections). . . . . Instream flow studies usually involve the deployment of depth-sounders at intervals along the study reach. These depth-sounders monitor variations in water surface elevation . . .” Staff agrees with this recommendation and will complete the recommended measurements. As a result of requests for additional information, the District has purchased and deployed continuous depth monitors in several systems undergoing data collection for future MFL determinations. “The report states that the identification of shoal locations is the study reach was important for PHABSIM analyses (page 95), yet it is unclear if HEC-RAS cross-sections have been set up at these locations. . . . Interestingly, one of the PHABSIM survey sites was called “Waterfall” (page 124, SWFWMD 2009). If indeed a waterfall is present on the main stem of the Anclote River
_____________________________________________________________________________________________ Proposed Minimum Flows and Levels for Anclote River System Appendices Page 190 of 207
that would seem to be a greater impediment to fish migration than the deepest point of a channel cross-section being shallower than 0.6 feet.” The ‘waterfall’ site was included as a Hydrologic Engineering Center – River Analysis System (HEC-RAS) cross-section for the reasons noted by the panel. As part of the Physical Habitat Simulation Model (PHABSIM) site selection methodology, the entire river study reach was reconnoitered for areas that show obvious hydraulic control points such as shoals and for the Anclote River, three sites were eventually chosen one of which was termed “waterfall” because of a visible drop in water level. All transect cross-sections, whether intended for vegetation or soils analyses along the floodplain or PHABSIM analyses were all utilized for HEC-RAS analyses. With regard to the panel’s general recommendation that the District investigate alternatives to HEC-RAS/PHABSIM, PHABSIM remains the most widely used model despite its known limitations. Even though several staff members have attended formal training in River-2D and continue to monitor the literature for widely accepted alternatives, for the present time staff recommendation is to continue using PHABSIM. Staff Recommendation: This item is provided for the Committee's information, and no action is required. Presenter: Mike Heyl, Chief Environmental Scientist Resource Projects Department D:\Anclote\Report\Final\Anclote_MFL_Final.doc 2/22/2010 11:01 AM cc: Ecologic Evaluation Project File
PRJ File
10.2 Peer Review Dr. B Austin - email inquiry and District response Excerpts from B. Austin email to M.Heyl regarding Anclote MFL Peer Review I've been going through the Anclote River MFL report and have a few questions related to the hydrology and hydraulics: 1) How was Manning's n determined for each cross-section and was it varied between flow rates (to aid calibration), or held constant for the full range of flows? 6Manning’s was held constant for the whole range of flows and not varied between flow rates. Initially Manning’s was selected based on other models developed in the SWFWMD such as the Hillsborough River Model developed by USGS. The model was over predicting continuously so manning’s was reduced in channel, though held to numbers similar to the ones used on the Hillsborough and the Braden Rivers in the
6 District responses is blue italic font
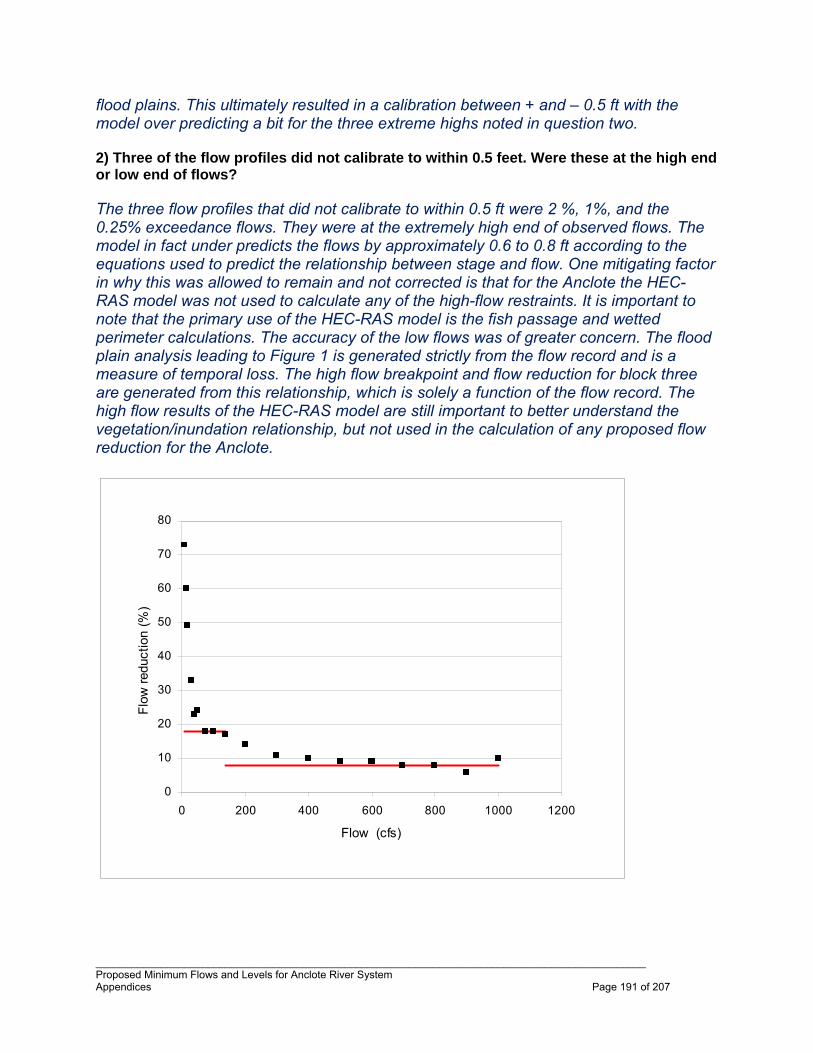
_____________________________________________________________________________________________ Proposed Minimum Flows and Levels for Anclote River System Appendices Page 191 of 207
flood plains. This ultimately resulted in a calibration between + and – 0.5 ft with the model over predicting a bit for the three extreme highs noted in question two. 2) Three of the flow profiles did not calibrate to within 0.5 feet. Were these at the high end or low end of flows? The three flow profiles that did not calibrate to within 0.5 ft were 2 %, 1%, and the 0.25% exceedance flows. They were at the extremely high end of observed flows. The model in fact under predicts the flows by approximately 0.6 to 0.8 ft according to the equations used to predict the relationship between stage and flow. One mitigating factor in why this was allowed to remain and not corrected is that for the Anclote the HEC-RAS model was not used to calculate any of the high-flow restraints. It is important to note that the primary use of the HEC-RAS model is the fish passage and wetted perimeter calculations. The accuracy of the low flows was of greater concern. The flood plain analysis leading to Figure 1 is generated strictly from the flow record and is a measure of temporal loss. The high flow breakpoint and flow reduction for block three are generated from this relationship, which is solely a function of the flow record. The high flow results of the HEC-RAS model are still important to better understand the vegetation/inundation relationship, but not used in the calculation of any proposed flow reduction for the Anclote.
0
10
20
30
40
50
60
70
80
0 200 400 600 800 1000 1200
Flow (cfs)
Flo
w r
educ
tion
(%)
_____________________________________________________________________________________________ Proposed Minimum Flows and Levels for Anclote River System Appendices Page 192 of 207
Figure 1. Flow vs. percent flow reduction necessary to result in a 15% reduction in days the flow is exceeded. 3) Further to #2, can you please clarify what is meant by the following: “However, the elevations predicted by the model are within the range of elevation observed at the gauge during similar flow conditions. Recorded elevations during these flow conditions are few due to the short gauge record and vary by nearly 1.5 ft.” (p. 99, end of third full paragraph). One of the difficulties in generating a model for the Anclote was a lack of suitable data. For instance, the upstream gage (USGS near Odessa) had two periods of record; one period from 1983 to 1994 where both stage and flow were measured and a more recent period (6/11/2004-8/6/2009) during which only stage is measured. Further, the gage was relocated between periods so comparisons are not easily possible. The new gage location has been moved further up the channel, and culverts arenow located between the new site and the old site and that there is a steep drop off. Because, the 1983 to 1994 period represented a longer record and was the only period for which flow was available at both gages to generate proportionality of flow from upstream to downstream, it was used for the period of record. Since the cross-sections in the model are newer, they do not necessarily represent the channel configuration during the 1983 to 1994 conditions. The District understands that is a source of potential error. Regardless, as mentioned in the response to question two, the flows that failed to calibrate well were very high flows with limited observations. 4) Were water surface elevation measurements taken at the PHABSIM cross-sections? If so, were they taken at the flow rates simulated with HEC-RAS? And if so, were they used to help model calibration? Each PHABSIM location consists of three cross-sections. Elevations are taken at all three so that change in water surface elevation can be calculated for the PHABSIM model runs. However, until very recently the District did not survey in PHABSIM locations relative to any vertical datum. Therefore, the elevations taken on the Anclote River could not be used for model calibration/verification. The District has more recently recognized the value of having absolute elevations and has adopted the practice of utilizing these to assist with model development. However, this was not the case when the PHABSIM data was collected for the Anclote. 5) Along the lines of #4, were any depth recorders deployed at cross-sections during the field work to help model verification? No but this is an excellent suggestion. As mentioned above the District has recently been improving the steps taken for model validation and the deployment of depth recorders for durations, especially those capturing a range of flow conditions, would be a useful.

_____________________________________________________________________________________________ Proposed Minimum Flows and Levels for Anclote River System Appendices Page 193 of 207
6) The 0.5-foot criteria is reasonable for floodplain modeling, but one would think calibration should be tighter for flow within the channel. In a small, shallow channel such as the Anclote, 6 inches would seem to be very important, at least in terms of habitat availability and fish passage criteria. Can you discuss this further? Specifically, why parameters in the HEC-RAS model were not tweaked further in order to get the water surface elevation more closely aligned with observations. It is desirable to have a high degree of accuracy when dealing with the low flows for MFL development. As noted above this point is well made. At the time the Anclote model was constructed one constraint was the availability of detailed instream cross-section data. Vegetative cross sections are limited in channel detail and PHABSIM cross sections were not surveyed to true elevations. Some data was gathered by staff and used to improve the level of detail available within the channel, but the survey available for the freshwater portion of the Anclote was limited. The limitation in the detail of the in stream data was discussed, but it was concluded that the model would be made using the best available data. As mentioned above, this is further complicated by the flow data being collected 10 to 20 years before the cross-sections were surveyed. 7) The aerial photographs of the basin seem to indicate some river channelization in parts (see figures on Page 94). Was this taken into account at all, in either the hydraulic model, or the assessment of habitat availability? Or perhaps there was no discernable difference between the natural or engineered channel in terms of velocity-depth relationship and habitat availability. Either way, please comment. These are artifacts from the GIS layer that represents NHD flow lines, but not the actual river. Staff have attached another image - this time of the 1:100,000 stream coverage and you can see that these photo-interpreters could not follow either the Anclote or the Pithlachascotee (the bridge crossing we visited on the way back to Tampa) in this region. I tried to connect the blue line stream coverage with a dotted yellow line to illustrate where I would look for the river (in the middle of the green corridor). I also marked the approximate location of the two bridge crossings.
_____________________________________________________________________________________________ Proposed Minimum Flows and Levels for Anclote River System Appendices Page 194 of 207
10.3 Review Comments from Florida Department of Environmental Protection and District Response.
SWFWMD Response to DEP Comments Anclote River System Recommended MFL
Peer Review Draft – June 2009
General Comments 1. The report uses many different 15% criteria for looking at harm: Agreed
a loss of more than 15% habitat [unclear which habitat characteristic is being
looked at] (p. 4), Reference is intended to be generic.7
a maximum of 15% change in habitat availability or ecological resource (p. 5),
a 15% loss [of what?] for the purpose of MFLs development (p. 5), See prior sentence for reference to ‘habitat availability of ecological resource’
flow reduction producing a 15% decline in abundance (p. 91),
greater than a 15% reduction in habitat [which characteristic?] from historic conditions (p. 101), See Gore et al. 2002. This is a generic reference to freshwater habitat.
greater than a 15% reduction in the number of days of inundation from historic conditions (p. 104),
a 15% reduction in the number of days that flows on the Alafia, middle Peace, and Myakka rivers are reached (p. 105),
a 15% reduction in the number of days the flow is reached (p. 105)
a 15% loss of habitat defined as a reduction of no more than 15% of the number of days of inundation from direct river flow for the entire year, after prescribed flow reductions for Blocks 1 and 3 were applied (p. 109),
a 15% change in habitat availability based on a reduction in spatial extent of habitat (p. 109),
a 15% change in habitat availability based on number of days a particular habitat is inundated (p. 109)
a 15% reduction from baseline abundance (p. 110),
a 15% reduction in the peak abundance (p. 113),
7 District responses in blue italic font.
_____________________________________________________________________________________________ Proposed Minimum Flows and Levels for Anclote River System Appendices Page 195 of 207
salinity associated with 15% reductance [sic] in abundance (p. 114),
a 15% reduction in peak diversity (p. 115),
the relative reduction in flow from the prescribed baseline flow to the adjusted flow associated with a 15% reduction in volume (p. 117)
the 15% exceedance flow (p. 126),
exceeding a 15% loss of days of connection (p. 126),
a decrease of 15% or more in the number of days that flows would inundate floodplain features (p. 126),
a 15% reduction in the number of days of inundation of the median elevation of selected floodplain attributes (p. 133),
a 15% loss of the number of days river flows reached a range of flows (p. 133),
15% reduction in the number of days of flow sufficient to inundate the mean feature elevations (p. 134),
a 15% or less reduction in the number of days the features are inundated (p. 135),
15% reduction in the number of days of inundation of exposed root habitat over the entire year (p. 136),
a 15% loss of days of inundation of woody habitat (p. 141),
a 15% loss of resource [which resource?] (p. 145), and Refers to the resources listed in the table – eg. total taxa, mollusc abundance, etc. Legend will be edited to read ‘15% loss of habitat of resource.’
15% salinity increase (p. 145) It is not clear how these many criteria are used to determine the MFL. Are any of these criteria equivalent? Are different criteria used for different habitats and then the most conservative criterion is chosen, or are these measures integrated in some other way? A better description of the methodology is needed. Generally, all of the evaluations are given equal consideration and the most protective result is used. For example, the yellow highlighted cells in Table 8-11 are the ones used for the estuarine MFL. Median values are used to represent the fish/invertebrate community and the mollusc community. Figure 8-12 illustrates the habitats and resources evaluated and shows the basis of the 11.5% for Block 1.
2. This report differs in several ways from other MFL reports produced by the district. For example:
The report does not have figures showing bathymetric and morphometric
information. This information would help the reader better understand transport and residence. Do these data exist? River morphometry is shown in Figures
_____________________________________________________________________________________________ Proposed Minimum Flows and Levels for Anclote River System Appendices Page 196 of 207
3-3, 3-5 and 3-6. A description of the bathymetric data collected for this study will be included in the final report.
Although Chapter 6 mentions most of the resource values found in Section 62-40.473(1), F.A.C., very few are explicitly evaluated in the report. Agree. The MFL protocol used by SWFWMD is focused on habitat and biological resources.
The text is confusing at times (see comments 11 and 13-16), and often seems to leave data interpretation up to the reader rather than reporting the district’s methods and findings (as in comment 1). For example, in Block 3, allowing an 18% removal when flows are between 12 and 137 cfs, and only an 8% removal when flows exceed 137 cfs may preserve the flood regime, but this goal is not explicitly stated in the text. These values are based on the number of inundation days – see discussion commencing on page 135. In particular, see Figure 8-7 for derivation of break points and percentages. Furthermore, principles 7 and 8 on page 3 state: “[i]t is better to retain certain floods at full magnitude and to eliminate others entirely than to preserve all or most floods at diminished levels,” and “[t]he first flood (or one of the first) of the wet season should be fully retained.” Does the MFL fully retain the first flood (or one of the first) of the wet season? No. The District’s approach does not distinguish between the order of flood events.The District’s approach strives to minatin a high percentage of the high flow event A description of how these principles are integrated into this MFL determination would be helpful.
In addition, it would be helpful to cross-reference the appendices with appropriate places in the text. Also, because there are 433 pages, it would be helpful to have a table of contents for this document. Comment noted. The final published volume of appendices will have a dual numbering system keyed to the table of contents. The first being the numbering system of the parent document and the second will be a continuous numbering system of appendix pages.
3. Since the Anclote River’s recovery is to be covered by the Northern Tampa Bay (NTB)
Recovery Plan, the report should describe what this plan is and discuss its status. Agreed. A description will be incorporated into the final report. This discussion should include what is and isn’t known about the impacts from the NTB Plan’s first phase, what the anticipated monitoring schedule for the river is, how the river’s recovery fits into the second phase of the plan, and what will happen if recovery is not being achieved.
Specific Comments
4. (p. 25) The report does not quantify the municipal wastewater discharge from the facility at
Rkm 5.6. Noted and corrected. How do the wastewater returns fit into the development of the estuary’s MFL? Neither the ungauged runoff, nor the wastewater discharge was explicitly factored into the MFL but their existence affects the slope of the salinity to gauged flow. The MFL was based on the most downstream USGS discharge station.

_____________________________________________________________________________________________ Proposed Minimum Flows and Levels for Anclote River System Appendices Page 197 of 207
5. (p. 42) The report describes the sharp increase in shoreline length at Rkm 5 and 12. Why
does the shoreline length also sharply increase between Rkm 15 and 18? Primarily because of the islands and the multiple meanders in the braided section of the river.
6. (p. 48, paragraph 1) If conductivity was measured every meter, why were only the near
surface and bottom measurements considered? With rare exceptions, the bottom salinity is greater than the surface and is the salinity encountered by the benthic community. Surface salinity was used to determine the magnitude of stratification and the relationship of flow to stratification. ‘Average’ salinity, where used, is the arithmetic mean of all salinity observations in the profile.
7. (p. 57, last paragraph) It seems this paragraph should refer to the residuals graph, rather
than the time series plot, since the trends occur “irrespective of flow” (see p. 55, paragraph 1, line 5). Comment not understood. Both Figure 4-7c and 4-8c contain the residuals plotted as function of time. The residuals represent the concentration that cannot be explained by flow – which is then plotted and statistically evaluated as a function of time.
8. (pp. 59 & 64 ) It would help the reader, and improve the document’s clarity, if the graphs for
Figures 4-8 and 4-12 were presented in the same order as the rest of the graphs in these series. Noted and corrected.
9. (p. 60) Regarding the spike in chemical constituents during the 1999-2000 drought, could
the spike be caused by an unusually far tidal reach during this period? Unlikely as the nutrient concentrations observed in the spike are orders of magnitude higher than normal for Gulf coastal waters. Figure 2-13 (p. 31) shows a very low flow in the river during the drought, while Figure 2-10 (p. 26) shows high groundwater withdrawals in the basin. Might groundwater withdrawals during the drought make less water available for discharge from the springs? Are there any data from nearby wells indicating the presence of these constituents in the groundwater?
10. (p. 94) Where are the shoal transects located in Figure 7-2? See Figure Below. Final
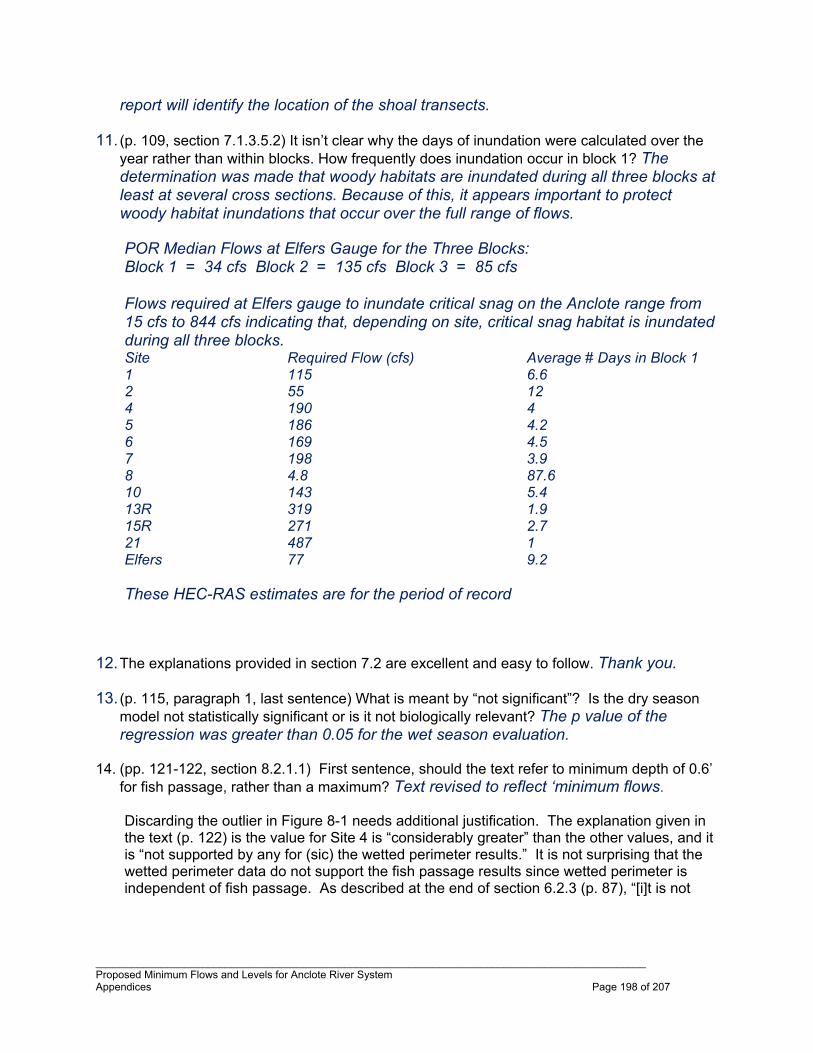
_____________________________________________________________________________________________ Proposed Minimum Flows and Levels for Anclote River System Appendices Page 198 of 207
report will identify the location of the shoal transects.
11. (p. 109, section 7.1.3.5.2) It isn’t clear why the days of inundation were calculated over the year rather than within blocks. How frequently does inundation occur in block 1? The determination was made that woody habitats are inundated during all three blocks at least at several cross sections. Because of this, it appears important to protect woody habitat inundations that occur over the full range of flows.
POR Median Flows at Elfers Gauge for the Three Blocks: Block 1 = 34 cfs Block 2 = 135 cfs Block 3 = 85 cfs Flows required at Elfers gauge to inundate critical snag on the Anclote range from 15 cfs to 844 cfs indicating that, depending on site, critical snag habitat is inundated during all three blocks. Site Required Flow (cfs) Average # Days in Block 1 1 115 6.6 2 55 12 4 190 4 5 186 4.2 6 169 4.5 7 198 3.9 8 4.8 87.6 10 143 5.4 13R 319 1.9 15R 271 2.7 21 487 1 Elfers 77 9.2 These HEC-RAS estimates are for the period of record
12. The explanations provided in section 7.2 are excellent and easy to follow. Thank you.
13. (p. 115, paragraph 1, last sentence) What is meant by “not significant”? Is the dry season model not statistically significant or is it not biologically relevant? The p value of the regression was greater than 0.05 for the wet season evaluation.
14. (pp. 121-122, section 8.2.1.1) First sentence, should the text refer to minimum depth of 0.6’
for fish passage, rather than a maximum? Text revised to reflect ‘minimum flows.
Discarding the outlier in Figure 8-1 needs additional justification. The explanation given in the text (p. 122) is the value for Site 4 is “considerably greater” than the other values, and it is “not supported by any for (sic) the wetted perimeter results.” It is not surprising that the wetted perimeter data do not support the fish passage results since wetted perimeter is independent of fish passage. As described at the end of section 6.2.3 (p. 87), “[i]t is not
_____________________________________________________________________________________________ Proposed Minimum Flows and Levels for Anclote River System Appendices Page 199 of 207
assumed that flows associated with the lowest wetted perimeter inflection point meet fish passage needs…” A more complete explanation, if available, would be helpful.
It was stated incorrectly in the report as fish passage and wetted perimeter are not related and a correction will be made. The fish passage requirement at site 4 requires a flow of 29 cfs which has only been met 156 days per year, on average, for the period of record. The purpose of the fish passage criteria is not to ensure movement of all fishes throughout the entire system when these conditions do not occur year round naturally. The District feels that the selected fish passage criteria of 12 cfs protects local movement of all fishes and movement of the majority of fishes throughout the river.
15. (p. 123, last sentence) Although the statement is true, the justification seems
flawed. The low flow threshold was developed based on fish passage, not wetted perimeter. Comment not understood. As stated in the last paragraph on page 123, the low flow threshold is the higher of either fish passage (12 cfs) or wetted perimeter (8.5 cfs). Using 12 cfs ensures that the wetted perimeter requirements are achieved.
16. (p. 124, paragraph 1, last sentence) The argument about groundwater withdrawals being
allowed to violate the low flow threshold no more than 15% of the days contradicts the concept of low flow threshold. Sections 7.1.3.1 (p. 106) and 8.2.1 (p. 121) say the low flow threshold is to be protected throughout the year, and flows below this threshold are not available for consumptive use. A low flow threshold, as previously utilized by the District, is the flow at which no surface water withdraws are allowed. This condition can be written into a surface water use permit. The effects of a surface water withdrawal (or lack of one) on a flowing system (or the lack of one) are recognized almost immediately. The effects of a groundwater withdraw in the watershed have a lag effect and the intensity of these effects depends on numerous factors including rainfall. As it is impossible to predict the exact location and amount of rainfall within a basin, the District allows, albeit small at 15%, a reduction in the number of days that a river may fall below the low flow threshold.
Editorial Comments Noted and Corrected
17. (pp. ii, iii) The data in these tables need realignment. On page iii, is COB the correct
abbreviation? For PSU, “practical” is misspelled.
18. (p. xiii) In paragraph 1, line 3, word 2, the sentence needs a verb; and in line 5, change “nr” to “near.” In paragraph 5, line 2, delete the space before the comma.
19. (p. 3, list of items; p. 4, last paragraph) There is a word spacing problem that makes the text
difficult to read.

_____________________________________________________________________________________________ Proposed Minimum Flows and Levels for Anclote River System Appendices Page 200 of 207
20. (p. 43) Figure 3-7 is not referenced in the text.
21. (p. 51, last paragraph, line 3) Change “radj.2” to “r2adj.”
22. (p. 52, last paragraph, line 3) Change “kilometers” to “ppt”.
23. (p. 62) The flow graph needs a label on the x-axis.
24. (p. 66, paragraph 1, line 3) Change “at Elfers” to “near Elfers.”
25. (p. 69, paragraph 1, line 4) Change “form” to “from.”
26. (p. 71, paragraph 5) In line 2, change “Dominate” to “Dominant.” In line 4, add spacing after
the period.
27. (pp. 75, 94-96) Reposition the labels for Figures 5-2, and 7-1 – 7-3.
28. (p. 91, paragraph 1, line 1) Change “dependence” to “dependent.”
29. (p. 110, last paragraph, line 2) Change “26,450” to “26,454.”
30. (pp. 114 and 116, Notes section) Change “reductance” to “reduction.”
31. (p. 126) Table 8-1 is missing the data for April (mentioned on p. 125, paragraph 1).
32. (pp. 128-133, 137, 140, 142) The data in Tables 8-2 – 8-6, and 8-8 – 8-10 need realignment. Page 128, paragraph 1, line 3 refers to “the other three;” it seems line 2 should refer to “8 of 11” instead of “9 of 11.”
33. (p. 137) Table 8-8 is missing the column label for October (mentioned in paragraph 1).
34. (p. 137, paragraph 1, line 3) Change “take” to “taken.”
35. (p. 141) The short-term compliance standards for Block 2 need to be renumbered as
presented on p. 136 for Block 3.
D:\Anclote\Report\Final\Anclote_MFL_Final.doc 2/22/2010 11:02 AM
_____________________________________________________________________________________________ Proposed Minimum Flows and Levels for Anclote River System Appendices Page 201 of 207
10.4 Comments from Tampa Bay Water Extracted from Tampa Bay Water
Correspondence Received November 24, 2009. Board of Directors Mark Sharpe, Ann Hildebrand, James Bennett, AI Higginbotham, Susan Latvala, Sca~ McPherson, Charlie Miranda, Ted Schrader, Karen SeeI General Manager Gerald J. Seeber
General Counsel Richard A. Lotspeich
2575 Enterprise Road, Clearwater, Fl33763-ll 02 Phone: 727.796.2355 / Fax: 727.791.2388
November 20, 2009
Mr. Michael Heyl Chief Environmental Scientist Southwest Florida Water Management District 2379 Broad Street Brooksville, FL 34604 Subject: Anclote River Minimum Flow and Level Draft Report
Dear Mr. Heyl:
Tampa Bay Water staff have reviewed the draft report entitled "Anclote River System Recommended Minimum Flows and Levels". Thank you for the opportunity to meet with District staff on November 18 regarding the draft report. The following comments summarize concerns of Tampa Bay Water staff about the methodology used to define the minimum flow for the Anclote River.
1. At the November 18 meeting, District staff shared the updated technical memorandum (TM) dated June 9, 2009 that will replace Appendix 10.2. Using data through 2008, the updated TM provides evidence of recovery for flows in the Anclote River. It is vital that the body of the main report be updated to appropriately represent the evidence of recovery.
Appendix 10.2 has been updated with the June 9, 2009 Technical Memorandum. Development of the MFL and associated report began in 2005. Text and graphics in Chapter 2 reflect the state of knowledge at that time. The core of the original text has been largely retained, but additional text has been added to Chapter 2, Chapter 8 and a Preface added to reflect results of the updated TM.
2. More recent information is available about current and future wellfield pumping. Model tools have also been updated. a. Chapter 2 of the report indicates that Starkey Wellfield is not interconnected to the regional system.
As of 2007, Starkey Wellfield has been connected to the regional system. Future pumping from this wellfield is anticipated to be about 4 mgd on an average annual basis compared to historical rates of 12 to 15 mgd. Report has been corrected to reflect this change.
b. The Integrated Northern Tampa Bay (INTB) model used for this report is an earlier version (2007). Historical conditions and scenarios can be simulated for 18 continuous years using the final version
D:\Anclote\Report\Final\Anclote_MFL_Final.doc 2/22/2010 11:02 AM
_____________________________________________________________________________________________ Proposed Minimum Flows and Levels for Anclote River System Appendices Page 202 of 207
(2009) of the INTB model. Comment Noted c. As a result of reducing ground water pumping, streamflow of the Anclote River is anticipated to
increase. A long-term INTB model simulation using an average annual pumping rate of 90 mgd from the 11 Consolidated Wellfields can be used to provide perspective about flow increases for the Anclote River. District staff updated the results of the June 9, 2009 analysis using the current version of the INTB model. We ran the 11 consolidated wellfields at 90 mgd using the 2008 distribution of withdrawals. The predicted impacts to Anclote River flow at Elfers were slightly lower for mean flow conditions and slightly higher for median flow conditions compared to the original analysis. The tech memo indicated a mean flow decline of 5.8 cfs and a median flow decline of 2.8 cfs from TBW’s 2008 wellfield withdrawals which were about 88 mgd. The recent INTB model simulation for a total TBW withdrawal of 90 mgd using the 2008 distribution indicated a mean flow decline of 5.6 cfs and a median flow decline of 3.2 cfs at the Elfers gage.
3. Using the INTB model, the simulated impact of ground-water pumping on Anclote River flow was used to define a baseline (unimpacted) time series of flow stretching back to the 1950s. As stated in the report, other anthropogenic impacts have not been defined. The results in Table 1 and Figure 19 and the associated explanation in Appendix 10.2 indicate that the observed flow record at an annual scale was corrected for ground-water pumping impacts using only the ratio of mean flow change to mean well field pumping rate. INTB model results shown in Figure 1 clearly indicate simulated flow change is also related to the magnitude of streamflow (i.e., higher flow change for higher streamflow and vice versa).
a. Tampa Bay Water suggests adding a daily time series graph (log scale) to the report showing observed
and "unimpacted" Anclote flows for the period of record analyzed. For resolution, may need to break up the time series into 20-year increments. Thank you for providing these time series to Tampa Bay Water in an electronic file subsequent to our meeting of November 18. The recommended figures have been added to Appendix 10-3. Report Figure 2-13 provides an annual comparison; Figure 2-14 provides a comparison of median monthly values and Figure 2-5 compares the flow duration curves for the period of record. [Note that because of a peer review suggestion, a log transformation has been added to Figure 2-15 “to allow the reader to better understand impacts at low flows.”]
b. The reported method of annual flow impact extrapolation overestimates flow impact for years of low streamflow and underestimates flow impact for years of high streamflow. In addition, the pattern of annual flow impact will not necessarily be consistent between wellfields due to proximity to the Anclote watershed (i.e., whether only ground-water flux is impacted or both ground-water flux and surface runoff are impacted). As described in Appendices 10-2, the 5-year estimates of impact were based on record of pumpage at each wellfield in operation during that 5-year period. Thus, the impact inconsistency due to wellfield location has been incorporated into the evaluation as a 5-year average. Comparison of Figures 1 and 2 illustrate this point. Each figure includes two time series representing impacted flows and unimpacted flows. In each figure, the difference between the two time series represents the impact of ground-water pumping on Anclote flow. The volume and temporal distribution of ground-water pumping impact on Anclote flow is represented by INTB model results in Figure 1 and by the impact extrapolation method in Figure 2. The volume of flow impact is similar between the two methods based on similarity of the ten-year means (17.8 cfs and 17.5 cfs). However, the variance of flow impact is not similar between the two methods based on differences in the 10-year medians (8.7 cfs and 13.3 cfs) and visual inspection of the time series. For example, low flows are consistently higher for the extrapolation method (Figure 2) compared to the INTB model results (Figure 1). The extrapolation method started with INTB model results to represent ground-water impacts to Anclote flow. Presumably there was intent for the results of the extrapolation method to be similar to the results of the INTB model. By definition, the extrapolation method can and did preserve the volume of impact over long-term
D:\Anclote\Report\Final\Anclote_MFL_Final.doc 2/22/2010 11:02 AM
_____________________________________________________________________________________________ Proposed Minimum Flows and Levels for Anclote River System Appendices Page 203 of 207
conditions (e.g., mean). However, the extrapolation method did not preserve the variance which is of equal importance given the Block Approach used by the District to define the MFL. At the least, preservation of the volume of impact within each Block-Year would be appropriate. At best, the impact profile should depend on both magnitude of ground-water pumping and magnitude of Anclote flow. Proposed long-term reference flows (Table 8-10 of Section 8.3.4) for Block 1 are likely too high. Proposed long-term reference flows (Table 8-10 of Section 8.3.4) for Block 3 are likely too low. Block 2 could go either way. From the perspective of percent change if the MFL were based on an impact profile like Figure 1, the proposed MFL for Block 1 would change the most. From the perspective of magnitude of change, the proposed MFL for either Block 2 or 3 would change the most. A linear and a non-linear physical process, respectively ground-water flux and surface runoff, are simultaneously effected by ground-water pumping causing a more complex signature of impact to streamflow than can be captured by the current impact extrapolation method. The District acknowledges the difference pointed out by TBW. An adjustment based on magnitude and seasonal variance of groundwater pumpage was investigated as described in Appendix 10-3. The resultant Block 1 ‘adjusted’ flows seemed unreasonable to staff. Intuitively it would seem that adjusting groundwater impacts using the timing and magnitude of actual pumpage, however the resultant Block 1 flows adjusted in this manner seemed unreasonable to staff as the estimates were considerably higher than observed during both the relatively unimpacted early years (1947-1957) and were significantly higher than more recent observations. Corrections derived from magnitude and timing of pumpage consistently projected dry season flows about 20 cfs for the early period, when in fact only 17% of the observed 1947-1957 Block 1 flows were above this value. For this reason, the District chose to apply the groundwater impact in accordance with the seasonal streamflow pattern.
c. The reported method of seasonal or daily flow impact extrapolation (Appendix 10.3) from annual impacts does not account for the different regimes of streamflow that can be impacted by each wellfIeld. For example, historical pumping at Starkey Well field may impact both low and high flow regimes, producing high temporal variability in the flow change. In contrast, historical pumping at Section 21 Well field may only impact the low flow regime, producing a more temporally consistent and smaller flow change. The INTB model results could provide a profile of seasonal or daily flow impact to improve extrapolation methods. See comments in item 3b. Comment noted, but in light of the overprediction of low flows and underprediction of high flows by the INTB model (noted in comment 3d.), it is unclear how this adjustment would improve the estimates based on seasonal flow that have been described in TBW (comment 3a.) as ‘likely too high’ in Block 1 and ‘likely too low’ for Block 3.
d. The impact extrapolation method is based on an estimated flow loss per mgd of ground-water pumping which is an average value that has some uncertainty associated with it. In the report, it would be appropriate to provide confidence intervals of estimated ground-water pumping impact to Anclote flow that was derived from the per-mgd estimate in Figures 213 to 2-15 using a matching temporal scale. Comment noted.
e. Simulated flows include model error. Differencing the flow results of two model runs might not remove the model error if the two flow time series are in different error regimes for the same time interval. INTB model overpredicts low flows and underpredicts high flows. District staff recognize that all models have error. However, because both agencies have agreed to use this common platform (i.e. INTB model) and have cooperatively participated in its calibration and funding, we believe that it is the best tool currently available to assess impacts to the hydrologic system.
4. In Section 8.3.4, the report does not clearly define how the long-term reference flows were calculated (Table 8-10). Section 8.3.4 describes a process of creating a modified time series of Anclote flow that
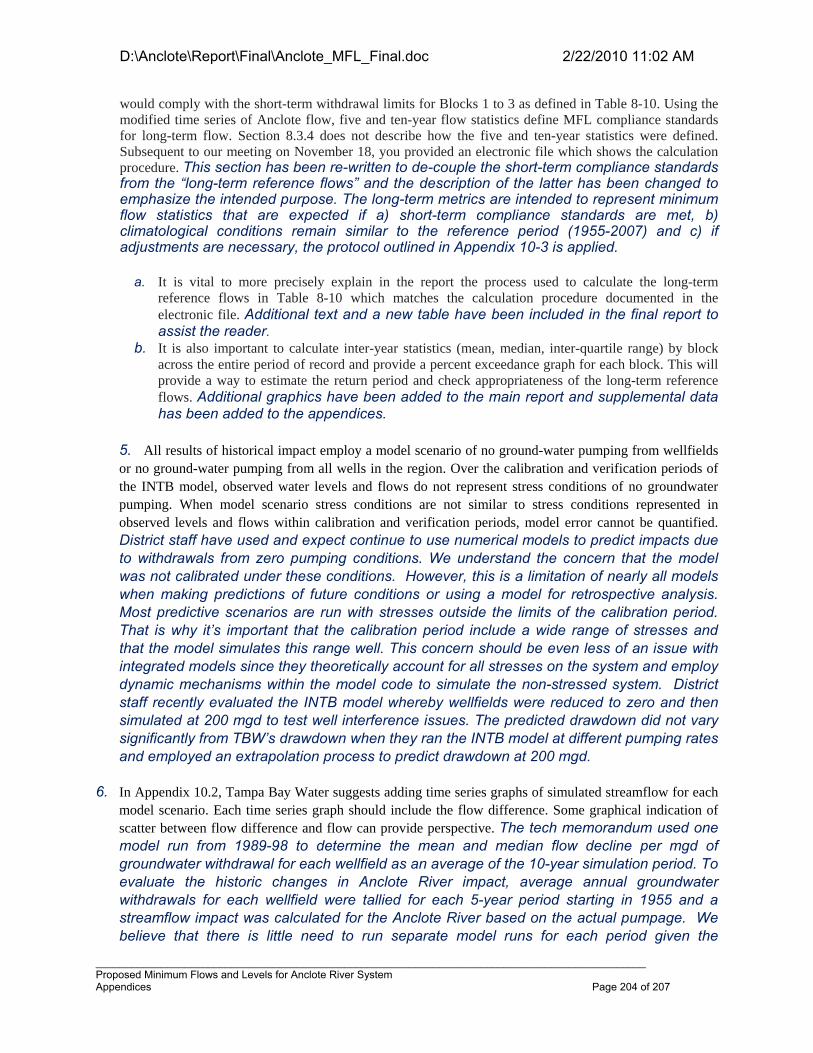
D:\Anclote\Report\Final\Anclote_MFL_Final.doc 2/22/2010 11:02 AM
_____________________________________________________________________________________________ Proposed Minimum Flows and Levels for Anclote River System Appendices Page 204 of 207
would comply with the short-term withdrawal limits for Blocks 1 to 3 as defined in Table 8-10. Using the modified time series of Anclote flow, five and ten-year flow statistics define MFL compliance standards for long-term flow. Section 8.3.4 does not describe how the five and ten-year statistics were defined. Subsequent to our meeting on November 18, you provided an electronic file which shows the calculation procedure. This section has been re-written to de-couple the short-term compliance standards from the “long-term reference flows” and the description of the latter has been changed to emphasize the intended purpose. The long-term metrics are intended to represent minimum flow statistics that are expected if a) short-term compliance standards are met, b) climatological conditions remain similar to the reference period (1955-2007) and c) if adjustments are necessary, the protocol outlined in Appendix 10-3 is applied.
a. It is vital to more precisely explain in the report the process used to calculate the long-term
reference flows in Table 8-10 which matches the calculation procedure documented in the electronic file. Additional text and a new table have been included in the final report to assist the reader.
b. It is also important to calculate inter-year statistics (mean, median, inter-quartile range) by block across the entire period of record and provide a percent exceedance graph for each block. This will provide a way to estimate the return period and check appropriateness of the long-term reference flows. Additional graphics have been added to the main report and supplemental data has been added to the appendices.
5. All results of historical impact employ a model scenario of no ground-water pumping from wellfields or no ground-water pumping from all wells in the region. Over the calibration and verification periods of the INTB model, observed water levels and flows do not represent stress conditions of no groundwater pumping. When model scenario stress conditions are not similar to stress conditions represented in observed levels and flows within calibration and verification periods, model error cannot be quantified. District staff have used and expect continue to use numerical models to predict impacts due to withdrawals from zero pumping conditions. We understand the concern that the model was not calibrated under these conditions. However, this is a limitation of nearly all models when making predictions of future conditions or using a model for retrospective analysis. Most predictive scenarios are run with stresses outside the limits of the calibration period. That is why it’s important that the calibration period include a wide range of stresses and that the model simulates this range well. This concern should be even less of an issue with integrated models since they theoretically account for all stresses on the system and employ dynamic mechanisms within the model code to simulate the non-stressed system. District staff recently evaluated the INTB model whereby wellfields were reduced to zero and then simulated at 200 mgd to test well interference issues. The predicted drawdown did not vary significantly from TBW’s drawdown when they ran the INTB model at different pumping rates and employed an extrapolation process to predict drawdown at 200 mgd.
6. In Appendix 10.2, Tampa Bay Water suggests adding time series graphs of simulated streamflow for each model scenario. Each time series graph should include the flow difference. Some graphical indication of scatter between flow difference and flow can provide perspective. The tech memorandum used one model run from 1989-98 to determine the mean and median flow decline per mgd of groundwater withdrawal for each wellfield as an average of the 10-year simulation period. To evaluate the historic changes in Anclote River impact, average annual groundwater withdrawals for each wellfield were tallied for each 5-year period starting in 1955 and a streamflow impact was calculated for the Anclote River based on the actual pumpage. We believe that there is little need to run separate model runs for each period given the
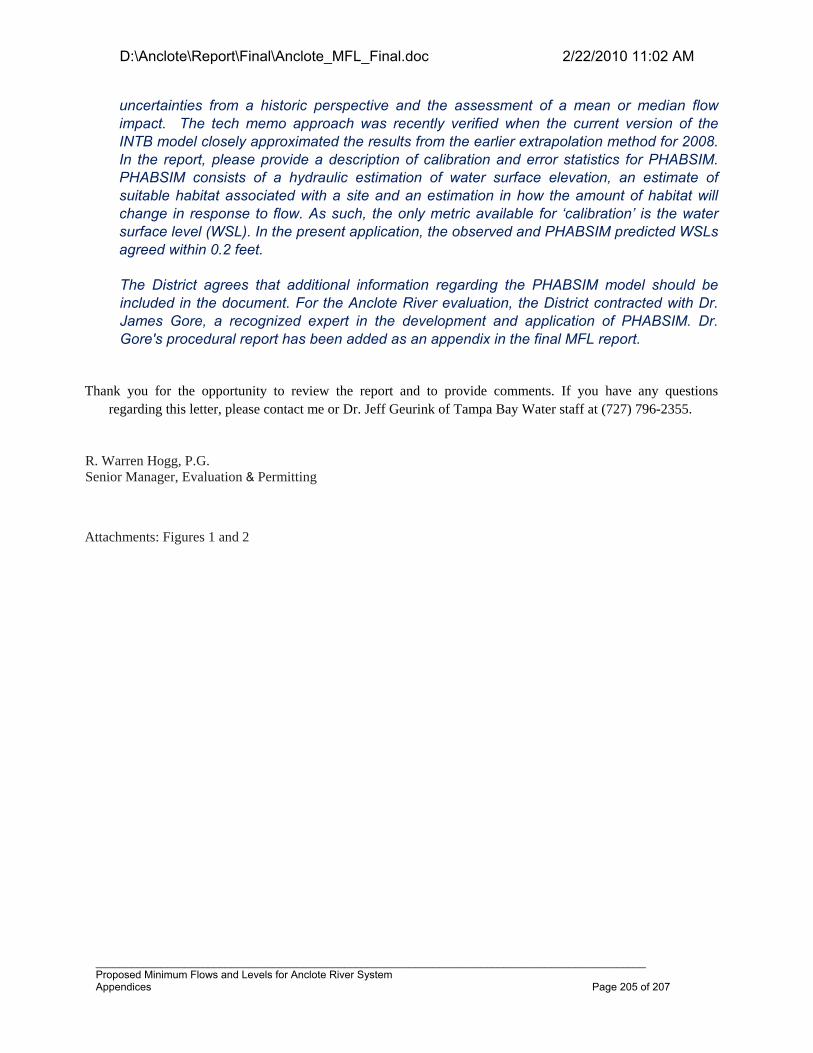
D:\Anclote\Report\Final\Anclote_MFL_Final.doc 2/22/2010 11:02 AM
_____________________________________________________________________________________________ Proposed Minimum Flows and Levels for Anclote River System Appendices Page 205 of 207
uncertainties from a historic perspective and the assessment of a mean or median flow impact. The tech memo approach was recently verified when the current version of the INTB model closely approximated the results from the earlier extrapolation method for 2008. In the report, please provide a description of calibration and error statistics for PHABSIM. PHABSIM consists of a hydraulic estimation of water surface elevation, an estimate of suitable habitat associated with a site and an estimation in how the amount of habitat will change in response to flow. As such, the only metric available for ‘calibration’ is the water surface level (WSL). In the present application, the observed and PHABSIM predicted WSLs agreed within 0.2 feet.
The District agrees that additional information regarding the PHABSIM model should be included in the document. For the Anclote River evaluation, the District contracted with Dr. James Gore, a recognized expert in the development and application of PHABSIM. Dr. Gore's procedural report has been added as an appendix in the final MFL report.
Thank you for the opportunity to review the report and to provide comments. If you have any questions
regarding this letter, please contact me or Dr. Jeff Geurink of Tampa Bay Water staff at (727) 796-2355.
R. Warren Hogg, P.G. Senior Manager, Evaluation & Permitting
Attachments: Figures 1 and 2
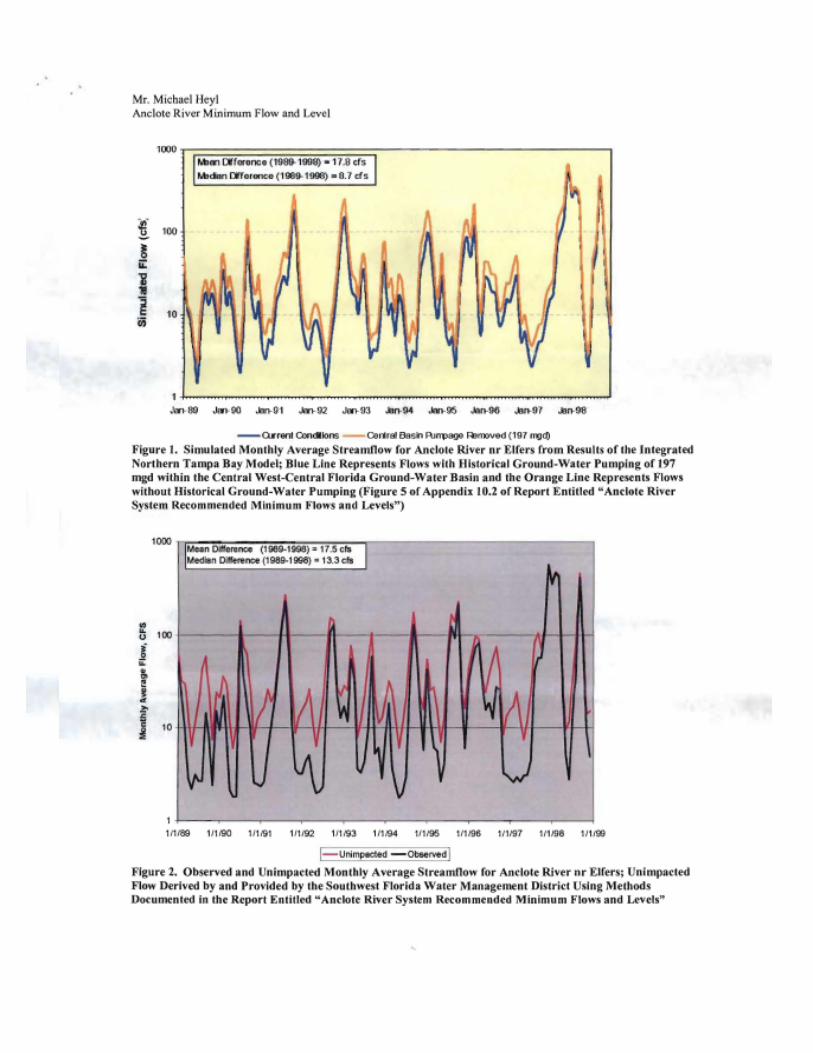
D:\Anclote\Report\Final\Anclote_MFL_Final.doc 2/22/2010 11:02 AM
_____________________________________________________________________________________________ Proposed Minimum Flows and Levels for Anclote River System Appendices Page 206 of 207

D:\Anclote\Report\Final\Anclote_MFL_Final.doc 2/22/2010 11:02 AM
_____________________________________________________________________________________________ Proposed Minimum Flows and Levels for Anclote River System Appendices Page 207 of 207
CHAPTER 11 - APPENDICES [BOUND SEPARATELY]
11.1 Anclote Land Use Maps
11.2 Basso, R. 2009. Technical Memorandum: Predicted groundwater withdrawal impacts to the Anclote River based on numerical model results.
11.3 Heyl, M. 2008. Technical Memorandum: Adjustments to Flow Record for Groundwater Impacts.
11.4 Water Quality Station Metadata
11.5 Grabe, S and T. Janicki. 2007 Analysis of Benthic Community Structure and Its Relationship to Freshwater Inflows in the Anclote River.
11.6 Greenwood et al. 2006. Freshwater Inflow Effects on Fishes and Invertebrates in the Anclote River Estuary.
11.7 Estevez, E. and B.D Robbins. Lettter Report on Anclote River Mollusk and Vegetation Survey.
11.8 Montagna, P. 2006 A Multivariate Statistical Analysis of Relationships between Freshwater Inflows and Mollusk Distributions in Tidal Rivers in Southwest Florida.
11.9 Wetted Perimeter Graphs for the Anclote River Study Corridor
11.10 Elevation and Vegetation Profiles for the Anclote River Study Corridor
11.11 PHABSIM Evaluation – Dr. James Gore
11.12 Protocol for Development of Long-term Flow Expectations