Embed Size (px)
Citation preview

Anchorage of 0.6” Diameter Strands
Nebraska Department of Roads
Project Number SPR-1 (03) P551
October 2003

Anchorage of 0.6” Diameter Strands
NDOR Project Number SPR-1 (03) P551
Final Report
Principal Investigator
Maher K. Tadros
Charles J. Vranek Professor of Civil Engineering
University of Nebraska-Lincoln
Sponsored by
Nebraska Department of Roads
University of Nebraska-Lincoln
October 2003

i
Technical Report Documentation Page 1. Report No.
2. Government Accession No.
3. Recipient’s Catalog No.
4. Title and Subtitle
Anchorage of 0.6” Diameter Strands
5. Report Date
June 2003
6. Performing Organization Code
7. Author(s)
Maher K. Tadros and Nipon Jongpitaksseel
8. Performing Organization Report No.
9. Performing Organization Name and Address
Department of Civil Engineering
10. Work Unit No.
University of Nebraska-Lincoln Omaha, Nebraska 68182
11. Contract or Grant No.
SPR-1 (03) P551 12. Sponsoring Agency Name and Address
Nebraska Department of Roads Bridge Division
13. Type of Report and Period Covered
Final Report
P. O. Box 94759 Lincoln, NE 68509-4759
14. Sponsoring Agency Code
15. Supplementary Notes
16. Abstract
In a recent investigation on shear limits in precast prestressed concrete girders for the Nebraska Department of Roads (NDOR), it was determined that the AASHTO LRFD limit of 0.25f’ cbdv for maximum shear reinforcement is attainable as long as an adequate number of strands is anchored into the abutment diaphragms. In addition, extending strands in prestressed concrete girders beyond member ends and bending them into cast-in-place pier diaphragms can be a cost-effective method of controlling creep and shrinkage effects in bridges designed as simple spans for girder and deck weights and continuous spans for additional loads. In this research project, the pullout capacity of 0.5 in. and 0.6 in. (12.7 and 15.2 mm) diameter strands is evaluated. A full-scale test of beam end anchorages was conducted. A proposed design procedure for a bent strand anchorage is included. In addition, a confinement reinforcement detail for bridge diaphragms is proposed. Two numerical design examples are included together with design recommendations for determining the required number and length of strands that need to be bent and embedded into the diaphragms.
17. Keyword
Concrete Bridge, Precast, Pretension, 0.6 in. diameter Strands, Anchorage, Shear
18. Distribution Statement
No Restrictions. This document is available to the public through the National Technical Information Service, Springfield, VA 22161
19. Security Classification (of this report)
Unclassified 20. Security Classification (of this page)
Unclassified 21. No. of Pages
68 22. Price
Form DOT F1700.7 (8-72)

ii
DISCLAIMER
The contents of this report reflect the views of the authors who are responsible for the
facts and the accuracy of the data presented herein. The contents do not necessarily
reflect the official views or policies of the Nebraska Department of Roads, nor the
University of Nebraska-Lincoln. This report does not constitute a standard, specification,
or regulation. Trade or manufacturers’ names, which may appear in this report, are cited
only because they are considered essential to the objectives of the report. The United
States (U.S.) government and the State of Nebraska do not endorse products or
manufacturers.

iii
ABSTRACT
In a recent investigation on shear limits in precast prestressed concrete girders for
Nebraska Department of Roads (NDOR), it was determined that the AASHTO LRFD
limit of 0.25f’cbdv for maximum shear reinforcement is attainable as long as an adequate
number of strands is anchored into the abutment diaphragms. In addition, extending
strands in prestressed concrete girders beyond member ends and bending them into cast-
in-place pier diaphragms can be a cost-effective method of controlling creep and
shrinkage effects in bridges designed as simple spans for girder and deck weights and
continuous spans for additional loads. In this research, the pullout capacity of 0.5 in. and
0.6 in. (12.7 and 15.2 mm) diameter strands is evaluated. Full-scale test of beam end
anchorages is investigated, and a design procedure for bent strand anchorage is proposed.
In addition, confinement reinforcement detail of bridge diaphragm is proposed. Two
numerical design examples are included together with design recommendations for
determining the required number and length of strands that need to be bent and embedded
into the diaphragms.

iv
ACKNOWLEDGMENTS
This project was sponsored by the Nebraska Department of Roads (NDOR). The
support of Leona Kolbet, Research Coordinator, Lyman Freemon, Bridge Engineer, Sam
Falleha, Assistant Bridge Engineer and Gale Barnhill, Bridge Research Engineer, NDOR
is gratefully acknowledged. They spent many hours to coordinate this project, discuss its
technical direction and inspire the University researchers.
The University team consisted of Nipon Jongpitaksseel, a former graduate
research assistant, Sherif Yehia Ph.D. P.E., assistant professor at Western Michigan
University and a former research assistant professor, and Kelvin Lein, Structures
Laboratory Manager.
Specimens for the experimental program and technical assistance were provided
by Rinker Materials, Omaha, NE. The efforts of the following individuals are particularly
appreciated: Dennis Drews and Buz Hutchinson.

v
TABLE OF CONTENTS
TECHNICAL REPORT DOCUMENTATION................................................................... i
DISCLAIMER .................................................................................................................... ii
ABSTRACT....................................................................................................................... iii
ACKNOWLEDGMENTS ................................................................................................. iv
TABLE OF CONTENTS.....................................................................................................v
LIST OF FIGURES........................................................................................................... vii
LIST OF TABLES .............................................................................................................. x
CHAPTER 1 INTRODUCTION........................................................................................1
1.1 Problem Statement ..........................................................................................1
1.2 Research Objectives and Approach ................................................................4
1.3 Scope and Layout............................................................................................4
CHAPTER 2 SIMPLIFIED UNIFIED SHEAR DESIGN .................................................6
2.1 Introduction.....................................................................................................6
2.2 Background .....................................................................................................6
2.3 Beam End Anchorage Enhances Shear Capacity............................................8
CHAPTER 3 PULLOUT CAPACITY OF NON-PRESTRESSES BENT STRANDS...10
3.1 Introduction...................................................................................................10
3.2 Experimental Program ..................................................................................10
3.3 Specimens and Test Procedures....................................................................12
3.4 Test Results and Discusion ...........................................................................19

vi
CHAPTER 4 FULL SCALE TEST OF BEAM END ANCHORAGE............................27
4.1 Introduction...................................................................................................27
4.2 Experimental Program ..................................................................................27
4.2.1 Testing Specimen...........................................................................27
4.2.2 Testing Procedure ..........................................................................35
4.3 Test Results and Discussion………………………………………………..36
4.3.1 Ultimante Loads and Failure Mode ...............................................36
4.3.2 Discussion of Test Results .............................................................42
4.4 Analyses of the Strand Stress in the End Blocks..........................................45
4.5 Conclusions of Beam End Anchorage Experiment.......................................48
CHAPTER 5 APPLICATION OF ANCHORAGE AND DESIGN EXAMPLES ......... 50
5.1 Introduction...................................................................................................50
5.2 Development Length and Application to Shear Design................................50
5.3 Recommendations of Reinforcement Detail in the End Diphragm ..............54
5.4 Design Examples ..........................................................................................56
Example 1 .....................................................................................................56
Example 2 .....................................................................................................61
CHAPTER 6 CONCLUSIONS AND RECOMMENDTIONS ...................................... 65
REFERENCES ..................................................................................................................67
vii
LIST OF FIGURES
Figure 1.1 Prestressing Strands Being Extended and Bent ......................................2
Figure2.1 Stresses Acting on Pullout Strand ...........................................................8
Figure 3.1 Bent Strand Details................................................................................11
Figure 3.2 Specimen 1 and Loading Arrangement .................................................14
Figure 3.3 Specimen 2 and Loading Arrangement .................................................15
Figure 3.4 Specimen 3 and Loading Arrangement .................................................16
Figure 3.5 Specimen Fabrication ............................................................................17
Figure 3.6 Pullout Test Set-Up ...............................................................................18
Figure 3.7 Relationship of Pullout Force and Strand Slip (Specimen 1)................19
Figure 3.8 Relationship of Pullout Force and Strand Slip (Specimen 2)................20
Figure 3.9 Relationship of Pullout Force and Strand Slip (Specimen 3)................21
Figure 3.10 Embedment Length vs %fpu at Maximum Load....................................23
Figure 3.11 Vertical Embedment Length-Nominal Diameter Ratio vs Strand-stress-
to-Specified Strength Ratio .................................................................. 24
Figure 4.1 a) Typical Longitudinal Reinforcement.................................................. 29
Figure 4.1 b) Typical Shear Reinforcement ............................................................... 29
Figure 4.2 Shear Reinforcement at End Section................................................... 30
Figure 4.3 Beam End without End Block of Specimen B4E2.............................. 30

viii
Figure 4.4 a) End Section of NU1100 I-girder (B1E1)............................................. 32
Figure 4.4 b) Bent Strands for Specimen B1E1 ......................................................... 32
Figure 4.5 a) End Section of NU1100 I-girder (B3E2).............................................. 33
Figure 4.5 b) Bent Strands for Specimen B3E2 ......................................................... 33
Figure 4.6 Elevation of Typical Reinforcement in the End Block........................ 34
Figure 4.7 Elevation of Reinforcement in the End Block (B3E2) ......................... 34
Figure 4.8 Test Set-Up........................................................................................... 35
Figure 4.9 Web Crushing Failure of Specimen B3E1 ........................................... 37
Figure 4.10 Crack of End Block at Failure of Specimen B1E2............................... 38
Figure 4.11 Crack of End Block at Failure of Specimen B3E2............................... 39
Figure 4.12 Pure shear Failure of Specimen B2E1.................................................. 40
Figure 4.13 Shear/Bond Failure of Specimen B4E2................................................ 41
Figure 4.14 Shear strength versus number of non-tensioned embedded strands ..... 43
Figure 4.15 Normalized shear strength versus anchorage of non-tensioned strands 44
Figure 4.16 Tension force in longitudinal reinforcement along shear span............. 45
Figure 4.17 Tensile stress in longitudinal reinforcement along shear span ............. 47
Figure 5.1 Force Variations in Flexural Reinforcement over Beam Span..............52
Figure 5.2 Shear and Moment Resistance Forces near Support ............................... 53
Figure 5.3 Proposed Detail Reinforcement in the diaphragm................................... 55
Figure 5.4 Bent Strand at Girder End ...................................................................... 57

ix
Figure 5.5 Bent Strand Details ................................................................................. 59
Figure 5.6 Cross Section of Bridge.......................................................................... 62
Figure 5.7 Bridge Elevation showing Abutment and Pier Locations....................... 62
Figure 5.8 Required Strand Embedment at Beam End ............................................ 64

x
LIST OF TABLES
Table 3.1 The properties of Specimens 1, 2 and 3 ................................................12
Table 3.2 Summary of Test Results.......................................................................22
Table 3.3 Recommended Embedment Lengths .....................................................26
Table 4.1 Properties of Specimens ....................................................................... 31
Table 4.2 Test Specimens..................................................................................... 36
Table 4.3 Summary of Test Results...................................................................... 37
Table 4.4 Parameters to calculate strand stress .................................................... 46
Table 5.1 Data from Example 9.4 of the PCI Bridge Design Manual14.............. 57

1
CHAPTER 1
INTRODUCTION
1.1 Problem Statement
The shear capacity of pretensioned concrete simple span I-girders can be
significantly increased by extending and bending strands that already exist in the bottom
flange into the end diaphragms (1, 2, 3). In a recent investigation on shear limits in precast
prestressed concrete girders (1) for the Nebraska Department of Roads (NDOR), all
strands in the bottom flange of the girders were extended and bent into the end
diaphragms. This provided sufficient anchorage for the strands to act as a “tension tie” to
develop the strut-and-tie mechanism for shear resistance.
The developed tension tie can significantly enhance shear capacity. However,
extending and bending all strands available in the bottom flange of the girders may cause
steel congestion in the diaphragm. Knowledge of the anchorage capacity of non-
prestressed bent strands would be useful in determining the number of strands required to
be bent into the diaphragms.
In a long bed prestressing operation, several feet of strand already exists in the gap
between girder ends. After the prestress is released and the girders are separated, strand
extensions beyond the face of girder ends are generally removed and discarded. In
Nebraska and several other states, it has been the practice for over two decades to remove
all but four to twelve strand extensions.
These strands are then bent in the plant, as shown in Figure 1.1, using a simple
strand-bending tool. This technique is rather simple and adds almost nothing to the cost

2
of girder fabrication. However, the number of bent strands and the embedment lengths
has been selected by trial and adjustment based on observation of the behavior of actual
bridges, rather than using design calculations.
Figure 1.1 Prestressing Strands Being Extended and Bent
Another reason for extending strands in prestressed concrete girders beyond
member ends and bending them into cast-in-place abutment pier is to control creep and
shrinkage effects in bridges designed to be simple spans for girder and deck weights and
continuous spans for additional loads (4). When the prestressed concrete girders are set on
piers or abutments, and made continuous reinforcement in cast-in-place decks, the beams
are restrained at their ends.

3
As a result, time-dependent movement occurring after the deck concrete is cured
causes positive restraint moments over the piers. This behavior depends on the amount of
girder creep that is being restrained; girders made continuous at a relatively young age
experience large restraint moments.
There are a number of methods to estimate the time-dependent restraint moment
over bridge piers. They include a time-step computer analysis as described by Ma et al. (4)
and by Oesterle et al. (5), a closed form solution by Freyermuth (6) and a common-practice
empirical recommendation by Mirmiran et al. (7). These methods vary in their
consideration of whether the positive restraint moment should be calculated assuming a
cracked or an uncracked section in the area over the piers. This research project does not
address how the moment should be calculated. It demonstrates how, for a given
calculated moment, the strand embedment requirement can be calculated. It is assumed
that the moment is a serviceability limit state design parameter for which an allowable
working design is specified. It is reasonable to assume the stress limit in the prestressing
strands = 30 ksi (207 MPa) as a means of crack control. The stress-versus-embedment-
length formula developed herein would permit other stress limits to be used by the
designer.
Another benefit of embedding strands into end diaphragms is to enhance
resistance to shear. There is adequate evidence (1, 2, 3) of the importance of anchorage of
longitudinal reinforcement at member ends. This is generally the bottom reinforcement at
the abutments. In simple span construction, used for example in Texas and Florida, it is
also the bottom reinforcement at the piers. In continuous span construction, such as that

4
used in the Midwest, the tensile longitudinal reinforcement at the piers to be considered
in shear design is the top continuity reinforcement. For that situation, extension of bottom
strands into pier diaphragms is not relevant to shear design.
Design for shear is based on the strength limit state. Thus, checking of strand
embedment at the abutments, and at the piers for simple span construction, should be
based on factored loads and the stress in the strand that can be achieved at pull-out
failure.
1.2 Research Objectives and Approach
The work presented herein discusses the evaluation of the pullout capacity of 0.5
in. and 0.6 in. (12.7 and 15.2 mm) diameter strands and gives recommendations for
determining the required number and length of strands to be bent and embedded into the
diaphragms.
Anchorage of the longitudinal reinforcement into bridge diaphragms is an
effective and virtually no-cost means of achieving the maximum capacity of precast
prestressed beams and avoiding unacceptable cracking due to restraint moments.
1.3 Scope and Layout
This study focuses on the behavior of the end zone of precast pretensioned
concrete bridge girders. The proposed design methods will be based on available
experimental results and empirical analysis. The design of regions of members near
support, considered “disturbed regions” or D-regions using special procedures including
the strut-and-tie method, is not the focus of this report.

5
Chapter 2 contains background information and a literature review of pullout tests
and beam end anchorages for pretensioned concrete bridge girders.
Chapter 3 deals with the experimental program of pullout tests of non-prestressed
90-degree bent strands. A design equation to determine the embedment length of 0.5-in.
and 0.6-in. diameter strands is proposed. Recommendations for determining the required
number and length of strands to be bent and embedded into the diaphragms are proposed.
Chapter 4 covers the experimental investigation of full-scale shear tests of the
anchorage at beam ends. The anchorage detailing to enhance the shear capacity of
concrete bridge girders is proposed.
Chapter 5 contains a design procedure of a 90-degree bent strand anchorage. In
addition, a confinement reinforcement detail in the end diaphragm is presented for
practical use. Two design examples are illustrated in this chapter as well.
Chapter 6 summarizes the conclusions and recommendations of the research
project.

6
CHAPTER 2
BACKGROUND INFORMATION
2.1 Introduction
The use of untensioned, bonded prestressing strand for concrete reinforcing is
quite common in the precast prestressed concrete industry. This use includes lifting
handles, reinforcing for crack control, and connection reinforcing between precast
elements. The use of untensioned, bonded prestressing strands as the anchorage
reinforcement at member end, by extending the strands beyond member end and bending
them into the end diaphragm, can also result in also avoiding bond failure, which causes
the girder to not reach its maximum shear capacity1,2. The latter use provides justification
for studying the behavior of the embedment length of a 90-degree bent untensioned
strand. Much research has been conducted to determine the embedment length of
pretensioned straight strands. In the Missouri study9, untensioned straight, frayed and bent
strands were also investigated. However, the Missouri experimental program for 90-
degree bent untensioned strands considered only 0.5-in. diameter strands. Use of 0.6-in.
strands has been increasing in recent years. Therefore, pullout tests on 0.5-in. and 0.6-in.
diameter strands were undertaken and are presented in Chapter 3.
2.2 Background
The bond characteristics and development length of strands were studied using
mostly prestressed straight strands (8-11). One exception is the University of Missouri
study performed in the 1970s (12). The objective of the Missouri study was to examine the
use of embedded prestressing strands to develop positive moment continuity of precast,

7
prestressed I-beam members. Most of the experiments in the Missouri study focused on
comparison of the bond characteristics of untensioned bent strands, straight strands, and
frayed strands. In this research project, only pullout tests of non-prestressed bent strands
were performed to expand the scope of the Missouri tests.
The full tensile strength of a prestressing strand can usually be developed at a
section, provided the strand extends in the concrete a sufficient distance beyond that
section. The length of bar beyond the section required to develop the strength of the bar is
known as the development length. When the straight length of strand available for
anchorage is insufficient, the reinforcement should be bent to aid anchorage. 90-degree
bent anchorages for prestressing strands have distinct advantages that have been
recognized by concrete bridge engineers in some states.
The bond of untensioned strands in concrete differs from that of plain, deformed
reinforcing bars, and tensioned prestressing strands. A 90-degree bent strand loaded in
tension develops stresses in the manner shown in Figure 2.1. The stress in the strand is
resisted by bond on the surface of the strand and by bearing on the concrete inside the
bent strand. The horizontal part of the embedded strand moves inward, leaving a gap
between the vertical part of the strand and the concrete outside the bend. Failure in the
direct pullout bent strand testing involves splitting cracks of the concrete surrounding the
strand. Because of the flexibility of non-tensioned prestressing strands, the vertical part of
the strand near the tail does not tend to straighten and produce compressive stress on the
outside of the tail, unlike mild steel.

8
P
Tail
Gap
Bearing Stress
Figure 2.1 Stresses acting on pullout strand
2.3 Beam End Anchorage Enhances Shear Capacity
The traditional and simple 45-degree truss model clearly and correctly shows that
the stresses in the longitudinal tensile reinforcement in the shear span are larger than
those predicted from beam theory. If the longitudinal tensile reinforcement is not well
anchored in the beam support region, premature shear failure is unavoidable. Bridge I-
beams can take advantage of the existing beam end diaphragm, where the beam strands
can be anchored.
In beams with a small shear span-depth ratio a/d, arch action is the predominant
mode of shear resistance after the onset of diagonal cracking. Accordingly, the bottom
strands are required to function as the tie of this arch. The straight strand anchorage for a
pretensioned concrete beam is likely to reduce the ultimate shear strength due to strand

9
slip. In such situations, it is better to carry all of the bottom strands to the end zone and
bend them up at the beam end.
A benefit of embedding strands into end diaphragms is to enhance resistance to
shear. This method generally uses the bottom reinforcement at the abutments. In simple
span construction, used for example in Texas and Florida, there is also bottom
reinforcement at the piers. In continuous span construction such as that used in the
Midwest, top continuity reinforcement at the piers is considered in shear design. For this
situation, extension of the bottom strands into the pier diaphragms is not relevant to shear
design.

10
CHAPTER 3
PULLOUT CAPACITY OF NON-PRESTRESSED BENT STRANDS
3.1 Introduction
Traditionally, the anchorage performance of various reinforcing bars embedded in
concrete of different strengths is determined from pullout tests. This chapter covers the
experimental program of pull-out tests of varied anchorage lengths for non-prestressed
90-degree bent strands in the end diaphragm. In this research project, only pullout tests of
non-prestressed bent strands were performed in order to expand the scope of the Missouri
tests.
3.2 Experimental Program
To study the behavior of a 90-degree bent untensioned strand embedded in a
concrete mass, a series of 55 direct pullout tests was conducted on specimens that
contained 22 different embedment lengths. The objectives of the experimental
investigation were to:
(1) Determine the pullout capacity of various embedment lengths of untensioned bent
strands in a simulated concrete diaphragm.
(2) Recommend a method for determining the required number and length of strands
that need to be bent and embedded into the diaphragms.
In designing the pullout test specimens, the following parameters were
considered:

11
(1) Strand horizontal embedment length, Lh, which is defined as the distance from the
end face of the pretensioned I-girder to the centerline of the vertical leg of the extended
strand, as shown in Figure 3.1;
(2) Strand vertical embedment length, Lv, which represents the vertical portion of the
extended bent strand, as shown in Figure 3.1; and
(3) Diameter of strands.
The total embedment length (Le, equals to Lh+Lv) was considered as the effective
embedment length of the strand. The specified concrete compressive strength for all
specimens was 4000 psi (28 MPa). This strength was believed to be at the low end of
what is currently used in practice. The results of this investigation should be conservative
for higher strength concrete.
L h
eL hL vL+=
L vRecommended Reinforced Bar
Strands
Figure 3.1 Bent Strand Details
Diaphragm reinforcement, diaphragm volume and continuity between girders aid
in confining the embedded strands and improving their anchorage capacity. However, it

12
was more conservative and convenient to ignore these effects using a plain concrete mass
in the experimental program. It should be noted, however, that placing a reinforcing bar
on the inside corner of the strand bend in the diaphragm is a recommended detail as it
significantly enhances strand anchorage.
3.3 Specimens and Test Procedures
Three specimens were designed and fabricated at the University of Nebraska
Structures Laboratory. Table 3.1 shows the properties of Specimens 1, 2 and 3. The strand
spacing shown in the table is centerline to centerline spacing. The horizontal embedment
length for Specimen 1 was 6 in. (150 mm). The vertical embedment lengths varied from 4
to 25 in. (100 to 635 mm).
Table 3.1: The Properties of Specimens 1, 2 and 3
Specimen Lh
(in.)
Lv
(in.)
Strand Diameter
(in.)
Strand Spacing
(in.)
Specified Concrete Strength
(psi)
Average Concrete Strength
(psi)
1 6 varies 4 to 25 0.5 4 4000 5350
2 10 varies 4 to 25 0.5 4 4000 5350
3 6 varies 12 to 46 0.6 6 4000 4063
Strands of 0.5 in. (13 mm) diameter Grade 270 (1860 MPa) low relaxation steel
were used in this specimen. The total thickness of the specimen was 12 in. (305 mm). The
cover of the vertical portion of the bent strand was 6 in. (150 mm). A 4 in. (100 mm)
spacing of the bent strands was chosen to avoid the development of splitting cracks
between strands that propagate to the surface. This action reduces the pullout capacity of
the adjacent strands.

13
Specimen 2 was identical to Specimen 1, except that the total thickness of
Specimen 2 was increased to 20 in. (510 mm). Therefore, the cover of the vertical portion
of the bent strand was increased from 6 to 10 in. (150 to 250 mm). Also, the horizontal
embedment length was increased to 10 in. (250 mm). These two specimens were designed
to investigate the effect of the horizontal embedment length on pullout capacity.
For Specimen 3, the horizontal embedment length was 6 in. (150 mm). The
vertical embedment length was varied from 12 to 46 in. (305 to 1170 mm). Strands of 0.6
in. (15 mm) diameter Grade 270 (1860 MPa) low relaxation steel were used. The total
thickness of the specimen was 12 in. (305 mm).
The cover of the vertical portion of the bent strand was 6 in. (150 mm). A 6 in.
(150 mm.) spacing of the bent strands was chosen to prevent cracks from propagating
from the previously pulled strands and affecting the pullout capacity of the adjacent
strands. The diaphragm width in a bridge would normally allow for a minimum of 6 in.
(150 mm) horizontal strand embedment. Specimens 1 and 3 were designed to study the
effect of strand diameters on pullout capacity.

14
10"
Lv =4"-25"
6"Lh=6"
10"
Lv = 25"
Typ. 4"
10" 10"
10"
Lv = 4"
20@4" = 80"
Embedment Length, Le = Lv+Lh
steel plate steel plate
0.5" dia. strand
chuck
hydraulic jackload cell
Group 1Group 2
Group 3Group 4
Group 5Group 6
Group 7
0.5" dia. strand (typ.)
Section A-A
LVDT
Figure 3.2 Specimen 1 and Loading Arrangement

15
10"
Lv =4"-25"
6"Lh=10"
10"
Lv = 25"
Typ. 4"
10" 10"
10"
Lv = 4"
20@4" = 80"
steel plate
Embedment Length, Le = Lv+Lh
load cell
LVDT
0.5" dia. strand
hydraulic jack
chuck
steel plate
Section A-A
Group 4
Group 2
Group 1
Group 3
Group 6Group 5
Group 7
0.5" dia. strand (typ.)
Figure 3.3 Specimen 2 and Loading Arrangement

16
10"
Lv =12"-46"
6"Lh=6"
10"
Lv = 46"
Typ. 6"
10" 10"
10"
Lv = 12"
23@6" = 138"
Section A-A
Group 4
steel plate
Embedment Length, Le = Lv+Lh
Group 2Group 3
load cell
LVDT
0.6" dia. strand (typ.)
0.6" dia. strand
Group 6
hydraulic jack
chuck
Group 5Group 7
steel plate
Group 8
Group 1
Figure 3.4 Specimen 3 and Loading Arrangement
Figures 3.2, 3.3 and 3.4 show sketches of the specimens and loading arrangement.
In order to vary the vertical embedment length, step-like plywood forms were built to cast
the specimens (see Figure 3.5). No confining reinforcement was used. This approach
would allow test results to be valid in practice, regardless of the level of confinement

17
reinforcement used in a diaphragm of an actual bridge. This conservative approach was
used in order to keep the number of experimental variables at a manageable level.
Figure 3.5 Specimen Fabrication
Figure 3.6 shows a typical setup of the pullout test. Load and strand slip were
recorded during the testing. The load was monitored with a pressure gauge. The strand
slip was carefully measured using a Linear Variable Differential Transducer (LVDT) with
a range of +/- 2 in. (+/-51 mm).
The method of loading was to apply the load for two seconds and then allow the
strand being pulled to slip for two seconds before applying the next load increment. The
average rate of loading was about 495 lbs per second. The tests were stopped when the
load significantly dropped after reaching a peak value.

18
Figure 3.6 Pullout Test Set-Up
Two important relationships were developed and plotted from the test results:
(a) The relationship between the pullout force and slip for the various vertical
embedment lengths; and
(b) The relationship between maximum strand stress, in terms of percent of
specified strand strength and total embedment length.
To obtain a unified embedment length equation, relationships between the ratio of
maximum steel stress to specified ultimate strand strength (fps/fpu) and the ratio of vertical
embedment length to nominal strand diameter (Lv/db) were plotted.
LVDT

19
3.4 Test Results and Discussion
The average cylinder strength of Specimens 1 and 2 on the testing date was 5350
psi (37 MPa). The average concrete strength of Specimen 3 on the testing date was 4063
psi (28 MPa). Figures 3.7, 3.8 and 3.9 show the relationship between the pullout force
and slip for different vertical embedment lengths. A summary of test results is listed in
Table 3.2.
Figure 3.7 Relationship of Pullout Force and Strand Slip (Specimen 1)
0
5
10
15
20
25
30
35
40
45
Pu
llou
t F
orc
e (k
ips)
Group 1 L h =6" L v =25"
0 0.05 0.1
Slip Scale (in.) Group 3 L h =6" L v =13"
Group 2 L h =6" L v =19"
Group 4 L h =6" L v =11"
Group 5 L h =6" L v =9.5"
Group 6 L h =6" L v =7"
Group 7 L h =6" L v =4"

20
Figure 3.8 Relationship of Pullout Force and Strand Slip (Specimen 2)
0
5
10
15
20
25
30
35
40
45 P
ullo
ut
Fo
rce
(kip
s)
Group 1 L h =10" L v =25"
0 0.05 0.1
Slip Scale (in.) Group 3 L h =10" L v =13.5"
Group 2 L h =10" L v =19"
Group 4 L h =10" L v =12.5"
Group 5 L h =10" L v =10.5"
Group 6 L h =10" L v =7.75"
Group 7 L h =10" L v =4.75"

21
0
10
20
30
40
50
60
Pu
llou
t F
orc
e (k
ips)
Group 1Lh=6"Lv=46"
Group 2Lh=6"Lv=42"
Group 3Lh=6"Lv=38"
Group 4Lh=6"Lv=34"
Group 5Lh=6"Lv=20"
Group 6Lh=6"Lv=16"
Group 7Lh=6"Lv=14"
Group 8Lh=6"Lv=12"
Slip Scale (in.)
0 0.05 0.1
Figure 3.9 Relationship of Pullout Force and Strand Slip (Specimen 3)

22
Table 3.2 Summary of Test Results
Specimen Lh Lv Max. Pullout Specimen Lh Lv Max. Pullout Specimen Lh Lv Max. Pullout (in.) (in.) Force (kips) (in.) (in.) Force (kips) (in.) (in.) Force (kips)
1 2 36 4 12.4 10 4.75 27.27 6 12 20.4
0.5-in 6 4 18 0.5-in 10 4.75 31.90 0.6-in 6 12 28.1diameter 6 4 22.7 diameter 10 4.75 N/A diameter 6 12 29.3
6 7 21.9 10 7.75 34.80 6 14 24.56 7 28 10 7.75 36.30 6 14 296 7 30 10 7.75 36.86 6 14 N/A6 9.5 34.8 10 10.5 39.70 6 16 22.76 9.5 36.2 10 10.5 40.30 6 16 27.36 9.5 N/A 10 10.5 40.33 6 16 32.76 11 32.2 10 12.5 36.19 6 20 43.86 11 36.7 10 12.5 37.50 6 20 N/A6 11 37.7 10 12.5 38.50 6 20 N/A6 13 33.9 10 13.5 34.60 6 34 45.76 13 36.5 10 13.5 35.20 6 34 N/A6 13 38.5 10 13.5 36.83 6 34 N/A6 19 38.4 10 19 38.60 6 38 50.86 19 38.5 10 19 38.70 6 38 N/A6 19 39.5 10 19 39.18 6 38 N/A6 25 41.2 10 25 41.07 6 42 53.46 25 41.5 10 25 41.24 6 42 N/A6 25 N/A 10 25 41.30 6 42 N/A
6 46 54.36 46 N/A6 46 N/A
The maximum pullout capacities of 0.5 and 0.6 in. (13 and 15 mm) diameter
strands were 41.3 and 58.6 kips (184 and 261 kN), respectively, for 270 ksi (1860 MPa)
specified strand strength. However, for 0.5 in. (13 mm) diameter strand, a total
embedment length of 35 in. (890 mm) was needed to reach fpu, the specified strand
strength. For 0.6 in. (15 mm) diameter strand, the total embedment length of 48 in. (1220
mm) was needed to reach 0.9fpu.
The specified strand strength of the 0.6 in (15.2 mm) diameter strands could not
be attained even with a total embedment length of 52 in. (1320 mm). For a total
embedment length greater than 44 in.(1120 mm), the pullout force did not significantly
increase (see Figure 3.9).

23
Several factors, including concrete strength, level of confinement, and loading
pattern, can affect the strand’s ability to attain its maximum specified strength. For that
reason, 0.8fpu is conservatively recommended as the maximum capacity of strands for
both diameters when using a specified concrete strength of 4000 psi (28 MPa).
The test results from this investigation were compared with the results from the
Missouri tests (12), as shown in Figure 3.10. The Missouri study indicated that concrete
strength was not a controlling factor when concrete strengths ranged from 3750 to 6900
psi (26 to 48 MPa).
Figure 3.10 Embedment Length vs %fpu at Maximum Load
As shown in Figure 3.10, the pullout capacity of non-prestressed bent strands
increases with an increase of the embedment length. A normalized relationship was
0
10
20
30
40
50
60
70
80
90
100
0 5 10 15 20 25 30 35 40 45 50 55 60
Embedment Length, L e = L h +L v (in.)
0.5 in. dia : Lh=10" 0.5 in. dia.: Lh=6" 0.5 in. dia.: Missouri test 0.6 in. dia.: Lh=6"
%f pu

24
plotted (see Figure 3.11) between the ratio of the maximum steel stresses to the specified
ultimate strand strength and the ratio of the vertical embedment lengths to nominal strand
diameters to obtain a representative vertical embedment length equation.
0
0.1
0.2
0.3
0.4
0.5
0.6
0.7
0.8
0.9
1
1.1
0 5 10 15 20 25 30 35 40 45 50 55 60 65 70 75 80
Lv/db
0.5 in. dia : Lh=10"
0.5 in. dia.: Lh=6"
0.6 in. dia.: Lh=6"
f ps/
f pu
fps =0.017(Lv/db)(fpu) < 0.8fpu
95 lower bound percentile estimated
Figure 3.11 Vertical Embedment Length-Nominal Diameter Ratio vs Strand-Stress-to-
Specified-Strength Ratio
The vertical part of the embedment length was considered to be the only
independent variable in the equation because the 6 in. (150 mm) horizontal length is fixed
to reflect common diaphragm dimensions in practice. An empirical embedment length
equation using the fifth percentile value from lower bound of the test results was
developed:
fps = 0.017fpu Lv/db ≤ 0.8fpu (3.1)

25
where fps = developed strand stress
Lv� = vertical embedment length of non-prestressed bent strand
fpu = specified tensile strength of prestressing tendons
db = nominal diameter of strand
Equation 3.1 gives the developed stresses in the strand corresponding to the
vertical embedment length. At the upper limit of Equation 3.1, (0.8fpu) the vertical
embedment lengths, Lv, for 0.5 in. and 0.6 in (13 and 15 mm) diameter strands are 24 in.
and 29 in. (610 and 737 mm), respectively.
It is therefore recommended that the total embedment length, Le, be at least 30 in.
(760 mm) for 0.5 in. (13 mm) diameter strands, and at least 36 in. (914 mm) for 0.6 in.
(15 mm) diameter strands, to attain a strand stress of 0.8fpu. These values are based on the
test results with concrete strength of at least 4000 psi (28 MPa).
From Equation 3.1, assuming a service level strand stress of 30 ksi (210 MPa), the
vertical embedment length is about 4 in. (100 mm). This length was the smallest vertical
length used in the testing. The test results of the three specimens tested at that length
showed high variability as shown in Figures 3.8 and 3.11. Specimens with longer vertical
strand embedment had a narrow range of variability. Because of the minimal cost
involved, it is recommended that the minimum vertical embedment used in design not be
less than 10 in. (250 mm), for a total horizontal plus vertical embedment of not less than
16 in. (406 mm). With the recommended minimum length, the strand is guaranteed to
develop much higher than the 30 ksi (210 MPa).

26
Table 3.3 summarizes the recommended embedment lengths for both 0.5 in. and
0.6 in. (13 and 150 mm) diameter strands. These lengths are recommended based on 4 in.
(100mm) strand spacing for 0.5 in.(13 mm) diameter strands and 6 in.(150 mm) strand
spacing for 0.6 in.(15 mm) diameter strands.
Table 3.3 Recommended Embedment Lengths
Diameter of Strand
(in.)
Total Embedment Length for Shear Design (in.)
Total Embedment Length for Time-Dependent Design (in.)
0.5 30 16
0.6 36 16

27
CHAPTER 4
FULL SCALE TEST OF BEAM END ANCHORAGE
4.1 Introduction
Design for shear is based on the strength limit state. Thus, checking strand
embedment at the abutments, and at the piers for simple span construction, should be
based on factored loads and the stress in strand that can be achieved at pull-out failure. In
chapter 3, the pullout capacity of non-tensioned prestressing strands was experimentally
investigated. However, the pullout capacity proposed in chapter 3 is based on a single
strand pullout without considering the group effect of the tension tie. In a concrete bridge
girder, the bottom flange contains tens of prestressed strands. When the girder is loaded,
all bottom reinforcement is expected to resist the tension force at the same time.
However, due to the extra wide bottom flange of an I-girder, the strands at the flange tip
may carry less tension than the strands in the line of the web. To investigate the pullout
capacity of the non-tensioned prestressed strands at the bottom flange, and to propose an
appropriate detail of anchorage in the beam end, a full- scale test of an NU I-girder was
performed.
4.2 Experimental Program
4.2.1 Testing Specimens
Four non-pretensioned NU 1100 I-beams were designed as shown in Figures 4.1
and 4.2. All beams were designed for 28-day concrete strength of 8,000 psi. All end
blocks were designed for 4000 psi concrete strength. The shear reinforcement for all
girders and the confinement reinforcement in all end blocks were deformed bars having a

28
specified yield strength of 60 ksi. 2#4 bars at a spacing of 4 in. were provided for shear
reinforcement as shown in Figures 4.1b) and 4.2. The specimens were fabricated in the
Bellevue plant of the Rinkers Materials Company. Figure 4.3 presents the typical
NU1100 I-section with 26 prestressing strands. All speciments had 22 straight strands
with a spacing of 4 in. in the bottom flanges. The bottom strands were 0.6-in. diameter,
Grade 270 ksi, low-relaxation 7-wire strands. Four straight strands of 0.5-in. diameter,
Grade 270 ksi, low-relaxation 7-wire strands were provided in the top flanges. The
bottom and top strands were pulled only to a stress level of 13,100 psi in order to
straighten and keep the strands in the required positions.

29
3'-7.3"
31'
8 Strands 8 Strands
See Details of End Sections and Bent Strands Profiles
4 Strands2 Strands
4 Strands
Figure 4.1 a) Typical Longitudinal Reinforcement
3'-7.3" 47-D18 SPA.@4"=184"
2.0"CL
15'-6.00"
Figure 4.1 b) Typical Shear Reinforcement

30
3'-7.3"
Steel Plate 0.5"x12"x15.5"
D18@4" Deformed WWR Grade 60
8 studs 0.5"φ x 5"H.S.
6.0" 6.0"1"
Figure 4.2 Shear Reinforcement at End Section
Figure 4.3 Beam End without End Block of Specimen B4E2

31
The experimental program was to study two variables used to detail the anchorage
blocks at the beam ends. These variables are a number of bent non-tensioned strands in
the end blocks and the total strand length embedded into the end blocks. Table 4.1
summarizes the properties of the tested specimens. Eight configurations of the end blocks
were designed by varying the embedment length and numbers of bent strands as shown in
Table 4.1. Figures 4.4 a) and b) show an end view of the bent strands in specimen B1E1.
Figures 4.5 a) and b) show an end view of the bent strands in specimen B3E2. Figures 4.6
and 4.7 show the reinforcement details of the anchorage block used in this study. #5 U-
bars as confinement reinforcement are provided in all anchorage end blocks.
Table 4.1 Properties of Specimens
Specimen
Concrete Strength of Girders at Time of
Testing
(psi)
Concrete Strength of Blocks at Time of
Testing
(psi)
Embedment Length
(in.)
Number of Bent Strands
Specified Actual Specified Actual Lh Lv
B1E1 8,000 9379.0 4,000 4737 6 30 22
B1E2 8,000 9379.0 4,000 5004 6 10 22
B2E1 8,000 9671.9 4,000 5665 6 30 16
B2E2 8,000 9671.9 4,000 5024 6 10 16
B3E1 8,000 9604.3 4,000 4515 6 30 10
B3E2 8,000 9604.3 4,000 4546 6 10 10
B4E1 8,000 9964.4 4,000 6389 6 30 6
B4E2 8,000 9964.4 4,000 NA 0 0 0
Note: 1 ksi = 6.9 MPa

32
3'-7.3"
2.0"
2.0"
8 strands8 strands
Bent Strand2'-6.0"
2'-6.0"
6.0"
4 strands2 strands
2" 4" 4" 4" 10" 4" 4" 4" 2"
2'-6.0"
2'-6.0"
6"4" 4" 4"4" 4"4"4" 4"2.0"
2.0" (Bend All 22 strands)
Figure 4.4 a) End Section of NU1100 I-girder (B1E1)
Figure 4.4 b) Bent Strands for Specimen B1E1

33
3'-7.3"
2"
2"
8 strands (Bend All)8 strands (Bend 2 strands)
Bent Strand
10"10"
6.0"
4 strands2 strands
2" 4" 4" 4" 10" 4" 4" 4" 2"
6"4" 4" 4"4" 4"4"4" 4"2"
2"
Figure 4.5 a) End Section of NU1100 I-girder (B3E2)
Figure 4.5 b) Bent Strands for Specimen B3E2

34
3'-1.3"
3.0" (clear cover)
3.0" (clear cover)
6#5, closed loop
#5@12 in.
3.0" (clear cover)
1'-6.0" 3.0" (clear cover)
Beam End
prestressing strands
End Block
3'-7.3"
Figure 4.6 Elevation of Typical Reinforcement in the End Block
Figure 4.7 Elevation of Reinforcement in the End Block (B3E2)

35
4.2.2 Testing Procedure
The load test was performed twice on each beam near both ends but with different
span lengths. One end of the beam was tested with a span length of 30 ft. Due to damage
from the first end testing; the second end of each beam was tested with a shorter span
length. A total of eight tests were performed. Table 4.2 shows information on the test set-
up and prediction of failure loads using the AASHTO LRFD method. Figure 4.8 shows
the test set-up for one girder. During testing, deflection was measured at the one-quarter
point and the midspan of the beam using a position transducer.
Figure 4.8 Test Set-Up
Zone tested earlier
End block

36
Table 4.2 Test Specimens
r fy bv d dv span a a/d % of bent 0.25f’cbvdv Specimen
(%) (ksi) (in.) (in.) (in.) (in.) (in.) strands (kips)
B1E1 1.695 72 5.9 39.3 38.2 360 60 1.53 100.0 528.5
B1E2 1.695 72 5.9 39.3 38.2 240 60 1.53 100.0 528.5
B2E1 1.695 72 5.9 39.3 38.2 360 96 2.44 72.7 545.0
B2E2 1.695 72 5.9 39.3 38.2 252 96 2.44 72.7 545.0
B3E1 1.695 72 5.9 39.3 38.2 240 60 1.53 45.5 541.2
B3E2 1.695 72 5.9 39.3 38.2 360 60 1.53 45.5 541.2
B4E1 1.695 72 5.9 39.3 38.2 252 96 2.44 27.3 561.4
B4E2 1.695 72 5.9 39.3 38.2 360 60 1.53 0 561.4
Note: 1 in. = 25.4 mm; 1 ksi = 6.9 MPa; 1 kip = 4.45 kN. r = vertical shear reinforcement percentage = Av/bvsv%, and fy = actual stirrup strength. 4.3 Test Results and Discussion
4.3.1 Ultimate Loads and Failure Mode
The ultimate shear strengths (Vu-test) and their modes of failure are summarized in
Table 4.3. Based on this experiment, the beams can be separated into three groups of
failure modes. Specimens B1E1, B1E2, B3E1, and B3E2 behaved in a similar manner.
The beams started cracking in the web between the support and the applied load. The
cracking angle relative to the longitudinal axis was approximately 45 degrees. While the
applied load increased, the cracks extended from both crack tips toward the support and
the applied load. During the development of the cracks, flexure cracks began at the
bottom flange and connected to the diagonal cracks. Near the failure loads, the cracking
angle became flatter, especially near the support. Spalling of the concrete surface of the
web was first visible in the middle region of the web-shear crack. Finally, the beams

37
failed in diagonal compression, crushing the concrete in the beam webs as shown in
Figure 4.9.
Table 4.3 Summary of Test Results
Vu-test Vu-test VPredicted, LRFD Vu-test Vu-Test VPredicted LRFD Mode of Specimen
(kips) fc’bvdv (kips) VPredicted, LRFD VB4E2 VB4E2 failure
B1E1 530.2 0.251 302.5 1.75 1.37 0.78 web crushing
B1E2 542.6 0.257 302.5 1.79 1.40 0.78 web crushing
B2E1 472.8 0.217 311.7 1.52 1.22 0.80 pure shear
B2E2 477.0 0.219 311.7 1.53 1.23 0.80 pure shear
B3E1 494.2 0.228 309.4 1.59 1.27 0.80 web crushing
B3E2 483.0 0.223 309.4 1.56 1.25 0.80 web crushing
B4E1 434.9 0.194 321.0 1.36 1.12 0.83 pure shear
B4E2 387.7 0.173 321.0 1.21 1.00 0.83 shear/bond
Note: 1 in. = 25.4 mm; 1 ksi = 6.9 MPa; 1 kip = 4.45 kN.
Figure 4.9 Web Crushing Failure of Specimen B3E1

38
A small crack was found at the connection between the girder end and the block
around the perimeter of the NU section. At very high load levels, the covering concrete at
the corner of the block spalled out in some girders as shown in Figure 4.9. This was
caused by the high bearing stress at the corner of the end block when the beams were bent
with the large deflection. Two patterns of cracks at the end block back were observed. For
the end blocks with the total embedment length of 36 in., a few vertical cracks were
found at the end block as shown in Figure 4.10. The first crack at the mid-block started
from the bottom face when the applied load reached about 420 -500 kips, corresponding
to a shear force of 350-375 kips. When the applied load was increased, the next crack
appeared as numbered in Figure 4.10. At beam failure stage, the end blocks were still in
good shape. The cracks were hairline cracks.
Figure 4.10 Crack of End Block at Failure of Specimen B1E2

39
For the end blocks with a total embedment length of 16 in., the vertical cracks
occurred at the mid-block, and started from the bottom face in manner similar to that of
the block with a total embedment length of 36 in. However, at an applied load higher than
500 kips, a horizontal crack appeared. The horizontal crack continued from the vertical
crack and horizontally moved toward both sides of the end block. At failure, the
horizontal cracks across the blocks were observed as shown in Figure 4.11. Similar
behavior occurred in all blocks with an embedment length of 16 in.
Figure 4.11 Crack of End Block at Failure of Specimen B3E2
Specimens B2E1, B2E2 and B4E1, which failed in pure shear failure mode,
started cracking from the bottom flanges. When the loads increased, the vertical flexure
crack changed direction to form diagonal cracks and moved toward the applied load. At
failure, the beams were sheared through, starting from beneath of the applied load and

40
moving toward the bottom flange at a distance of 40 in. away from the applied load. Six
bars of shear reinforcement with 90-degree hooks were pulled out of the top flanges. This
behavior is exactly the same for both specimens. Figure 4.12 represents shear failure of
Specimens B2E1, B2E2, and B4E1.
Figure 4.12 Pure Shear Failure of Specimen B2E1
Specimen B4E2 is the only specimen that did not have an end block and failed in
shear-bond failure mode. At an early stage, the cracks appeared in a web-shear cracking
form. As the load increased, however, the web shear crack extended into the beam end
and tended to cut the bottom flange off. At failure, the concrete around the bottom flange
at the beam end broke out. It was observed that significant strand slippage occurred as
shown in Figure 4.13.

41
Figure 4.13 Shear/Bond Failure of Specimen B4E2

42
4.3.2 Discussion of Test Results
In this research project, all girders have the same properties as shown in Table 4.1,
except for concrete strength which usually varies. The specimens were designed to study
the influence of the total embedment length and the number of bent strands embedded in
the blocks on shear capacity. All end blocks produced in this experiment have the same
material properties, detailing, and configurations as shown in Table 4.1 and Figures 4.6
and 4.7. The block was reinforced with #5 bars with a detail that will be proposed for
practical use. In a real bridge, an end block with limited width does not exist, but a
continuous end diaphragm does exist. Thus, the U-shape reinforcement was provided in
the end blocks of this test to represent the confinement of the continuous diaphragm.
As shown in Tables 4.2 and 4.3 and Figure 4.14, the test shear capacities are
higher than those predicted by the AASHTO LRFD method for all specimens. This test
shows that anchoring the longitudinal reinforcement in the end block appears to result in
higher shear strength. The testing specimens with the longitudinal reinforcement
anchored in the end diaphragm experienced web-crushing failure instead of shear bond
failure, as previously discussed. It is also observed from the full-scale testing that the
bulky bottom flange of the NU I-beams is effective in developing the tension tie function
as long as the strand is anchored into the end diaphragm.
Based on the test results, the beam without the end block gives the minimum
shear capacity of 387.8 kips, which is higher than the predicted value by about 20 percent.
The beam with the end block and 22 bent strands gives the maximum shear capacity of
542.6 kips, which is higher than the predicted value by about 80 percent. The embedment

43
lengths of 16 in. and 36 in. anchored in the end blocks do not show significantly different
results on shear capacity as shown in Figure 4.16. The number of the embedded strands is
a significant factor that increases shear capacity.
0.0
100.0
200.0
300.0
400.0
500.0
600.0
0 2 4 6 8 10 12 14 16 18 20 22 24
Number of Embedded Strand
Sh
ear
Str
engt
h (k
ips)
Test data with Le = 36 in.
Test data with Le = 16 in.
Test data with Le = 0 in.
LRFD with actual materials
LRFD with specified materials
Figure 4.14 Shear strength versus number of non-tensioned embedded strands
As shown in Table 4.3, Specimens B1E1 and B1E2 with 22 bent strands
embedded into the end block can reach the maximum shear limit of 0.25f’cbvdv introduced
in the AASHTO LRFD Specifications (13). The beams with 10 and 16 bent strands do not
exhibit a significant difference of shear capacity as shown in Figure 4.14. This situation
may arise due to the following reasons: 1) the shear span to depth ratio, a/d, of the beam
with 16 embedded strands is larger than that of the beam with 10 embedded strands, and
2) the beams with 16 embedded strands lost their capacities due to insufficient anchorage
44
of the shear reinforcement in the top flanges. As previously mentioned, six bars of shear
reinforcement were pulled out of the top flanges of Specimen B2E1 and B2E2.
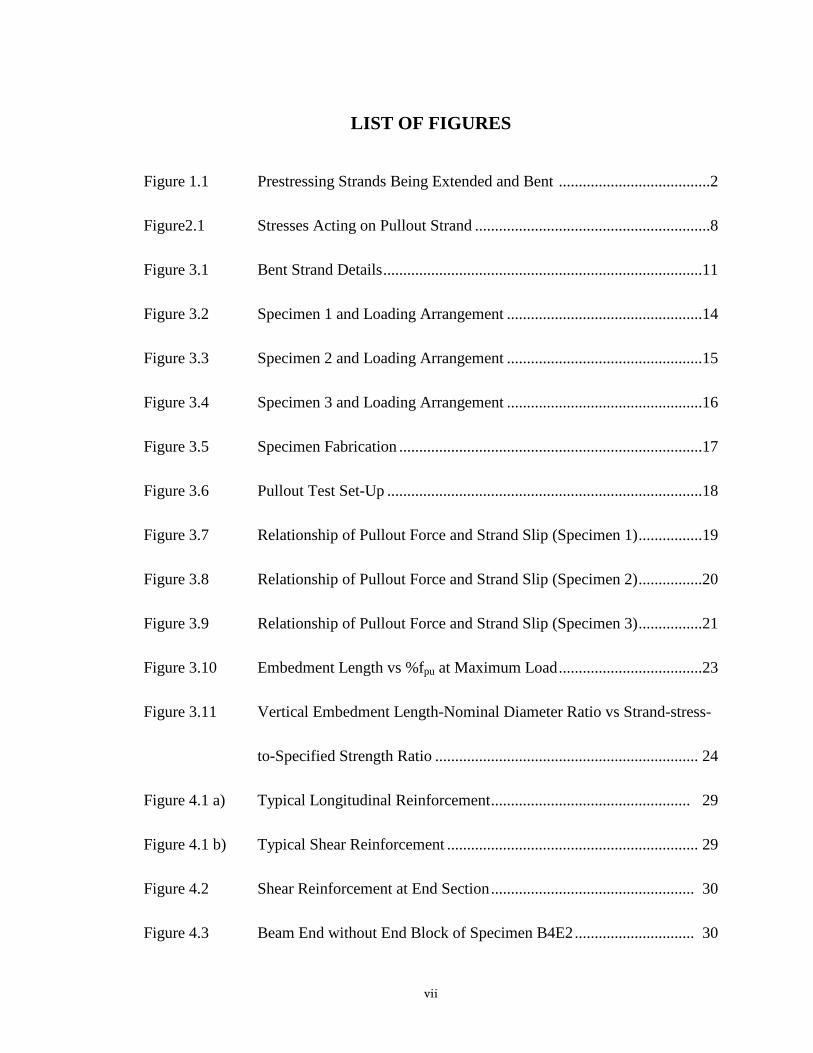
To study the efficiency of the anchorage end block, all test and predicted shear
strengths were normalized with the shear capacity of Specimen B4E2. The results are
shown in Table 4.3 and Figure 4.15. Obviously the AASHTO LRFD method is rather
conservative in predicting shear capacity, especially if the anchorages are provided at the
beam ends. The beam with 22 embedded strands can provide adequate shear capacity
through more than 30 percent of the beam without the block, and as high as 80 percent of
the shear strength predicted by the LRFD method.
0.00
0.20
0.40
0.60
0.80
1.00
1.20
1.40
1.60
0 10 20 30 40 50 60 70 80 90 100
Percentage of Embedded Strand
Nor
mal
ize
d S
hea
r S
tren
gth
Test data with a/d =1.53
Test data with a/d = 2.44
LRFD with actual materials
LRFD with specified materials
Vanchorage = Vn(1+0.3n/N)
Figure 4.15 Normalized shear strength versus anchorage of non-tensioned strands

45
4.4 Analyses of the Strand Stress in the End Blocks
The distribution of the tension force in the strands can be calculated using a truss
model and is shown in Figure 4.16 and Table 4.4. Because the test results show that the
embedment length does not increase shear capacity, only the beams with different
numbers of bent strands are presented. Figure 4.16 shows that the small shear span of 5 ft
affects the increase in tension force more near the support than the large shear span of 8
ft. In other words, the anchorage will be more effective if the load is applied near the
support. This is because when the shear span is longer than the development length, the
yield strength of the strands can be reached without requiring additional anchorage.
0
200
400
600
800
1000
1200
1400
0.0 1.0 2.0 3.0 4.0 5.0 6.0 7.0 8.0 9.0
Distance from Support (ft)
Te
nsio
n F
orce
in S
tra
nd (
kip)
B1 a = 60 in. 22 strands
B2 a = 96 in. 16 strands
B3 a = 60 in. 10 strands
B4 a = 96 in. 6 strands
B4E2 a = 60 in. 0 strands
Figure 4.16 Tension force in longitudinal reinforcement along shear span
46
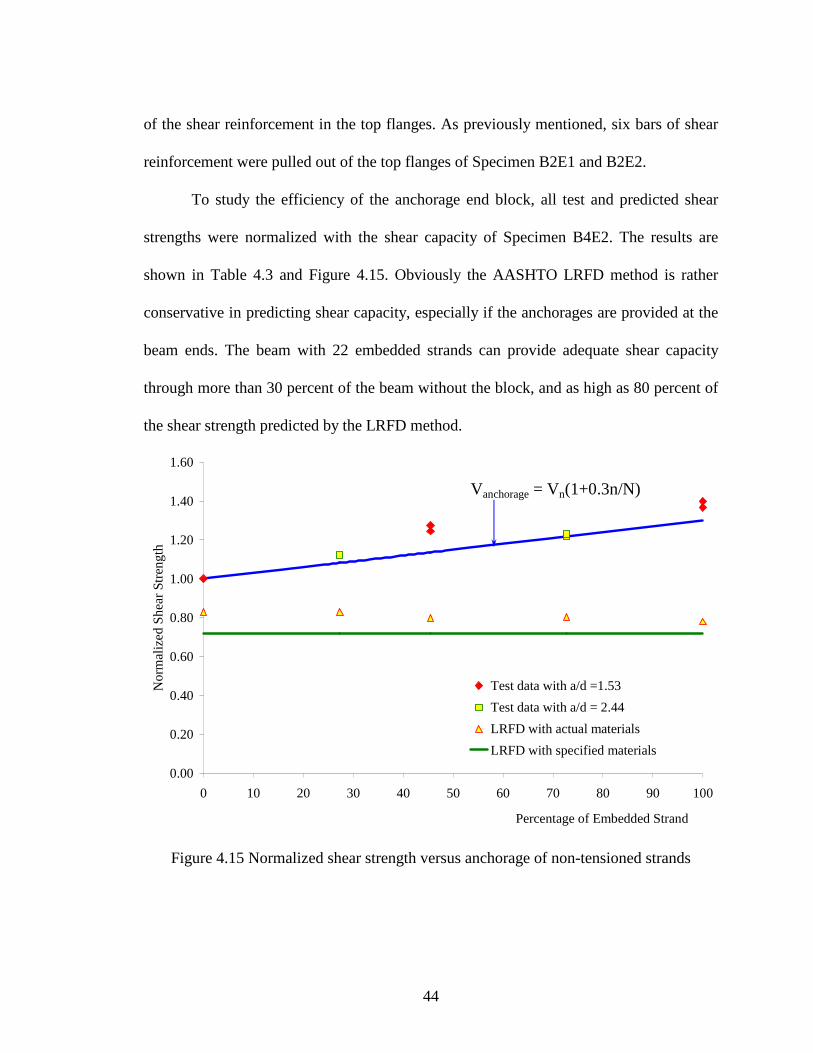
Table 4.4 Parameters to calculate strand stress
Load Tension Force at
Support Face Support Width
Measured Crack Angle, θAV
Strand Stress at Support Face Specimen
(kips) (kips) (in) (degree) (ksi)
B1E1 636.2 330.3 6 42.9 69.2
B1E2 723.5 338.0 6 42.1 70.8
B2E1 644.7 288.4 6 39.3 64.1
B2E2 770.6 291.0 6 39.8 64.9
B3E1 658.9 307.8 6 41.8 81.2
B3E2 579.6 300.9 6 41.9 80.0
B4E1 702.6 265.4 6 39.4 136.4
B4E2 465.2 241.5 12 40.9 50.6
Note: Support width is considered only a part of the beam on the 12-in wide bearing pad.
B4E2 is used as a reference beam to calculate the strand stresses at the section of
the support face. In Chapter 3 it is shown that the proposed equation of the strand stresses
results from the direct pullout tests of individual strands. In this chapter, the strand stress
of Specimen B4E2 was calculated from the tension force due to the load applied from the
beam top. As shown in Table 4.4 and Figure 4.17, the maximum strand stress at the
support face section is 50.6 ksi. Assuming that only the length of the bearing area is
effective in developing the tension tie force, the embedment length would be the bearing
width of the support, 12 in. For this beam the embedment length is considered to be the
straight embedded strands. Compared to the results in Chapter 3, it is found that for a
total embedment length of 10 in., the minimum strand stress is 81.0 ksi. However, the
strand stresses in Chapter 3 are based on bent strands. In a pretensioned concrete beam,
the strand stress at the considered section can be calculated from, for example, m(fpe)/ 36
for a 0.6-in. diameter strand, where m is the distance from the beam end to the section

47
considered. If the bearing width is 12 in. and fpe =145 ksi, the strand stress at the support
face is 12(145)/36 = 48.3 ksi. This value is close to the stress of 50.6 ksi calculated based
on the test data. Thus, it is proposed that the strand stress of non-tensioned and tensioned
straight strands can be calculated as:
fs = 50.6m/12 = 4.22m ~ 4.0m (4.1)
where fs = strand stress of prestressing strand at the section considered (ksi)
m = a distance from the beam end to the section considered (in.)
0.00
50.00
100.00
150.00
200.00
250.00
0.0 1.0 2.0 3.0 4.0 5.0 6.0 7.0 8.0 9.0
Distance from Support (ft)
Te
nsile
Str
ess
in S
tra
nd (
ksi)
B1 a = 60 in. 22 strands
B2 a = 96 in. 16 strands
B3 a = 60 in. 10 strands
B4 a = 96 in. 6 strands
B4E2 a = 60 in. 0 strands
Figure 4.17 Tensile stress in longitudinal reinforcement along shear span
Using Equation 4.1 for other specimens with a support width of 6 in., the strand
stress at the support section for an embedded straight strand is 25.3 ksi. Therefore, the
strand stress of the bent strands at the support section in each beam can be calculated as

48
shown in Table 4.4 and Figure 4.17. The horizontal lines of strand stresses are considered
as a lower bound value. However, in calculating the number of embedded bent strands,
only the stress at the support face is needed.
Specimen B4E1 gave the most critical strand stress of 136.4 ksi. This specimen
had 6 bent strands and 16 straight strands, and the total embedded length was 36 in. From
Chapter 3, the strand stresses of the total embedded length of 36 in. ranged from 104 –
150 ksi. However, the test in Chapter 3 showed that at this level of strand stress, the
blocks broke completely. Because the end blocks in this test did not break out, and only a
few hair-line cracks were observed as explained above, this test confirmed that the stress
equation in Chapter 3 can be used as a lower bound of the end block with confinement of
reinforcement. Thus, Equation (3.1) may be used to design the number of bent strands to
enhance shear capacity.
4.5 Conclusions of Beam End Anchorage Experiment
Based on the presented experiments in this chapter, the following conclusions can
be drawn:
1. The number of the embedded strands is a significant factor that increases shear
capacity if the strands are anchored in the end blocks with confinement reinforcement.
2. The test beams reach the maximum shear capacity of 0.25f’cbwdv with all bent strands
embedded into the end block.
3. The strand stresses in all beams do not exceed the strand stress design limit of 0.8fpu
in Chapter 3.

49
4. The embedment lengths of 16 in. and 36 in. anchored in the end blocks with
confinement reinforcement do not show significantly different results on the shear
capacity.
5. If proper reinforcement detail of the concrete diaphragm at the concrete bridge I-beam
is used, one can reach the maximum shear of 0.25f’cbvdv without adding more mild steel
in bottom flange to meet the requirement of AASHTO LRFD Specifications Section
5.8.3.5.

50
CHAPTER 5
APPLICATION OF ANCHORAGE AND DESIGN EXAMPLES
5.1 Introduction
This chapter covers the application of the proposed formula and design
recommendations of anchorage length for non-prestressed 90-degree bent strands in the
end diaphragm. Based on the test results in Chapter 3 and 4, the authors propose a unified
embedment length equation for 0.5 and 0.6 in (13 and 15 mm) diameter strands. The
equation was fitted at the fifth percentile value from lower limit. In addition, two
numerical design examples are presented.
5.2 Development Length and Application to Shear Design
The maximum possible shear capacity can be achieved if the bond strength
between the longitudinal flexural reinforcement and the surrounding concrete does not
control the failure. According to a shear test of pretensioned NU I-girders (1,2), adequate
strand anchorage is necessary to attain the maximum shear capacity and avoid bond
failure.
Bridge girders are subject to a number of loading patterns corresponding to
several failure modes. For example, the load can act near the beam end and, if the strands
are cut off at the beam end faces, shear/bond failure might occur because of the lack of
development length. In addition, strand slip can occur in the transfer zone. This prevents
the beam from attaining its nominal moment capacity (11). Recently, researchers (10, 11)
have tried to propose appropriate equations for the development length of the tensioned
strand.

51
A proposed approach for solving this problem is presented here. The pullout test
results, discussed in Chapter 3, indicate that a 30-in. (760 mm) total embedment length
of a 90-degree hooked 0.5 in. (13 mm) diameter strand is required. The corresponding
length for a 0.6 in. (15 mm) diameter strand is 36 in. (914 mm). These lengths can
develop strand stresses of at least 0.9fpu. However, the maximum capacity was obtained
when the strands were pulled one at a time. In actual structures, all strands are pulled at
the same time. This action might cause a reduction in the maximum capacity of the
section. The upper limit for Eq (3.1) is thus reduced to 0.8 fpu. Eq. (3.1) may be used to
estimate the strand stress if the minimum lengths specified above are not available in
shallow members.
Eq. (3.1) can be applied to satisfy Section 5.8.3.5 of the requirement of the
AASHTO LRFD Bridge Design Specifications (13). According to these specification, the
tension force at each section shall not be greater than the tensile capacity of the
reinforcement on the flexural tension side of the member. However, due to lack of full
development near the supports (if the strands are cut at the beam ends), mild steel
reinforcement may have to be provided to meet this requirement. In practice, this
arrangement is difficult because the bottom flange typically has many prestressing
strands, and any additional steel would create congestion and possible stress
concentration. The proposed solution is to anchor the strands in the end diaphragm. When
the strands are embedded in the diaphragm, the developed stresses in the strands are

52
higher at a given section; hence, they can be designed to meet the tensile force
requirement.
There is no additional cost if the existing strands at the end of girders are bent up
rather than cut off flush with the member end. The number of strands that need to be bent
to provide the required anchorage can be determined as follows.
Figures 5.1a and 5.1b show a simply supported beam subjected to a concentrated
load at midspan and a variation of tension force in the longitudinal reinforcement. This
example is used to determine the number of strands that would be bent into the end
diaphragm.
a) Beam Subjected to a Point Load
b) Tension Force in Longitudinal Reinforcement
Tension due to shear
Tension due to moment
Figure 5.1 Force Variations in Flexural Reinforcement over Beam Span

53
0.5 d cot 0.5 d cotv v
dv
θθV
V
VT
C
s
u
p
Shear Reinforcement
Prestressing Strands
Figure 5.2 Shear and Moment Resistance Forces near Support
From the equilibrium conditions of the free body diagram, shown in Figure 5.2,
and assuming that the moment at the support is zero and neither axial force nor torsion is
present in the beam, the following equation is obtained:
T > ���
����
�−− ps
u V0.5V�
Vcotθ (5.1)
where
T = tension force in longitudinal reinforcement, kip
φ = resistant factor for shear
Vu = factored shear force at critical section, kip
Vs = shear resistance provided by shear reinforcement at given section, kips
Vp = component of the effective prestressing force in the direction of the applied
shear, kip
θ = angle of inclination of diagonal compressive stress

54
Eq. (5.1) is the reduced form of Eq. (5.8.3.5-1) in the 2000 Interim AASHTO
LRFD Bridge Design Specifications (13), when the factored moment and factored axial
force are zero. To calculate the number of bent strands, the tensile force in the
reinforcement is set to equal the tensile force developed by the strands as:
T = n Aps1 fps (5.2)
where
n = the number of bent strand(s)
Aps1 = cross-sectional area of one strand, sq in.
fps = the developed stress in each strand, ksi
5.3 Recommendations of Reinforcement Detail in the End Diaphragm
In current pretensioned concrete bridge girder design, only the length of the
bearing area is considered effective in developing the tension tie force. The extra length
of bent strand embedded in the end diaphragm can improve strand development in this
critical zone of the member. Moreover, appropriate reinforcement details of the concrete
diaphragm at beam ends can increase strand stress capacity and reduce demand for
embedment length. Tests on I-beam ends completed in this study, utilizing 0.6 in. (15
mm) strands, have demonstrated no drop-off in shear capacity if the embedment length is
reduced from 36 in. (914 mm) to 16 in. (406 mm). A number of factors may contribute
to this enhanced strand anchorage capacity. These factors include the confinement of the
diaphragm concrete, the presence of diaphragm steel, and the presence of an anchor bar at
the strand bend. However, it is suggested that for all NU I-beams, a total length of 36 in.

55
strand extension be embedded in the diaphragm. This conservative recommendation does
not take the above-mentioned enhancements into account.
For inverted tee beams, with 0.5 in. (13 mm) diameter strands, a 30 in. total
extension, based on the pullout tests is recommended. A shorter extension may be
justifiable based on additional inverted tee beam end testing. For inverted tees that are too
shallow to accommodate this length, a partial anchorage stress should be calculated using
Equation (3.1).
The detailing of the reinforcement in the end diaphragm is proposed in Figure 5.3.
h
#5@12 in. continuous bar
#5@12 in.
1'-6" 10"
Beam End
prestressing strands
End Diaphragm
Figure 5.3 Proposed Detail Reinforcement in the diaphragm
The test results clearly indicate that the shear design procedures given in the
AASHTO LRFD Specifications are rather conservative for the anchorage details used in
Chapter 4. It is believed that the outstanding performance of these specimens is the result

56
of many factors. Most significantly, the strands were fully anchored into an end
diaphragm, forming a strong tie of the flexural reinforcement. This detail resulted in pure
shear or web crushing, rather than bond or flexural failure combined with shear failure, as
reported in most shear testing programs. It has been verified by testing that the specimen
without the end block results in the lowest shear capacity in this research project.
5.4 Design Examples
Two numerical design examples are presented below. The first example shows the
procedure for obtaining the number of bent strands corresponding to the tensile forces at
the support sections calculated by Eq. (5.1) or the reduced form of Eq. (5.8.3.5-1) in the
2000 Interim AASHTO LRFD Bridge Design Specifications. In addition, the tension
capacity provided by the bent strand anchorage was checked according to section 5.8.3.5-
1 of the AASHTO LRFD Bridge Design Specifications.
The second example demonstrates an application of the recommended embedment
length to design for crack control at the bottom fiber due to member creep at the interior
support of two-span continuous beams.
Example 1
This example provides the calculations for the required number of bent strands at
the ends of a 120-ft (36.6 m) single-span PCI bulb-tee beam. Information in this example
was obtained from section 9.4 of the PCI Bridge Design Manual (14).

57
Table 5.1 shows the values of the data needed for this example. It was either directly
extracted or obtained by linear interpolation from the solution in that example.
Table 5.1: Data from Example 9.4 of the PCI Bridge Design Manual14
Distance from the Support
centerline (in.)
Vu (kips)
Mu (k-ft)
Vs (kips)
Vp
(kips)
Centroid of tension
reinforcement (in.)
dv
0.00 350.5 0.0 282.6 23.4 4.22 57.95
3.00 349.3 75.1 282.6 23.4 4.22 57.95
13.29 345.2 332.9 282.6 23.4 4.22 57.95
72.00 321.8 1803.4 282.6 23.4 4.22 57.95
Figure 5.4 shows the proposed bent strand arrangement.
2' 2' 2' 2'
6.0"End View Elevation
Figure 5.4 Bent Strand at Girder End

58
Detailed Method: Analysis At the first diagonal crack section near the support
In this method the strand embedment at the first diagonal crack, assumed to be
initiated at the inside face of the support must be adequate to satisfy the anchorage
requirements of the LRFD Bridge Design Specifications(13) for longitudinal tension
reinforcement.
According to section 5.8.3.5 of AASHTO LRFD, the tensile capacity of the
reinforcement of the flexural tension side of the member has to be greater than or equal to
the tensile force, T, at the considered section calculated as:
T = ���
����
�−−++
φ psuu
v
u V0.5V�
V
�
N0.5
d
Mcotθ (LRFD Eq. 5.8.3.5-1)
Where Mu = factored moment at section corresponding to maximum factored shear force
Nu = applied factored axial force
dv = effective shear depth
Vu= factored shear force at given section
Vs = shear resistance provided by shear reinforcement at given section
Vp = component in the direction of the applied shear of the effective prestress
force
θ = angle of inclination of diagonal compressive stress
The bearing width of the support is assumed = 6 in.. The slope of the diagonal crack was
found from Example 9.4 to be 22.3o. As shown in Figure 5.5, the assumed crack plane
crosses the centroid of the 36-straight strands at a distance of (6/2 + 4.22cot 22.3 = 13.29
in.) from the support. Substituting for the values of the various parameters from Table

59
5.1, and recognizing that Nu =0 throughout and that the strength resistance factor φ =1.0
for flexure and 0.9 for shear:
)cot�pVs0.5V�
uV(
�
uN0.5
v�duM
T −−++=
= o.323.4)cot22282.60.50.9
345.2(0
57.95(1.0)
12 x 332.9 −×−++
= 602.6 kips (2680 kN)
The transfer length for transfer of prestress in bonded strands that are terminated
at the end face of the member is specified by the LRFD Specifications to be 60 times the
strand diameter, or 30 in. Since the embedment distance of these terminated strands is
only 13.29 in., the stress at this critical point is estimated proportionately as (16.29/30)
fpe= (16.29/30) (149) = 80.9 ksi.
Figure 5.5 Bent Strand Details
72.0"
24.0"
6 Bent Strands
1#5 Deformed bar
4.22"
6.0"
6.0" 4.22cot22.3 = 10.29"
Assumed plane of crack
36 Straight Strands
22.3°

60
Based on the bent strand pullout test study, if the length bent strand that is
embedded into an end diaphragm, Le, is 30 in. (a horizontal segment of 6 in. and a
vertical segment, Lv, of 24 in.), the strand can develop a stress given by the equation
fps = (0.017xfpu x Lv /db), but not greater than 0.8fpu,
Substituting for fpu =270 ksi, Lv =24 in. and db = 0.5 in., the steel stress that can be
developed in the bent strands is 216 ksi.
Let n = number of bent strands
T < the total tension capacity of embedment of the strands beyond the critical
location of 16.29 in. from member end.
Thus, 602.6 kips < n (0.153) (216) + (36-n) (0.153) (80.9)
n > 7.6 strands
Therefore, it is required to bend 8 strands into the end diaphragm.
Approximate Method: At the inside support face section
Simplifying LRFD Equation 5.8.3.5-1 by neglecting the bending moment at
support face and dropping the normal force which is generally taken as zero for this type
of member, the equation can be written as:
T = ���
����
�−− ps
u V0.5V�
Vcotθ (5.1)
Substituting into Eq. 5.1 with the values for x = 3 in. from the Table 5.1, T= 544.7 kips
(2423 kN).
The straight strands are embedded only 6 inches at this section. Thus, their stress
is estimated to be (6/30) fpe= (6/30) (149) = 29.8 ksi.

61
The bent strands with a 24 in. vertical embedment would still have a capacity of
216 ksi. The number of required bent strands can then be calculated from the relationship:
Thus, 544.7 kips < n (0.153) (216) + (36-n) (0.153) (29.8)
n > 13.36 strands
Therefore, it is required to bend 14 strands into the diaphragm to satisfy the longitudinal
reinforcement anchorage in the LRFD shear design specifications.
Example 2
An interior girder of a bridge with four equal 130 ft (40 m) spans was chosen from
an example in Reference 6 to illustrate the application of bending strands into the
diaphragms to resist the positive moment over the pier. Figure 5.6 shows the cross section
of the bridge. The prestressing steel consists of 48- ½ in. (13 mm) diameter low-
relaxation strands in each girder.
Assume the following design criteria:
Compressive strength of prestressed beam at release: f’ ci = 4000 psi (28 MPa)
Compressive strength of prestressed beam at 28 days: f’ c= 5000 psi (34 MPa)
Compressive strength of deck slab and diaphragm: f’c = 4500 psi (31 MPa)
Loading: AASHO HS20-44
Prestressing strand: ½ in. (12.7 mm) diameter, seven wire, low relaxation steel
-Area of one strand = 0.153 sq in. (99 mm2)
-Prestressing force (after losses) = 23.6 kips per strand (105 kN/strand)

62
6.5" Slab
Type VI AASHTO Girder
31.5'
28'21" 21"
8' 8' 8'
note: 1 in. = 25.4 mm; 1 ft = 0.305 m
Figure 5.6 Cross Section of Bridge
Figure 5.7 shows the pier location of the bridge. According to the analysis given
in Reference 6, positive moments develop over the piers due to girder creep and the effect
of live loads in remote spans.
130 ft 130 ft 130 ft 130 ft
Figure 5.7 Bridge Elevation Showing Abutment and Pier Locations
Note that the word “creep” in this report represents all time-dependent effects of
creep and shrinkage of the girder and deck concrete as well as of relaxation of the
prestressing steel. It can be seen that the positive restraint moment, M = 883 ft-kips (1197
kN-m), at Pier C is the most critical.

63
To design for the 883 ft-kips (1197 kN-m) moment at Pier C, the strands at the
girder end are extended into the diaphragm, as shown in Fig. 5.8. An approximate area of
untensioned strands may be estimated using the tension-compression lever arm jd = 0.9d,
where d is the effective depth from the top of the slab to the centroid of the strands being
bent.
Assuming that the centroid of the bent strands is 4 in. (100 mm) from the bottom
fiber, d = 74.5 in. (1892 mm). Using fs = 30 ksi (210 MPa) for crack control,
Aps = M /(0.9d)(fs)
Aps = 883,000x12 /(0.9x74.5x30,000)
= 5.27 sq in. (3400 mm2)
The number of strands required is = 5.27/0.153 = 34.4, use 36 strands.
Such a large number of strands is needed because of the very high value of the
creep coefficient used in the analysis in Reference 6, and because Reference 6 does not
consider that allowing controlled cracking could significantly reduce the magnitude of the
restraint moment. Normally the required number of bent strands is in the range of 20 to
40 percent of the total number of available bottom strands.
The Nebraska Department of Roads has in the past used the rule that 30 percent of
the available bottom strands, but not less than eight strands, should be bent into the
abutment diaphragm. As discussed above, the total embedment length should not be less
than 16 in. (406 mm). The detail of the bent strands is shown in Figure 5.8.

64
Bend 36 strands at beam ends
4@2"
72"
6.5"
Figure 5.8 Required Strand Embedment at Beam End

65
CHAPTER 6
CONCLUSIONS AND RECOMMENDATIONS
Based on the results of non-prestressed bent strand pullout tests of 0.5 and 0.6 in.
(13 and 15 mm) diameter strands embedded in cast-in-place concrete diaphragms with a
concrete compressive strength of 4000 psi (28 MPa) or greater, the following conclusions
and recommendations can be made:
1. The amount of additional cost in labor and materials caused by extending
strands and embedding them into end diaphragms is negligible.
2. The pullout capacity of the bent strands is proportional to the total embedment
length.
3. The pullout stress of a non-prestressed bent strand for a given embedment
length can be predicted by Eq. (3.1). This equation can be used to determine the
embedment length required at bridge abutments in applying Section 5.8.3.5 of the
AASHTO LRFD Bridge Design Specifications, which requires that a “tension tie” be
provided at beam end for shear capacity calculations.
4. It is conservative to assume that strands can attain 80 percent of the specified
strand strength, 0.8fpu, when the embedment lengths are at least 30 and 36 in. (760 and
914 mm) for 0.5 and 0.6 in. (13 and 15 mm) diameter strands, respectively.
5. A minimum embedment length of 16 in. (406 mm.) is recommended for crack
control (at service load level) due to time-dependent restraint positive moments at piers.

66
The full-scale tests of NU I-beam end anchorages have demonstrated that the
pullout capacity formula can be conservatively utilized to establish anchorage of strands
into end diaphragms. This anchorage can be provided at abutments to enhance the shear
capacity, and at the piers to control time-dependent restraint member cracking. The
maximum shear capacity of 0.25fc’bvdv given in the AASHTO LRFD Bridge Design
Specifications is achievable with adequate strand anchorage as recommended in this
study. Utilization of this rather high shear capacity should result in significant economy
of I-beam bridge systems, which was not recognized when the AASHTO Standard
Specifications were used for design.

67
REFERENCES
1. Tadros, M. K., and Yehia, A. S., Shear Limit of NU I-Beams, Nebraska Department of
Roads, Project Number SPR-PL-1 (35) P517, University of Nebraska, November
2001.
2. Ma, Z., Tadros, M. K., and Baishya, M., “Shear Behavior of Pretensioned High
Strength Concrete Bridge I-Girders,” ACI Structural Journal, V. 97, No. 1, January-
February. 2000, pp. 185-192.
3. Shahawy, M. and Cai, C.S., “Enhancement of the Performance of Prestressed
Concrete Girders Using Strand Anchorage,” PCI JOURNAL, V. 46, No. 5,
September-October 2001, pp. 82-96.
4. Ma, Z., Huo, X., Tadros, M. K., and Baishya, M., “Restraint Moments in
Precast/Prestressed Concrete Continuous Bridges,” PCI JOURNAL, V. 43, No. 2,
November-December 1998, pp. 40-57.
5. Oesterle, R.G., Gilkin, J.D., and Larson, S.C., “Design of Precast Prestressed Bridge
Girders Made Continuous,” National Cooperative Highway Research Program
(NCHRP) Report 322, Transportation Research Board, National Research Council,
Washington, DC, November 1989, 97 pp.
6. Freyermuth, Clifford, “Design of Continuous Highway Bridges with Precast
Prestressed Concrete Girders,” PCI JOURNAL, V.14, No. 2, April 1969, pp. 14-29.
7. Mirmiran, A., Kulkarni, S., Castrodale, R., Miller, R. and Hastak, M., “Nonlinear
Continuity Analysis of Precast Prestressed Concrete Girders with Cast-in-Place Decks
and Diaphragms,” PCI JOURNAL, V. 46, No. 5, September-October 2001, pp. 60-80.

68
8. Zia, P., and Mostafa, T., “Development Length of Prestressing Strands, PCI
JOURNAL, V. 22, No. 5, September-October 1977, pp.54-65.
9. Cousins, T., Johnston, D.W., and Zia, P., “Bond of Epoxy Coated Prestressing
Strand,” Publication No. FHWA/NC/87-005, Federal Highway Administration,
Washington, DC, December 1986.
10. Lane, S.N., “A New Development Length Equation for Pretensioned Strands in
Bridge Beams and Piles,” Report No. FHWA-RD-98-116, Federal Highway
Administration, McLean, VA, December 1998, 123 pp.
11. Shahawy, M., “A Critical Evaluation of the AASHTO Provisions for Strand
Development Length of Prestressed Concrete Members,” PCI JOURNAL, V. 46, No.
4, July-August 2001, pp. 94-117.
12. Salmons, J. R., “End Connections of Pretensioned I-Beam Bridges,” Study Number
72-2, University of Missouri, Columbia, Missouri, November 1974, pp. 1-51.
13. AASHTO LRFD, 2000 Interim Bridge Design Specifications, Second Edition,
American Association of State Highway and Transportation Officials, Washington,
D.C., 2000.
14. Precast Prestressed Concrete Bridge Design Manual, Precast/Prestressed Concrete
Institute, Chicago, IL, 1997.
15. Noppakunwijai, P., Jongpitakseel, N., Ma, Z., Yehia, S., and Tadros, M., “Pullout
Capacity of Non-Prestressed Bent Strands in Concrete Girders,” PCI JOURNAL, V.
47, No. 4, July/August 2002, pp. 90-103. See also discussion by McCrate and
Authors, PCI JOURNAL, V. 48, No. 4, July/August 2003, pp. 144-145.

69