Embed Size (px)
Citation preview
Anchor Selection Strategies for DIF Analysis:
Review, Assessment, and New Approaches
Julia KopfLMU Munchen
Achim ZeileisUniversitat Innsbruck
Carolin StroblUZH Zurich
Abstract
Differential item functioning (DIF) indicates the violation of the invariance assumptionfor instance in models based on item response theory (IRT). For item-wise DIF analysisusing IRT, a common metric for the item parameters of the groups that are to be compared(e.g., for the reference and the focal group) is necessary. In the Rasch model, therefore,the same linear restriction is imposed in both groups. Items in the restriction are termedthe anchor items. Ideally, these items are DIF-free to avoid artificially augmented falsealarm rates. However, the question how DIF-free anchor items are selected appropriatelyis still a major challenge. Furthermore, various authors point out the lack of new anchorselection strategies and the lack of a comprehensive study especially for dichotomous IRTmodels. This article reviews existing anchor selection strategies that do not require anyknowledge prior to DIF analysis, offers a straightforward notation and proposes threenew anchor selection strategies. An extensive simulation study is conducted to comparethe performance of the anchor selection strategies. The results show that an appropriateanchor selection is crucial for suitable item-wise DIF analysis. The newly suggested anchorselection strategies outperform the existing strategies and can reliably locate a suitableanchor when the sample sizes are large enough.
Keywords: Rasch model, differential item functioning (DIF), anchor selection, anchor class,anchoring, uniform DIF, measurement invariance.
1. Introduction
Differential item functioning (DIF) is present if test-takers from different groups – such asmale and female test-takers – display different probabilities of solving an item even if theyhave the same latent trait. In this case, the test results no longer represent the ability aloneand the groups of test-takers cannot be compared in an objective, fair way.
Various methods have been suggested to analyze item-wise DIF (see Millsap and Everson1993, for an overview). DIF tests based on item response theory (IRT) such as the item-wiseWald test (see e.g., Glas and Verhelst 1995) rely on the comparison of the estimated itemparameters of the underlying IRT model. For this purpose, anchor methods are employed toplace the estimated item parameters onto a common scale.
Previous studies showed that a careful consideration of the anchor method is crucial forsuitable DIF analysis: If the anchor contains DIF items, which is referred to as contamination(see e.g., Finch 2005; Woods 2009; Wang, Shih, and Sun 2012), the construction of a commonscale for the item parameters may fail and seriously increased false alarm rates can result (see
This is a preprint of an article accepted for publication in Educational and PsychologicalMeasurement, 75(1), 22–56. doi:10.1177/0013164414529792Copyright© 2015 The Author(s). http://epm.sagepub.com/.
2 Anchor Selection Strategies for DIF Analysis
e.g., Wang and Yeh 2003; Wang 2004; Wang and Su 2004; Finch 2005; Stark, Chernyshenko,and Drasgow 2006; Woods 2009; Kopf, Zeileis, and Strobl 2013). This means that items trulyfree of DIF may appear to have DIF and jeopardize the results of the DIF analysis as well asthe associated investigation of the causes of DIF (Jodoin and Gierl 2001). One alternative toreduce the risk of a contaminated anchor is to employ a short anchor that should be easierto find from the set of DIF-free items. However, the statistical power to detect DIF increaseswith the length of the (DIF-free) anchor (Thissen, Steinberg, and Wainer 1988; Wang andYeh 2003; Wang 2004; Shih and Wang 2009; Woods 2009; Kopf et al. 2013).
In the literature, one can find both methods that do and methods that do not require anexplicit anchor selection. While at first sight it may seem that methods that do not requirean anchor selection strategy have an advantage, it has been shown that there are situationswhere these methods are not suitable for DIF detection. The all-other anchor method, forexample, uses all items except for the currently studied item as anchor (see e.g., Cohen, Kim,and Wollack 1996; Kim and Cohen 1998) and requires no anchor selection strategy. However,the method was shown to be inadvisable for DIF detection when the test contains DIF itemsthat favor one group (Wang and Yeh 2003; Wang 2004). Excluding DIF items from theanchor by using iterative steps may not solve the problem when the test contains many DIFitems (Wang et al. 2012). In practice, there is usually no prior knowledge about the exactcomposition of the DIF effects and, thus, it is advisable to use an anchor method that relieson an explicit anchor selection strategy such as an anchor of the constant length of four items(used, e.g., by Thissen et al. 1988; Wang 2004; Shih and Wang 2009). An anchor selectionstrategy then guides the decision which particular items are used as anchor items.
Several anchor selection strategies have already been proposed, some of which rely on priorknowledge of a set of DIF-free items or on the advice of content experts, while others are basedon preliminary item analysis (for an overview see Woods 2009). Here, only those strategiesthat do not require any information prior to data analysis, such as the knowledge of certainDIF-free items, will be reviewed and presented in a straightforward notation in Section 3.2.The reason for excluding strategies that require prior knowledge about DIF-free items fromthis review is that in practical testing situations sets of truly DIF-free items are most likelyunknown (as opposed to simulation analysis, where the true DIF pattern is known) and eventhe judgment of content experts is unreliable (for a literature overview where this approachfails see Frederickx, Tuerlinckx, Boeck, and Magis 2010). New suggestions of anchor selectionstrategies are often only compared to few alternative strategies or in situations of only a limitedrange of the sample size and “have not been exhaustively compared for the dichotomous case”(Gonzalez-Betanzos and Abad 2012, p. 2). In this article, we systematically evaluate theperformance of the existing anchor selection strategies for DIF analysis in the Rasch modelby conducting an extensive simulation study.
Furthermore, we assess the appropriateness of the anchor selection strategies to find a suitableshort anchor (of four anchor items) and also their ability to select a suitable longer anchor,which “is a challenging question for researchers and practitioners” (Wang et al. 2012, p. 19).For practical research, recommendations how anchor items can be found appropriately arestill required (Rivas, Stark, and Chernyshenko 2009, p. 252). We also provide guidelines howto choose anchor items for the Rasch model when no prior knowledge of DIF-free items is athand.
In addition to the existing strategies, new developments of anchor selection strategies have alsobeen encouraged (Wang et al. 2012, p. 19). Here, we also suggest three new anchor selection
Copyright© 2015 The Author(s)

Julia Kopf, Achim Zeileis, Carolin Strobl 3
strategies. The new anchor selection strategies are implemented and the results show animprovement of the classification accuracy in the analysis of DIF in the Rasch model.
The article is organized as follows. The technical aspects of the anchoring process in theRasch model are introduced in the next section. Details of the anchor classes and of theexisting as well as of the newly suggested anchor selection strategies are given in Section 3.The simulation design is addressed in Section 4 and the results are discussed in Section 5. Aconcluding summary and practical recommendations are presented in Section 6.
2. Model and notation
In this section, the model and notation are introduced along with some technical statisticaldetails about the anchoring process that provide all information necessary for the implemen-tation of the anchor methods discussed in this article: (1) how parameter estimates undercertain restrictions can be obtained and (2) how the associated item-wise parameter differ-ences between a focal and reference group can be assessed given a selection of anchor items.In the next section, we provide the information about the model estimation and the requiredrestrictions for the Rasch model. In addition, the equations to transform the restrictions,which represent the core of the anchor methods, are given so that the entire procedure howto assess item-wise parameter differences can be outlined in Section 2.2.
Based on the resulting item-wise tests, the subsequent sections will then discuss how the testscan be combined employing a wide range of classes of anchors and different strategies forselecting the anchor items. In our discussion we focus on the Rasch model but the underlyingideas can also be applied to other IRT models.
2.1. Model estimation and scale indeterminacy
To fix notation, we employ the widely used (Wang 2004) Rasch model with item parametervector β = (β1, . . . , βk)> ∈ Rk (where k denotes the number of items in the test). It isestimated here using the conditional maximum likelihood (CML) approach, because of itsdesirable statistical properties and the fact that it does not rely on the person parameters(Molenaar 1995).
To overcome the scale indeterminacy (Fischer 1995) of the item parameters β, one linearrestriction is typically imposed on them. Hence, only k − 1 parameters can be freely esti-mated and the remaining one parameter is determined by the restriction. Commonly-usedapproaches restrict a set A ⊆ {1, . . . , k} of one or more (or even all) item parameters to sumto zero
∑`∈A β` = 0 (Eggen and Verhelst 2006). Conveniently, the item parameter estimates
β under any such restriction can be easily obtained from any other set of parameter esti-mates β fulfilling another restriction. Without loss of generality we employ the restrictionβ1 = 0 for the initial CML parameter estimates and also obtain the corresponding covariancematrix Var(β) which consequently has zero entries in the first row and in the first column.To obtain any other restriction of the sum type above, the item parameter estimates β andcorresponding covariance matrix estimate can be obtained as follows:
β = Aβ (1)
Var(β) = AVar(β)A>, (2)
Copyright© 2015 The Author(s)
4 Anchor Selection Strategies for DIF Analysis
where A = Ik − 1∑k`=1 a`
1k · a> is the contrast matrix corresponding to an indicator vector
a of elements a`, such as a = (0, 1, 0, 0, 0, . . .)> for item 2, with Ik denoting the identitymatrix and 1k = (1, 1, . . . , 1)> a vector of one entries of length k. To emphasize that theparameter estimates β depend on the set of restricted item parameters, we sometimes employthe notation β(A) in the following (although the dependence on A is mostly suppressed).
2.2. Item-wise parameter differences
In DIF analysis using IRT models, groups are to be compared regarding their item parameters.We focus here on the situation of item-wise comparisons between two groups (reference andfocal). In order to establish a common scale for the item parameters the same linear restriction∑
`∈Aβg` = 0 (g ∈ {ref, foc}) (3)
has to be imposed on the item parameters in both groups (Glas and Verhelst 1995). Thus, Ais the set of anchor items employed to align the scales between the two groups g.
More specifically, to assess differences between the two groups for the j-th item parameter βj(j = 1, . . . , k), the following steps are carried out:
1. Obtain the intial CML estimates βg in both groups g (i.e., using the restriction βg1 = 0).
2. Based on the same set of anchor items A, compute βg = βg(A) and corresponding
Var(βg) using Equations 1 and 2 so that Equation 3 holds in both groups g.3. Carry out an item-wise Wald test (see e.g., Glas and Verhelst 1995) for the j-th item
with test statistic tj = tj(A) given by
tj =βrefj − βfoc
j√Var(βref
j − βfocj )
=βrefj − βfoc
j√Var(βref)j,j + Var(βfoc)j,j
. (4)
Either the test statistic tj or the associated p-value pj can then be employed as a DIF indexbecause under the null hypothesis of no DIF the item parameters from both groups shouldbe equal: βref
j = βfocj .
Note that this item-wise Wald test is applied to the CML estimates (as in Glas and Ver-helst 1995) and not the joint maximum likelihood (JML) estimates (as in Lord 1980). Theinconsistency of the JML estimates leads to highly inflated false alarm rates (McLaughlinand Drasgow 1987; Lim and Drasgow 1990). In case other IRT models are regarded, therecent work of Woods, Cai, and Wang (2013) showed that an improved version of the Waldtest, termed Wald-1 (see Paek and Han 2013, and the references therein), also displayed well-controlled false alarm rates if the anchor items were DIF-free. Since the Wald-1 test alsorequires anchor items, it can in principle be combined with the anchor methods discussedhere as well.
3. Anchor methods
Under this null hypothesis of equality between all item parameters, in principle any set ofitems could be chosen for the anchor A. However, under the alternative that some of the kitem parameters are actually affected by DIF, the results of the analysis strongly depend on
Copyright© 2015 The Author(s)
Julia Kopf, Achim Zeileis, Carolin Strobl 5
the choice of the anchor items, as previous studies illustrated. If the anchor contains at leastone DIF item, it is referred to as contaminated (see e.g., Finch 2005; Woods 2009; Wang et al.2012). The scales may then be artificially shifted apart and the false alarm rates of the DIFtests may be seriously inflated (see e.g., Wang and Yeh 2003; Wang 2004; Wang and Su 2004;Finch 2005; Stark et al. 2006; Woods 2009). Instructive examples that illustrate the artificialscale shift are provided by Wang (2004) and Kopf et al. (2013).
For distinguishing between the different approaches, we employ a framework for anchor meth-ods previously used in Kopf et al. (2013) where the anchor class determines characteristicsof the anchor methods, such as a predefined anchor length, and the anchor selection strategyguides the decision which items are used as anchor items. The combination of an anchor classtogether with an anchor selection strategy is then termed an anchor method. Different anchorclasses are now briefly reviewed.
3.1. Anchor classes
The constant anchor class consists of an anchor with a predefined, constant length. Usually,it is claimed that a constant anchor of four items assures sufficient power (cf. e.g., Shih andWang 2009; Wang et al. 2012). An anchor selection strategy is needed to guide the decisionwhich items are used as anchor items. The all-other anchor class uses all items except forthe currently studied item as anchor and the equal-mean difficulty anchor class uses all itemsas anchor (see e.g., Wang 2004, and the references therein). These latter two anchor classesdo not require an additional anchor selection strategy. Furthermore, iterative anchor classesbuild the anchor in an iterative manner. The iterative backward class (used, e.g., by Drasgow1987; Candell and Drasgow 1988; Hidalgo-Montesinos, Lopez-Pina, and A. 2002) starts withall other items as anchor and excludes DIF items from the anchor, whereas the iterativeforward anchor class starts with a single anchor item and then, iteratively, includes items inthe anchor (Kopf et al. 2013). The latter anchor class also requires an explicit anchor selectionstrategy.
Wang (2004), Wang and Yeh (2003) and Gonzalez-Betanzos and Abad (2012) compared theall-other and the equal-mean difficulty anchor class to different versions of the constant anchorclass regarding various IRT models. All methods from the constant anchor class were builtusing prior knowledge about the set of DIF-free items to locate the anchor items. Methodsfrom the constant anchor class yielded well-controlled false alarm rates, whereas methodsfrom the all-other and the equal-mean difficulty anchor class displayed seriously inflated falsealarm rates when the direction of DIF was unbalanced (i.e. the DIF effects did not cancel outbetween groups and one group was favored in the test) and it is doubtful whether the situationof balanced DIF (i.e. no group has an advantage in the test) is met in practice (Wang andYeh 2003; Wang et al. 2012). This is of utmost importance for practical testing situations,since items truly free of DIF can display artificial DIF and may be eliminated by mistake.
As a result, all three studies showed that the direction of DIF has a major impact on theresults of the DIF analysis for the all-other and the equal-mean difficulty anchor class asopposed to the constant anchor class based on DIF-free anchor items. The constant anchorclass is in principle able to yield appropriate results for the DIF analysis even if DIF isunbalanced. However, since Wang and Yeh (2003), Wang (2004) and Gonzalez-Betanzos andAbad (2012) used prior knowledge of the set of DIF-free items to select the constant anchoritems, no information is yet available on how well anchor selection strategies without prior
Copyright© 2015 The Author(s)

6 Anchor Selection Strategies for DIF Analysis
knowledge perform and “[f]urther research is needed to investigate how to locate anchor itemscorrectly and efficiently” (Wang and Yeh 2003, p. 496).
Another anchor class was recently suggested by Kopf et al. (2013). Instead of a predefinedanchor length, the iterative forward anchor class builds the anchor in a step-by-step procedure.First, one anchor item is used for the initial DIF test. As long as the current anchor length isshorter than the number of items currently not displaying statistically significant DIF (termedthe presumed DIF-free items in the following), one item is added to the current anchor andDIF analysis is conducted using the new current anchor. The sequence which item is firstincluded and which items are added to the anchor is determined by an anchor selectionstrategy. In a simulation study, the iterative forward anchor class and the constant anchorclass were combined with two different anchor selection strategies and compared to the all-other class and the iterative backward anchor class. The iterative forward anchor class wasfound to be superior since it yielded high hit rates and, simultaneously, low false alarm ratesfor sufficiently large sample sizes in any studied condition of balanced or unbalanced DIF ifthe number of significant threshold anchor selection strategy (see Section 3.2) was employed(Kopf et al. 2013).
To assess the appropriateness of the anchor selection strategies in this article, we combinethem with the constant four anchor class and the iterative forward anchor class. The reasonfor this is that both classes require an anchor selection strategy and it is claimed in theliterature that they have a high power when the anchor selection works adequately (cf. e.g.,Shih and Wang 2009, for an literature overview regarding the constant four anchor class; Kopfet al. 2013, for the iterative forward anchor class). Furthermore, both classes are structurallydifferent. The constant four anchor class always includes four anchor items, and, thus, leadsto a short anchor, whereas the iterative forward class allows for a longer anchor that is builtin an iterative way. For a comparison with an anchor class that does not rely on an explicitanchor selection strategy, the all-other anchor class is included in the simulation as well,even though it can display seriously inflated false alarm rates when the direction of DIF isunbalanced (Wang and Yeh 2003; Wang 2004; Gonzalez-Betanzos and Abad 2012; Kopf et al.2013).
3.2. Anchor selection strategies
Anchor selection strategies determine a ranking order of candidate anchor items. We focuson those strategies that are based on preliminary item analysis since these strategies are mostcommon in practice. This approach has been referred to as the DIF-free-then-DIF strategyby Wang et al. (2012) because auxiliary DIF tests are conducted to locate (ideally DIF-free)anchor items before the final DIF tests are carried out.
Auxiliary DIF tests
For each item j = 1, . . . , k, auxiliary DIF tests are conducted using step 1 to 3 in Section 2.2.Typically, there are two alternative ways to conduct auxiliary DIF tests, that will be referredto as tests of type (I) or of type (II) in the following:
(I) The auxiliary DIF tests of type (I) are conducted using all-other items {1, . . . , k}\jas anchor. This yields one observed test statistic tj({1, . . . , k}\j) for every currentlystudied item j.
(II) The auxiliary DIF tests of type (II) are conducted using every other item ` 6= j asconstant single anchor. This results in (k − 1) test statistics per item tj({`}) with the
Copyright© 2015 The Author(s)

Julia Kopf, Achim Zeileis, Carolin Strobl 7
corresponding p-values pj({`}). Anchor selection strategies decide how all tests areaggregated to obtain the ranking order of candidate anchor items. Note that the teststatistics and p-values display the following symmetry properties |tj({`})| = |t`({j})|and pj({`}) = p`({j}) since the constant scale shift of one single anchor item is reflectedin the test statistic of the item currently investigated and vice versa. Even though thep-values represent a monotone decreasing transformation of the absolute test statistics,the aggregations of both measures may yield different ranking orders.
Rank-based approach
Anchor selection strategies use the information from the auxiliary DIF tests of type (I) orof type (II) to define a criterion cj for each item j that ideally reflects how strong the itemis affected by DIF. All anchor selection strategies that are regarded in this article follow arank-based approach that was first suggested together with auxiliary tests of type (I) byWoods (2009). The ranking order of candidate anchor items is defined by the ranks of thecriterion values rank (cj). The item displaying the lowest rank is the first candidate anchoritem, whereas the item corresponding to the highest rank is the last candidate anchor item.
The ranking order resulting from the anchor selection strategies is used within the anchorclasses to conduct the final DIF analysis. For the constant four anchor class, the items withthe lowest four ranks are selected as the final anchor set Afinal. For the iterative forwardanchor class, items are selected into the anchor as long as the anchor is shorter than thenumber of currently presumed DIF-free items. In this anchor class, anchor items are selectedin a step-by-step procedure following the ranking order that results from the anchor selection.When the stopping criterion is reached, the final anchor set Afinal is found.
Final DIF analysis
The final DIF tests are carried out using the anchor set Afinal. Since k − 1 parameters arefree in the estimation, only k − 1 estimated standard errors result (Molenaar 1995), the k-thstandard error is determined by the restriction and, hence, only k − 1 tests can be carriedout. To overcome the problem that the classification of an item as a DIF or a DIF-free item isintended for each of the k items, we classify the first final anchor item with the lowest rank tobe DIF-free – a decision that may be false if even the item with the lowest rank does indeedhave DIF, but in this case this would be noticeable in the final test results.
The decision to classify the first anchor item as DIF-free is applied only to those methodsthat rely on an anchor selection strategy. In the simulation study, the all-other method willbe included as well, for which the anchor varies for each test conducted and we report k testresults.
Note that classifying the first anchor item as DIF-free is by no means as drastic as testingonly those items for DIF that have not been selected as anchor, as was done, e.g., by Woods(2009), or as choosing the anchor items only from the set of items that are known to beDIF-free in a simulation, as was done by Wang and Yeh (2003) and Wang (2004) but cannotbe done in any real study where the true DIF and DIF-free items are unknown.
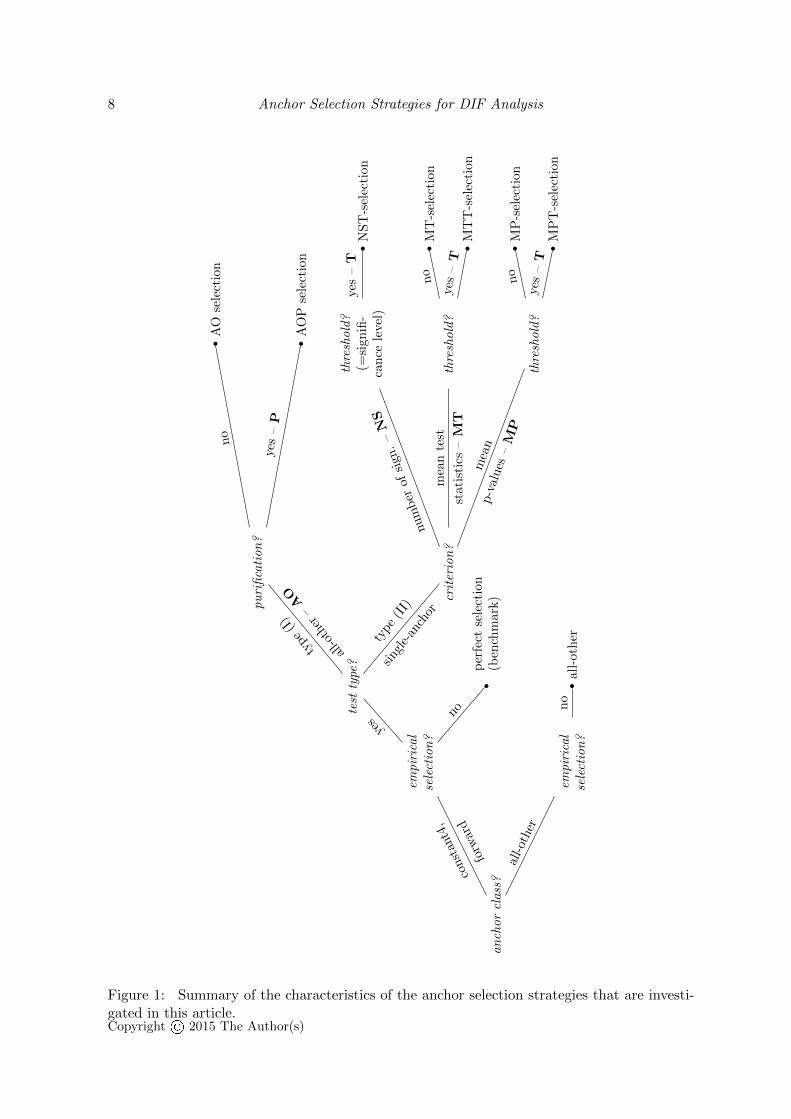
In the following, first, the selection strategies that are built on auxiliary DIF tests of type (I)are reviewed. Second, the selection strategies that rely on auxiliary DIF tests of type (II)are discussed. Third, three new selection strategies are suggested that also rely on auxiliaryDIF tests of type (II). A summary of all anchor selection strategies discussed in this articleis provided in Figure 1 and in Table 1 at the end of this section. Note that the DIF testsmentioned in the next paragraphs are only used as preliminary steps to assess the criterion
Copyright© 2015 The Author(s)
8 Anchor Selection Strategies for DIF Analysis
an
chor
class
?
empir
ical
sele
ctio
n?
all-
oth
erno
all-ot
her
empir
ical
sele
ctio
n?
per
fect
sele
ctio
n(b
ench
mar
k)
notest
type
?
crit
erio
n?
thre
shold
?
MP
T-s
elec
tion
yes
–T
MP
-sel
ecti
on
no
mea
np-v
alues
–M
P
thre
shold
?
MT
T-s
elec
tion
yes
–T
MT
-sel
ecti
on
no
mea
nte
st
stati
stic
s–M
T
thre
shold
?(=
signifi
-ca
nce
level
)N
ST
-sel
ecti
on
yes
–T
num
ber
ofsi
gn.
–NS
type
(II)
sing
le-a
ncho
rpu
rifi
cati
on
?
AO
Pse
lect
ion
yes
–P
AO
sele
ctio
nno
type
(I)
all-o
ther
–AO
yes
cons
tant
4,
forw
ard
Figure 1: Summary of the characteristics of the anchor selection strategies that are investi-gated in this article.Copyright© 2015 The Author(s)

Julia Kopf, Achim Zeileis, Carolin Strobl 9
Selection Description
AO The items are ranked according to the lowest absolute test statistics|tj({1, . . . , k}\j)|.
AOP Beginning with all other items as anchor, DIF items are iteratively excludedfrom the anchor until the purified anchor set Apurified is reached; the itemsare ranked according to the lowest absolute test statistics |tj(Apurified)|.
NST The items are ranked according to the lowest number of significant teststatistics tj({`}).
MT The items are ranked according to the lowest mean absolute test statistics1
k−1∑
`∈{1,...,k}\j |tj({`})|.MP The items are ranked according to the largest mean p-values
1k−1
∑`∈{1,...,k}\j pj({`}).
MTT The items are ranked according to the smallest number of test statisticstj({`}) exceeding the (d0.5 · ke)-th ordered absolute mean test statistic∣∣∣ 1k−1
∑`∈{1,...,k}\j tj({`})
∣∣∣.MPT The items are ranked according to the largest number of p-values pj({`})
exceeding the (d0.5 · ke)-th ordered mean p-value 1k−1
∑`∈{1,...,k}\j pj({`}).
perfect The perfect ranking consists of randomly permuted DIF-free items followedby randomly permuted DIF items.
Table 1: A short summary of the anchor selection strategies that are investigated in thisarticle.
values that determine the ranking order of candidate anchor items.
All-other selection
The all-other selection strategy (AO-selection) was proposed by Woods (2009) as what shecalled the rank-based strategy. For this strategy a predefined number of anchor items ischosen according to the lowest ranks of the absolute DIF test statistics resulting from theauxiliary DIF tests of type (I):
cAOj = |tj({1, . . . , k}\j)|. (5)
(Note that, originally, Woods (2009) suggested to use the ratios of the test statistics andthe degrees of freedom, that may vary across items if the items display a different numberof response categories. However, this is not discussed here since the responses are alwaysdichotomous in the Rasch model that we focus on here.)
The constant anchor method of 20% of the items based on the AO-selection was found to besuperior compared to the all-other anchor method in the majority of the simulated settingsand compared to the constant single anchor method based on the AO-selection (Woods 2009).Nevertheless, the author claimed that “[a] study comparing the strategy proposed here to thevarious other suggestions for empirically selecting anchors is needed” (Woods 2009, p. 53).
All-other purified selection
Recently, Wang et al. (2012) suggested a modification (here referred to as AOP-selectionfor all-other purified selection) of the all-other anchor selection strategy proposed by Woods(2009) by adding a scale purification procedure. First, auxiliary DIF tests of type (I) are
Copyright© 2015 The Author(s)
10 Anchor Selection Strategies for DIF Analysis
carried out. Similar to the iterative procedures (used, e.g., by Drasgow 1987; Candell andDrasgow 1988; Hidalgo-Montesinos et al. 2002), those items displaying DIF are excluded fromthe set of anchor items and DIF tests are conducted using the new anchor set. These stepsare repeated until two successive steps reach the same results. In the next step, DIF testsare conducted using the purified anchor Apurified. Here, the first anchor item obtains no DIFtest statistic, since only k − 1 test statistics are available, and is omitted in the ranking ofcandidate anchor items. The criterion values of the remaining k − 1 items are defined by
cAOPj = |tj(Apurified)|. (6)
In a simulation study, Wang et al. (2012) found the modified AOP-selection to be superior tothe AO-selection since both methods displayed comparable results when DIF was balancedbut the AOP-selection yielded more often a DIF-free anchor set when DIF was unbalanced.Still, there were conditions where the proportions of replications yielding a DIF-free anchorset were far away from 100%, e.g., 13% for the AO- and 17% for the AOP-selection when thesample size was small (i.e. 250 observations in each group in their most difficult scenarios).
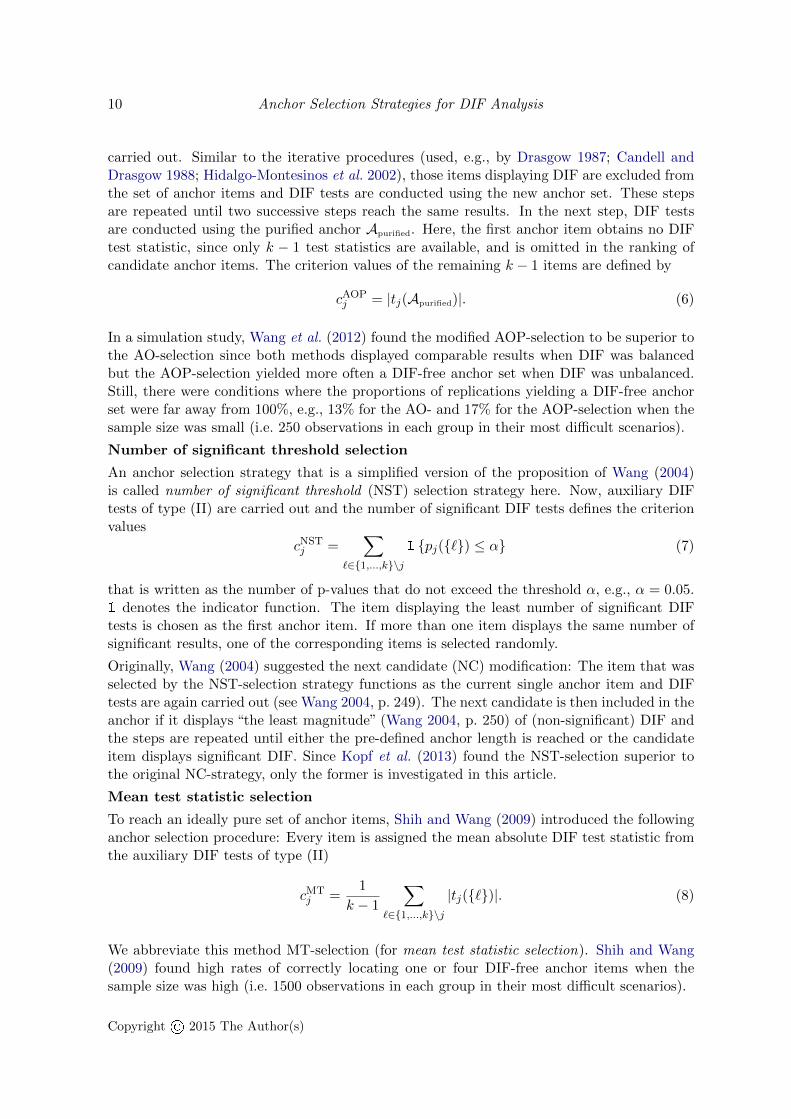
Number of significant threshold selection
An anchor selection strategy that is a simplified version of the proposition of Wang (2004)is called number of significant threshold (NST) selection strategy here. Now, auxiliary DIFtests of type (II) are carried out and the number of significant DIF tests defines the criterionvalues
cNSTj =
∑`∈{1,...,k}\j
1 {pj({`}) ≤ α} (7)
that is written as the number of p-values that do not exceed the threshold α, e.g., α = 0.05.1 denotes the indicator function. The item displaying the least number of significant DIFtests is chosen as the first anchor item. If more than one item displays the same number ofsignificant results, one of the corresponding items is selected randomly.
Originally, Wang (2004) suggested the next candidate (NC) modification: The item that wasselected by the NST-selection strategy functions as the current single anchor item and DIFtests are again carried out (see Wang 2004, p. 249). The next candidate is then included in theanchor if it displays “the least magnitude” (Wang 2004, p. 250) of (non-significant) DIF andthe steps are repeated until either the pre-defined anchor length is reached or the candidateitem displays significant DIF. Since Kopf et al. (2013) found the NST-selection superior tothe original NC-strategy, only the former is investigated in this article.
Mean test statistic selection
To reach an ideally pure set of anchor items, Shih and Wang (2009) introduced the followinganchor selection procedure: Every item is assigned the mean absolute DIF test statistic fromthe auxiliary DIF tests of type (II)
cMTj =
1
k − 1
∑`∈{1,...,k}\j
|tj({`})|. (8)
We abbreviate this method MT-selection (for mean test statistic selection). Shih and Wang(2009) found high rates of correctly locating one or four DIF-free anchor items when thesample size was high (i.e. 1500 observations in each group in their most difficult scenarios).
Copyright© 2015 The Author(s)
Julia Kopf, Achim Zeileis, Carolin Strobl 11
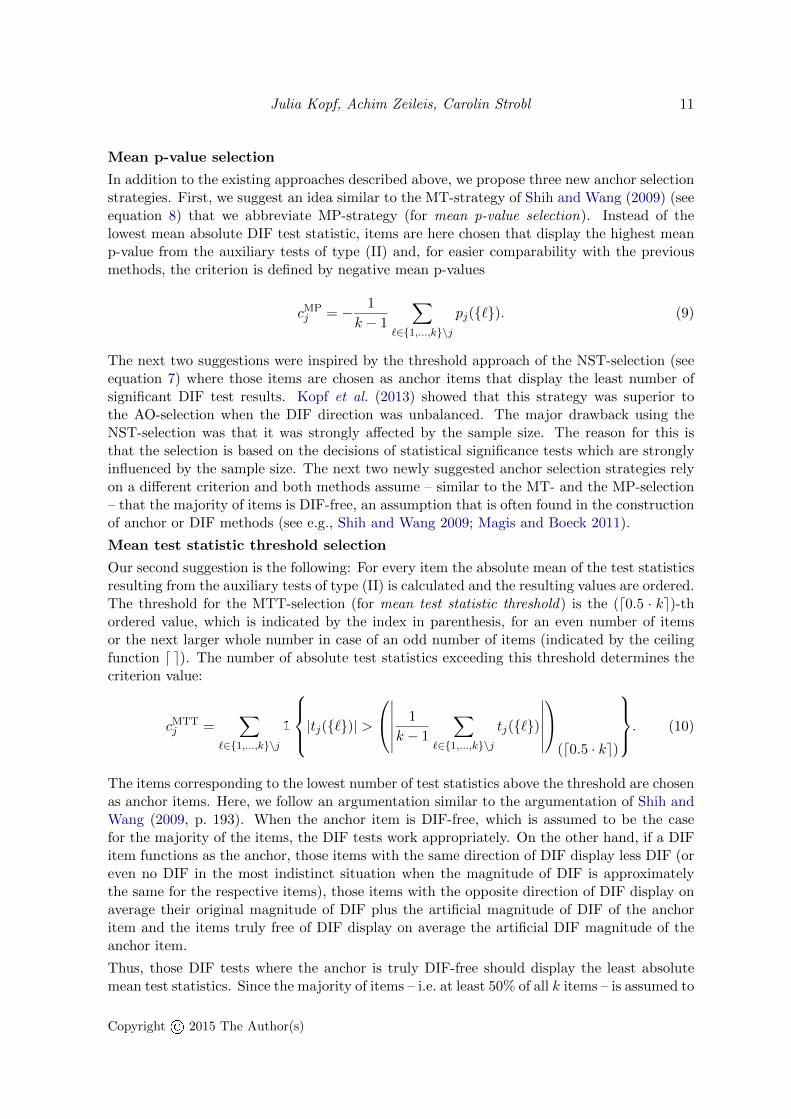
Mean p-value selection
In addition to the existing approaches described above, we propose three new anchor selectionstrategies. First, we suggest an idea similar to the MT-strategy of Shih and Wang (2009) (seeequation 8) that we abbreviate MP-strategy (for mean p-value selection). Instead of thelowest mean absolute DIF test statistic, items are here chosen that display the highest meanp-value from the auxiliary tests of type (II) and, for easier comparability with the previousmethods, the criterion is defined by negative mean p-values
cMPj = − 1
k − 1
∑`∈{1,...,k}\j
pj({`}). (9)
The next two suggestions were inspired by the threshold approach of the NST-selection (seeequation 7) where those items are chosen as anchor items that display the least number ofsignificant DIF test results. Kopf et al. (2013) showed that this strategy was superior tothe AO-selection when the DIF direction was unbalanced. The major drawback using theNST-selection was that it was strongly affected by the sample size. The reason for this isthat the selection is based on the decisions of statistical significance tests which are stronglyinfluenced by the sample size. The next two newly suggested anchor selection strategies relyon a different criterion and both methods assume – similar to the MT- and the MP-selection– that the majority of items is DIF-free, an assumption that is often found in the constructionof anchor or DIF methods (see e.g., Shih and Wang 2009; Magis and Boeck 2011).
Mean test statistic threshold selection
Our second suggestion is the following: For every item the absolute mean of the test statisticsresulting from the auxiliary tests of type (II) is calculated and the resulting values are ordered.The threshold for the MTT-selection (for mean test statistic threshold) is the (d0.5 · ke)-thordered value, which is indicated by the index in parenthesis, for an even number of itemsor the next larger whole number in case of an odd number of items (indicated by the ceilingfunction d e). The number of absolute test statistics exceeding this threshold determines thecriterion value:
cMTTj =
∑`∈{1,...,k}\j
1
|tj({`})| >∣∣∣∣∣∣ 1
k − 1
∑`∈{1,...,k}\j
tj({`})
∣∣∣∣∣∣
(d0.5 · ke)
. (10)
The items corresponding to the lowest number of test statistics above the threshold are chosenas anchor items. Here, we follow an argumentation similar to the argumentation of Shih andWang (2009, p. 193). When the anchor item is DIF-free, which is assumed to be the casefor the majority of the items, the DIF tests work appropriately. On the other hand, if a DIFitem functions as the anchor, those items with the same direction of DIF display less DIF (oreven no DIF in the most indistinct situation when the magnitude of DIF is approximatelythe same for the respective items), those items with the opposite direction of DIF display onaverage their original magnitude of DIF plus the artificial magnitude of DIF of the anchoritem and the items truly free of DIF display on average the artificial DIF magnitude of theanchor item.
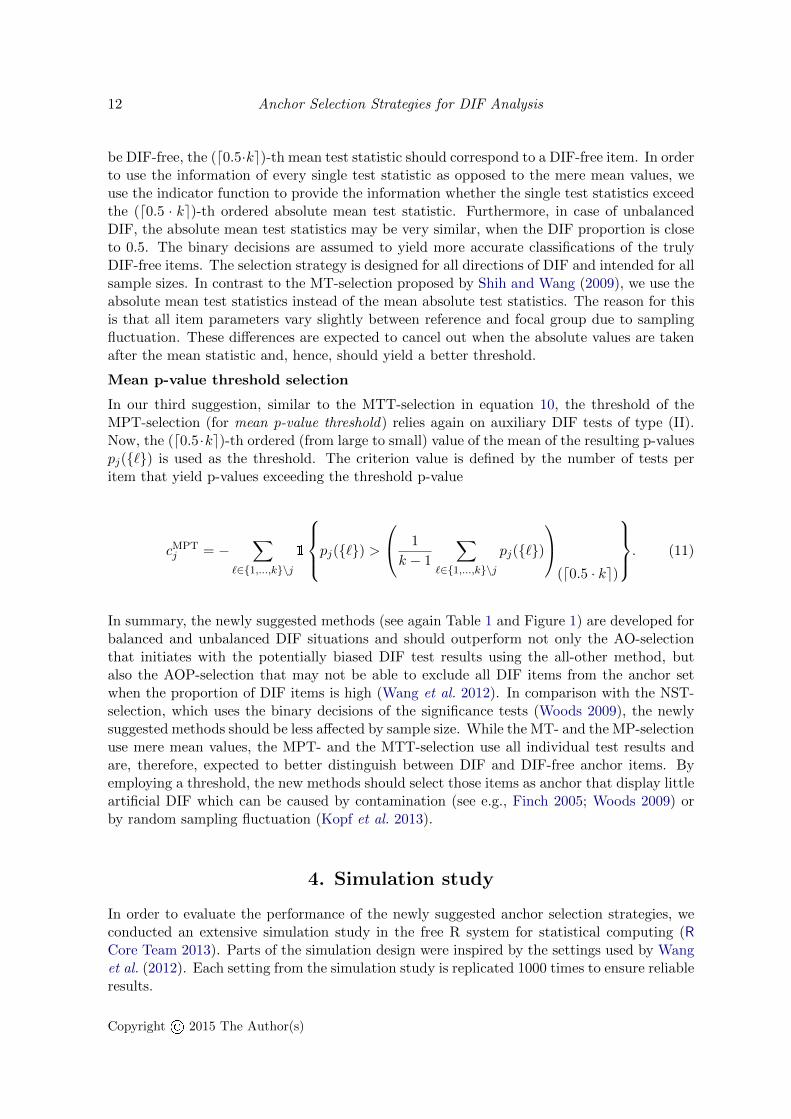
Thus, those DIF tests where the anchor is truly DIF-free should display the least absolutemean test statistics. Since the majority of items – i.e. at least 50% of all k items – is assumed to
Copyright© 2015 The Author(s)
12 Anchor Selection Strategies for DIF Analysis
be DIF-free, the (d0.5·ke)-th mean test statistic should correspond to a DIF-free item. In orderto use the information of every single test statistic as opposed to the mere mean values, weuse the indicator function to provide the information whether the single test statistics exceedthe (d0.5 · ke)-th ordered absolute mean test statistic. Furthermore, in case of unbalancedDIF, the absolute mean test statistics may be very similar, when the DIF proportion is closeto 0.5. The binary decisions are assumed to yield more accurate classifications of the trulyDIF-free items. The selection strategy is designed for all directions of DIF and intended for allsample sizes. In contrast to the MT-selection proposed by Shih and Wang (2009), we use theabsolute mean test statistics instead of the mean absolute test statistics. The reason for thisis that all item parameters vary slightly between reference and focal group due to samplingfluctuation. These differences are expected to cancel out when the absolute values are takenafter the mean statistic and, hence, should yield a better threshold.
Mean p-value threshold selection
In our third suggestion, similar to the MTT-selection in equation 10, the threshold of theMPT-selection (for mean p-value threshold) relies again on auxiliary DIF tests of type (II).Now, the (d0.5·ke)-th ordered (from large to small) value of the mean of the resulting p-valuespj({`}) is used as the threshold. The criterion value is defined by the number of tests peritem that yield p-values exceeding the threshold p-value
cMPTj = −
∑`∈{1,...,k}\j
1
pj({`}) > 1
k − 1
∑`∈{1,...,k}\j
pj({`})
(d0.5 · ke)
. (11)
In summary, the newly suggested methods (see again Table 1 and Figure 1) are developed forbalanced and unbalanced DIF situations and should outperform not only the AO-selectionthat initiates with the potentially biased DIF test results using the all-other method, butalso the AOP-selection that may not be able to exclude all DIF items from the anchor setwhen the proportion of DIF items is high (Wang et al. 2012). In comparison with the NST-selection, which uses the binary decisions of the significance tests (Woods 2009), the newlysuggested methods should be less affected by sample size. While the MT- and the MP-selectionuse mere mean values, the MPT- and the MTT-selection use all individual test results andare, therefore, expected to better distinguish between DIF and DIF-free anchor items. Byemploying a threshold, the new methods should select those items as anchor that display littleartificial DIF which can be caused by contamination (see e.g., Finch 2005; Woods 2009) orby random sampling fluctuation (Kopf et al. 2013).
4. Simulation study
In order to evaluate the performance of the newly suggested anchor selection strategies, weconducted an extensive simulation study in the free R system for statistical computing (RCore Team 2013). Parts of the simulation design were inspired by the settings used by Wanget al. (2012). Each setting from the simulation study is replicated 1000 times to ensure reliableresults.
Copyright© 2015 The Author(s)

Julia Kopf, Achim Zeileis, Carolin Strobl 13
4.1. Data generating processes
One replication corresponds to a data set that contains the information of the test includingthe item responses, the group membership and the ability variable.
� Test characteristicsHere, we consider a test length of k = 40 items.
� IRT modelThe responses follow the Rasch model
P (Uij = 1 | θi, βj) =exp(θi − βj)
1 + exp(θi − βj)(12)
with the difficulty parameters β = (−2.522, −1.902, −1.351, −1.092, −0.234, −0.317,0.037, 0.268, −0.571, 0.317, 0.295, 0.778, 1.514, 1.744, 1.951, −1.152, −0.526, 1.104,0.961, 1.314, −2.198, −1.621, −0.761, −1.179, −0.610, −0.291, 0.067, 0.706, −2.713,0.213, 0.116, 0.273, 0.840, 0.745, 1.485, −1.208, 0.189, 0.345, 0.962, 1.592)> used byWang et al. (2012). The first 10%, 25% or 40% of the items are simulated as the DIFitems (see Section DIF proportion and DIF direction below).
� Ability distributionIn the following simulation study, ability differences are simulated since this case is oftenfound to be more challenging for the methods than a situation where no ability differ-ences are present (see e.g., Penfield 2001). The ability parameters θi follow a standardnormal distribution for the reference group θref ∼ N(0, 1) and a normal distributionwith a lower mean for the focal group θfoc ∼ N(−1, 1) similar to Wang et al. (2012).
� DIF magnitudeFor those items j affected by DIF, the magnitude of DIF as simulated is set to theconstant value of ∆DIF
j = βrefj − βfoc
j = 0.4. This magnitude has previously been used byRogers and Swaminathan (1993).
4.2. Manipulated variables
In addition to the selection strategies investigated by Wang et al. (2012), namely the AO-and the AOP-selection, five other empirical anchor selection strategies, the perfect selectionof DIF-free items that serves as a benchmark method and the all-other method without anexplicit anchor selection strategy are included (for a summary see again Table 1 and Figure 1in Section 3.2).
� Sample sizeThe sample size is defined by the following pairs of reference and focal group sizes:(nref, nfoc) ∈ {(250, 250), (500, 500), (750, 750), (1000, 1000), (1250, 1250), (1500, 1500)}.
� DIF proportion and DIF directionThe proportion of simulated DIF items is varied from 0% DIF items – representingthe null hypothesis of no DIF – to 10%, 25% or 40% DIF items (such high proportionsof DIF items may actually occur in practical research; Allalouf, Hambleton, Sireci, andG. 1999, for example, found 45% DIF items in their study and Shih and Wang 2009,listed further examples of 40% or more DIF items).The sign of ∆DIF
j is set consistent with the intended direction of DIF. The directionof DIF is either balanced or unbalanced. In case of balanced DIF, the DIF items either
Copyright© 2015 The Author(s)
14 Anchor Selection Strategies for DIF Analysis
favor the focal or the reference group, and on average, no group has an advantage inthe test. In case of unbalanced DIF, all items favor the reference group.
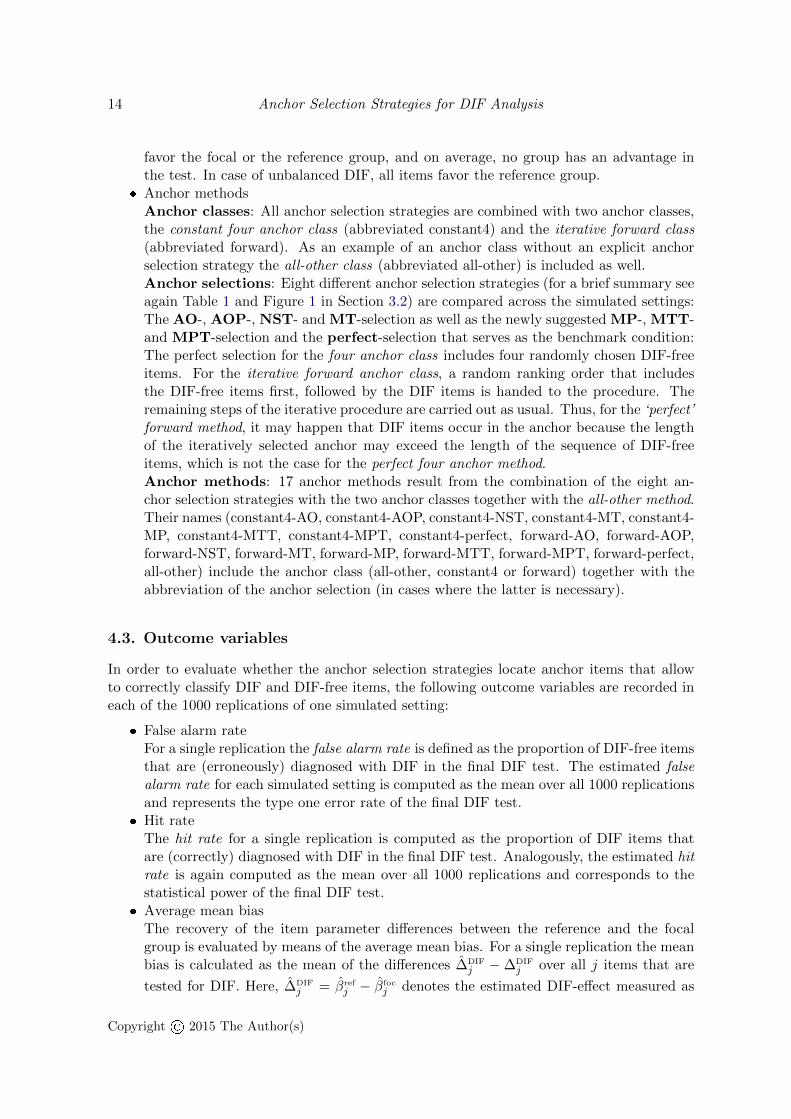
� Anchor methodsAnchor classes: All anchor selection strategies are combined with two anchor classes,the constant four anchor class (abbreviated constant4) and the iterative forward class(abbreviated forward). As an example of an anchor class without an explicit anchorselection strategy the all-other class (abbreviated all-other) is included as well.Anchor selections: Eight different anchor selection strategies (for a brief summary seeagain Table 1 and Figure 1 in Section 3.2) are compared across the simulated settings:The AO-, AOP-, NST- and MT-selection as well as the newly suggested MP-, MTT-and MPT-selection and the perfect-selection that serves as the benchmark condition:The perfect selection for the four anchor class includes four randomly chosen DIF-freeitems. For the iterative forward anchor class, a random ranking order that includesthe DIF-free items first, followed by the DIF items is handed to the procedure. Theremaining steps of the iterative procedure are carried out as usual. Thus, for the ‘perfect’forward method, it may happen that DIF items occur in the anchor because the lengthof the iteratively selected anchor may exceed the length of the sequence of DIF-freeitems, which is not the case for the perfect four anchor method.Anchor methods: 17 anchor methods result from the combination of the eight an-chor selection strategies with the two anchor classes together with the all-other method.Their names (constant4-AO, constant4-AOP, constant4-NST, constant4-MT, constant4-MP, constant4-MTT, constant4-MPT, constant4-perfect, forward-AO, forward-AOP,forward-NST, forward-MT, forward-MP, forward-MTT, forward-MPT, forward-perfect,all-other) include the anchor class (all-other, constant4 or forward) together with theabbreviation of the anchor selection (in cases where the latter is necessary).
4.3. Outcome variables
In order to evaluate whether the anchor selection strategies locate anchor items that allowto correctly classify DIF and DIF-free items, the following outcome variables are recorded ineach of the 1000 replications of one simulated setting:
� False alarm rateFor a single replication the false alarm rate is defined as the proportion of DIF-free itemsthat are (erroneously) diagnosed with DIF in the final DIF test. The estimated falsealarm rate for each simulated setting is computed as the mean over all 1000 replicationsand represents the type one error rate of the final DIF test.
� Hit rateThe hit rate for a single replication is computed as the proportion of DIF items thatare (correctly) diagnosed with DIF in the final DIF test. Analogously, the estimated hitrate is again computed as the mean over all 1000 replications and corresponds to thestatistical power of the final DIF test.
� Average mean biasThe recovery of the item parameter differences between the reference and the focalgroup is evaluated by means of the average mean bias. For a single replication the meanbias is calculated as the mean of the differences ∆DIF
j −∆DIFj over all j items that are
tested for DIF. Here, ∆DIFj = βref
j − βfocj denotes the estimated DIF-effect measured as
Copyright© 2015 The Author(s)
Julia Kopf, Achim Zeileis, Carolin Strobl 15
the difference between the estimated item parameter of the reference and of the focalgroup, whereas ∆DIF
j represents the simulated DIF-effect that is either 0.4, if item j is aDIF item, or 0 otherwise. The average mean bias is computed as the mean over all 1000replications. This measure identifies how well effect sizes, such as Raju’s area (Raju1988), are expected to cover the true DIF effects.
5. Results
In the following, we present the results of our simulation study. First, the selection of a shortanchor of four anchor items is regarded in the next section. Second, the selection of a longeranchor by means of the iterative forward anchor class is addressed in Section 5.2. Finally,the best performing anchor selection strategies are compared in Section 5.3.
5.1. Anchor selection for the constant four anchor class
In this section, the anchor selection strategies combined with the constant anchor class areregarded. Consequently, four anchor items were selected by the respective strategy, the resultsof the final DIF tests are discussed and compared to the all-other method.
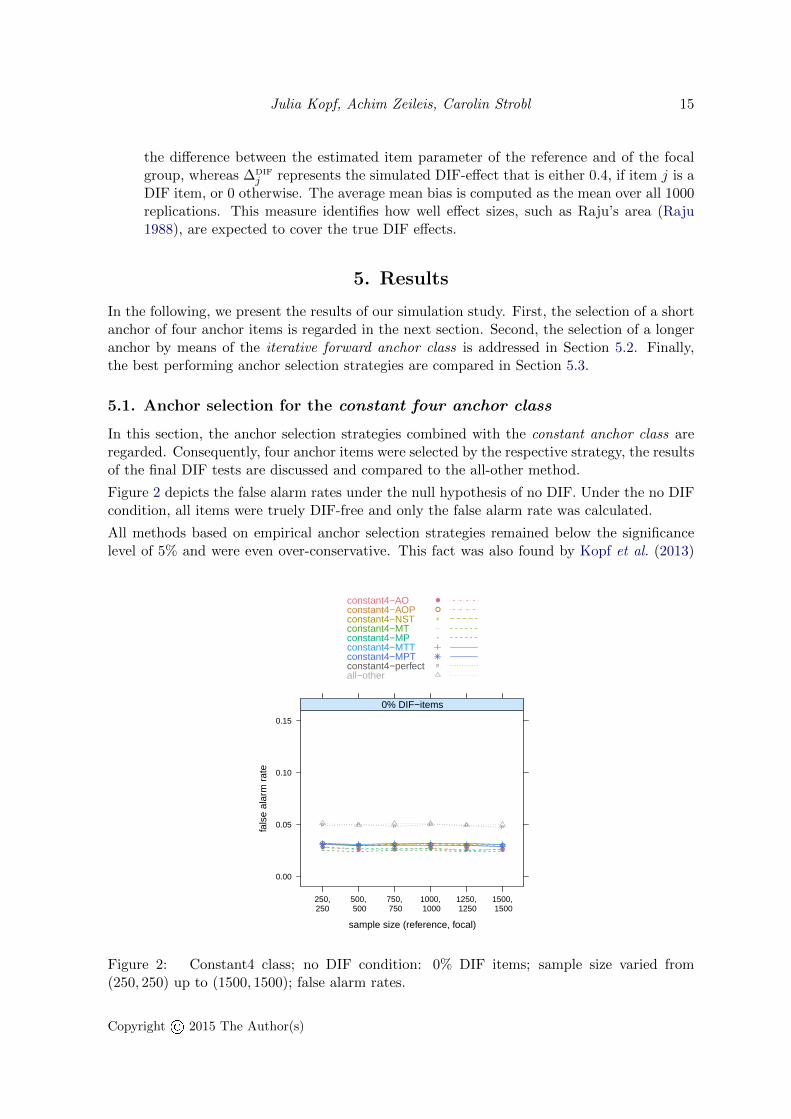
Figure 2 depicts the false alarm rates under the null hypothesis of no DIF. Under the no DIFcondition, all items were truely DIF-free and only the false alarm rate was calculated.
All methods based on empirical anchor selection strategies remained below the significancelevel of 5% and were even over-conservative. This fact was also found by Kopf et al. (2013)
sample size (reference, focal)
fals
e al
arm
rat
e
0.00
0.05
0.10
0.15
250,250
500, 500
750, 750
1000, 1000
1250, 1250
1500, 1500
● ● ● ● ● ●● ● ● ● ● ●# # # # # #_ _ _ _ _ _* * * * * *
p p p p p p
0% DIF−items
constant4−AOconstant4−AOPconstant4−NSTconstant4−MTconstant4−MPconstant4−MTTconstant4−MPTconstant4−perfectall−other
●
●
#
_
*
p
Figure 2: Constant4 class; no DIF condition: 0% DIF items; sample size varied from(250, 250) up to (1500, 1500); false alarm rates.
Copyright© 2015 The Author(s)
16 Anchor Selection Strategies for DIF Analysis
sample size (reference, focal)
hit r
ate
fals
e al
arm
rat
e
0.4
0.6
0.8
1.0
250,250
500, 500
750, 750
1000, 1000
1250, 1250
1500, 1500
●
●
●
●
●●
●
●
●
●
●
●
#
#
#
#
##
_
_
_
_
_
_
*
*
*
*
*
*
p
p
p
p
p
p
balanced DIF pattern10% DIF−items
hit rate
0.4
0.6
0.8
1.0
●
●
●
●
●●
●
●
●
●
●●
#
#
#
#
##
_
_
_
_
__
*
*
*
*
**
p
p
p
p
pp
balanced DIF pattern25% DIF−items
hit rate
0.4
0.6
0.8
1.0
250,250
500, 500
750, 750
1000, 1000
1250, 1250
1500, 1500
●
●
●
●
●●
●
●
●
●
●●
#
#
#
#
#
#
_
_
_
_
__
*
*
*
*
**
p
p
p
p
pp
balanced DIF pattern40% DIF−items
hit rate
0.00
0.05
0.10
0.15
● ● ● ● ● ●● ● ● ● ● ●# # # # # #
_ _ _ _ _ _* * * * * *
p p pp p p
balanced DIF pattern10% DIF−itemsfalse alarm rate
250,250
500, 500
750, 750
1000, 1000
1250, 1250
1500, 1500
0.00
0.05
0.10
0.15
● ● ● ● ● ●● ● ● ● ● ●# ##
# ##
_ _ _ _ _ _* * * * * *
p pp p p
p
balanced DIF pattern25% DIF−itemsfalse alarm rate
0.00
0.05
0.10
0.15
● ● ● ● ● ●● ● ● ● ● ●# #
#
#
##
_ _ _ _ _ _* * * * * *
p p p p p p
balanced DIF pattern40% DIF−itemsfalse alarm rate
constant4−AOconstant4−AOPconstant4−NSTconstant4−MTconstant4−MPconstant4−MTTconstant4−MPTconstant4−perfectall−other
●
●
#
_
*
p
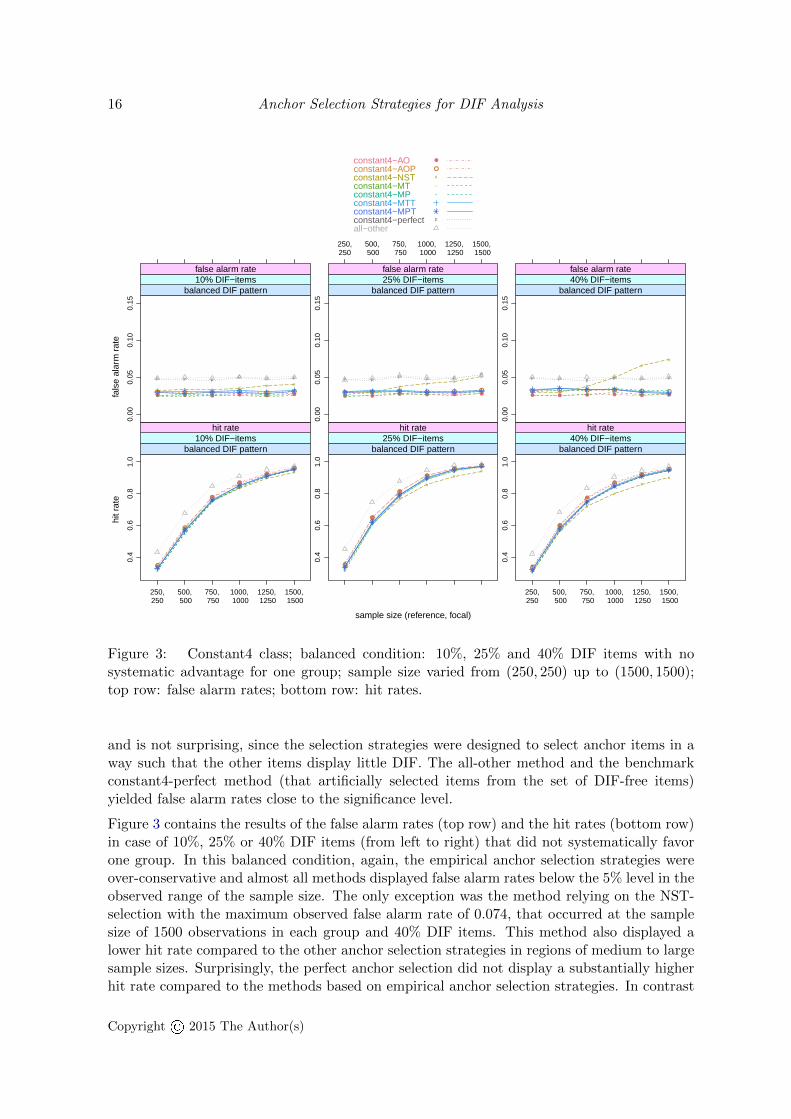
Figure 3: Constant4 class; balanced condition: 10%, 25% and 40% DIF items with nosystematic advantage for one group; sample size varied from (250, 250) up to (1500, 1500);top row: false alarm rates; bottom row: hit rates.
and is not surprising, since the selection strategies were designed to select anchor items in away such that the other items display little DIF. The all-other method and the benchmarkconstant4-perfect method (that artificially selected items from the set of DIF-free items)yielded false alarm rates close to the significance level.
Figure 3 contains the results of the false alarm rates (top row) and the hit rates (bottom row)in case of 10%, 25% or 40% DIF items (from left to right) that did not systematically favorone group. In this balanced condition, again, the empirical anchor selection strategies wereover-conservative and almost all methods displayed false alarm rates below the 5% level in theobserved range of the sample size. The only exception was the method relying on the NST-selection with the maximum observed false alarm rate of 0.074, that occurred at the samplesize of 1500 observations in each group and 40% DIF items. This method also displayed alower hit rate compared to the other anchor selection strategies in regions of medium to largesample sizes. Surprisingly, the perfect anchor selection did not display a substantially higherhit rate compared to the methods based on empirical anchor selection strategies. In contrast
Copyright© 2015 The Author(s)
Julia Kopf, Achim Zeileis, Carolin Strobl 17
sample size (reference, focal)
hit r
ate
fals
e al
arm
rat
e
0.2
0.4
0.6
0.8
1.0
250,250
500, 500
750, 750
1000, 1000
1250, 1250
1500, 1500
●
●
●
●
●●
●
●
●
●
●●
#
#
#
#
#
#
_
_
_
_
__
*
*
*
*
**
p
p
p
p
pp
unbalanced: all items favor reference10% DIF−items
hit rate
0.2
0.4
0.6
0.8
1.0
●
●
●
●
●
●
●
●
●
●
●●
#
#
#
#
#
#
_
_
_
_
_
_
*
*
*
*
**
p
p
p
p
pp
unbalanced: all items favor reference25% DIF−items
hit rate
0.2
0.4
0.6
0.8
1.0
250,250
500, 500
750, 750
1000, 1000
1250, 1250
1500, 1500
●
●
●
●
●
●
●
●
●
●
●
●
#
#
#
#
#
#
_
_
_
_
_
_
*
*
*
*
*
*
p
p
p
pp
p
unbalanced: all items favor reference40% DIF−items
hit rate
0.0
0.1
0.2
0.3
0.4
● ● ● ● ● ●● ● ● ● ● ●#
# # # # #_ _ _ _ _ _* * * * * *
p p p p p p
unbalanced: all items favor reference10% DIF−itemsfalse alarm rate
250,250
500, 500
750, 750
1000, 1000
1250, 1250
1500, 1500
0.0
0.1
0.2
0.3
0.4
●●
●●
●●
● ● ● ● ● ●#
##
# # #
_ _ _ _ _ _* * * * * *
p p p p p p
unbalanced: all items favor reference25% DIF−itemsfalse alarm rate
0.0
0.1
0.2
0.3
0.4
●
●
●
●
●●
●
●● ● ● ●
#
#
#
#
# #
_
__
__ _
** *
* **
p p p p p p
unbalanced: all items favor reference40% DIF−itemsfalse alarm rate
constant4−AOconstant4−AOPconstant4−NSTconstant4−MTconstant4−MPconstant4−MTTconstant4−MPTconstant4−perfectall−other
●
●
#
_
*
p
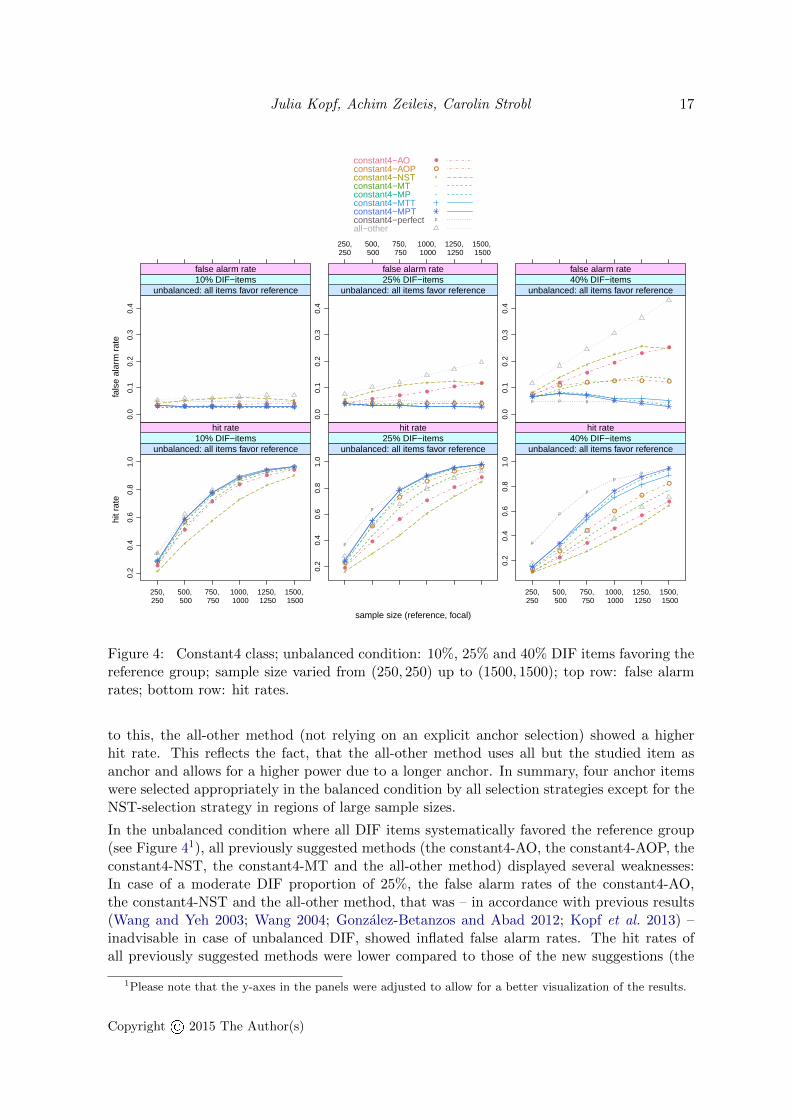
Figure 4: Constant4 class; unbalanced condition: 10%, 25% and 40% DIF items favoring thereference group; sample size varied from (250, 250) up to (1500, 1500); top row: false alarmrates; bottom row: hit rates.
to this, the all-other method (not relying on an explicit anchor selection) showed a higherhit rate. This reflects the fact, that the all-other method uses all but the studied item asanchor and allows for a higher power due to a longer anchor. In summary, four anchor itemswere selected appropriately in the balanced condition by all selection strategies except for theNST-selection strategy in regions of large sample sizes.
In the unbalanced condition where all DIF items systematically favored the reference group(see Figure 41), all previously suggested methods (the constant4-AO, the constant4-AOP, theconstant4-NST, the constant4-MT and the all-other method) displayed several weaknesses:In case of a moderate DIF proportion of 25%, the false alarm rates of the constant4-AO,the constant4-NST and the all-other method, that was – in accordance with previous results(Wang and Yeh 2003; Wang 2004; Gonzalez-Betanzos and Abad 2012; Kopf et al. 2013) –inadvisable in case of unbalanced DIF, showed inflated false alarm rates. The hit rates ofall previously suggested methods were lower compared to those of the new suggestions (the
1Please note that the y-axes in the panels were adjusted to allow for a better visualization of the results.
Copyright© 2015 The Author(s)
18 Anchor Selection Strategies for DIF Analysis
sample size (reference, focal)
aver
age
mea
n bi
as
0.00
0.05
0.10
0.15
● ● ● ● ● ●● ● ● ● ● ●
##
# # ##
_ _ _ _ _ _*
* * * * *p
pp p p p
10% DIF−itemsbalanced DIF pattern
250,250
500, 500
750, 750
1000, 1000
1250, 1250
1500, 1500
0.00
0.05
0.10
0.15
● ● ● ● ● ●● ● ● ● ● ●# # #
## #
_ _ _ _ _ _* * * * * *p p p p p p
25% DIF−itemsbalanced DIF pattern
0.00
0.05
0.10
0.15
● ● ● ● ● ●
●● ● ● ● ●
# ##
#
# #
_ _ _ _ _ _* * * * * *p
p p p p p
40% DIF−itemsbalanced DIF pattern
0.00
0.05
0.10
0.15
0.20
250,250
500, 500
750, 750
1000, 1000
1250, 1250
1500, 1500
● ● ● ● ● ●
●●
● ● ● ●
## #
#
#
#
_ _ _ _ _ _*
* * * * *p p pp p p
10% DIF−itemsunbalanced: all items favor reference
0.00
0.05
0.10
0.15
0.20
● ● ● ● ● ●
●
●
●● ● ●
## #
##
#_
_
__ _ _
*
*
**
* *p p p p p p
25% DIF−itemsunbalanced: all items favor reference
0.00
0.05
0.10
0.15
0.20
250,250
500, 500
750, 750
1000, 1000
1250, 1250
1500, 1500
● ● ● ● ●●
●
●
●
●●
●
# # ##
#
#_
_
__
_
_
*
*
*
*
*
*
pp p p p p
40% DIF−itemsunbalanced: all items favor reference
const4_AOconst4_AOPconst4_NSTconst4_MTconst4_MPconst4_MTTconst4_MPTconst4_perfall−other
●
●
#
_
*
p
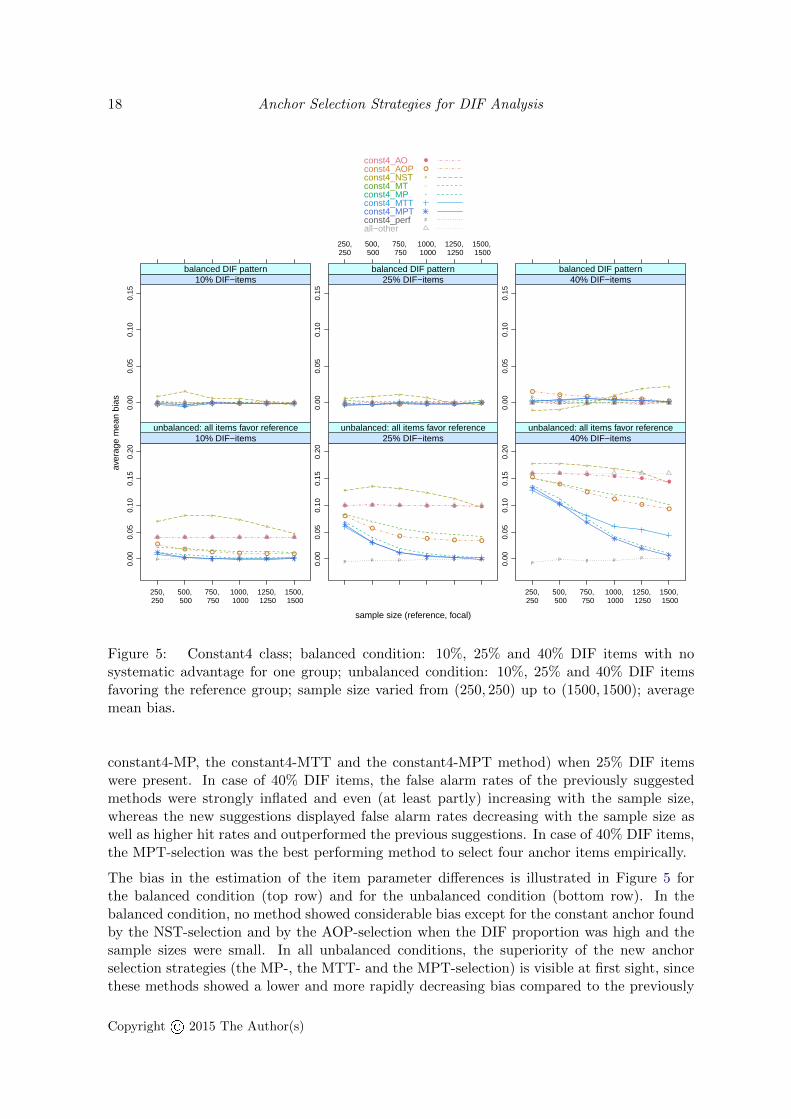
Figure 5: Constant4 class; balanced condition: 10%, 25% and 40% DIF items with nosystematic advantage for one group; unbalanced condition: 10%, 25% and 40% DIF itemsfavoring the reference group; sample size varied from (250, 250) up to (1500, 1500); averagemean bias.
constant4-MP, the constant4-MTT and the constant4-MPT method) when 25% DIF itemswere present. In case of 40% DIF items, the false alarm rates of the previously suggestedmethods were strongly inflated and even (at least partly) increasing with the sample size,whereas the new suggestions displayed false alarm rates decreasing with the sample size aswell as higher hit rates and outperformed the previous suggestions. In case of 40% DIF items,the MPT-selection was the best performing method to select four anchor items empirically.
The bias in the estimation of the item parameter differences is illustrated in Figure 5 forthe balanced condition (top row) and for the unbalanced condition (bottom row). In thebalanced condition, no method showed considerable bias except for the constant anchor foundby the NST-selection and by the AOP-selection when the DIF proportion was high and thesample sizes were small. In all unbalanced conditions, the superiority of the new anchorselection strategies (the MP-, the MTT- and the MPT-selection) is visible at first sight, sincethese methods showed a lower and more rapidly decreasing bias compared to the previously
Copyright© 2015 The Author(s)
Julia Kopf, Achim Zeileis, Carolin Strobl 19
suggested selection strategies and compared to the all-other method.
In summary, the MPT-selection outperformed the other suggestions in selecting four anchoritems by yielding a low false alarm rate while simultaneously achieving a high hit rate inany regarded condition. The newly suggested MP-selection yielded clearly better resultsthan the MT-selection even though both methods were structurally very similar and theMPT-selection slightly outperformed the MTT-selection when the DIF proportion was high.For this reason, an anchor selection based on mean p-values instead of mean test statisticsis advisable for selecting an anchor of constant length four in our simulated settings. Asexpected, the methods based on threshold comparisons (MPT- and MTT-selection) improvedthe final DIF test results in our study compared to the corresponding strategies based onmere mean values (MP- and MT-selection).
5.2. Anchor selection for the iterative forward anchor class
In the next section, we investigate the combination of the anchor selection strategies withthe iterative forward anchor class, that was designed to specify a longer anchor (Kopf et al.2013).
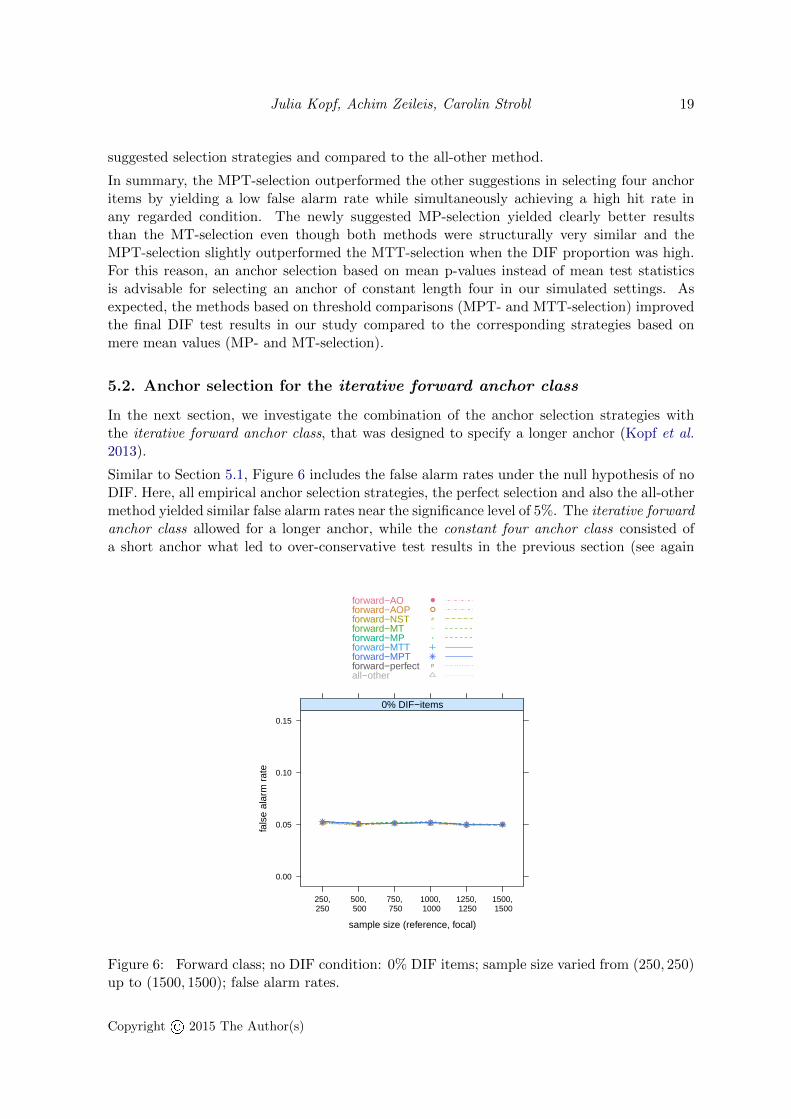
Similar to Section 5.1, Figure 6 includes the false alarm rates under the null hypothesis of noDIF. Here, all empirical anchor selection strategies, the perfect selection and also the all-othermethod yielded similar false alarm rates near the significance level of 5%. The iterative forwardanchor class allowed for a longer anchor, while the constant four anchor class consisted ofa short anchor what led to over-conservative test results in the previous section (see again
sample size (reference, focal)
fals
e al
arm
rat
e
0.00
0.05
0.10
0.15
250,250
500, 500
750, 750
1000, 1000
1250, 1250
1500, 1500
● ● ● ● ● ●● ● ● ● ● ●# # # # # #_ _ _ _ _ _* * * * * *p p p p p p
0% DIF−items
forward−AOforward−AOPforward−NSTforward−MTforward−MPforward−MTTforward−MPTforward−perfectall−other
●
●
#
_
*
p
Figure 6: Forward class; no DIF condition: 0% DIF items; sample size varied from (250, 250)up to (1500, 1500); false alarm rates.
Copyright© 2015 The Author(s)
20 Anchor Selection Strategies for DIF Analysis
sample size (reference, focal)
hit r
ate
fals
e al
arm
rat
e
0.4
0.6
0.8
1.0
250,250
500, 500
750, 750
1000, 1000
1250, 1250
1500, 1500
●
●
●
●
●●
●
●
●
●
●●
#
#
#
#
##
_
_
_
_
__
*
*
*
*
**
p
p
p
p
pp
balanced DIF pattern10% DIF−items
hit rate
0.4
0.6
0.8
1.0
●
●
●
●● ●
●
●
●
●● ●
#
#
#
## #
_
_
_
__ _
*
*
*
** *
p
p
p
pp p
balanced DIF pattern25% DIF−items
hit rate
0.4
0.6
0.8
1.0
250,250
500, 500
750, 750
1000, 1000
1250, 1250
1500, 1500
●
●
●
●
●●
●
●
●
●
●●
#
#
#
#
##
_
_
_
_
__
*
*
*
*
**
p
p
p
pp
p
balanced DIF pattern40% DIF−items
hit rate
0.00
0.05
0.10
0.15
● ● ● ● ● ●● ● ● ● ● ●# # # # # #_ _ _ _ _ _* * * * * *p p p p p p
balanced DIF pattern10% DIF−itemsfalse alarm rate
250,250
500, 500
750, 750
1000, 1000
1250, 1250
1500, 1500
0.00
0.05
0.10
0.15
● ● ● ● ● ●● ● ● ● ● ●# # # # #
#_ _ _ _ _ _
* * * * * *p p p p p p
balanced DIF pattern25% DIF−itemsfalse alarm rate
0.00
0.05
0.10
0.15
● ● ● ● ● ●● ● ● ● ● ●# # # # # #_ _ _ _ _ _* * * * * *p p p p
p p
balanced DIF pattern40% DIF−itemsfalse alarm rate
forward−AOforward−AOPforward−NSTforward−MTforward−MPforward−MTTforward−MPTforward−perfectall−other
●
●
#
_
*
p
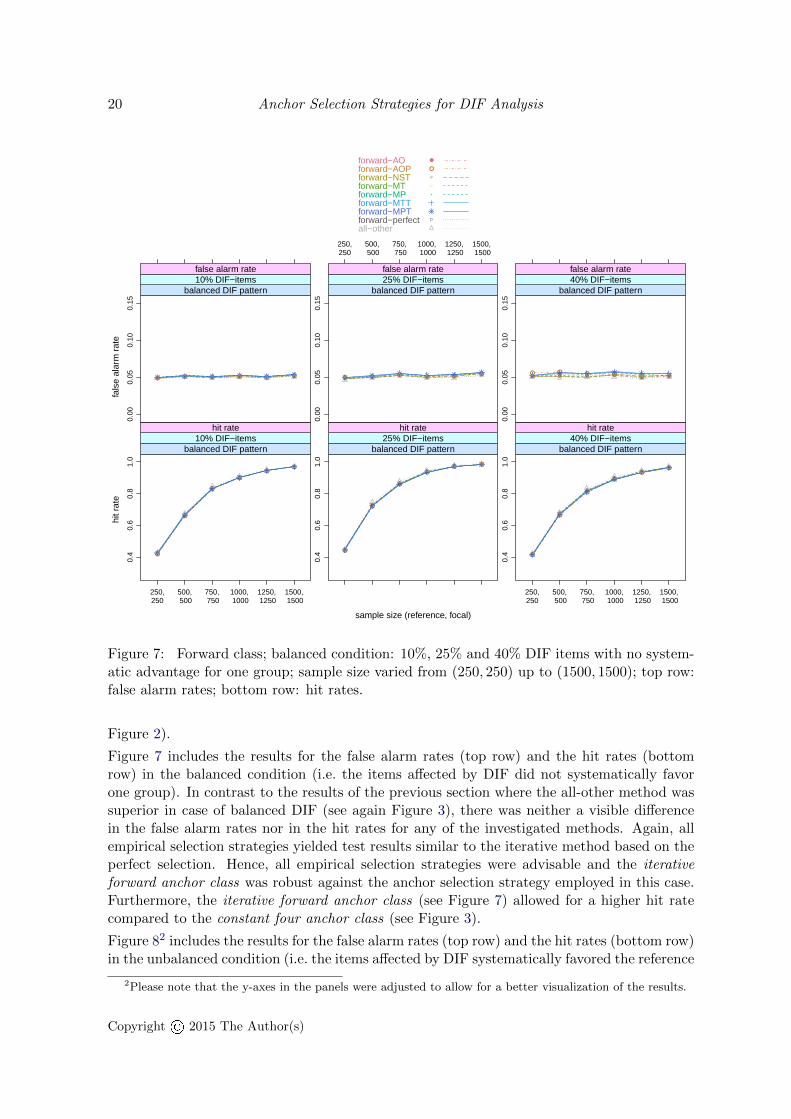
Figure 7: Forward class; balanced condition: 10%, 25% and 40% DIF items with no system-atic advantage for one group; sample size varied from (250, 250) up to (1500, 1500); top row:false alarm rates; bottom row: hit rates.
Figure 2).
Figure 7 includes the results for the false alarm rates (top row) and the hit rates (bottomrow) in the balanced condition (i.e. the items affected by DIF did not systematically favorone group). In contrast to the results of the previous section where the all-other method wassuperior in case of balanced DIF (see again Figure 3), there was neither a visible differencein the false alarm rates nor in the hit rates for any of the investigated methods. Again, allempirical selection strategies yielded test results similar to the iterative method based on theperfect selection. Hence, all empirical selection strategies were advisable and the iterativeforward anchor class was robust against the anchor selection strategy employed in this case.Furthermore, the iterative forward anchor class (see Figure 7) allowed for a higher hit ratecompared to the constant four anchor class (see Figure 3).
Figure 82 includes the results for the false alarm rates (top row) and the hit rates (bottom row)in the unbalanced condition (i.e. the items affected by DIF systematically favored the reference
2Please note that the y-axes in the panels were adjusted to allow for a better visualization of the results.
Copyright© 2015 The Author(s)

Julia Kopf, Achim Zeileis, Carolin Strobl 21
sample size (reference, focal)
hit r
ate
fals
e al
arm
rat
e
0.2
0.4
0.6
0.8
1.0
250,250
500, 500
750, 750
1000, 1000
1250, 1250
1500, 1500
●
●
●
●● ●
●
●
●
●● ●
#
#
#
## #
_
_
_
__ _
*
*
*
** *
p
p
p
pp p
unbalanced: all items favor reference10% DIF−items
hit rate
0.2
0.4
0.6
0.8
1.0
●
●
●
●
●●
●
●
●
●● ●
#
#
#
#
##
_
_
_
_
__
*
*
*
** *
p
p
p
pp p
unbalanced: all items favor reference25% DIF−items
hit rate
0.2
0.4
0.6
0.8
1.0
250,250
500, 500
750, 750
1000, 1000
1250, 1250
1500, 1500
●
●
●
●
●
●
●
●
●
●
●
●
#
#
#
#
#
#
_
_
_
_
_
_
*
*
*
*
*
*
p
p
p
pp
p
unbalanced: all items favor reference40% DIF−items
hit rate
0.0
0.1
0.2
0.3
0.4
● ● ● ● ● ●● ● ● ● ● ●# # # # # #_ _ _ _ _ _* * * * * *p p p p p p
unbalanced: all items favor reference10% DIF−itemsfalse alarm rate
250,250
500, 500
750, 750
1000, 1000
1250, 1250
1500, 1500
0.0
0.1
0.2
0.3
0.4
● ● ● ● ● ●● ● ● ● ● ●# # # # # #_ _ _ _ _ _* * * * * *p p p p p p
unbalanced: all items favor reference25% DIF−itemsfalse alarm rate
0.0
0.1
0.2
0.3
0.4
●
●
●
●
●●
●
● ● ●●
●#
## #
#
#_
__ _ _
_
*
* ** *
*p pp p p p
unbalanced: all items favor reference40% DIF−itemsfalse alarm rate
forward−AOforward−AOPforward−NSTforward−MTforward−MPforward−MTTforward−MPTforward−perfectall−other
●
●
#
_
*
p
Figure 8: Forward class; unbalanced condition: 10%, 25% and 40% DIF items favoring thereference group; sample size varied from (250, 250) up to (1500, 1500); top row: false alarmrates; bottom row: hit rates.
group). The differences in this condition were smaller and the results of the final DIF testsvaried notably with the anchor selection strategies only for 40% unbalanced DIF items. Thiscondition will now be regarded in detail. Here, the previously suggested methods (the forward-AO, the forward-AOP, the forward-NST, the forward-MT and the all-other method) wereoutperformed by the new suggestions (the forward-MP, the forward-MTT and the forward-MPT method) that showed lower false alarm rates and simultaneously reached higher hitrates. Except for the perfect forward method, the newly suggested forward-MTT methodyielded the lowest false alarm rate together with the highest hit rate.
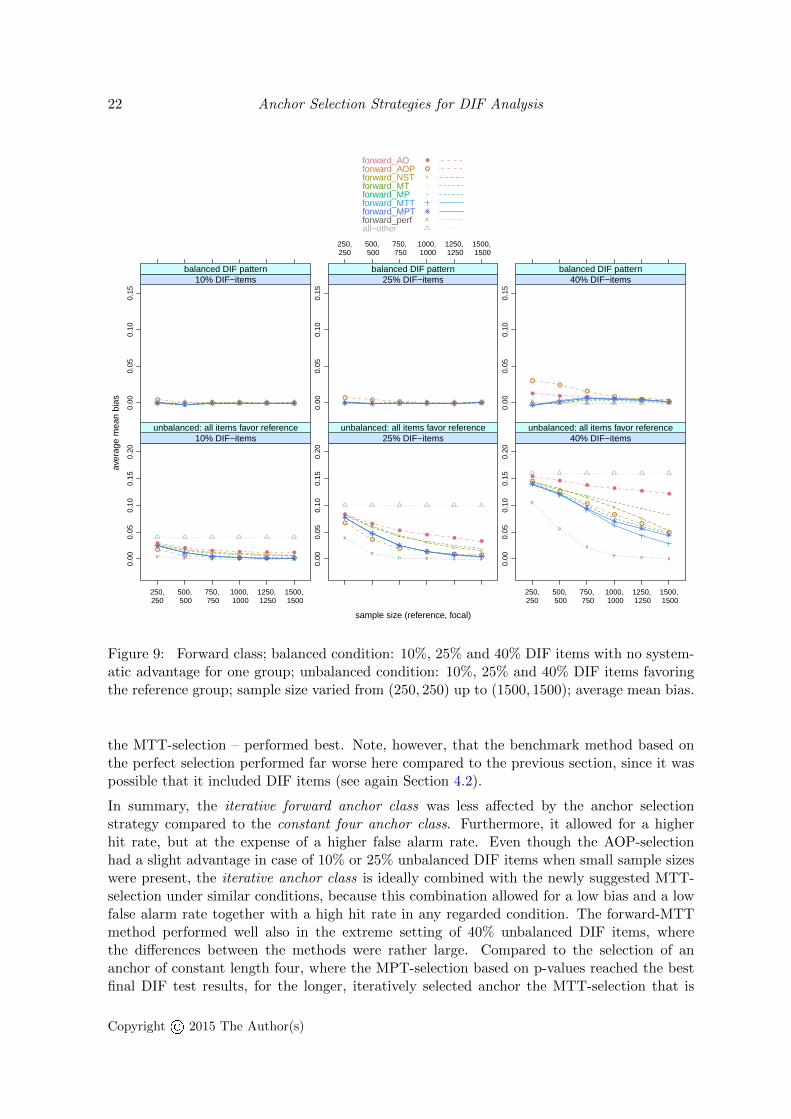
The bias is indicated in Figure 9. In the balanced condition (top row), only the AO- and theAOP-selection relying on DIF-tests using all other items as anchor yielded a slightly higherbias when the sample sizes were low and the DIF-proportion was high. In case of 10% or25% unbalanced DIF items (bottom row), the AOP-selection yielded a slightly lower biaswhen the sample sizes were small, followed by the new suggestions. Still, large differencesoccurred only in case of 40% unbalanced DIF items, where the new suggestions – especially
Copyright© 2015 The Author(s)
22 Anchor Selection Strategies for DIF Analysis
sample size (reference, focal)
aver
age
mea
n bi
as
0.00
0.05
0.10
0.15
● ● ● ● ● ●●
● ● ● ● ●# # # # # #_ _ _ _ _ _* * * * * *p p p p p p
10% DIF−itemsbalanced DIF pattern
250,250
500, 500
750, 750
1000, 1000
1250, 1250
1500, 1500
0.00
0.05
0.10
0.15
● ● ● ● ● ●● ● ● ● ● ●# # # # # #_ _ _ _ _ _* * * * * *p p p p p p
25% DIF−itemsbalanced DIF pattern
0.00
0.05
0.10
0.15
●● ● ● ● ●
●●
●●
●●# #
# # # #_ _ _ _ _ _*
** * * *p p p p p p
40% DIF−itemsbalanced DIF pattern
0.00
0.05
0.10
0.15
0.20
250,250
500, 500
750, 750
1000, 1000
1250, 1250
1500, 1500
●●
● ● ● ●●
● ● ● ● ●
##
# # # #
__
_ _ _ _*
** * * *
p p p p p p
10% DIF−itemsunbalanced: all items favor reference
0.00
0.05
0.10
0.15
0.20
●
●
●●
●●
●
●
●● ● ●
#
#
#
##
#
_
_
__
__
*
*
*
** *
p
pp p p p
25% DIF−itemsunbalanced: all items favor reference
0.00
0.05
0.10
0.15
0.20
250,250
500, 500
750, 750
1000, 1000
1250, 1250
1500, 1500
●●
●●
●●
●
●
●
●
●
●
#
#
#
#
#
#
__
_
__
_
*
*
*
*
*
*
p
p
p
p p p
40% DIF−itemsunbalanced: all items favor reference
forward_AOforward_AOPforward_NSTforward_MTforward_MPforward_MTTforward_MPTforward_perfall−other
●
●
#
_
*
p
Figure 9: Forward class; balanced condition: 10%, 25% and 40% DIF items with no system-atic advantage for one group; unbalanced condition: 10%, 25% and 40% DIF items favoringthe reference group; sample size varied from (250, 250) up to (1500, 1500); average mean bias.
the MTT-selection – performed best. Note, however, that the benchmark method based onthe perfect selection performed far worse here compared to the previous section, since it waspossible that it included DIF items (see again Section 4.2).
In summary, the iterative forward anchor class was less affected by the anchor selectionstrategy compared to the constant four anchor class. Furthermore, it allowed for a higherhit rate, but at the expense of a higher false alarm rate. Even though the AOP-selectionhad a slight advantage in case of 10% or 25% unbalanced DIF items when small sample sizeswere present, the iterative anchor class is ideally combined with the newly suggested MTT-selection under similar conditions, because this combination allowed for a low bias and a lowfalse alarm rate together with a high hit rate in any regarded condition. The forward-MTTmethod performed well also in the extreme setting of 40% unbalanced DIF items, wherethe differences between the methods were rather large. Compared to the selection of ananchor of constant length four, where the MPT-selection based on p-values reached the bestfinal DIF test results, for the longer, iteratively selected anchor the MTT-selection that is
Copyright© 2015 The Author(s)

Julia Kopf, Achim Zeileis, Carolin Strobl 23
1. 2. 3. 4. 5. 6. 7. 8. 9. 10. 11. 12. 13. 14. 15. 16. 17. 18. 19. 20. 21. 22. 23. 24. 25. 26. 27. 28. 29. 30. 31. 32. 33. 34. 35. 36. 37. 38. 39. 40.
MPT−selectionMTT−selection
Proportions of DIF items in the ranking order of candidate anchor items: balanced DIF pattern
0.0
0.2
0.4
0.6
0.8
1.0
1. 2. 3. 4. 5. 6. 7. 8. 9. 10. 11. 12. 13. 14. 15. 16. 17. 18. 19. 20. 21. 22. 23. 24. 25. 26. 27. 28. 29. 30. 31. 32. 33. 34. 35. 36. 37. 38. 39. 40.
MPT−selectionMTT−selection
Proportions of DIF items in the ranking order of candidate anchor items: unbalanced DIF pattern, all items favor reference
0.0
0.2
0.4
0.6
0.8
1.0
Figure 10: Top row: proportion of DIF items in the ranking order of anchor candidates in thebalanced condition: 40% DIF items with no systematic advantage for one group; bottom row:proportion of DIF items in the ranking order of anchor candidates in the unbalanced condition:40% DIF items favoring the reference group; sample size was set to 1000 observations in eachgroup.
built on mean test statistics is advisable in case of a high number of DIF items. A detailedexplanation for this finding will be given in the next section. Again, the methods based onthreshold comparisons (MPT- and MTT-selection) outperformed the corresponding strategiesbased on mere mean values (MP- and MT-selection).
5.3. Comparison of the mean test statistic and mean p-value thresholdselection
To explain the fact that the MPT-selection yielded better results when it was combinedwith the constant four anchor class, whereas the MTT-selection performed better combinedwith the iterative forward anchor class, the ranking order of candidate anchor items is nowregarded in detail for one balanced and one unbalanced setting (with 40% DIF items and1000 observations in each group). Figure 10 contains the proportions of DIF items in theranking order of candidate anchor items. In the regarded setting, 24 items were DIF-free and,ideally, the 24 lowest ranks (from left to the vertical line) should display low proportions ofDIF items.
In the balanced condition (Figure 10, top panel), the first items of the sequence of anchorcandidates – i.e. the items to the left of the vertical line – displayed low proportions of DIF
Copyright© 2015 The Author(s)
24 Anchor Selection Strategies for DIF Analysis
items over the simulation runs for both the MPT-selection (black bars) and the MTT-selection(gray bars). In contrast to this, the items that were assigned the highest ranks – i.e. the itemsto the right of the vertical line – displayed large proportions of DIF items. Thus, both anchorselection strategies yielded appropriate ranking orders that clearly separated DIF and DIF-free items: The first candidates displayed low proportions of DIF items, whereas the lastcandidates displayed large proportions of DIF items as intended for all ranks above 24.
In the unbalanced condition (Figure 10, bottom panel), the separation of candidates withlow proportions of DIF items for the first ranks and high proportions for the last ranks washarder for both methods. Now the first anchor candidates displayed higher proportions of DIFitems. Generally, the MTT-selection (gray) yielded lower DIF proportions for items up to thevertical line compared to the MPT-selection (black) and was, in consequence, better suitedto locate a longer anchor. However, when an anchor of constant length four was intended,only the first four candidates were included in the anchor. The first four ranks selected bythe MPT-selection displayed lower proportions of DIF items compared to the MTT-selection(see very left of Figure 10, bottom panel). As a result, the MPT-selection was better suitedto locate four anchor items.
Now the question is addressed which of the methods – the constant4-MPT or the forward-MTT method – can be considered as overall superior. Therefore, we review the results fromSection 5.1 and 5.2 where 40% DIF items were present together with information about thevariation of the false alarm and the hit rate (not shown).
In the balanced and also in the unbalanced condition, the constant4-MPT method led toa lower false alarm rate compared to the forward-MTT method. The false alarm rate alsofluctuated less when the sample sizes were large. Consequently, the constant4-MPT methodshould be preferred with respect to the false alarm rate. In contrast to this, the forward-MTTmethod achieved a higher and – for large sample sizes simultaneously less fluctuating – hitrate and was, accordingly, superior regarding the hit rate.
In summary, the first anchor candidates were more likely found from the set of DIF-freeitems by the MPT-selection, whereas the MTT-selection was better suited for longer anchors.However, first results show that neither the constant4-MPT nor the forward-MTT method wasclearly superior in the 40% DIF items setting regarding a strictly smaller and less fluctuatingfalse alarm rate and a higher and less fluctuating hit rate.
6. Discussion and practical recommendations
In this article, we introduced three new anchor selection strategies and compared them toexisting methods that do not rely on any prior knowledge of DIF-free items. Moreover,we introduced a straightforward notation of the anchor selection strategies to facilitate theimplementation and the usage of the newly suggested anchor selection strategies. An extensivesimulation study was conducted to evaluate the performance of the anchor selection strategiesin combination with the constant four anchor class and the iterative forward anchor class forthe Rasch model. The two anchor classes are structurally different, since the constant fouranchor class always uses a short anchor of constant length four, whereas the iterative forwardclass determines the anchor length in an iterative way and usually yields a longer anchor.
To allow for a comparison with an anchor method that does not rely on an explicit anchorselection, the all-other method was included in our simulation as well. Our results were in
Copyright© 2015 The Author(s)

Julia Kopf, Achim Zeileis, Carolin Strobl 25
accordance with previous research, as the all-other method heavily suffered from an inflatedfalse alarm rate when a large proportion of unbalanced DIF items was present (Wang andYeh 2003; Wang 2004; Gonzalez-Betanzos and Abad 2012; Kopf et al. 2013) and discouragefrom the usage of the all-other method.
Our analysis was limited to the analysis of differential item functioning in the dichotomousRasch model. In our investigated settings, the results of the DIF tests – evaluated by meansof the false alarm rate, the hit rate and the average mean bias – strongly depended on theanchor selection strategies employed, when four anchor items were intended. This highlightsthe importance of a suitable anchor selection strategy that allows the researcher to correctlyclassify DIF and DIF-free items and to study the underlying causes of DIF (Jodoin and Gierl2001). Consistent with previous results (see e.g., Wang and Yeh 2003; Wang 2004; Gonzalez-Betanzos and Abad 2012; Kopf et al. 2013), seriously inflated false alarm rates occurred if theanchor method did not work appropriately, especially when DIF was unbalanced and the DIFproportion was high. This was the case for several existing anchor selection strategies in oursimulation study. Anchor selections based on the all-other anchor method (the AO- and theAOP-selection) are inadvisable to select four anchor items, since the estimated item parameterdifferences were biased in the unbalanced DIF condition and even additional purification stepsincluded in the AOP-selection were not able to completely reduce the bias when the DIFproportion was high. For this reason, we advise against constructing new anchor selectionstrategies for the constant four anchor class that use all other items as anchor. Unsatisfactoryresults were also found for the MT-selection that is based on mean absolute test statisticsresulting from DIF tests for every item using every other item as single anchor and theNST-selection that counts the number of significant results in those particular tests. As aresult, the newly suggested anchor selection strategies based on a threshold criterion clearlyoutperformed the existing suggestions. Four anchor items were ideally selected using theMPT-selection in our simulated settings.
In our study, the iterative forward anchor class was relatively robust against the anchorselection strategy employed. Only in case of 40% unbalanced DIF items, the effects of theanchor selection strategies were clearly visible. In the remaining investigated settings, allanchor selection strategies performed quite well and achieved results similar to the benchmarkmethod of the perfect anchor selection. However, in case of 40% unbalanced DIF items, allthree new anchor selection strategies outperformed the previously suggested anchor selectionstrategies by yielding a lower false alarm rate, a higher hit rate and less biased estimates ofthe item parameter differences. Still, since the perfect selection reached better results, theselection strategies can be further improved.
Altogether, our results showed that the appropriateness of the anchor selection not onlydepended on the sample size, the proportion of DIF items and the direction of DIF, but alsoon the intended anchor length.
In case a short anchor of length four is intended, the MPT-selection outperformed all otherinvestigated empirical anchor selection strategies by yielding a low false alarm rate and simul-taneously reaching a high hit rate in all regarded conditions. As a result, we recommend touse the MPT-selection if a short constant anchor length is intended under similar conditions.
When the selection strategies were combined with the iterative forward anchor class, thenewly suggested MTT-selection reached the best results in our extreme setting of 40% DIFitems. It is recommended for DIF analysis when the iterative forward anchor class is used, as
Copyright© 2015 The Author(s)
26 Anchor Selection Strategies for DIF Analysis
well as in general when a longer anchor length is intended under conditions similar to thoseinvestigated in this article.
Nevertheless, the benchmark method of the perfect anchor selection still reached lower falsealarm rates and higher hit rates in regions of small to medium sample sizes when DIF wassimulated unbalanced. Hence, new developments for anchor selection strategies that ideallyfollow the threshold approach are needed to further improve the classification of DIF andDIF-free items when the sample sizes are small. When the sample sizes are large, the newlysuggested constant4-MPT and the forward-MTT method reached satisfying results in oursimulation study.
Future research may investigate the adaption of our anchor selection strategies to other DIFtests and may evaluate modifications of the iterative anchor method, such as the exclusionof a certain percentage of the first anchor candidates that we found more likely to have DIF.Moreover, future research may evaluate the performance of these methods when the dataare generated from other IRT models. In the Rasch model, the items are assumed to havethe same discriminatory power. The items are, thus, characterized by the item difficultyparameters only. Other IRT models include further parameters for the discriminatory power(2 parameter logistic, 2PL, model) or for guessing behavior (3 parameter logistic, 3PL, model)or allow for more than two response categories. For the 2PL or the 3PL model, anchor itemsthat displayed high discrimination parameters were found to be better suited as anchor items(Rivas et al. 2009; Gonzalez-Betanzos and Abad 2012). Future research may combine thestrategies introduced in this article with new requirements and other underlying IRT models.The ranking order of candidate anchor items could, for example, be modified in a way suchthat items with a low discriminatory power are less likely to be selected as anchor candidates.
References
Allalouf A, Hambleton RK, Sireci, G S (1999). “Identifying the Causes of DIF in TranslatedVerbal Items.” Journal of Educational Measurement, 36(3), 185–198.
Candell GL, Drasgow F (1988). “An Iterative Procedure for Linking Metrics and AssessingItem Bias in Item Response Theory.” Applied Psychological Measurement, 12(3), 253–260.
Cohen AS, Kim SH, Wollack JA (1996). “An Investigation of the Likelihood Ratio Test forDetection of Differential Item Functioning.” Applied Psychological Measurement, 20(1),15–26.
Drasgow F (1987). “Study of the Measurement Bias of Two Standardized Psychological Tests.”Journal of Applied Psychology, 72(1), 19–29.
Eggen T, Verhelst N (2006). “Loss of Information in Estimating Item Parameters in Incom-plete Designs.” Psychometrika, 71(2), 303–322.
Finch H (2005). “The MIMIC Model As a Method for Detecting DIF: Comparison withMantel-Haenszel, SIBTEST, and the IRT Likelihood Ratio.” Applied Psychological Mea-surement, 29(4), 278–295.
Copyright© 2015 The Author(s)
Julia Kopf, Achim Zeileis, Carolin Strobl 27
Fischer GH (1995). “Derivations of the Rasch Model.” In GH Fischer, IW Molenaar (eds.),Rasch Models – Foundations, Recent Developments, and Applications, chapter 2. Springer-Verlag, New York.
Frederickx S, Tuerlinckx F, Boeck PD, Magis D (2010). “RIM: A Random Item MixtureModel to Detect Differential Item Functioning.” Journal of Educational Measurement,47(4), 432–457.
Glas CAW, Verhelst ND (1995). “Testing the Rasch Model.” In GH Fischer, IW Molenaar(eds.), Rasch Models - Foundations, Recent Developements, and Applications, chapter 5.Springer-Verlag, New York.
Gonzalez-Betanzos F, Abad FJ (2012). “The Effects of Purification and the Evaluation ofDifferential Item Functioning with the Likelihood Ratio Test.” Methodology: EuropeanJournal of Research Methods for the Behavioral and Social Sciences, 8(4), 134–145.
Hidalgo-Montesinos MD, Lopez-Pina, A J (2002). “Two-Stage Equating in Differential ItemFunctioning Detection under the Graded Response Model with the Raju Area Measuresand the Lord Statistic.” Educational and Psychological Measurement, 62(1), 32–44.
Jodoin MG, Gierl MJ (2001). “Evaluating Type I Error and Power Rates Using an Effect SizeMeasure with the Logistic Regression Procedure for DIF Detection.” Applied Measurementin Education, 14(4), 329–349.
Kim SH, Cohen AS (1998). “Detection of Differential Item Functioning under the GradedResponse Model with the Likelihood Ratio Test.” Applied Psychological Measurement,22(4), 345–355.
Kopf J, Zeileis A, Strobl C (2013). “Anchor Methods for DIF Detection: A Comparisonof the Iterative Forward, Backward, Constant and All-Other Anchor Class.” TechnicalReport 141, Department of Statistics, Ludwig-Maximilians-Universitat Munchen. URLhttp://epub.ub.uni-muenchen.de/14759/.
Lim RG, Drasgow F (1990). “Evaluation of Two Methods for Estimating Item ResponseTheory Parameters When Assessing Differential Item Functioning.” Journal of AppliedPsychology, 75(2), 164 – 174.
Lord F (1980). Applications of Item Response Theory to Practical Testing Problems. LawrenceErlbaum, Hillsdale.
Magis D, Boeck PD (2011). “Identification of Differential Item Functioning in Multiple-GroupSettings: A Multivariate Outlier Detection Approach.” Multivariate Behavioral Research,46(5), 733–755.
McLaughlin ME, Drasgow F (1987). “Lord’s Chi-Square Test of Item Bias with Estimatedand with Known Person Parameters.” Applied Psychological Measurement, 11(2), 161–173.
Millsap RE, Everson HT (1993). “Methodology Review: Statistical Approaches for AssessingMeasurement Bias.” Applied Psychological Measurement, 17(4), 297–334.
Copyright© 2015 The Author(s)
28 Anchor Selection Strategies for DIF Analysis
Molenaar IW (1995). “Estimation of Item Parameters.” In GH Fischer, IW Molenaar (eds.),Rasch Models – Foundations, Recent Developments, and Applications, chapter 3. Springer-Verlag, New York.
Paek I, Han KT (2013). “IRTPRO 2.1 for Windows (Item Response Theory for Patient-Reported Outcomes).” Applied Psychological Measurement, 37(3), 242–252.
Penfield RD (2001). “Assessing Differential Item Functioning among Multiple Groups: AComparison of Three Mantel-Haenszel Procedures.” Applied Measurement in Education,14(3), 235 – 259.
Raju N (1988). “The Area between Two Item Characteristic Curves.” Psychometrika, 53(4),495–502.
R Core Team (2013). R: A Language and Environment for Statistical Computing. R Founda-tion for Statistical Computing, Vienna, Austria. URL http://www.R-project.org/.
Rivas GEL, Stark S, Chernyshenko OS (2009). “The Effects of Referent Item Parameters onDifferential Item Functioning Detection Using the Free Baseline Likelihood Ratio Test.”Applied Psychological Measurement, 33(4), 251–265.
Rogers HJ, Swaminathan H (1993). “A Comparison of Logistic Regression and Mantel-Haenszel Procedures for Detecting Differential Item Functioning.” Applied PsychologicalMeasurement, 17(2), 105–116.
Shih CL, Wang WC (2009). “Differential Item Functioning Detection Using the MultipleIndicators, Multiple Causes Method with a Pure Short Anchor.” Applied PsychologicalMeasurement, 33(3), 184–199.
Stark S, Chernyshenko OS, Drasgow F (2006). “Detecting Differential Item Functioning withConfirmatory Factor Analysis and Item Response Theory: Toward a Unified Strategy.”Journal of Applied Psychology, 91(6), 1292–1306.
Thissen D, Steinberg L, Wainer H (1988). “Use of Item Response Theory in the Study ofGroup Differences in Trace Lines.” In H Wainer, HI Braun (eds.), Test Validity, chapter 10.Lawrence Erlbaum, Hillsdale.
Wang WC (2004). “Effects of Anchor Item Methods on the Detection of Differential ItemFunctioning within the Family of Rasch Models.” Journal of Experimental Education,72(3), 221–261.
Wang WC, Shih CL, Sun GW (2012). “The DIF-Free-Then-DIF Strategy for the Assessmentof Differential Item Functioning.” Educational and Psychological Measurement, 72(4), 687–708.
Wang WC, Su YH (2004). “Effects of Average Signed Area between Two Item CharacteristicCurves and Test Purification Procedures on the DIF Detection via the Mantel-HaenszelMethod.” Applied Measurement in Education, 17(2), 113–144.
Wang WC, Yeh YL (2003). “Effects of Anchor Item Methods on Differential Item FunctioningDetection with the Likelihood Ratio Test.” Applied Psychological Measurement, 27(6), 479–498.
Copyright© 2015 The Author(s)
Julia Kopf, Achim Zeileis, Carolin Strobl 29
Woods CM (2009). “Empirical Selection of Anchors for Tests of Differential Item Functioning.”Applied Psychological Measurement, 33(1), 42–57.
Woods CM, Cai L, Wang M (2013). “The Langer-Improved Wald Test for DIF Testingwith Multiple Groups: Evaluation and Comparison to Two-Group IRT.” Educational andPsychological Measurement, 73(3), 532–547.
Affiliation:
Julia KopfDepartment of StatisticsLudwig-Maximilians-Universitat MunchenLudwigstraße 3380539 Munchen, GermanyE-mail: [email protected]
Achim ZeileisDepartment of StatisticsFaculty of Economics and StatisticsUniversitat InnsbruckUniversitatsstraße 156020 Innsbruck, AustriaE-mail: [email protected]: http://eeecon.uibk.ac.at/~zeileis/
Carolin StroblDepartment of PsychologyUniversitat ZurichBinzmuhlestrasse 148050 Zurich, SwitzerlandE-mail: [email protected]
Copyright© 2015 The Author(s)


![Dif In Dif Slides.ppt [Repaired] - Finance Department](https://img.pdfslide.us/doc/110x75/61b1d68f6b0e604114161860/dif-in-dif-repaired-finance-department.jpg)


![CPT TM CYBER-LAB DIF*±]E3ßåÞZI** ... · CPT TM CYBER-LAB DIF*±]E3ßåÞZI**](https://img.pdfslide.us/doc/110x75/5e07447e09a007101859965b/cpt-tm-cyber-lab-dife3zi-cpt-tm-cyber-lab-dife3zi-.jpg)