Embed Size (px)
Citation preview

Anatomy of the
Mitral Valve and
Quantification of
Mitral Regurgitation
Sunil Mankad, MD, FACC, FCCP, FASE
Associate Professor of Medicine
Mayo Clinic College of Medicine
Director, Transesophageal Echocardiography
Associate Director, Cardiology Fellowship
Mayo Clinic, Rochester, MN

DISCLOSURE
Relevant Financial Relationship(s)
None
Off Label Usage
None

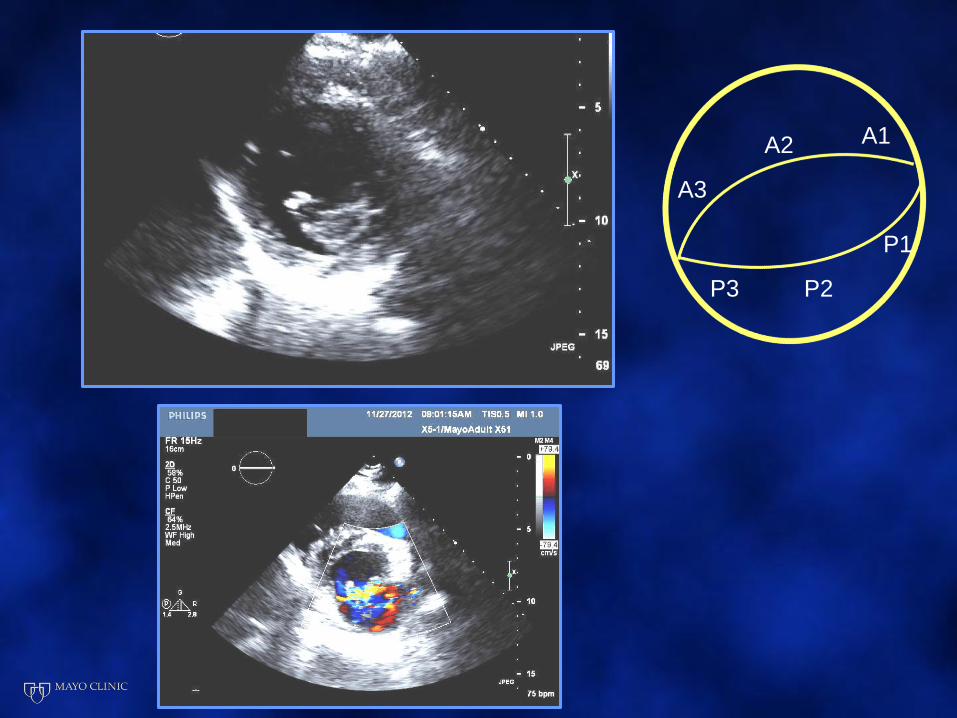
Pre-Test Questions

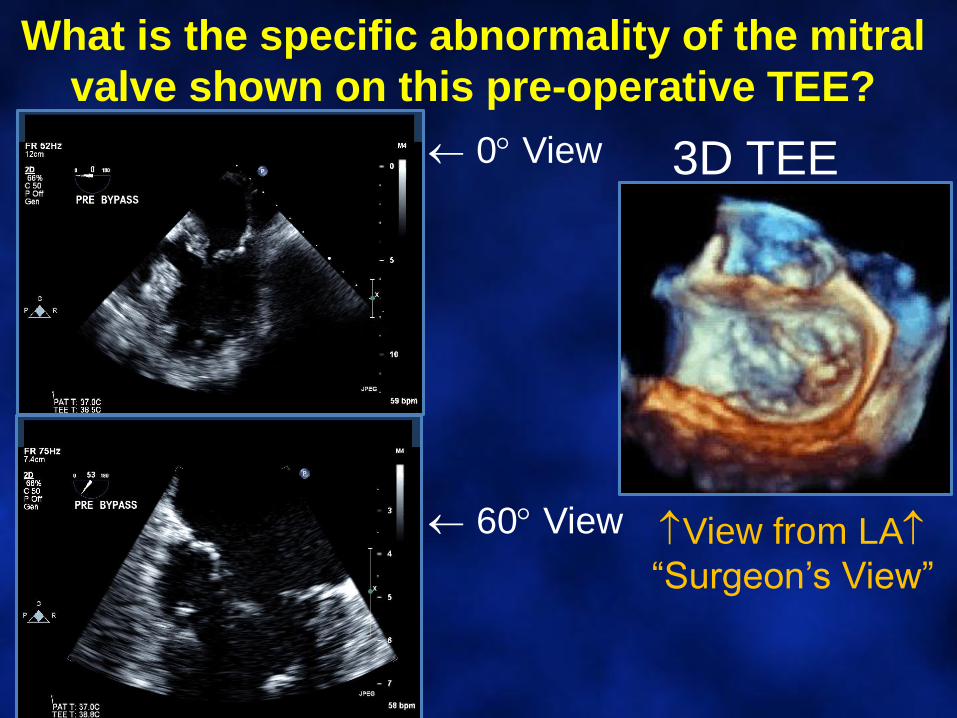
What is the specific abnormality of the mitral
valve shown on this pre-operative TEE?
3D TEE
View from LA
“Surgeon’s View”
0 View
60 View
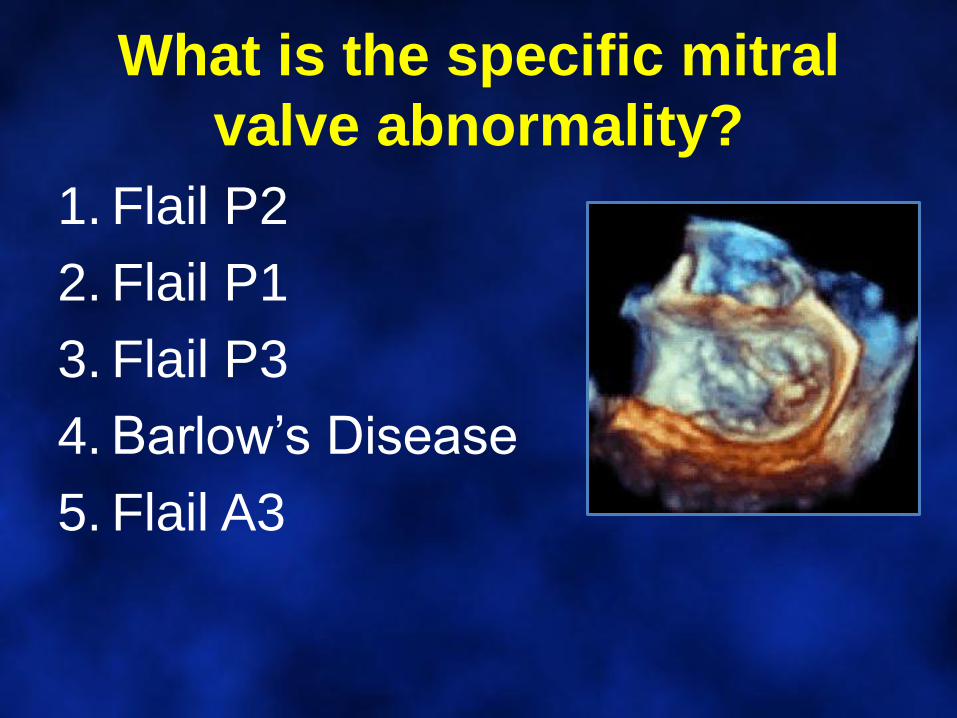
What is the specific mitral
valve abnormality?
1. Flail P2
2. Flail P1
3. Flail P3
4. Barlow’s Disease
5. Flail A3
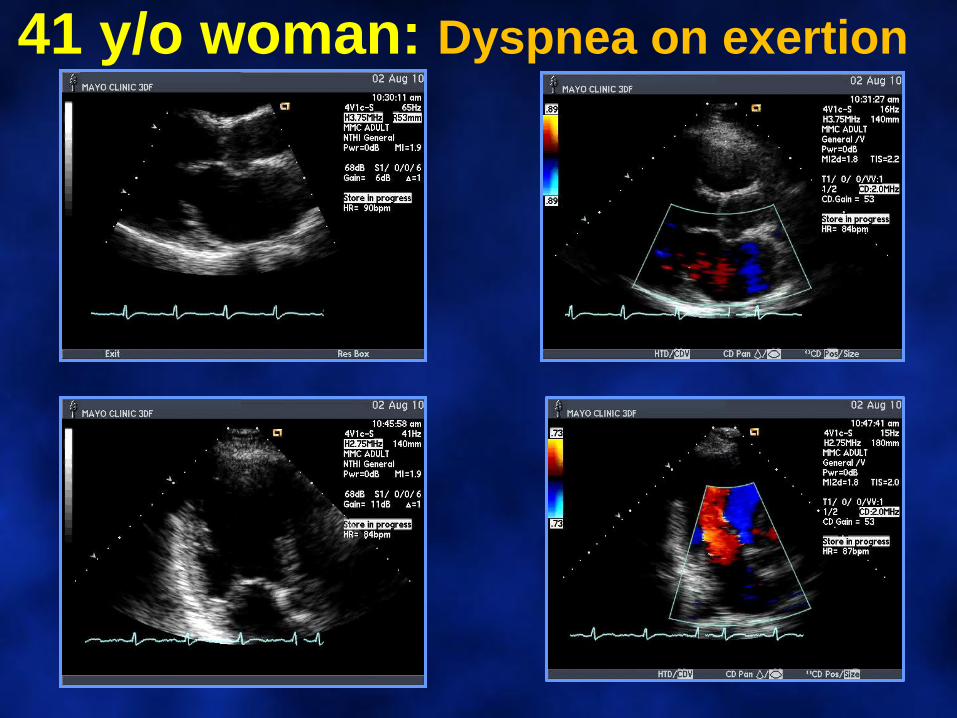
41 y/o woman: Dyspnea on exertion
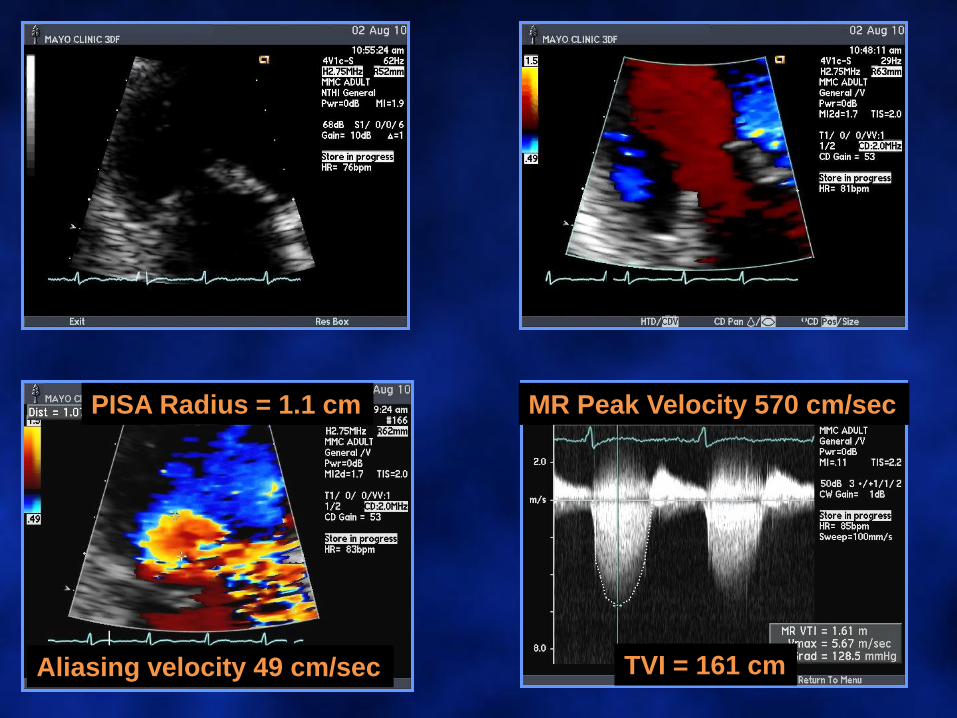
PISA Radius = 1.1 cm
Aliasing velocity 49 cm/sec
MR Peak Velocity 570 cm/sec
TVI = 161 cm

What is the calculated ERO?
1. 0.45 cm2
2. 0.55 cm2
3. 0.35 cm2
4. 0.65 cm2
5. 0.75 cm2
PISA Radius = 1.1 cm
Aliasing velocity 49 cm/sec
MR Peak Velocity 570 cm/sec
TVI = 161 cm
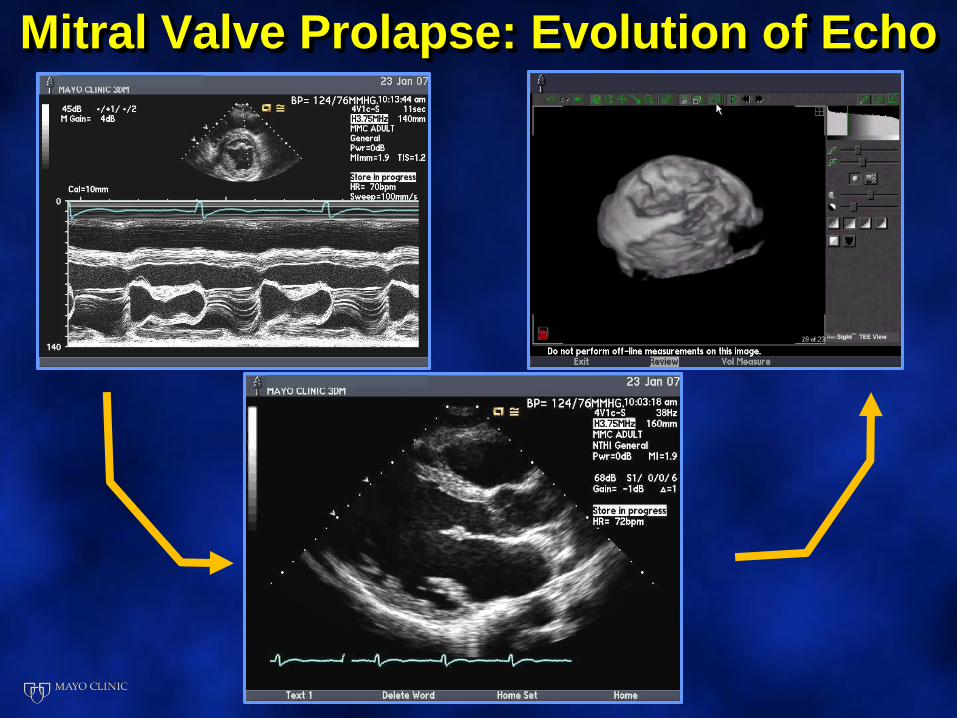
Mitral Valve Prolapse: Evolution of Echo
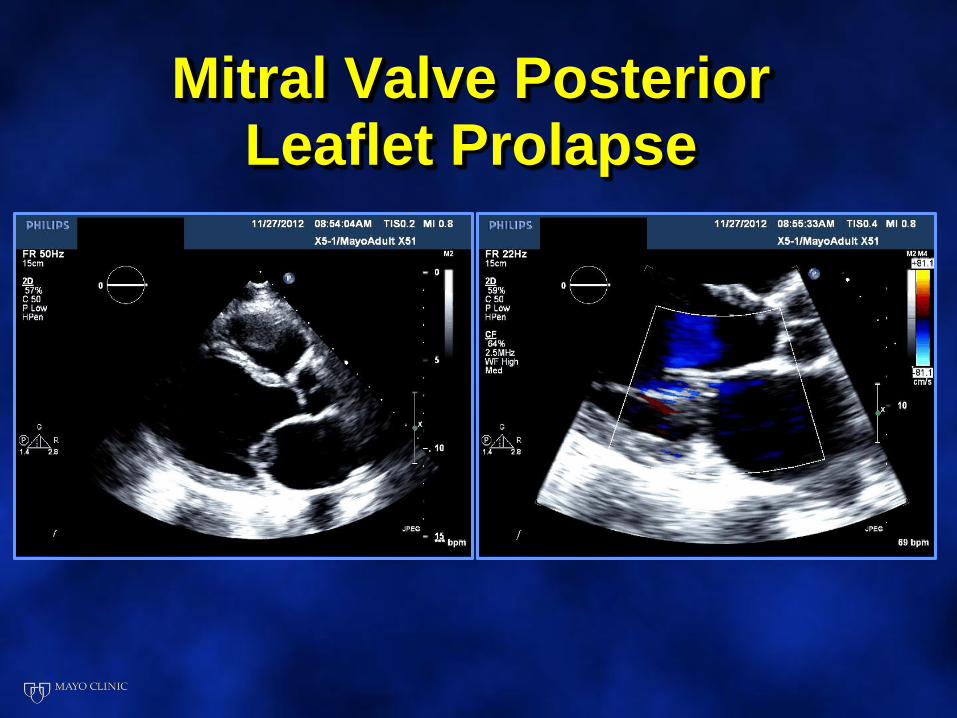
Mitral Valve Posterior Leaflet Prolapse
A3
A1A2
P1
P3 P2
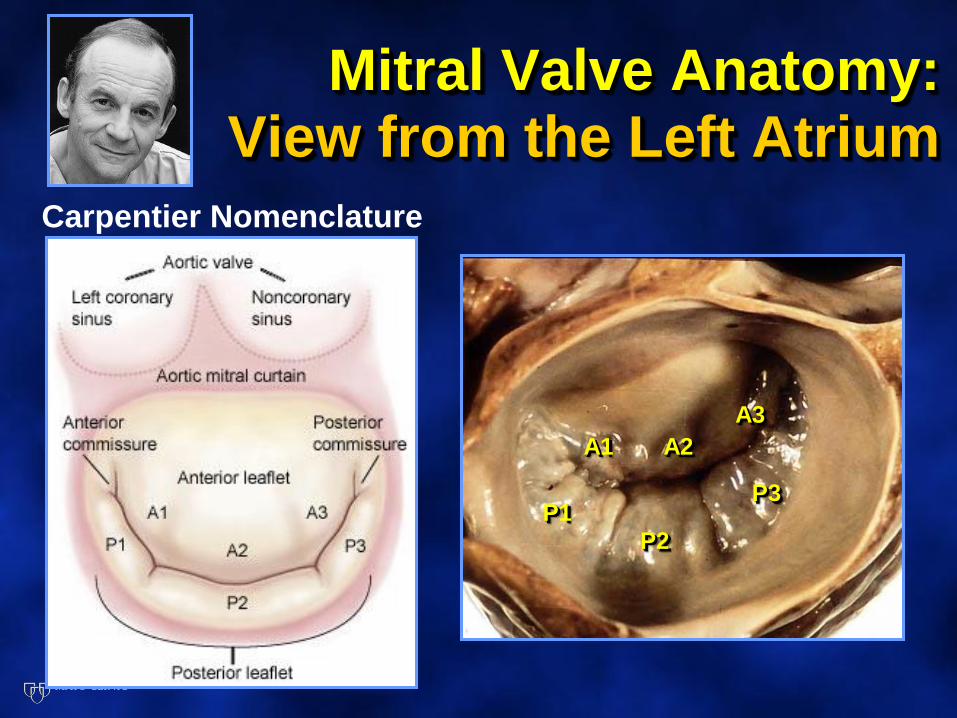
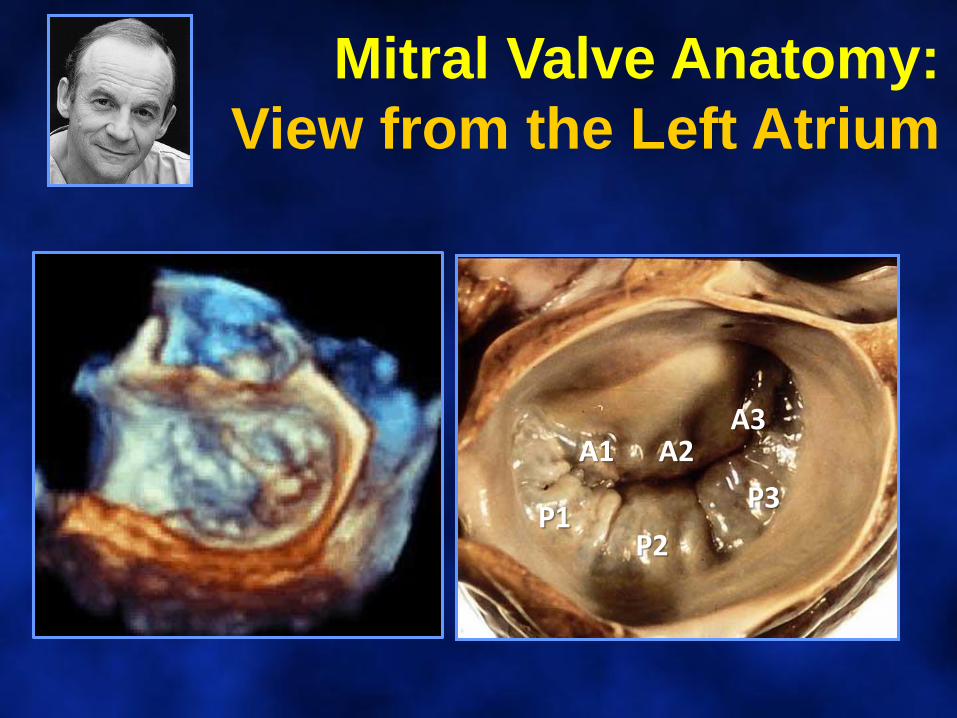
Mitral Valve Anatomy: View from the Left Atrium
P1
P2
P3
A1 A2
A3
Carpentier Nomenclature
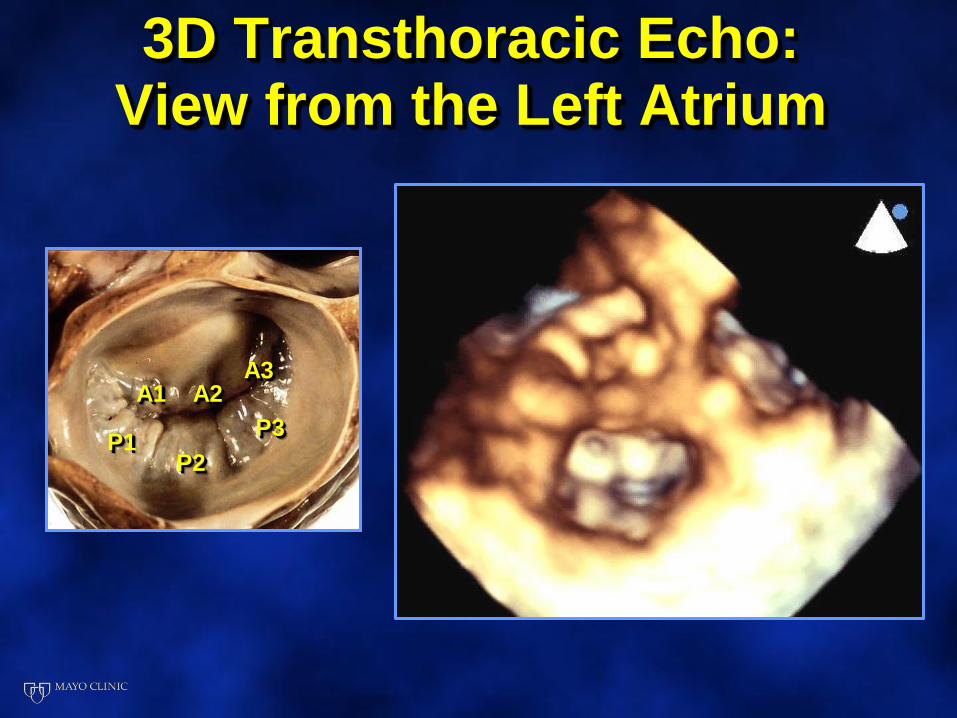
3D Transthoracic Echo:View from the Left Atrium
P1P2
P3
A1 A2A3
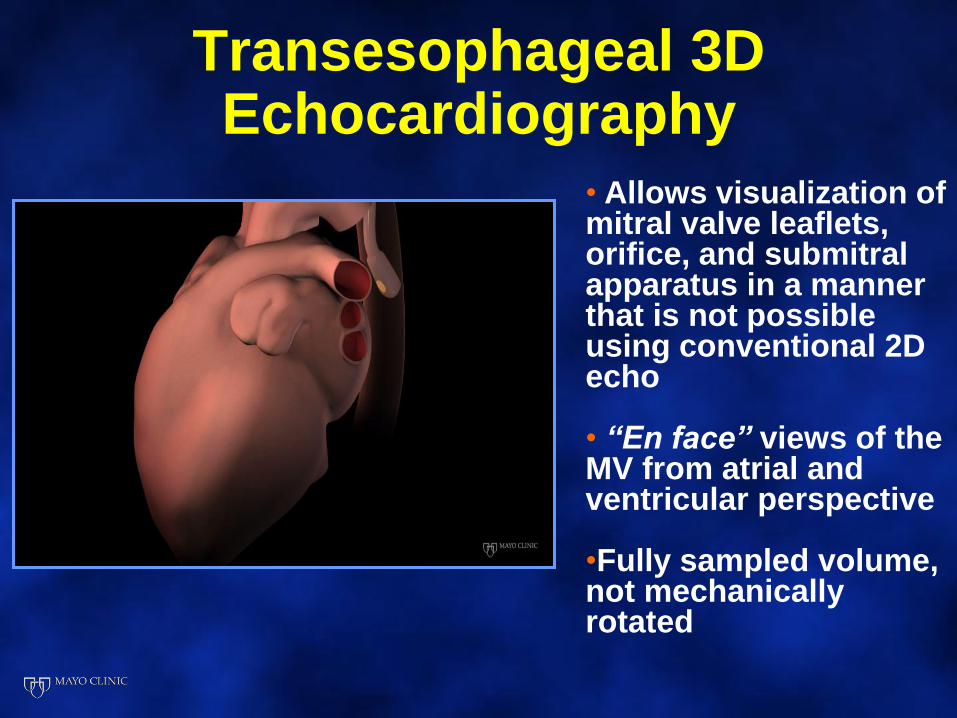
Transesophageal 3D Echocardiography
• Allows visualization of mitral valve leaflets, orifice, and submitral apparatus in a manner that is not possible using conventional 2D echo
• “En face” views of the MV from atrial and ventricular perspective
•Fully sampled volume, not mechanically rotated
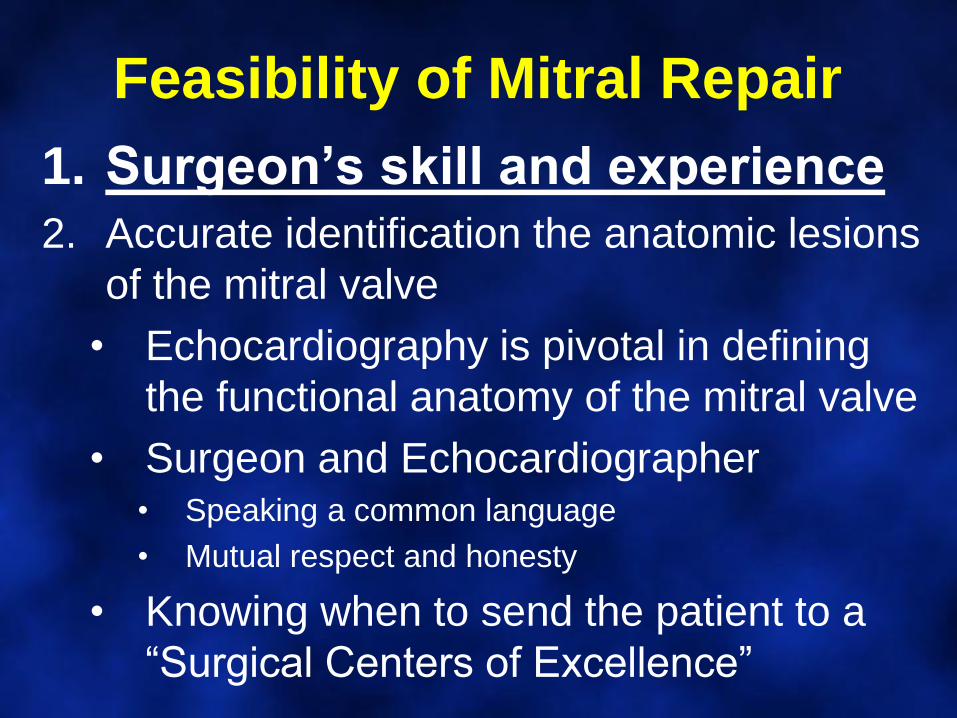
Feasibility of Mitral Repair
1. Surgeon’s skill and experience
2. Accurate identification the anatomic lesions
of the mitral valve
• Echocardiography is pivotal in defining
the functional anatomy of the mitral valve
• Surgeon and Echocardiographer• Speaking a common language
• Mutual respect and honesty
• Knowing when to send the patient to a
“Surgical Centers of Excellence”
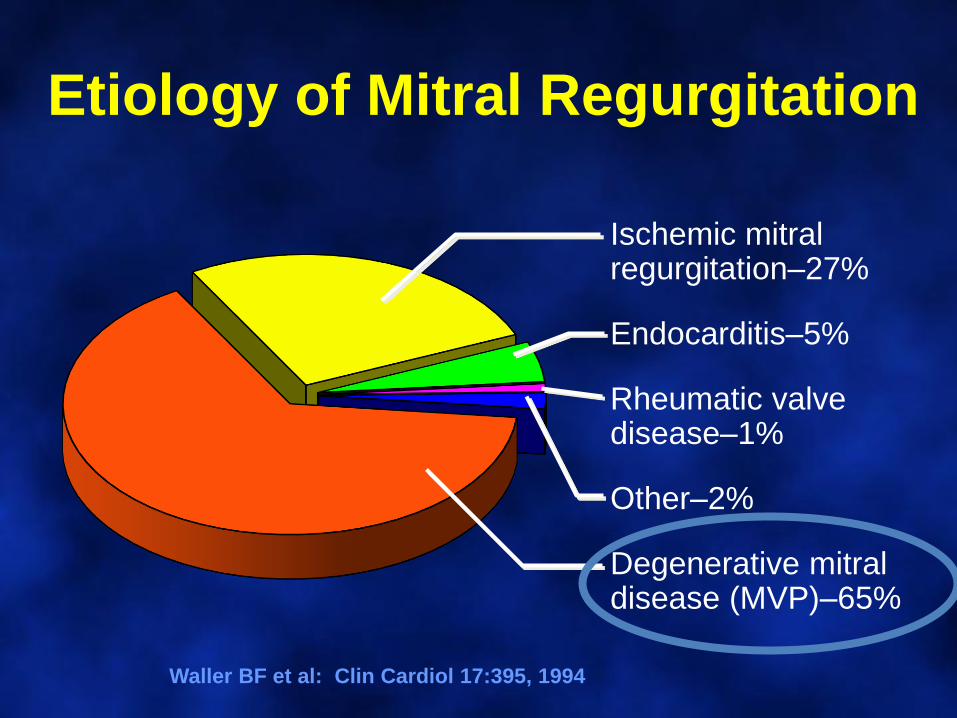
Etiology of Mitral Regurgitation
Waller BF et al: Clin Cardiol 17:395, 1994
Ischemic mitralregurgitation–27%
Endocarditis–5%
Rheumatic valvedisease–1%
Other–2%
Degenerative mitraldisease (MVP)–65%
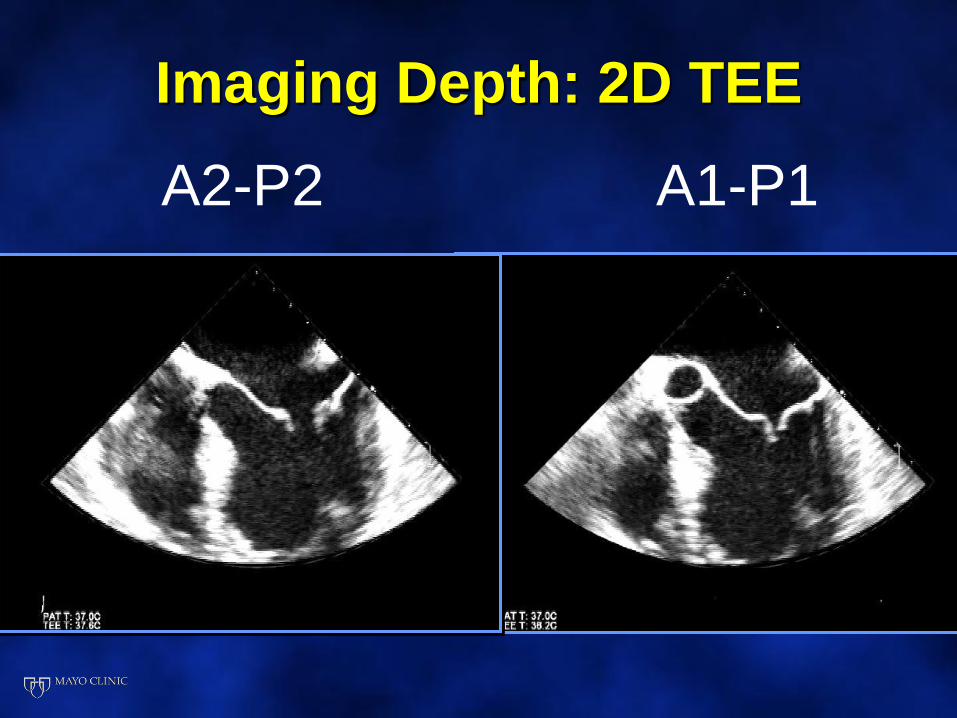
Imaging Depth: 2D TEE
A2-P2 A1-P1
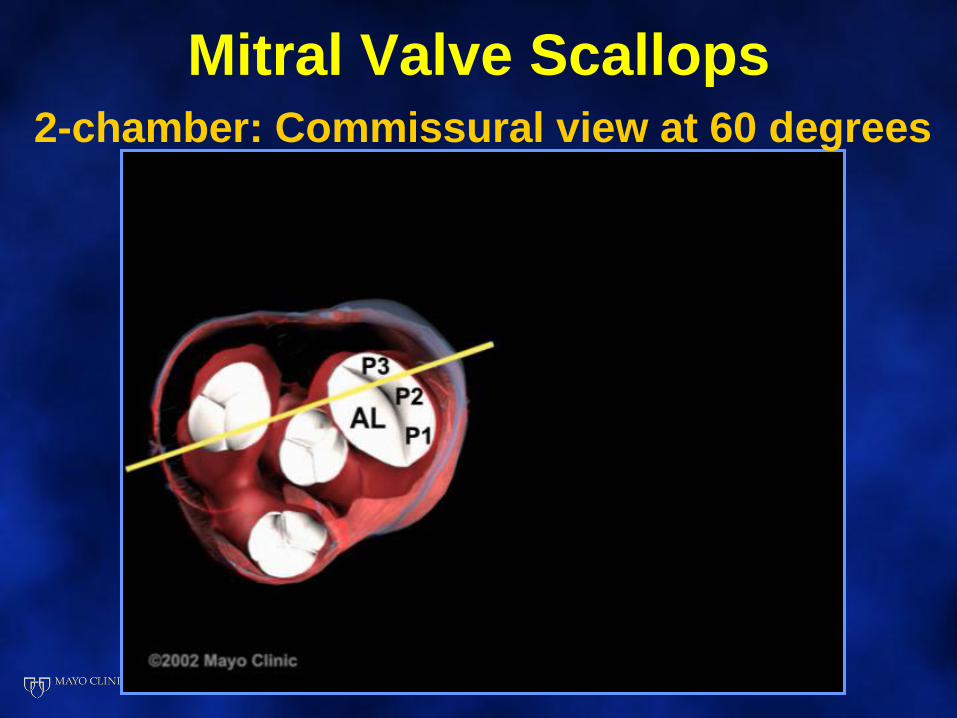
Mitral Valve Scallops2-chamber: Commissural view at 60 degrees
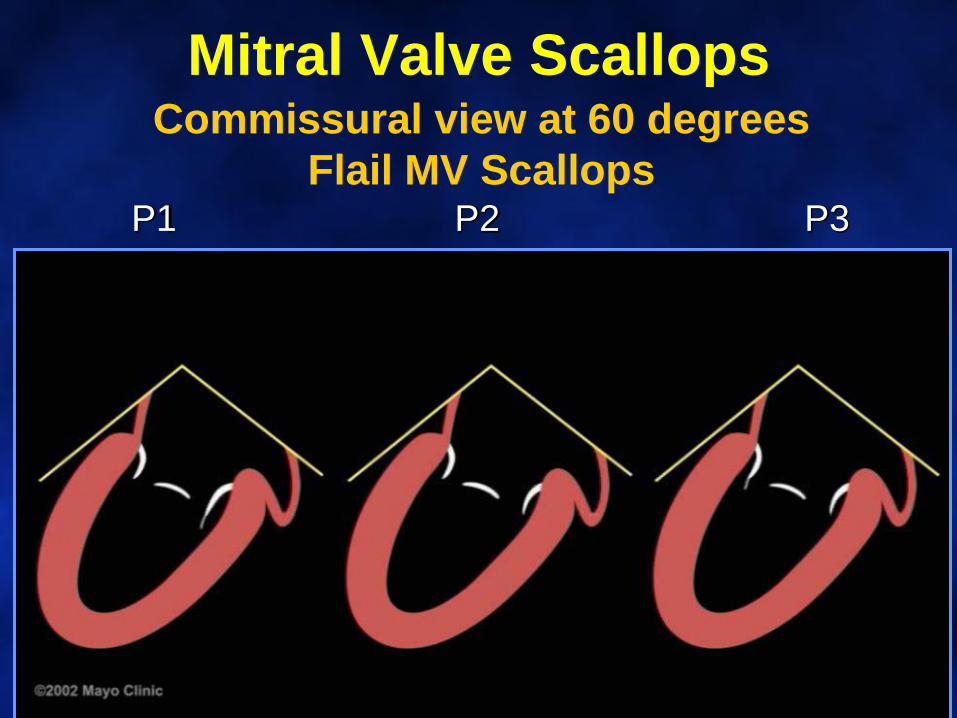
Mitral Valve ScallopsCommissural view at 60 degrees
Flail MV ScallopsP1 P2 P3
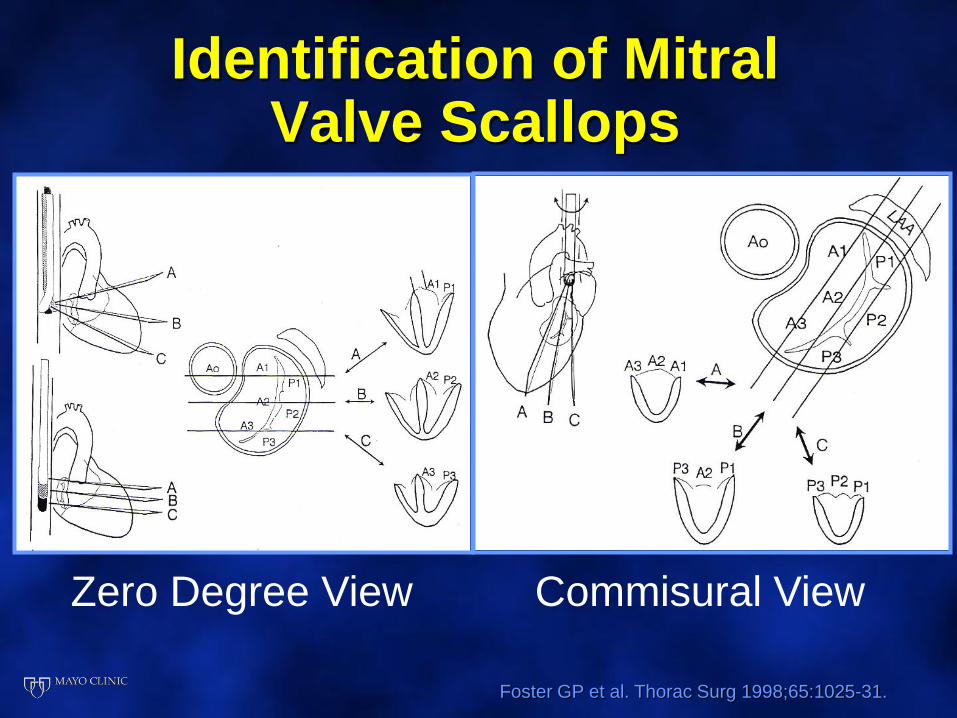
Identification of Mitral Valve Scallops
Foster GP et al. Thorac Surg 1998;65:1025-31.
Zero Degree View Commisural View
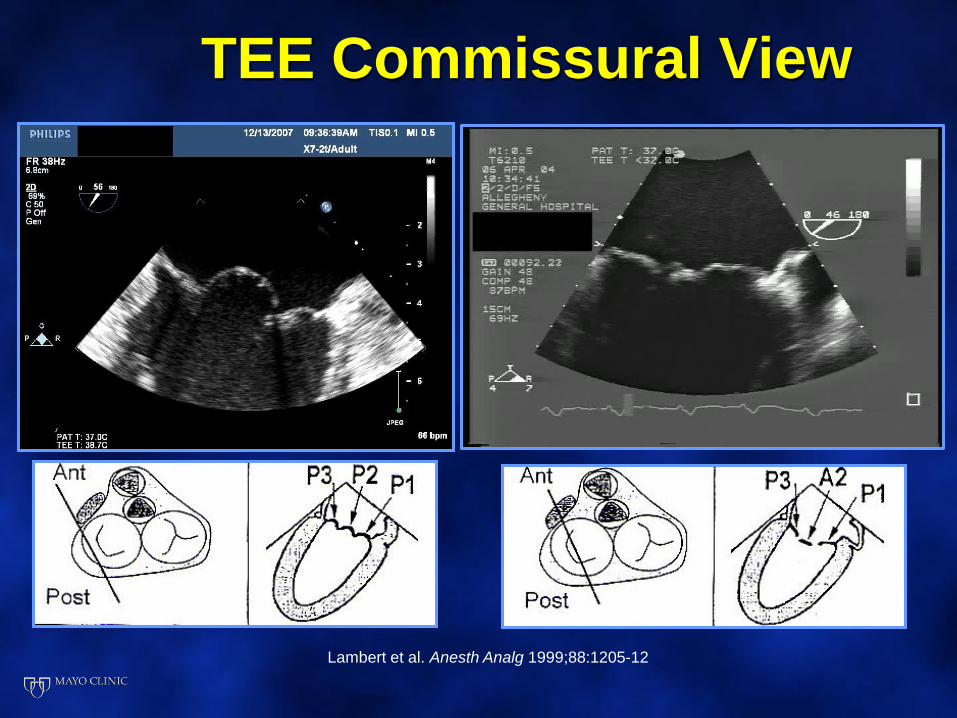
TEE Commissural View
Lambert et al. Anesth Analg 1999;88:1205-12
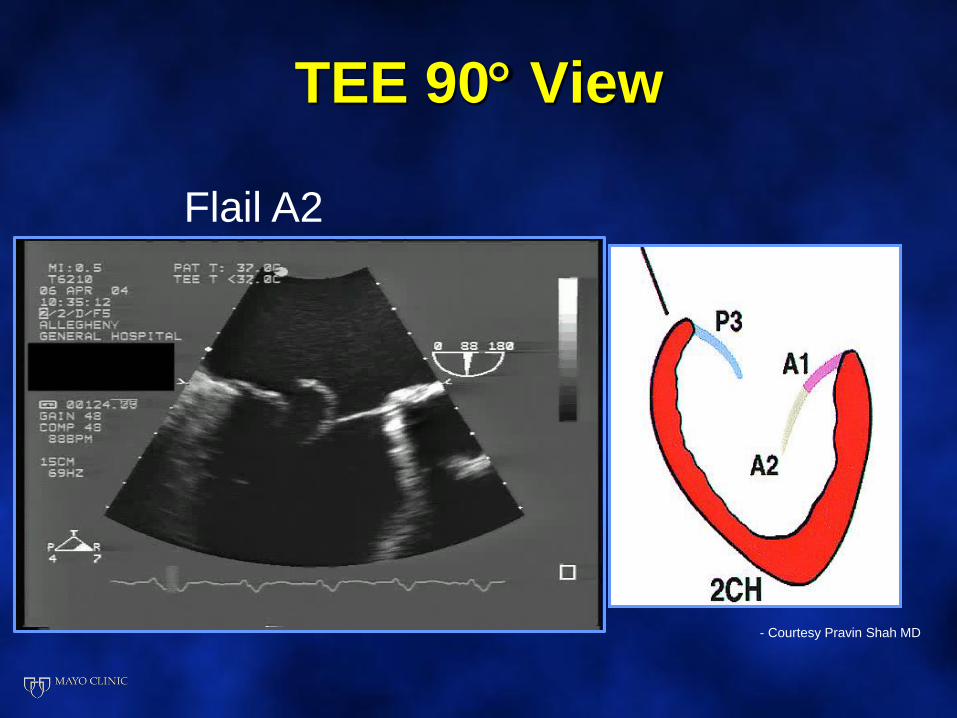
TEE 90 View
- Courtesy Pravin Shah MD
Flail A2
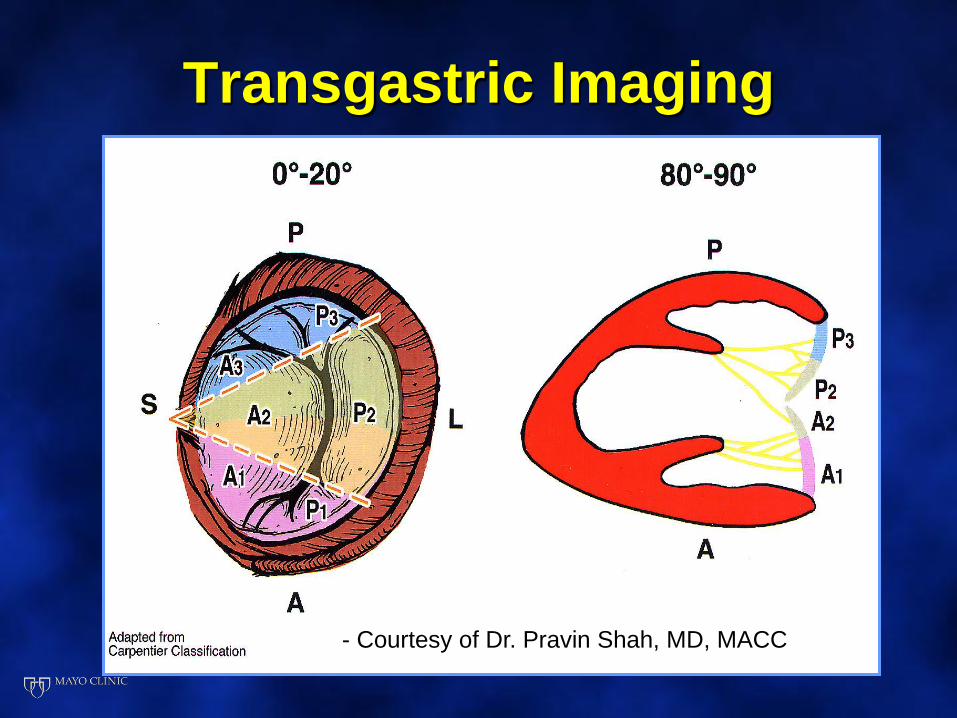
Transgastric Imaging
- Courtesy of Dr. Pravin Shah, MD, MACC
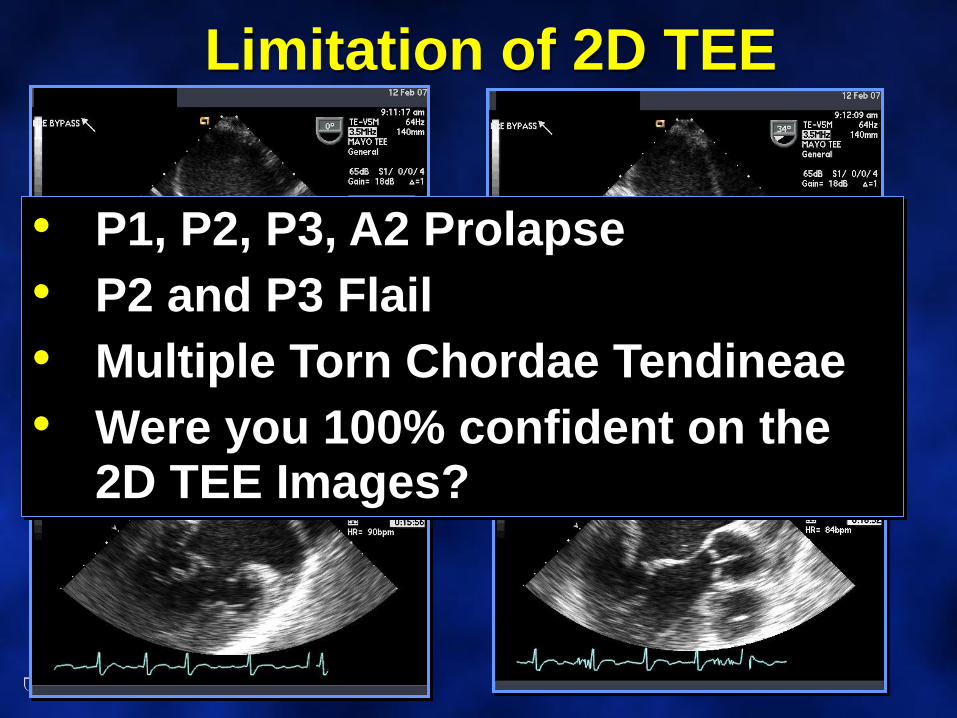
Limitation of 2D TEE
• P1, P2, P3, A2 Prolapse
• P2 and P3 Flail
• Multiple Torn Chordae Tendineae
• Were you 100% confident on the 2D TEE Images?
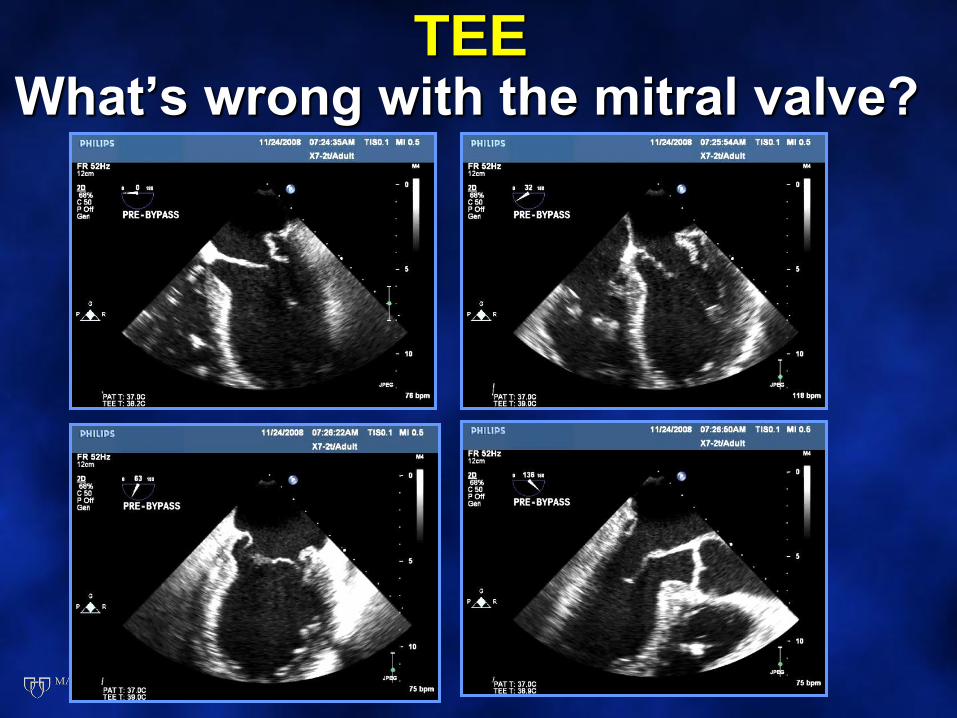
TEEWhat’s wrong with the mitral valve?
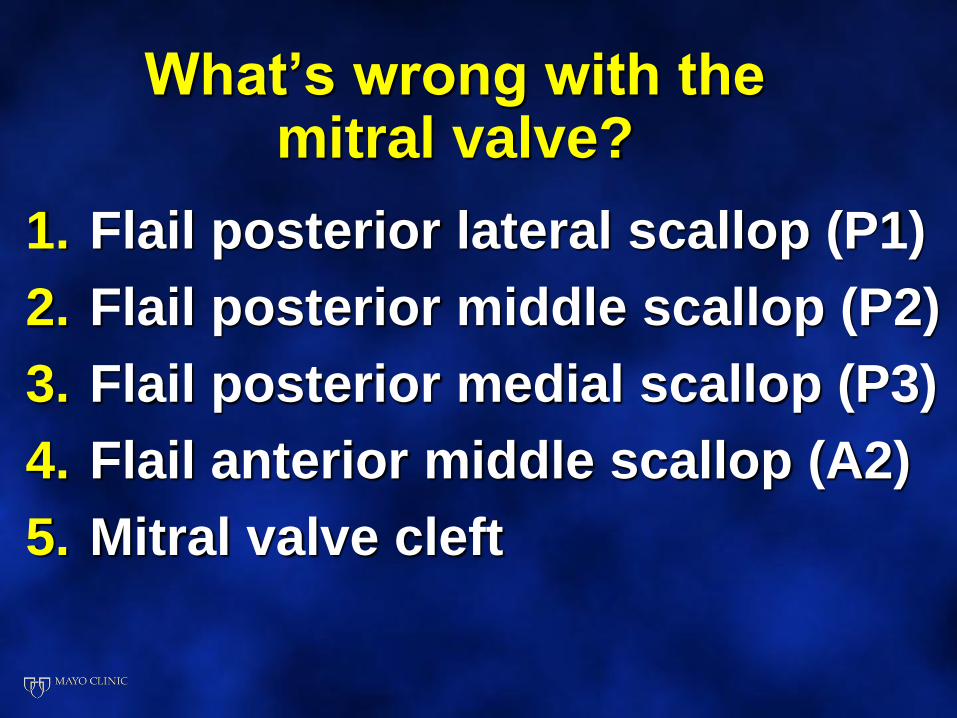
What’s wrong with the mitral valve?
1. Flail posterior lateral scallop (P1)
2. Flail posterior middle scallop (P2)
3. Flail posterior medial scallop (P3)
4. Flail anterior middle scallop (A2)
5. Mitral valve cleft
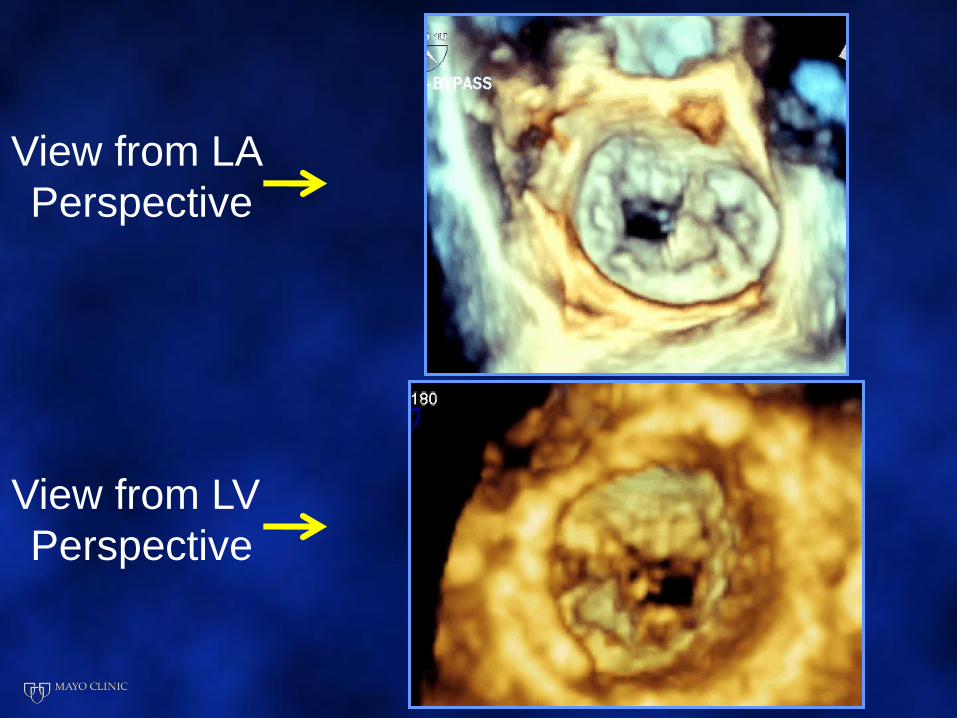
View from LA
Perspective
View from LV
Perspective
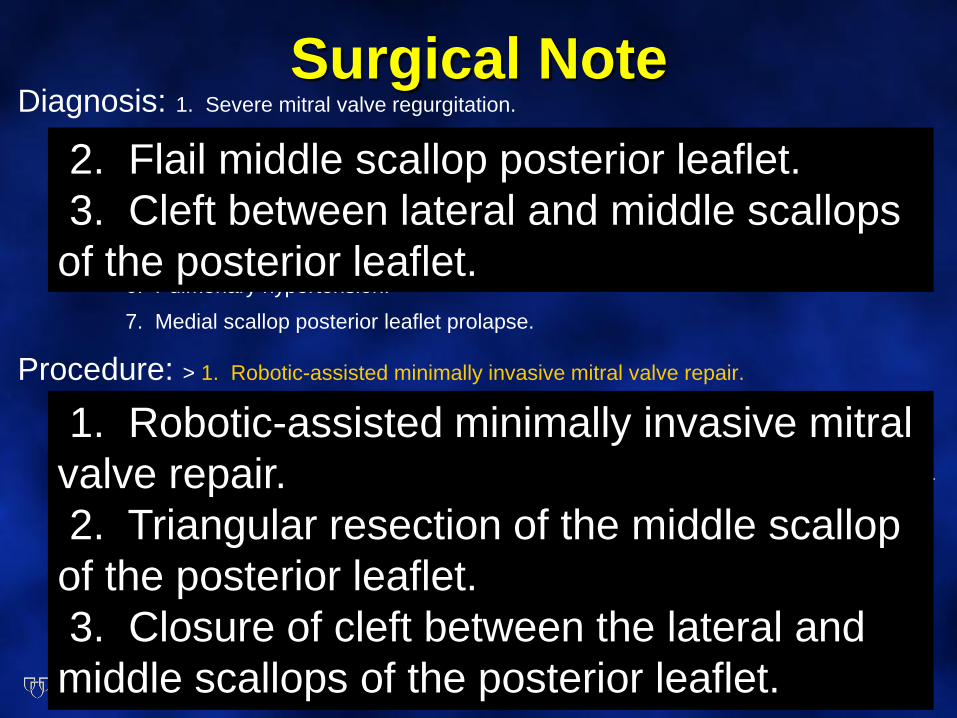
Surgical NoteDiagnosis: 1. Severe mitral valve regurgitation.
2. Flail Middle scallop posterior leaflet.
3. Cleft between lateral and middle scallops of the posterior leaflet.
4. New York Heart Association class II.
5. Moderate right ventricular dysfunction.
6. Pulmonary hypertension.
7. Medial scallop posterior leaflet prolapse.
Procedure: > 1. Robotic-assisted minimally invasive mitral valve repair.
2. Triangular resection of the middle scallop of the posterior leaflet.
3. Closure of cleft between the lateral and middle scallops of the posterior leaflet.
4. Placement plication stitch between the medial scallops of the anterior and posterior leaflet.
5. Insertion of a 63-mm posterior annuloplasty band.
6. Establishment of temporary extracorporeal
circulation to 34 degrees using the Terumo RX15 membrane oxygenator.
7. Cardioplegic arrest (blood).
2. Flail middle scallop posterior leaflet.
3. Cleft between lateral and middle scallops
of the posterior leaflet.
1. Robotic-assisted minimally invasive mitral
valve repair.
2. Triangular resection of the middle scallop
of the posterior leaflet.
3. Closure of cleft between the lateral and
middle scallops of the posterior leaflet.

What’s wrong with the mitral valve?
1. Flail posterior lateral scallop (P1)
2. Flail posterior middle scallop (P2)
3. Flail posterior medial scallop (P3)
4. Flail anterior middle scallop (A2)
5. Mitral valve cleft
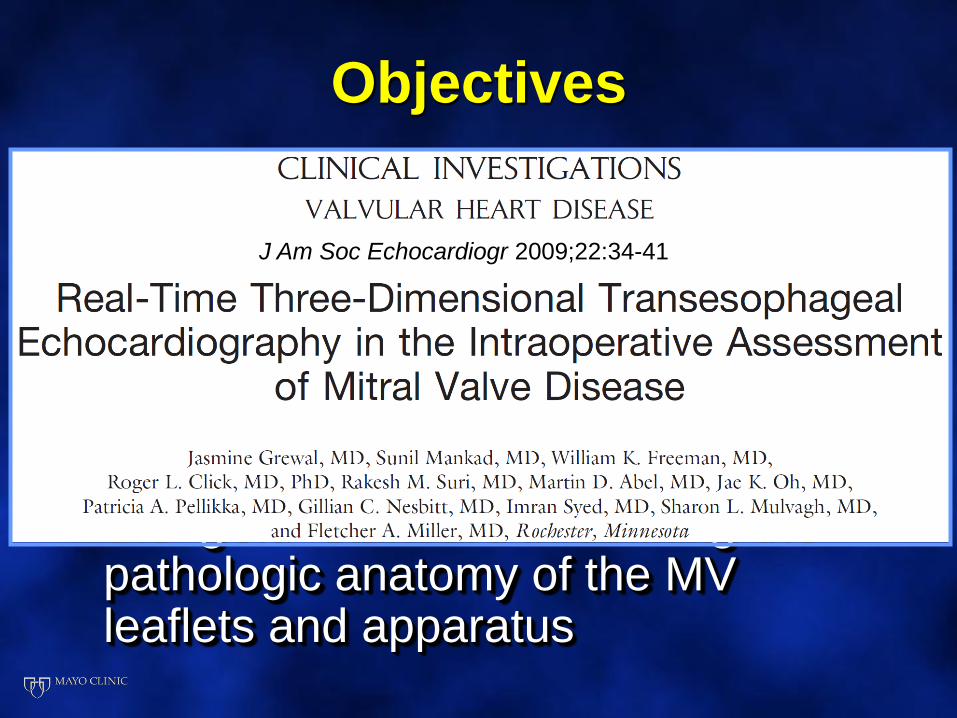
Objectives
• To determine the feasibility of using a new generation, real-time 3D TEE imaging technology to define MV pathology in the operating room
• To compare the accuracy of 2D vs3D TEE using the surgical finding as the “gold” standard in defining the pathologic anatomy of the MV leaflets and apparatus
J Am Soc Echocardiogr 2009;22:34-41
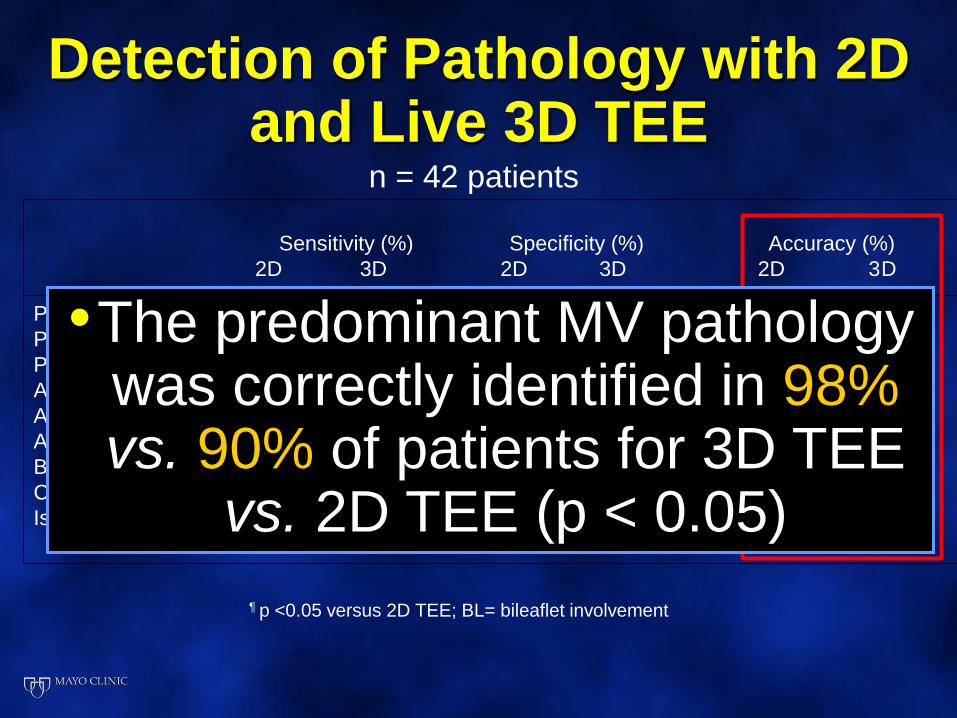
Detection of Pathology with 2D and Live 3D TEE
Sensitivity (%) Specificity (%) Accuracy (%)
2D 3D 2D 3D 2D 3D
P1 83 100 88 100 87 100
P2 93 100 76 88 83 93
P3 67 100 76 92 74 93
A1 100 100 100 100 100 100
A2 86 100 75 100¶ 77 100
A3 0 100 89 96 81 97
Bileaflet disease 66 100 86 100 70 100
Chord rupture 88 93 93 85 90 90
Ischemic Disease 60 80 100 100 93 97
¶ p <0.05 versus 2D TEE; BL= bileaflet involvement
n = 42 patients
•The predominant MV pathology was correctly identified in 98%vs. 90% of patients for 3D TEE
vs. 2D TEE (p < 0.05)
2D TEE
3D TEE
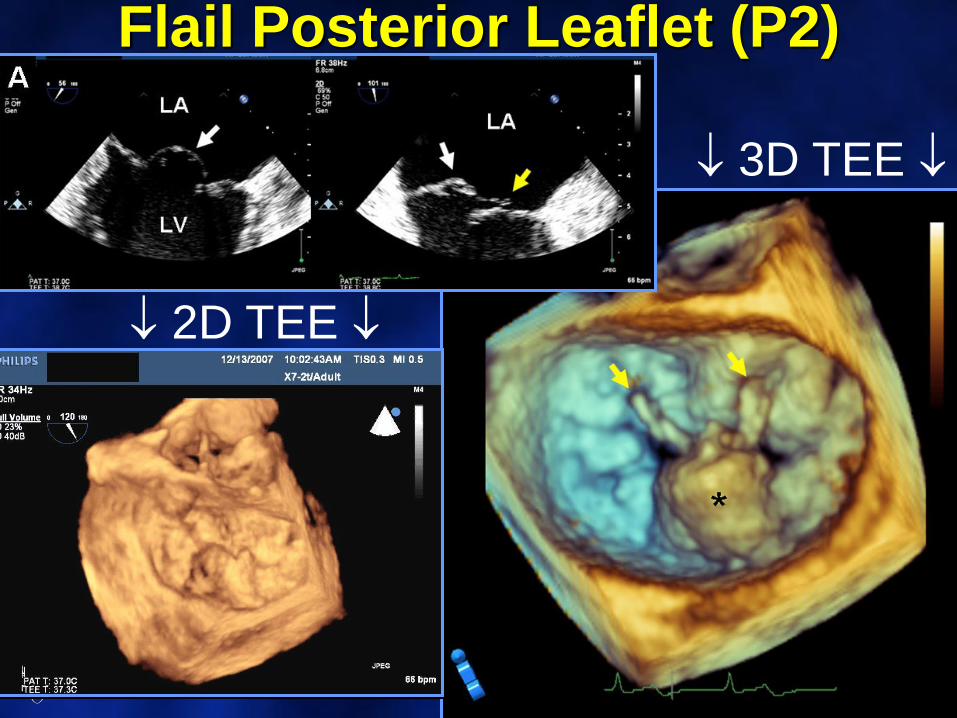
Flail Posterior Leaflet (P2)
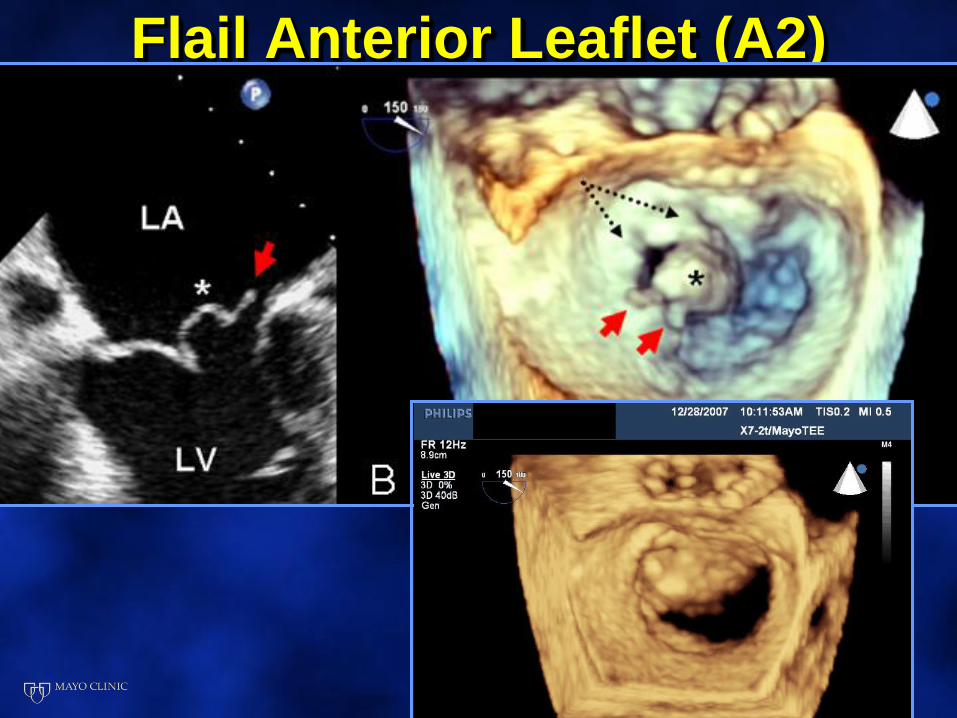
Flail Anterior Leaflet (A2)
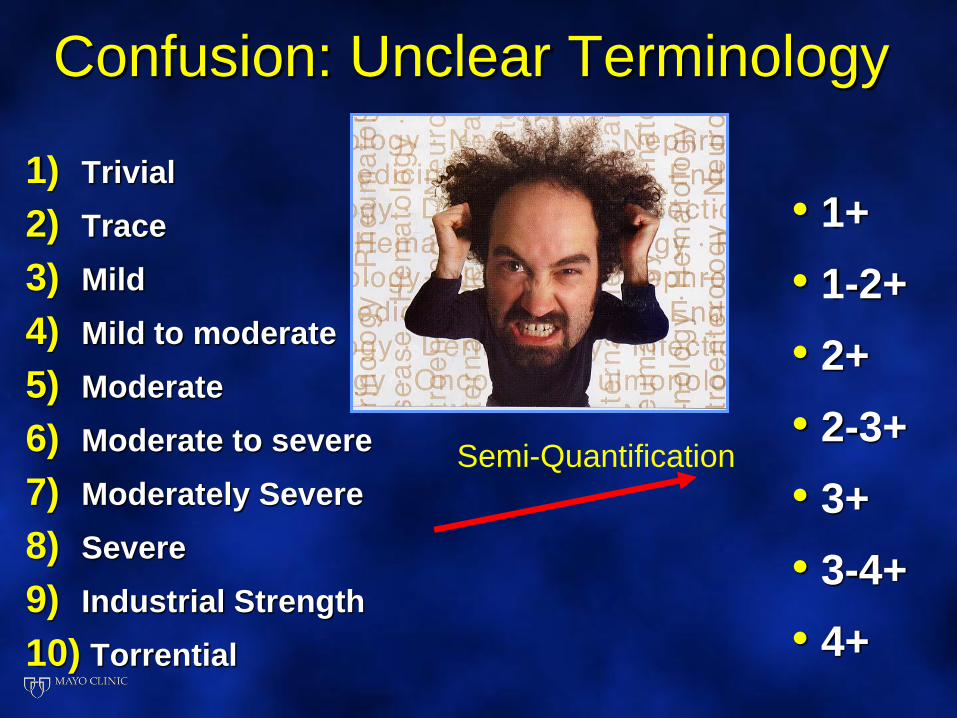
Confusion: Unclear Terminology
1) Trivial
2) Trace
3) Mild
4) Mild to moderate
5) Moderate
6) Moderate to severe
7) Moderately Severe
8) Severe
9) Industrial Strength
10) Torrential
• 1+
• 1-2+
• 2+
• 2-3+
• 3+
• 3-4+
• 4+
Semi-Quantification
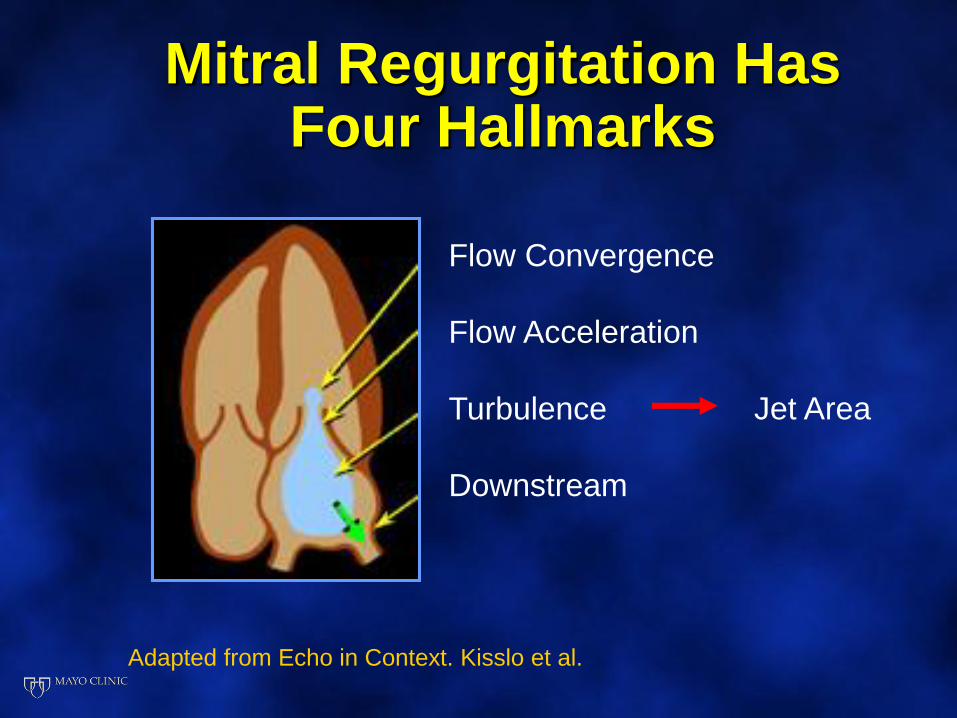
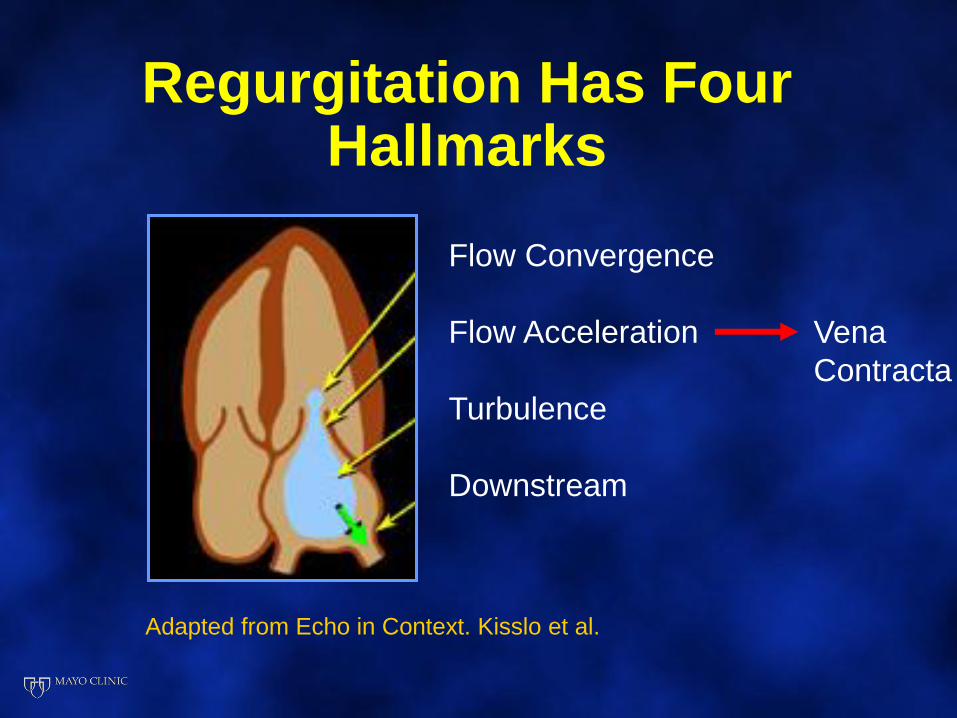
Mitral Regurgitation Has Four Hallmarks
Flow Convergence
Flow Acceleration
Turbulence
Downstream
Adapted from Echo in Context. Kisslo et al.
Jet Area
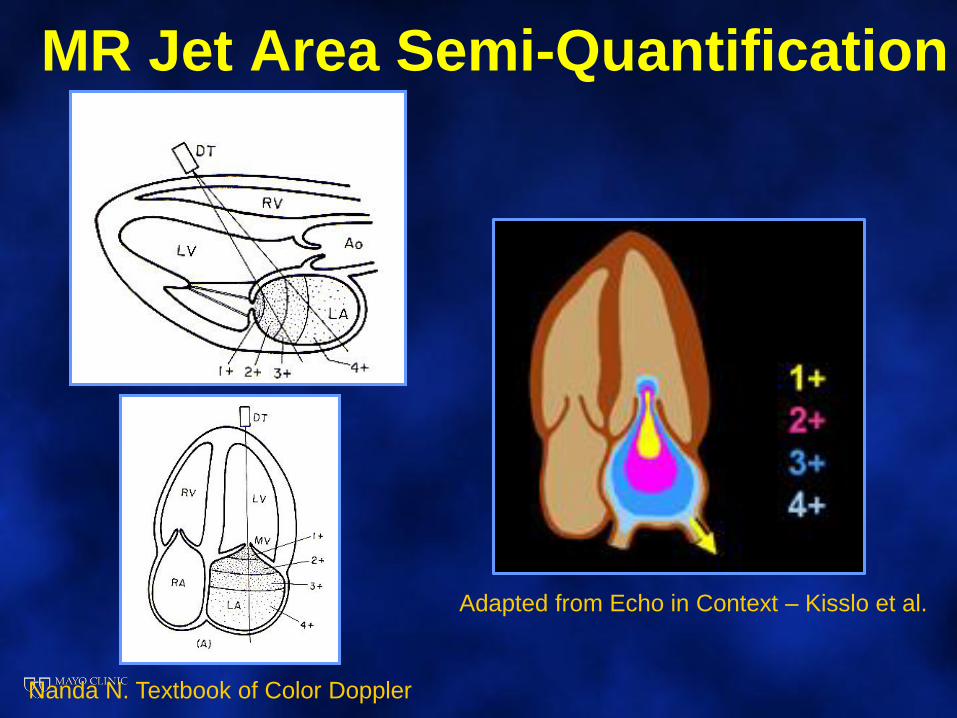
MR Jet Area Semi-Quantification
Nanda N. Textbook of Color Doppler
Adapted from Echo in Context – Kisslo et al.
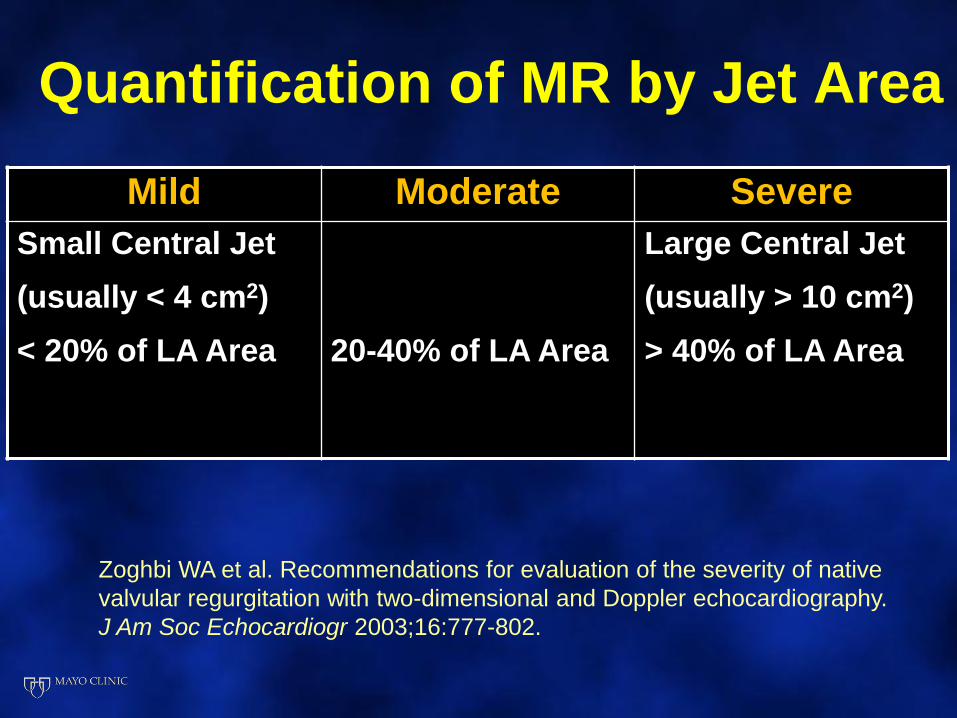
Quantification of MR by Jet Area
Mild Moderate Severe
Small Central Jet
(usually < 4 cm2)
< 20% of LA Area 20-40% of LA Area
Large Central Jet
(usually > 10 cm2)
> 40% of LA Area
Zoghbi WA et al. Recommendations for evaluation of the severity of native
valvular regurgitation with two-dimensional and Doppler echocardiography.
J Am Soc Echocardiogr 2003;16:777-802.
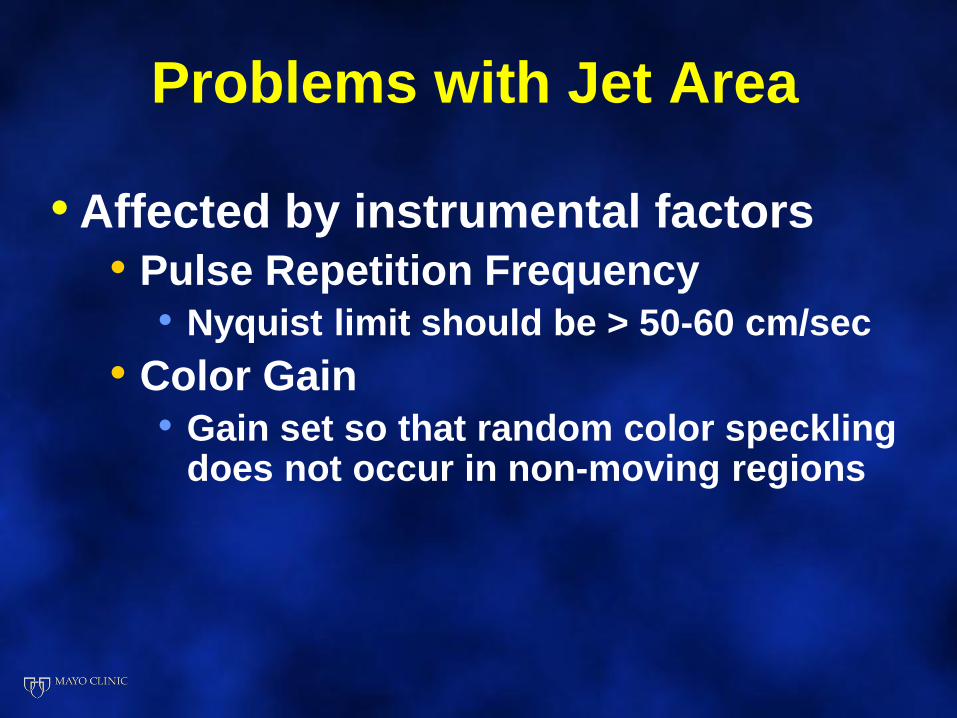
Problems with Jet Area
• Affected by instrumental factors
• Pulse Repetition Frequency
• Nyquist limit should be > 50-60 cm/sec
• Color Gain
• Gain set so that random color speckling does not occur in non-moving regions
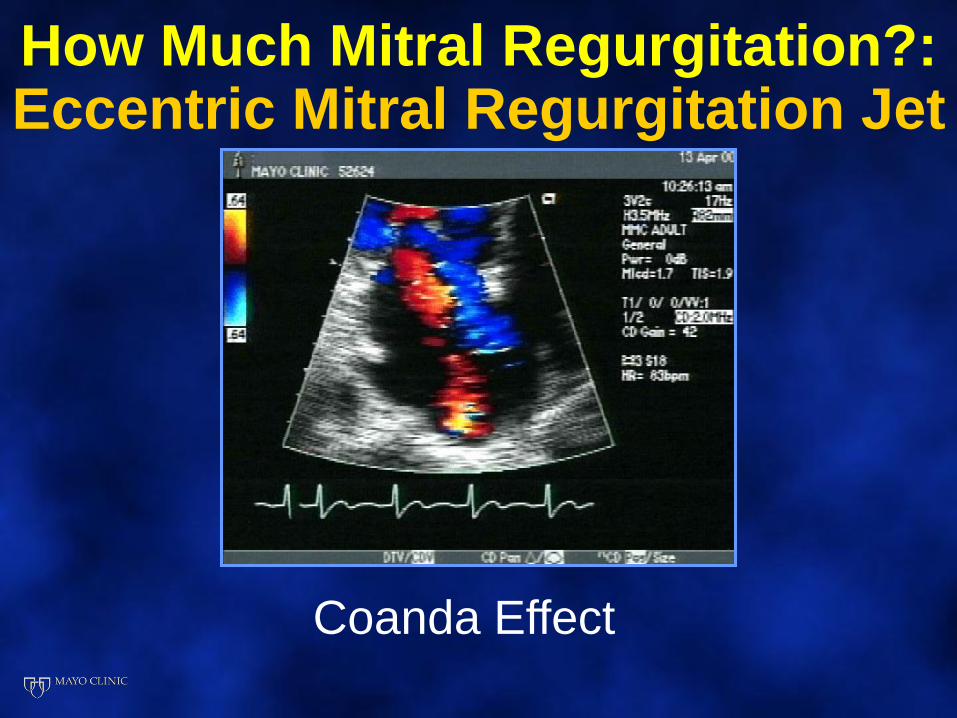
How Much Mitral Regurgitation?:Eccentric Mitral Regurgitation Jet
Coanda Effect
Regurgitation Has Four Hallmarks
Flow Convergence
Flow Acceleration
Turbulence
Downstream
Adapted from Echo in Context. Kisslo et al.
Vena
Contracta
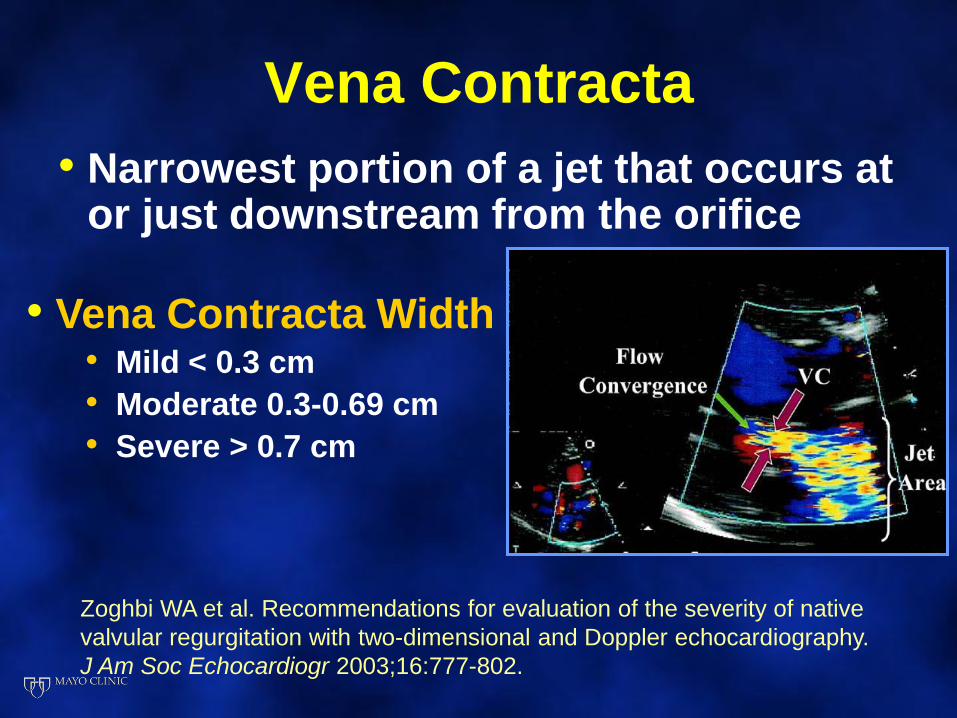
Vena Contracta
• Narrowest portion of a jet that occurs at or just downstream from the orifice
• Vena Contracta Width• Mild < 0.3 cm
• Moderate 0.3-0.69 cm
• Severe > 0.7 cm
Zoghbi WA et al. Recommendations for evaluation of the severity of native
valvular regurgitation with two-dimensional and Doppler echocardiography.
J Am Soc Echocardiogr 2003;16:777-802.
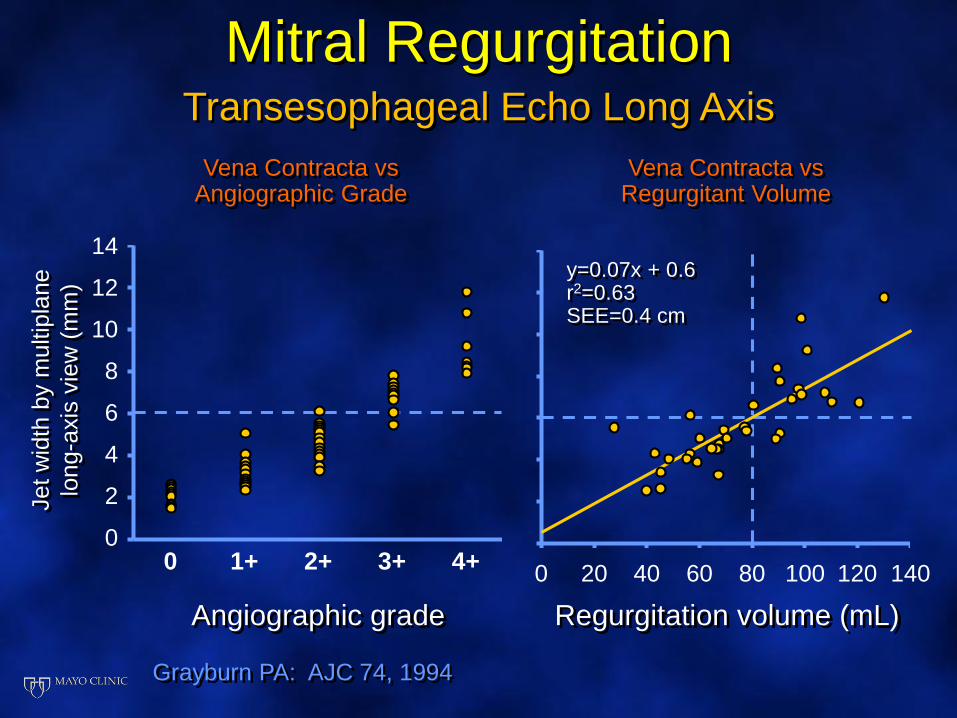
Mitral RegurgitationTransesophageal Echo Long Axis
Vena Contracta vsAngiographic Grade
14
12
10
8
6
4
2
0
Angiographic grade
0 1+ 2+ 3+ 4+
Jet w
idth
by m
ultip
lane
long-a
xis
vie
w (
mm
)
Grayburn PA: AJC 74, 1994
Vena Contracta vsRegurgitant Volume
Regurgitation volume (mL)
0 80 100 1404020 60 120
y=0.07x + 0.6r2=0.63SEE=0.4 cm
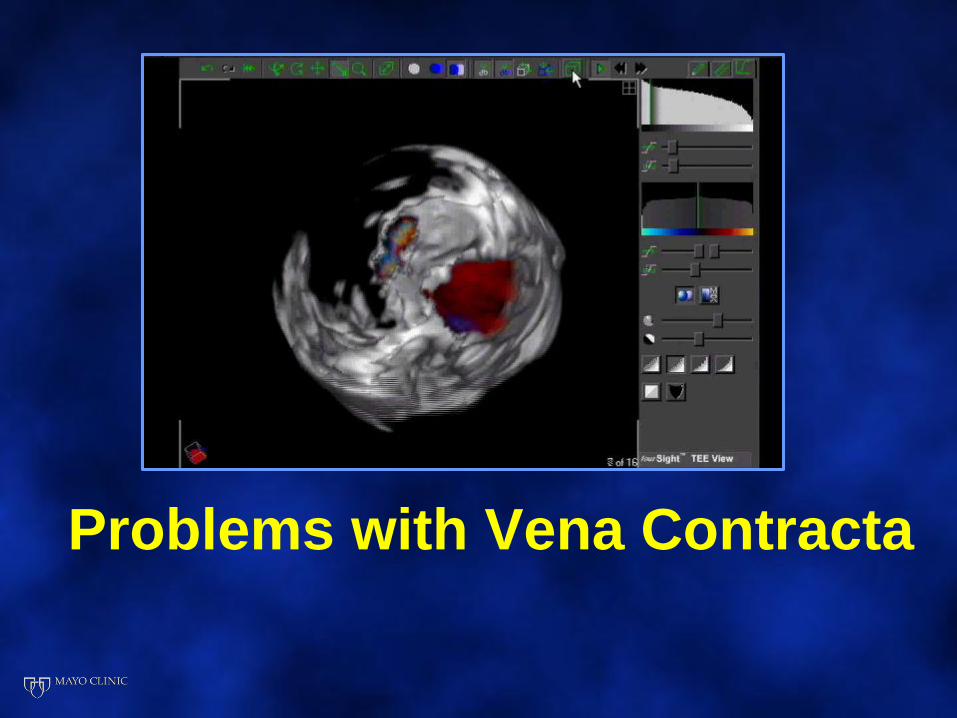
Problems with Vena Contracta
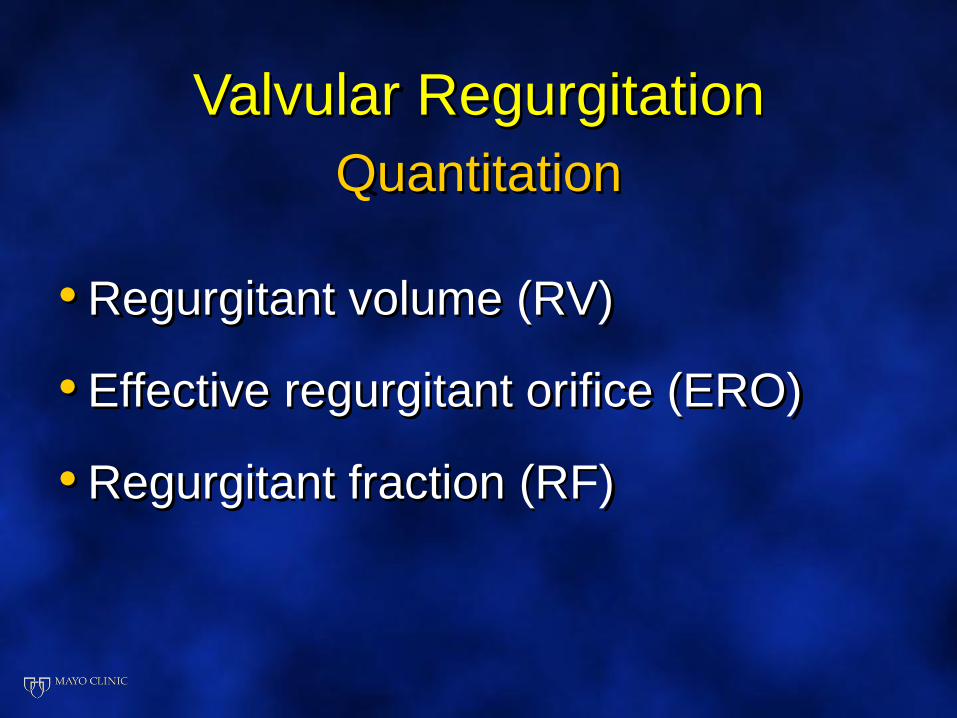
• Regurgitant volume (RV)
• Effective regurgitant orifice (ERO)
• Regurgitant fraction (RF)
Valvular Regurgitation
Quantitation
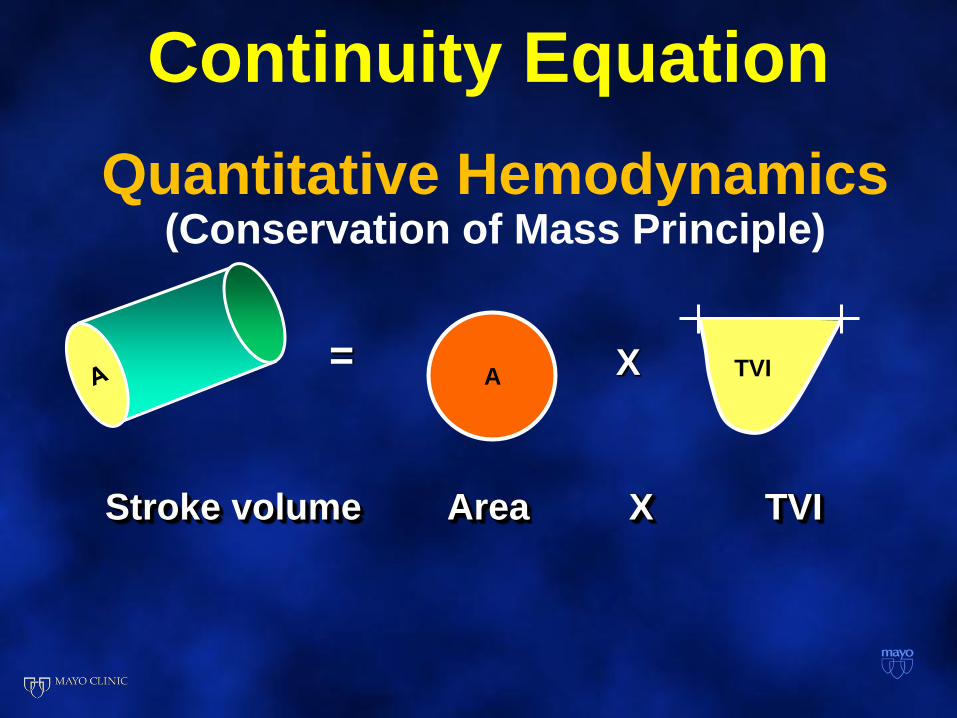
Quantitative Hemodynamics(Conservation of Mass Principle)
Stroke volume Area TVIX
A TVI= X
Continuity Equation
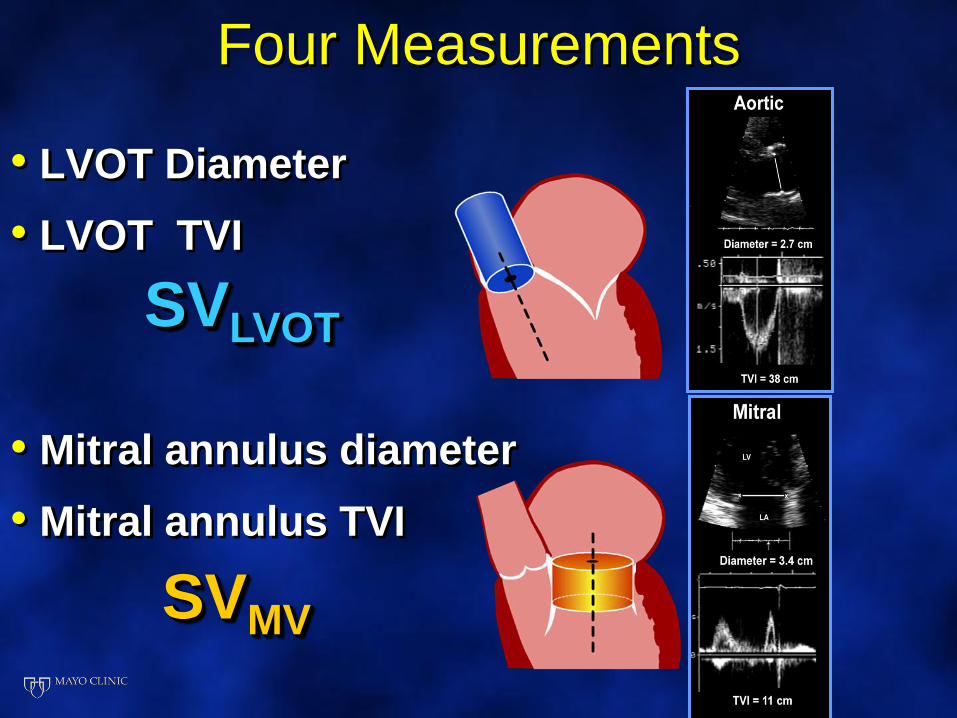
Four Measurements
• LVOT Diameter
• LVOT TVI
• Mitral annulus diameter
• Mitral annulus TVI
SVMV
SVLVOT
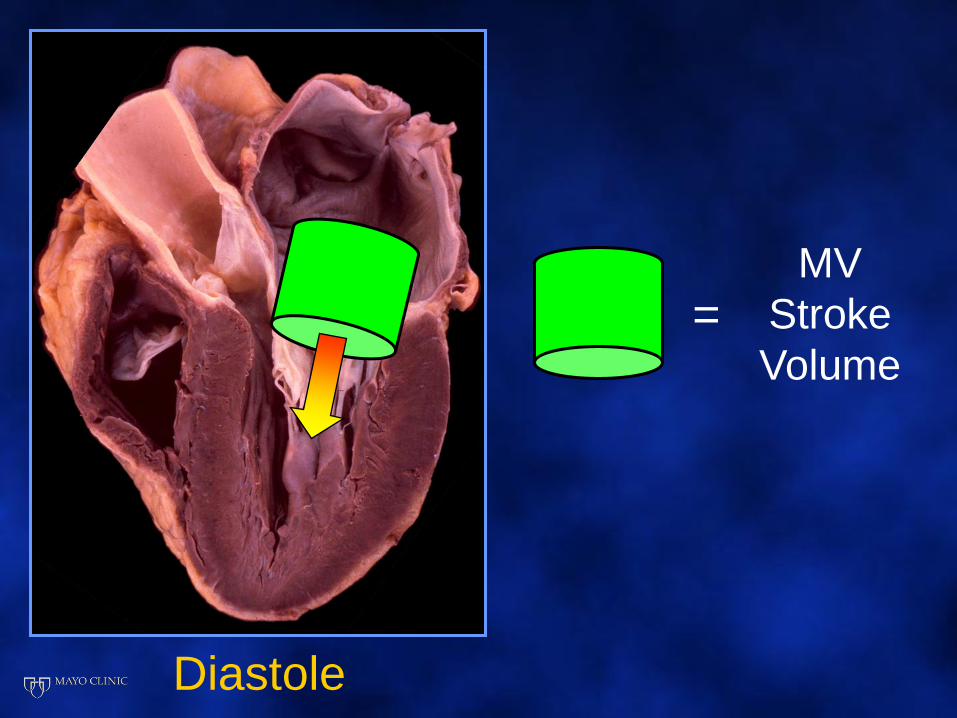
MV
Stroke
Volume
Diastole
=
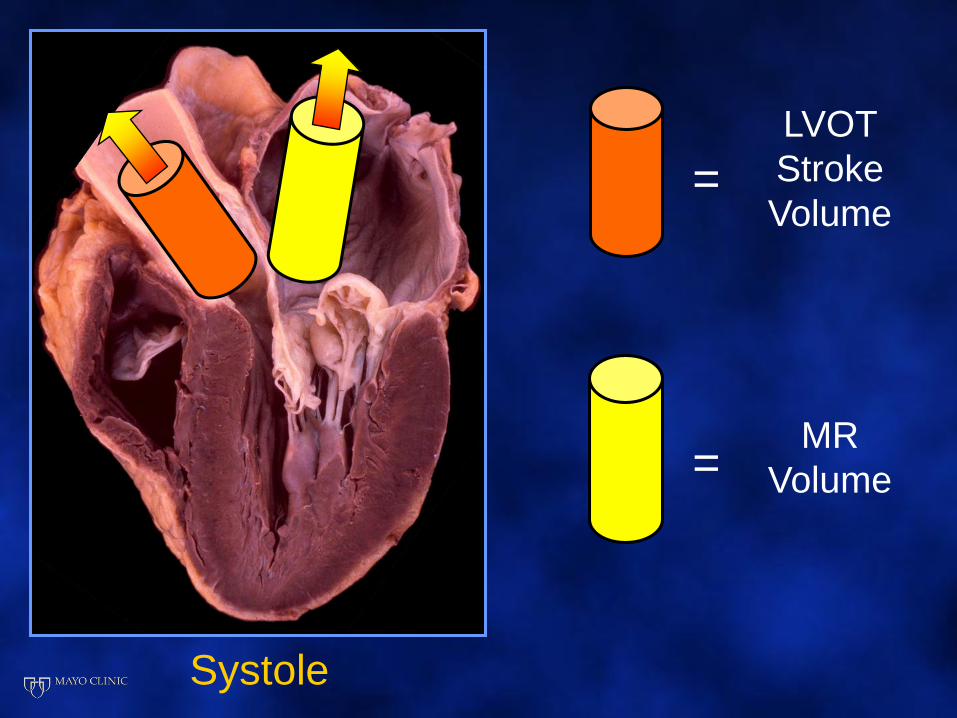
LVOT
Stroke
Volume
Systole
=
MR
Volume=
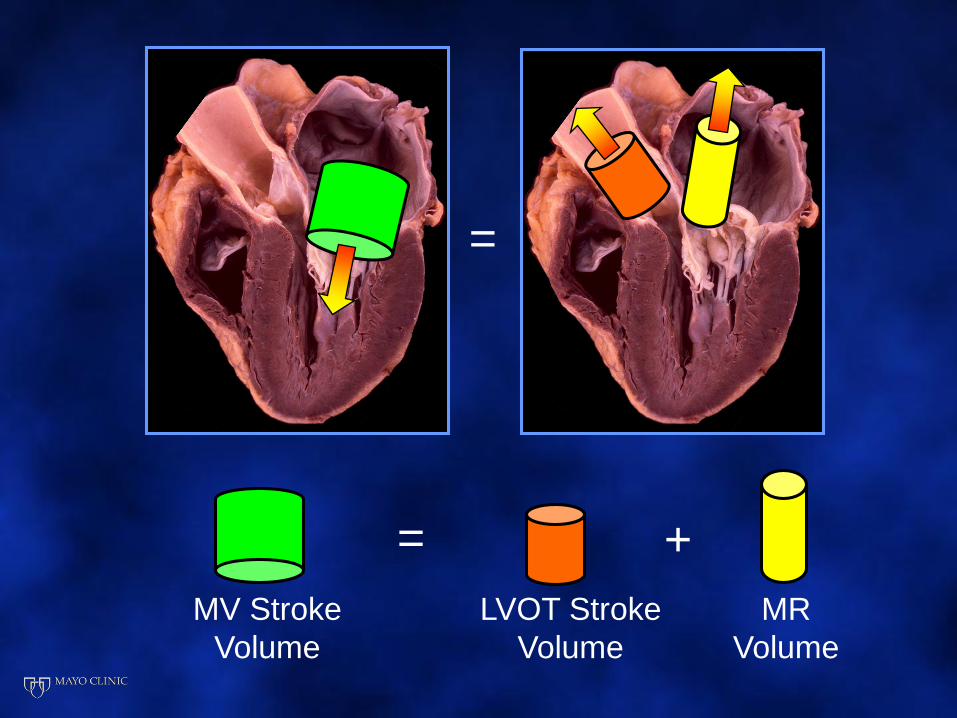
MV Stroke
Volume
=
=
LVOT Stroke
Volume
MR
Volume
+
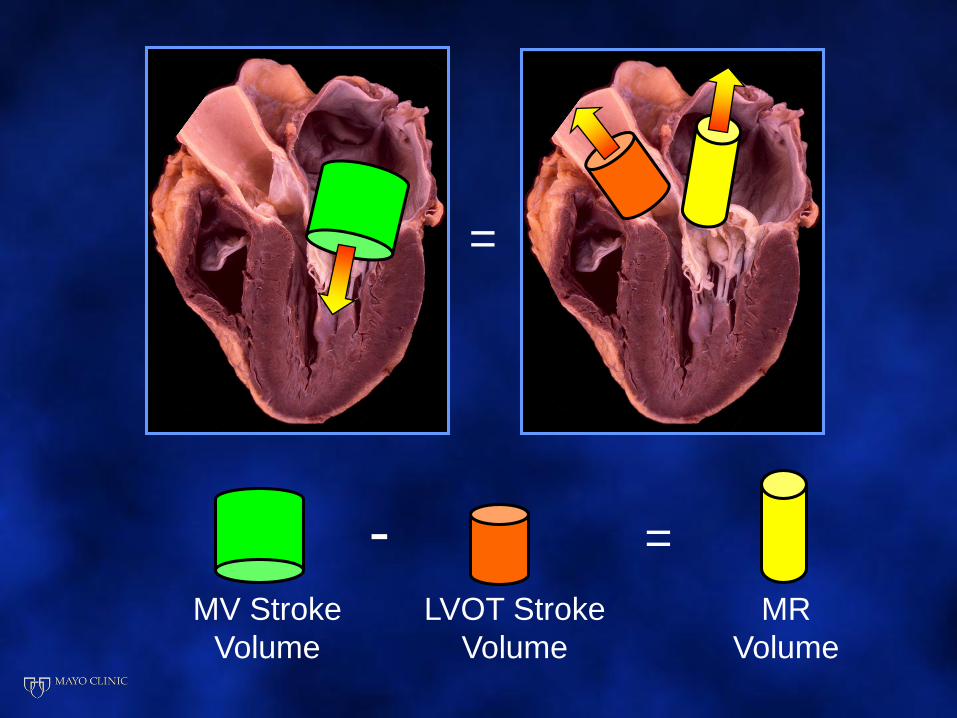
MV Stroke
Volume
=
=
LVOT Stroke
Volume
MR
Volume
-
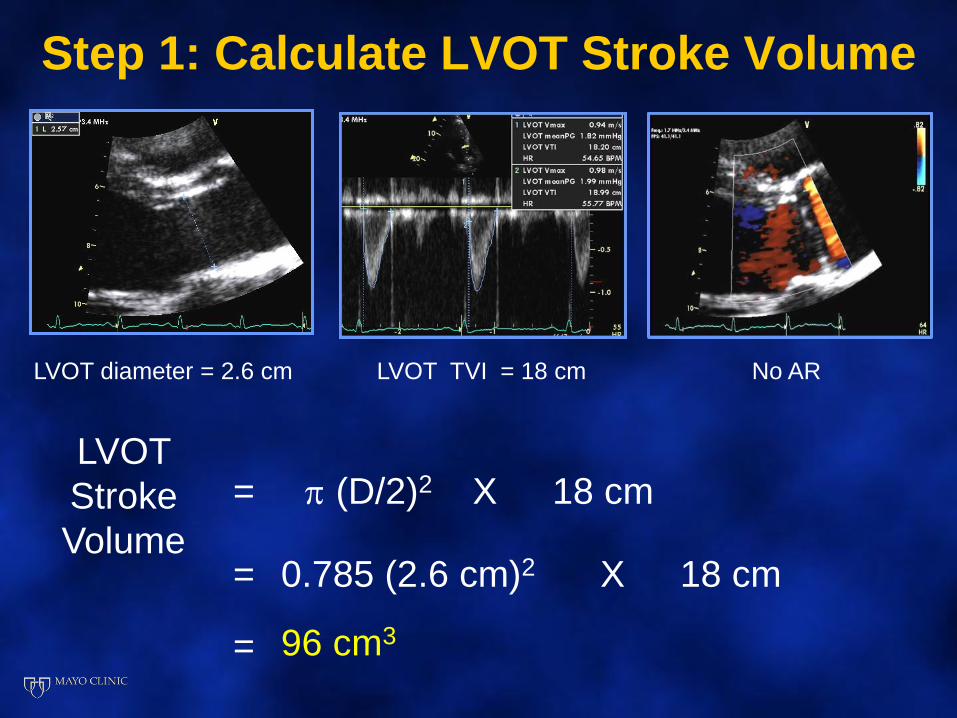
Step 1: Calculate LVOT Stroke Volume
LVOT diameter = 2.6 cm LVOT TVI = 18 cm
LVOT
Stroke
Volume
=
No AR
(D/2)2 X 18 cm
= 0.785 (2.6 cm)2 X 18 cm
= 96 cm3
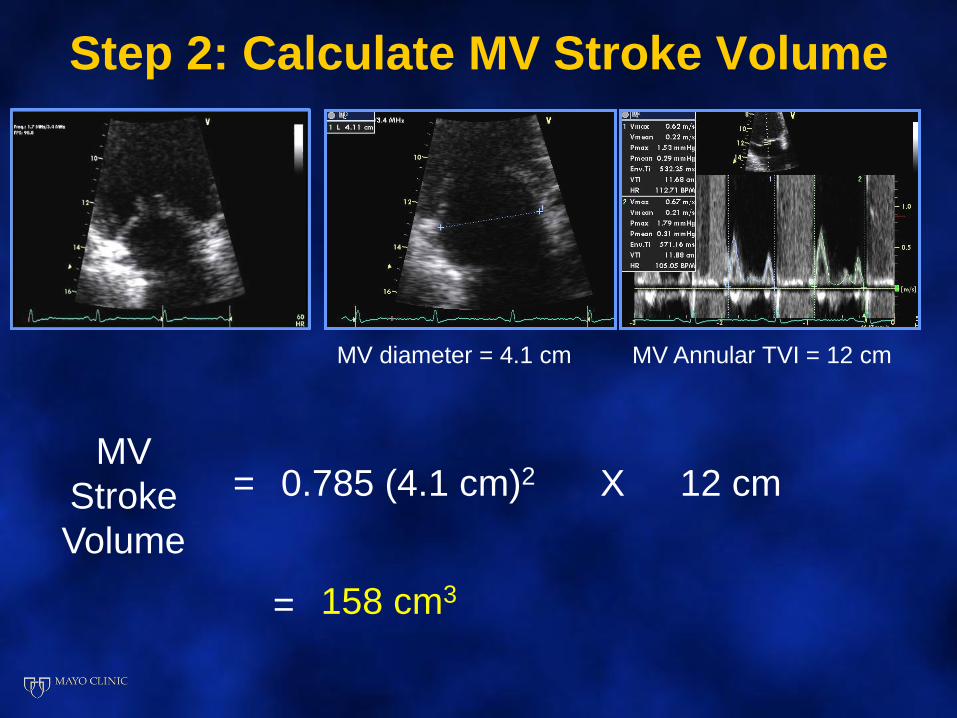
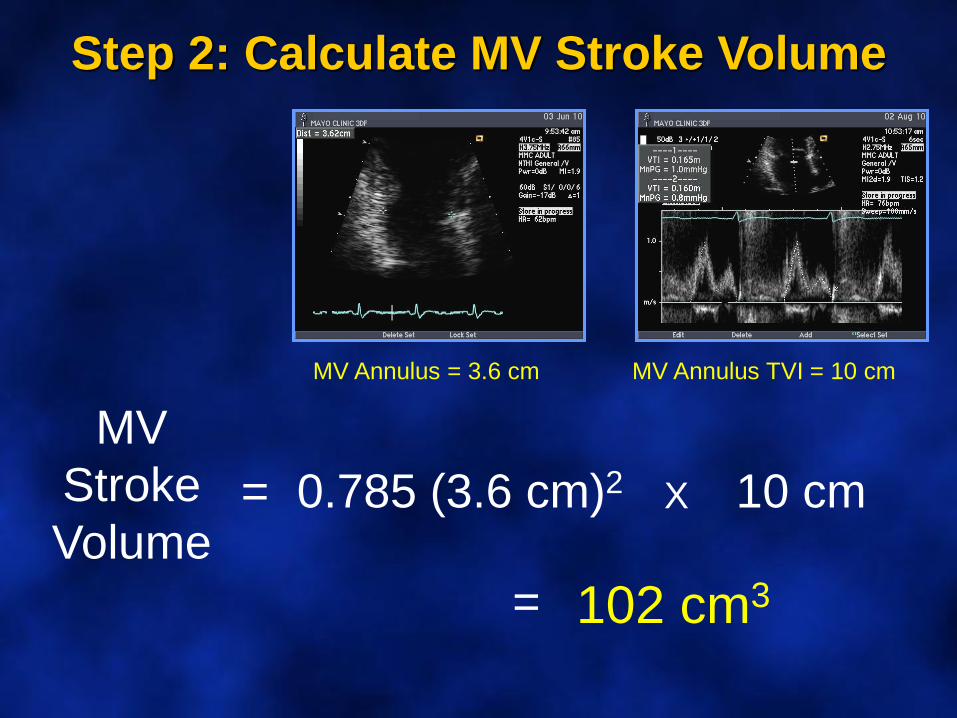
Step 2: Calculate MV Stroke Volume
MV diameter = 4.1 cm MV Annular TVI = 12 cm
MV
Stroke
Volume
= 0.785 (4.1 cm)2 X 12 cm
= 158 cm3
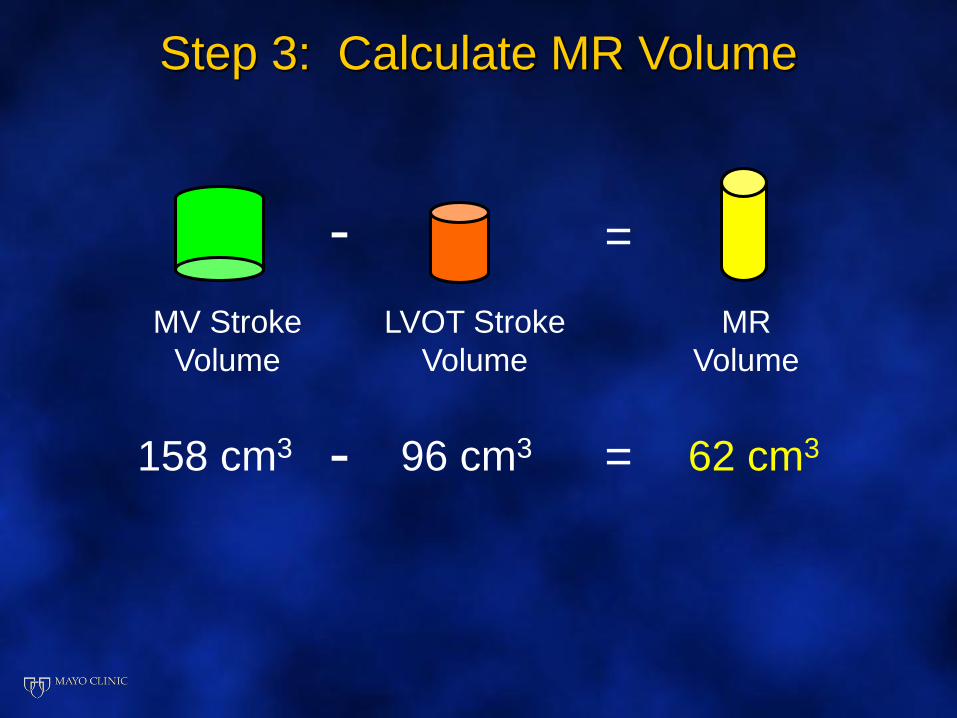
Step 3: Calculate MR Volume
MV Stroke
Volume
=
LVOT Stroke
Volume
MR
Volume
-
96 cm3158 cm3 - = 62 cm3
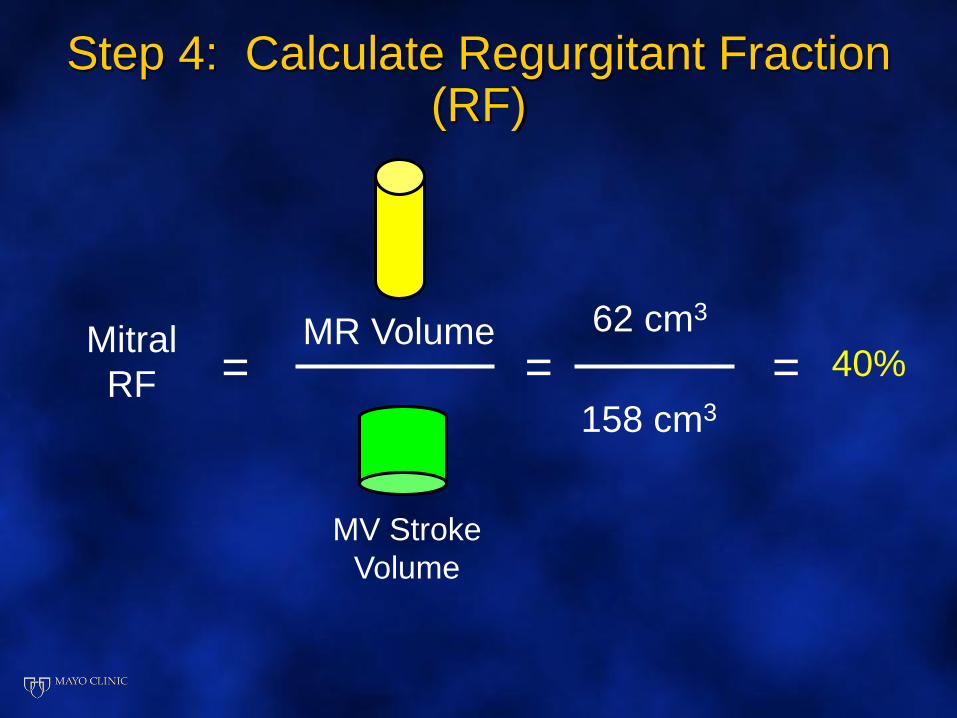
Mitral
RF =
MV Stroke
Volume
MR Volume
Step 4: Calculate Regurgitant Fraction (RF)
= =62 cm3
158 cm3
40%
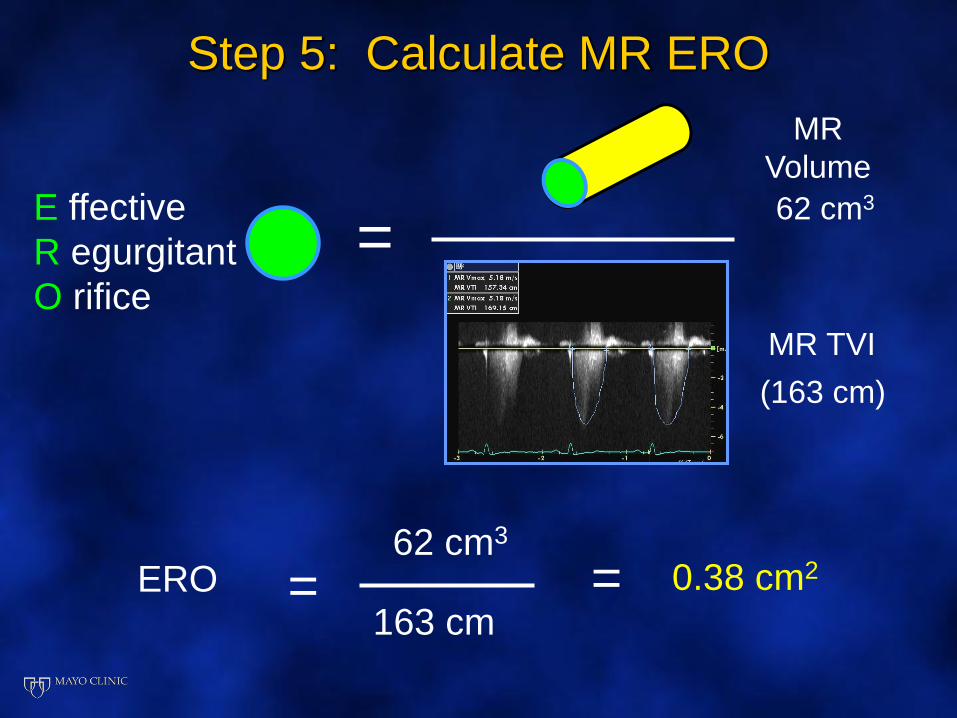
Step 5: Calculate MR ERO
MR
Volume
=E ffective
R egurgitant
O rifice
MR TVI
=ERO62 cm3
163 cm= 0.38 cm2
(163 cm)
62 cm3
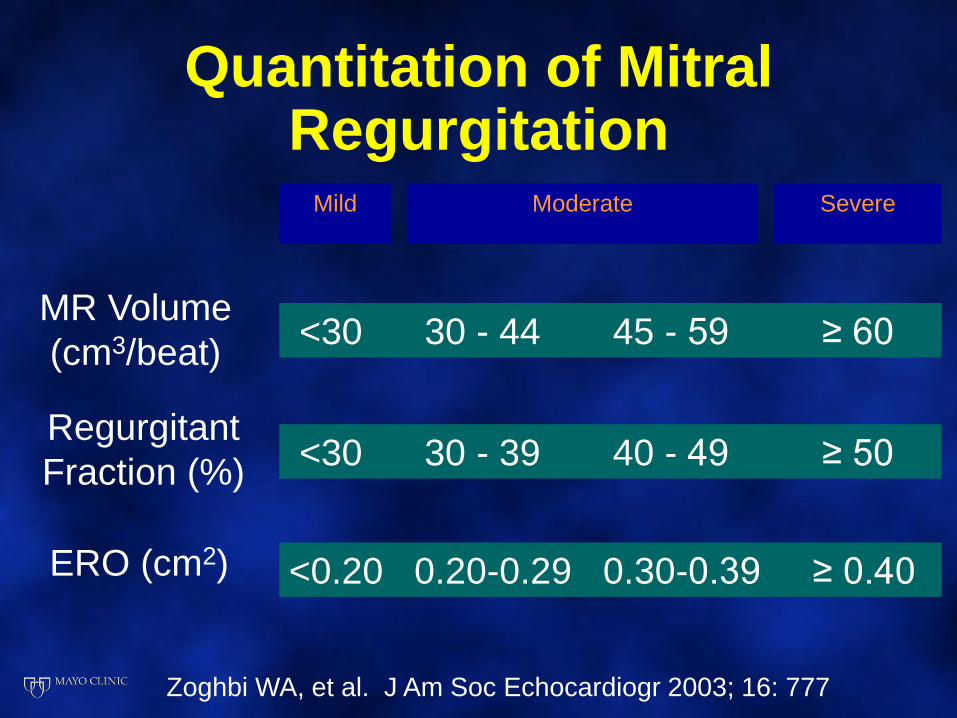
Quantitation of Mitral Regurgitation
Mild Moderate Severe
MR Volume
(cm3/beat)<30 30 - 44 45 - 59 ≥ 60
Regurgitant
Fraction (%)<30 30 - 39 40 - 49 ≥ 50
ERO (cm2) <0.20 0.20-0.29 0.30-0.39 ≥ 0.40
Zoghbi WA, et al. J Am Soc Echocardiogr 2003; 16: 777
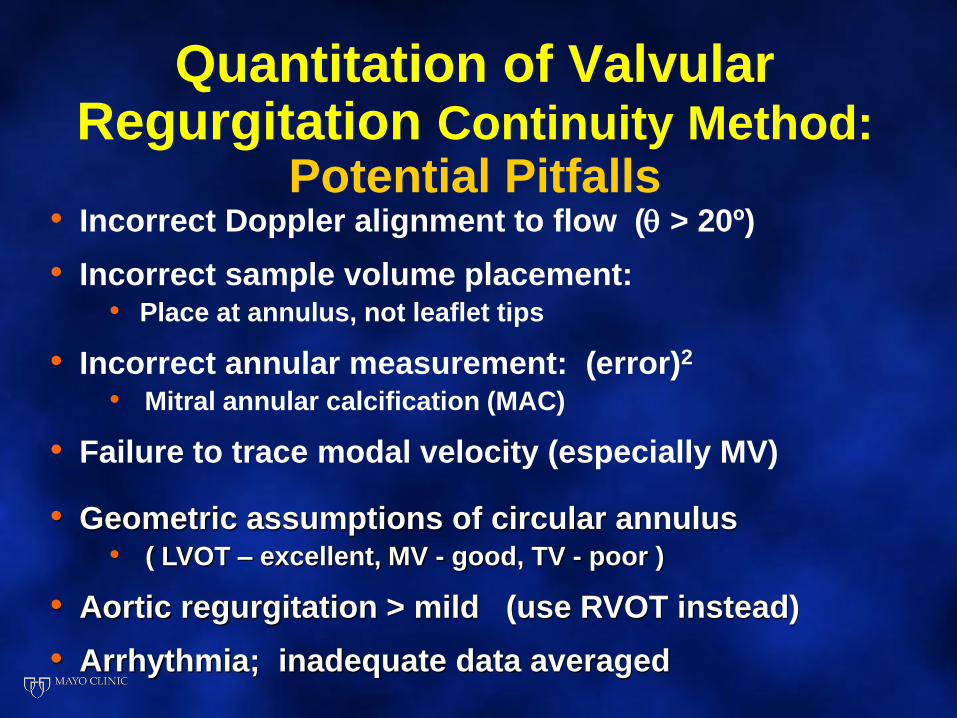
Quantitation of Valvular Regurgitation Continuity Method:
Potential Pitfalls • Incorrect Doppler alignment to flow ( > 20º)
• Incorrect sample volume placement: • Place at annulus, not leaflet tips
• Incorrect annular measurement: (error)2
• Mitral annular calcification (MAC)
• Failure to trace modal velocity (especially MV)
• Geometric assumptions of circular annulus• ( LVOT – excellent, MV - good, TV - poor )
• Aortic regurgitation > mild (use RVOT instead)
• Arrhythmia; inadequate data averaged
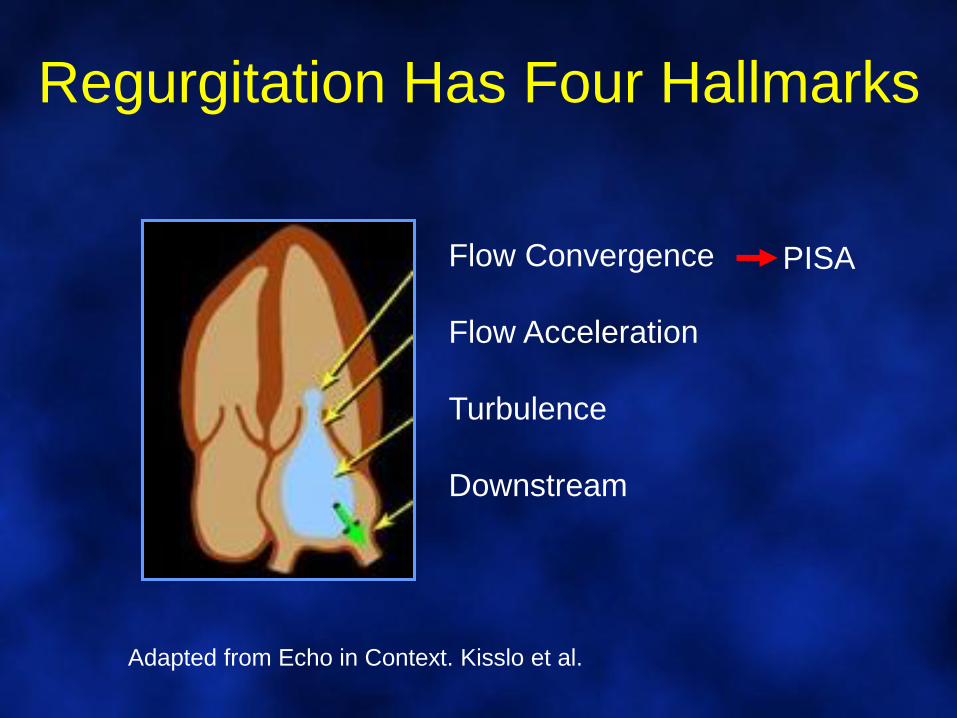
Regurgitation Has Four Hallmarks
Flow Convergence
Flow Acceleration
Turbulence
Downstream
Adapted from Echo in Context. Kisslo et al.
PISA
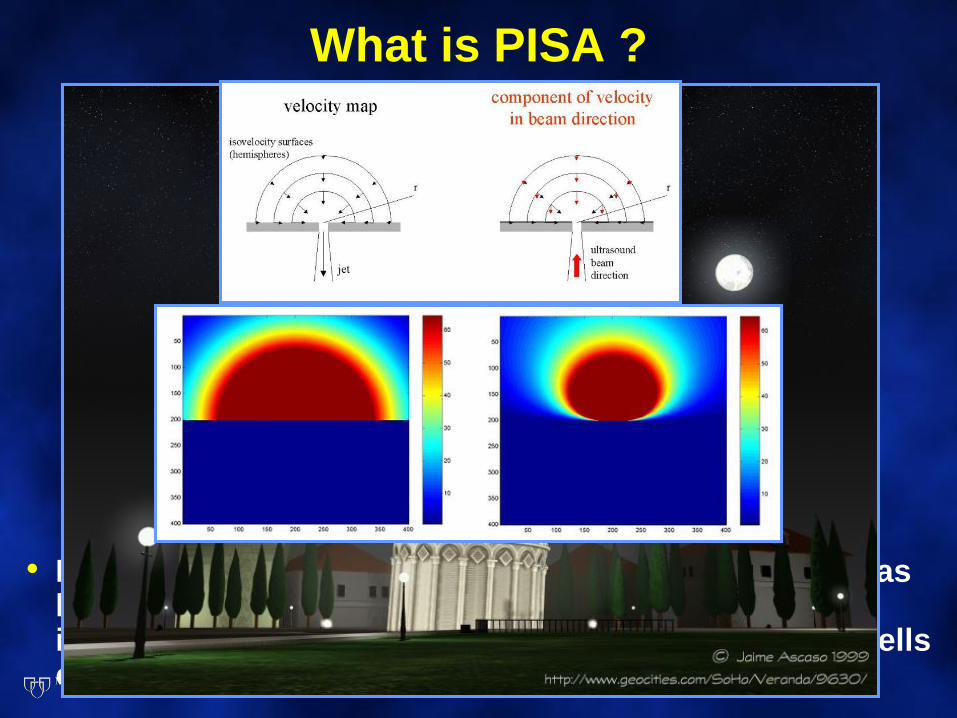
What is PISA ?
• Derived from the hydrodynamic principle stating that, as blood approaches a regurgitant orifice, its velocity increases forming concentric, roughly hemispheric shells of increasing velocity and decreasing surface area
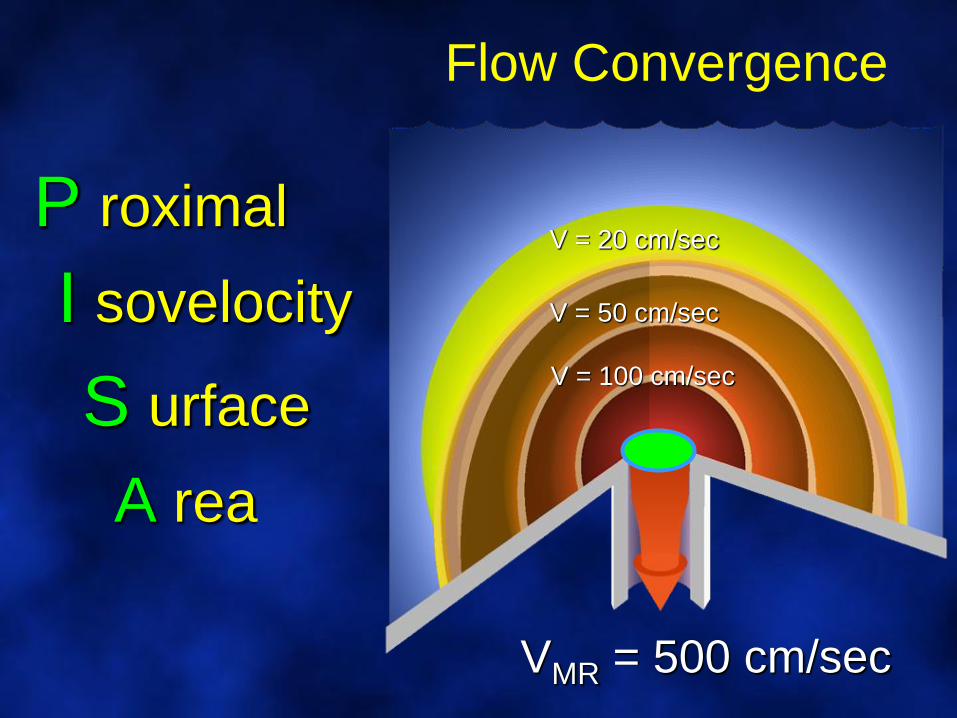
Flow Convergence
V = 20 cm/sec
V = 50 cm/sec
V = 100 cm/sec
VMR = 500 cm/sec
P roximal
I sovelocity
S urface
A rea
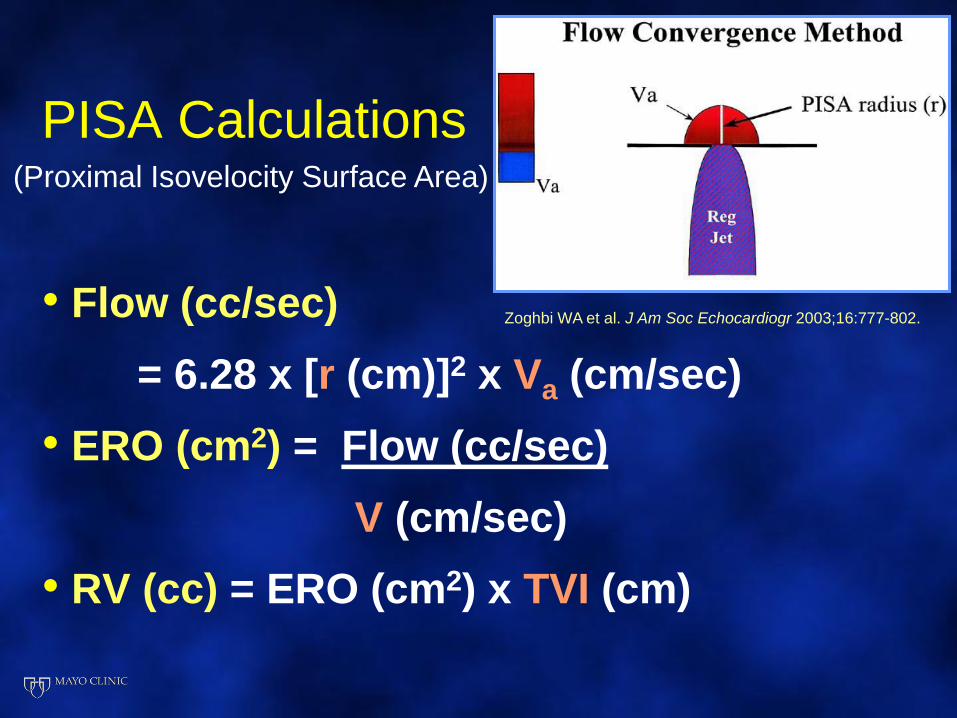
PISA Calculations
• Flow (cc/sec)
= 6.28 x [r (cm)]2 x Va (cm/sec)
• ERO (cm2) = Flow (cc/sec)
V (cm/sec)
• RV (cc) = ERO (cm2) x TVI (cm)
Zoghbi WA et al. J Am Soc Echocardiogr 2003;16:777-802.
(Proximal Isovelocity Surface Area)
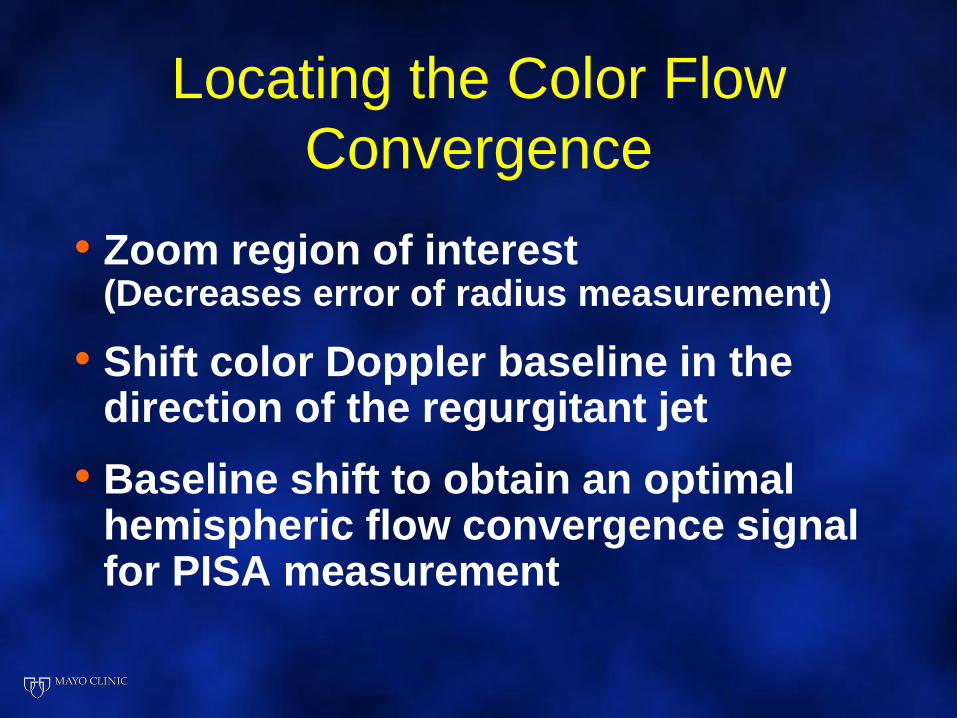
Locating the Color Flow
Convergence
• Zoom region of interest (Decreases error of radius measurement)
• Shift color Doppler baseline in the direction of the regurgitant jet
• Baseline shift to obtain an optimal hemispheric flow convergence signal for PISA measurement
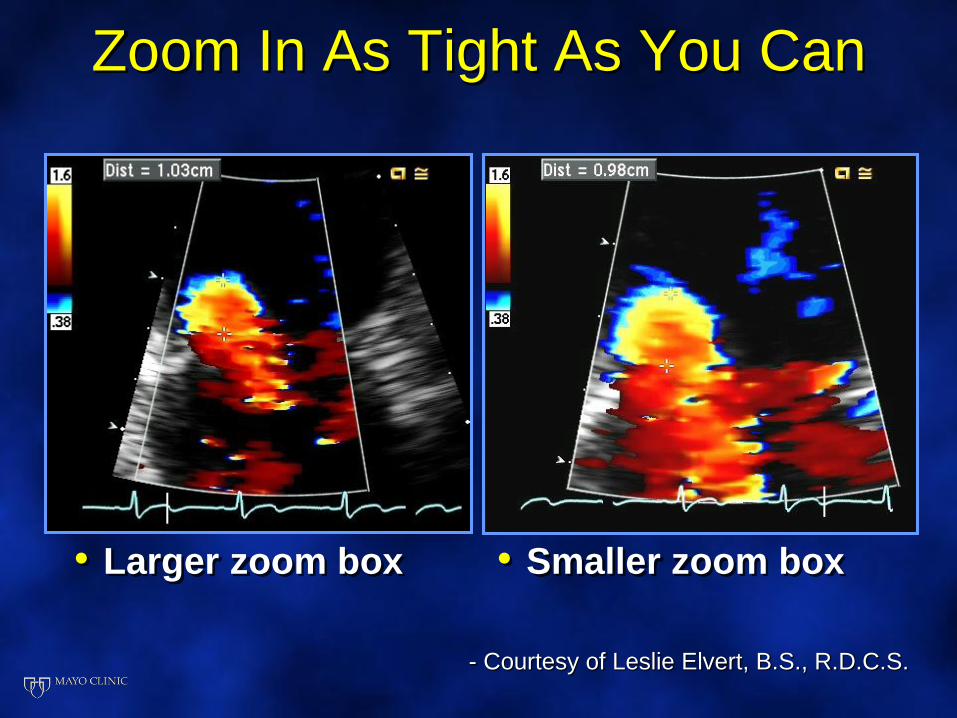
Zoom In As Tight As You Can
• Larger zoom box • Smaller zoom box
- Courtesy of Leslie Elvert, B.S., R.D.C.S.
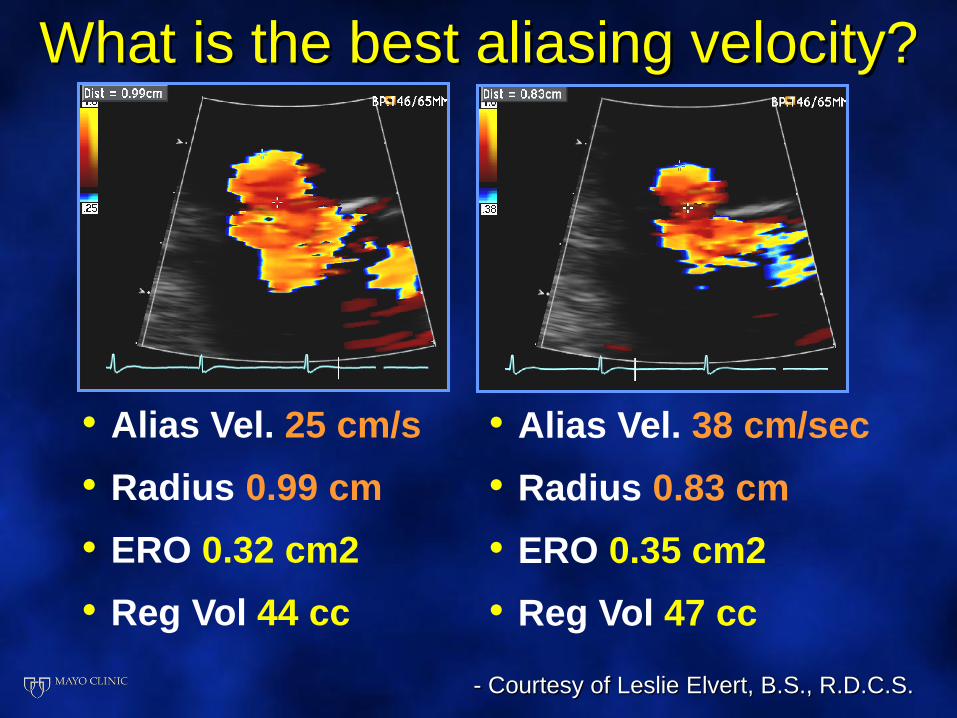
• Alias Vel. 38 cm/sec
• Radius 0.83 cm
• ERO 0.35 cm2
• Reg Vol 47 cc
• Alias Vel. 25 cm/s
• Radius 0.99 cm
• ERO 0.32 cm2
• Reg Vol 44 cc
- Courtesy of Leslie Elvert, B.S., R.D.C.S.
What is the best aliasing velocity?
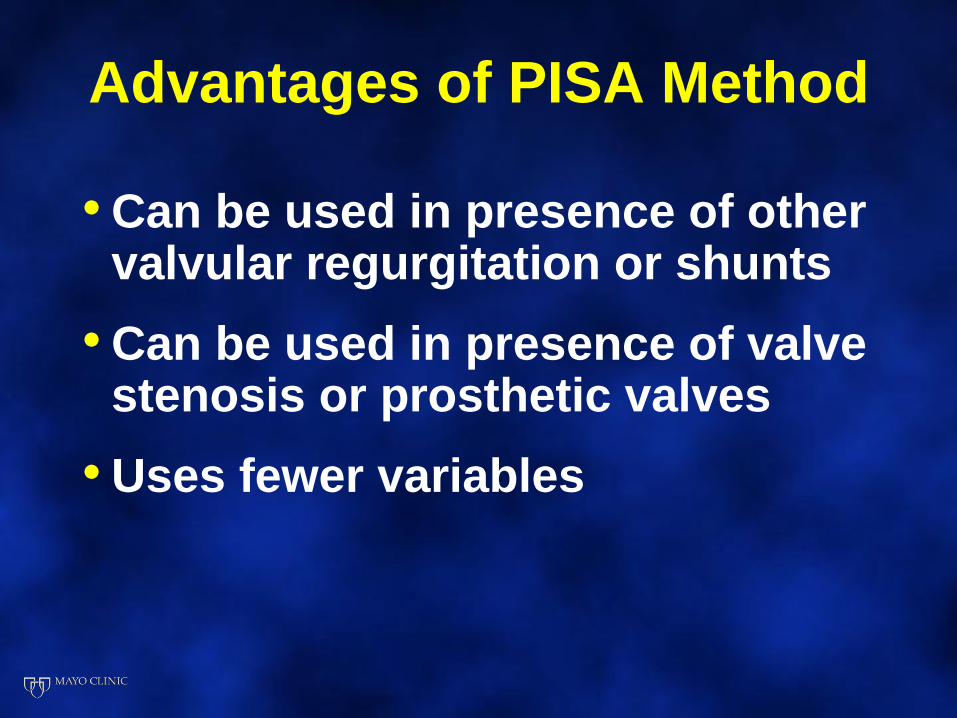
Advantages of PISA Method
• Can be used in presence of other valvular regurgitation or shunts
• Can be used in presence of valve stenosis or prosthetic valves
• Uses fewer variables
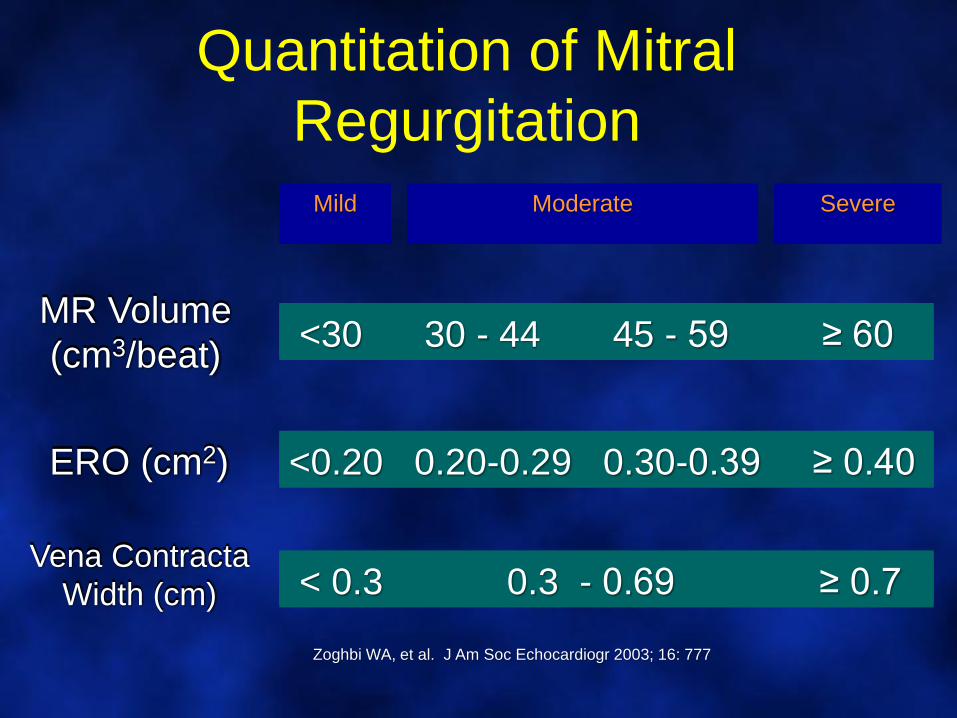
Quantitation of Mitral
Regurgitation
Mild Moderate Severe
MR Volume
(cm3/beat)<30 30 - 44 45 - 59 ≥ 60
ERO (cm2) <0.20 0.20-0.29 0.30-0.39 ≥ 0.40
Zoghbi WA, et al. J Am Soc Echocardiogr 2003; 16: 777
Vena Contracta
Width (cm) < 0.3 0.3 - 0.69 ≥ 0.7
MR Volume
(cm3/beat)<30 30 - 44 45 - 59 ≥ 60
ERO (cm2) <0.20 0.20-0.29 0.30-0.39 ≥ 0.40
Vena Contracta
Width (cm) < 0.3 0.3 - 0.69 ≥ 0.7
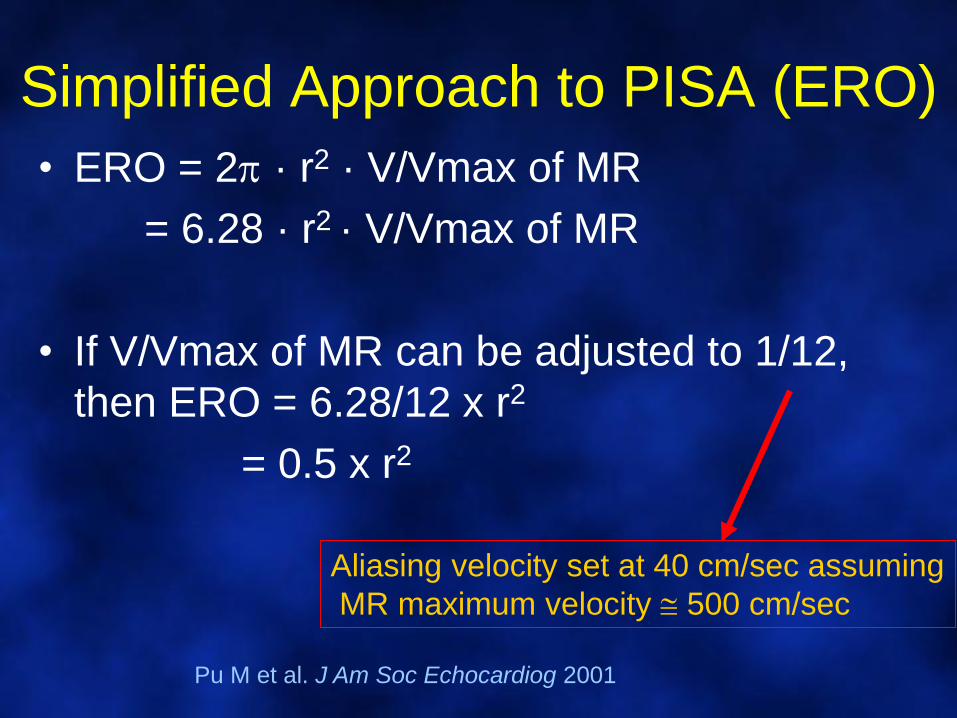
Simplified Approach to PISA (ERO)
• ERO = 2 · r2 · V/Vmax of MR
= 6.28 · r2 · V/Vmax of MR
• If V/Vmax of MR can be adjusted to 1/12,
then ERO = 6.28/12 x r2
= 0.5 x r2
Aliasing velocity set at 40 cm/sec assuming
MR maximum velocity 500 cm/sec
Pu M et al. J Am Soc Echocardiog 2001
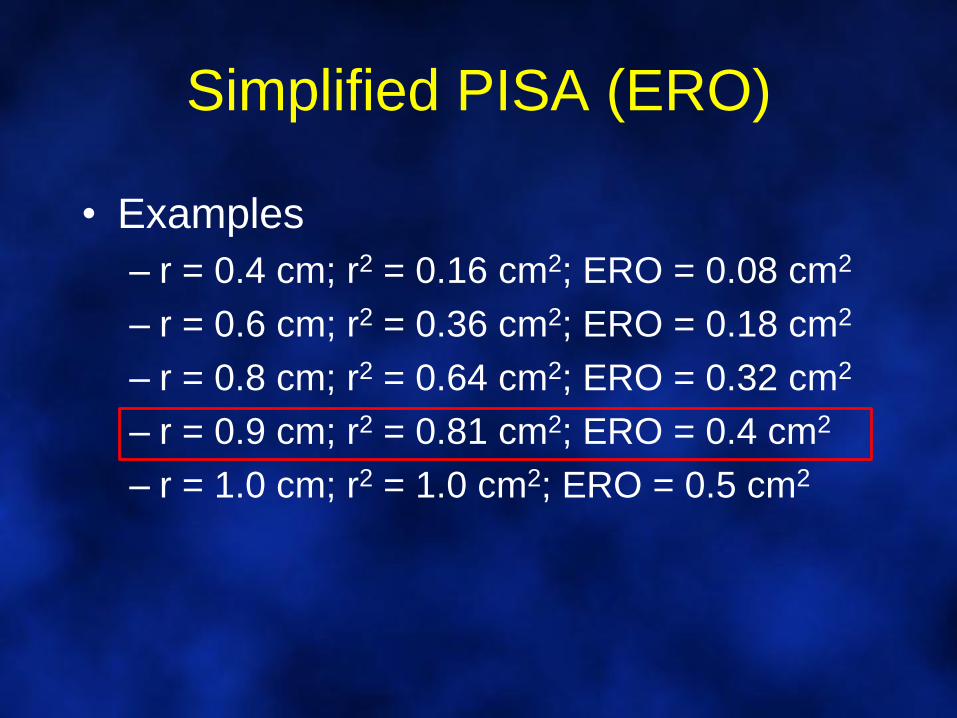
Simplified PISA (ERO)
• Examples
– r = 0.4 cm; r2 = 0.16 cm2; ERO = 0.08 cm2
– r = 0.6 cm; r2 = 0.36 cm2; ERO = 0.18 cm2
– r = 0.8 cm; r2 = 0.64 cm2; ERO = 0.32 cm2
– r = 0.9 cm; r2 = 0.81 cm2; ERO = 0.4 cm2
– r = 1.0 cm; r2 = 1.0 cm2; ERO = 0.5 cm2
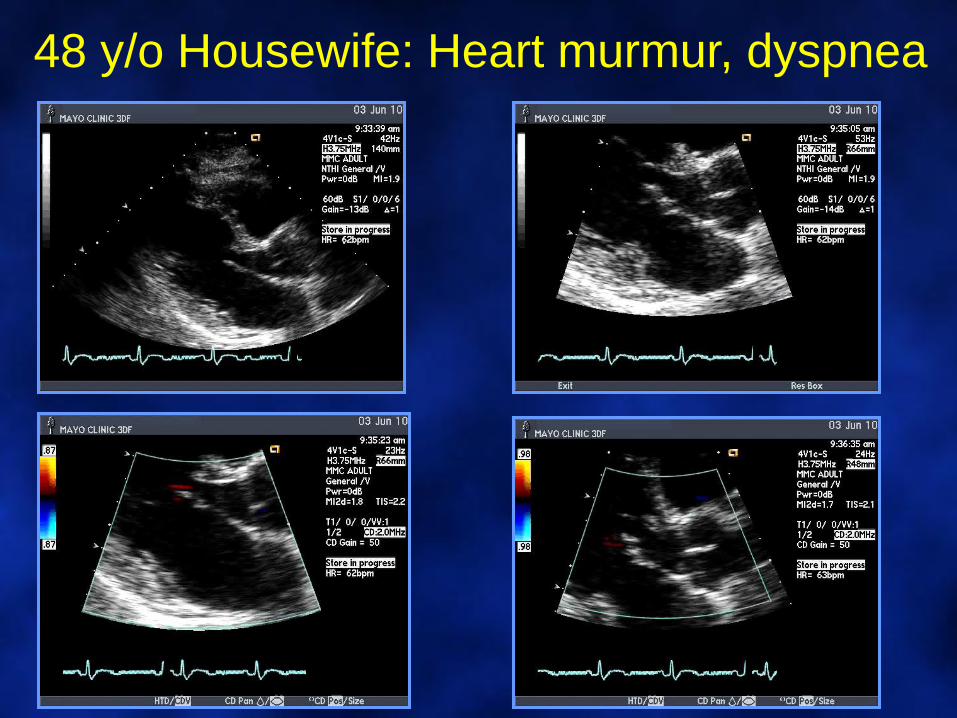
48 y/o Housewife: Heart murmur, dyspnea
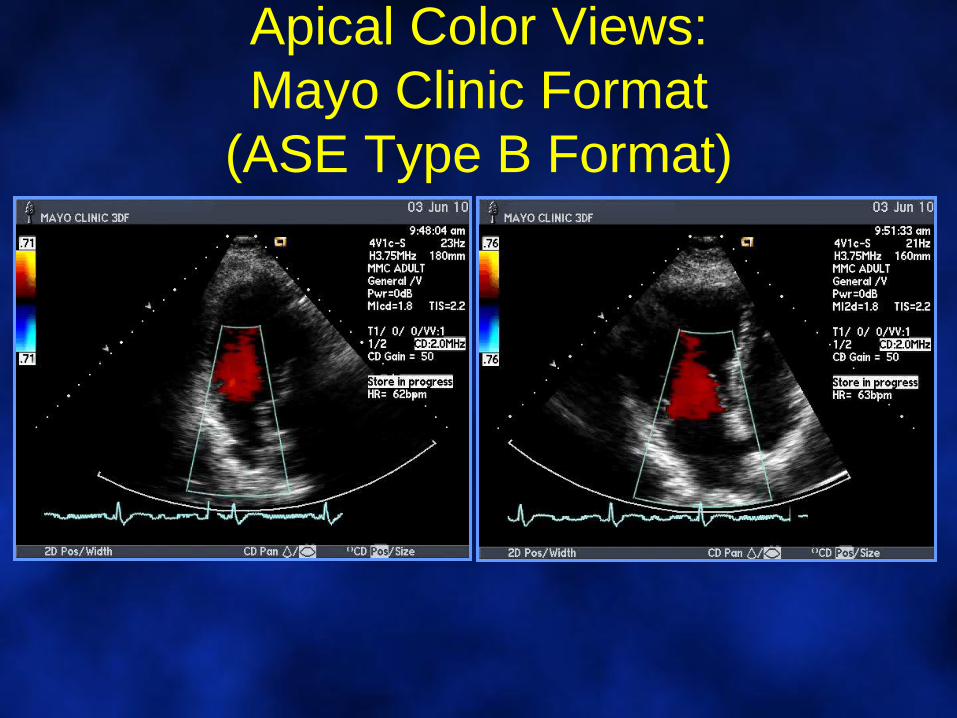
Apical Color Views:
Mayo Clinic Format
(ASE Type B Format)
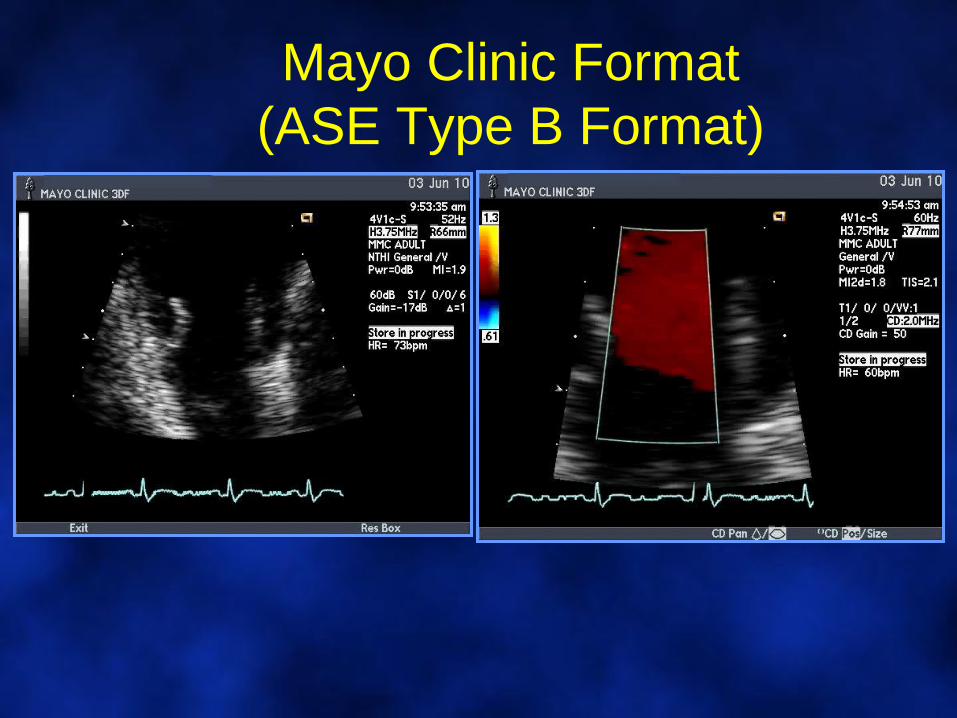
Mayo Clinic Format
(ASE Type B Format)
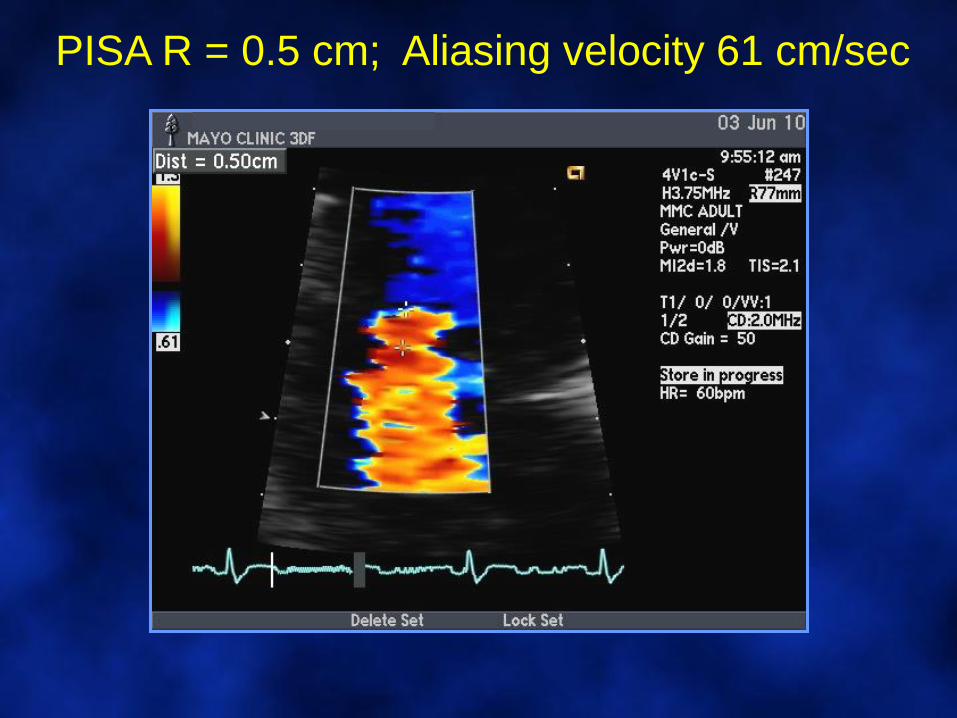
PISA R = 0.5 cm; Aliasing velocity 61 cm/sec
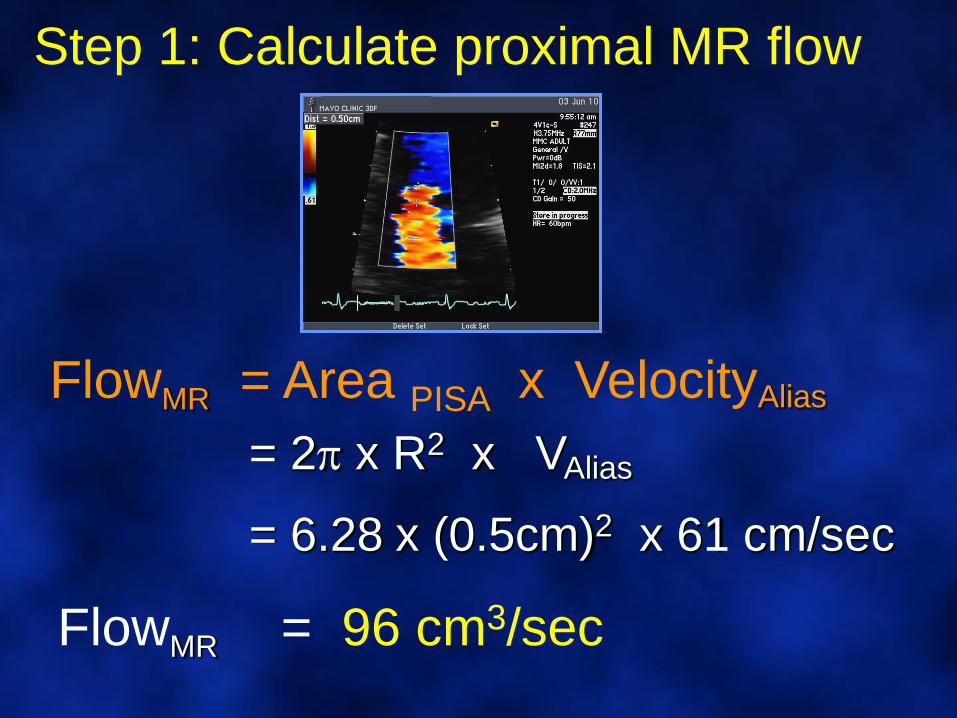
FlowMR = Area PISA x VelocityAlias
= 2 x R2 x VAlias
= 6.28 x (0.5cm)2 x 61 cm/sec
FlowMR = 96 cm3/sec
Step 1: Calculate proximal MR flow
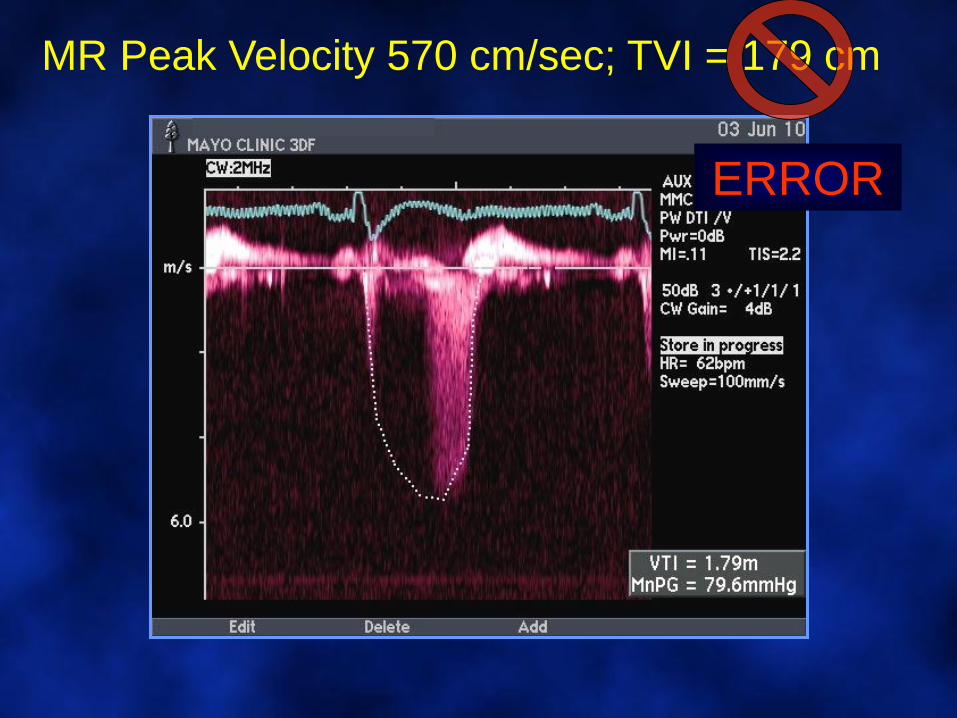
MR Peak Velocity 570 cm/sec; TVI = 179 cm
ERROR
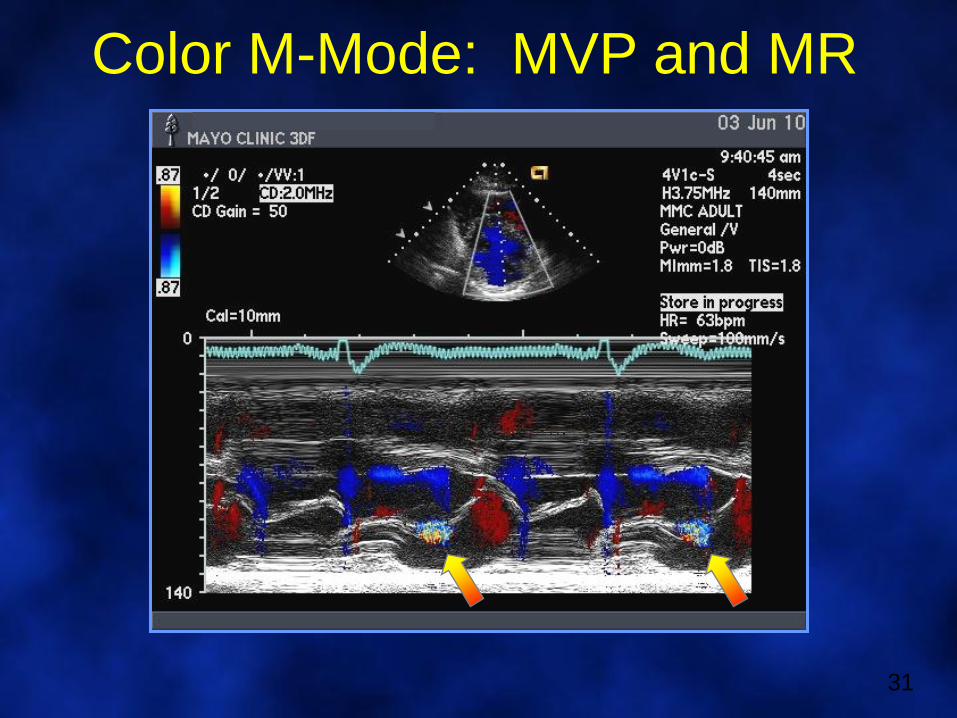
Color M-Mode: MVP and MR
31
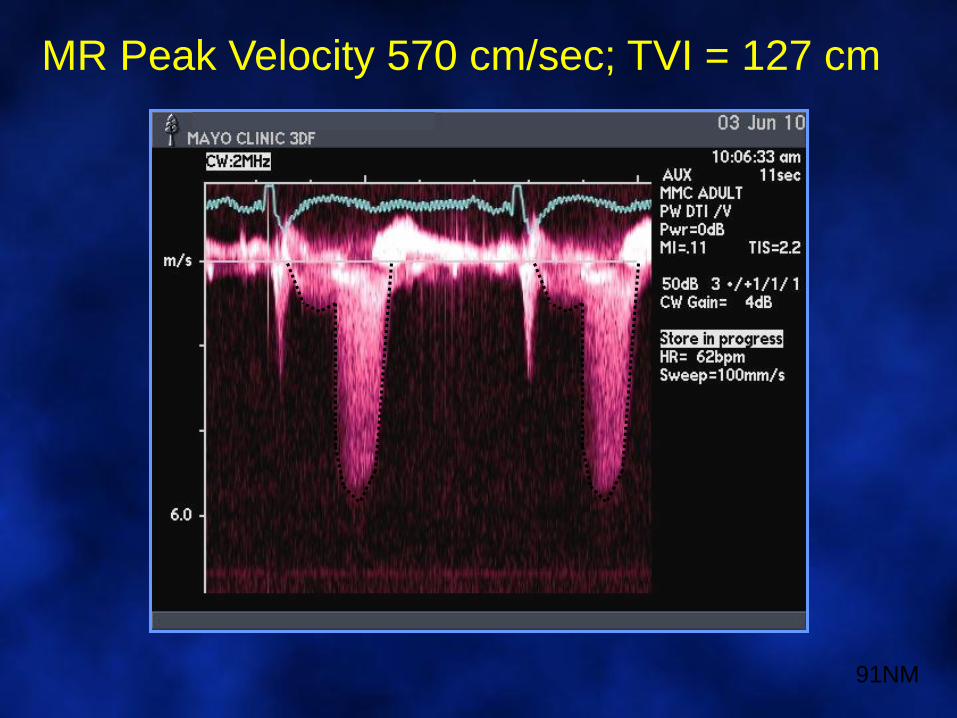
MR Peak Velocity 570 cm/sec; TVI = 127 cm
91NM
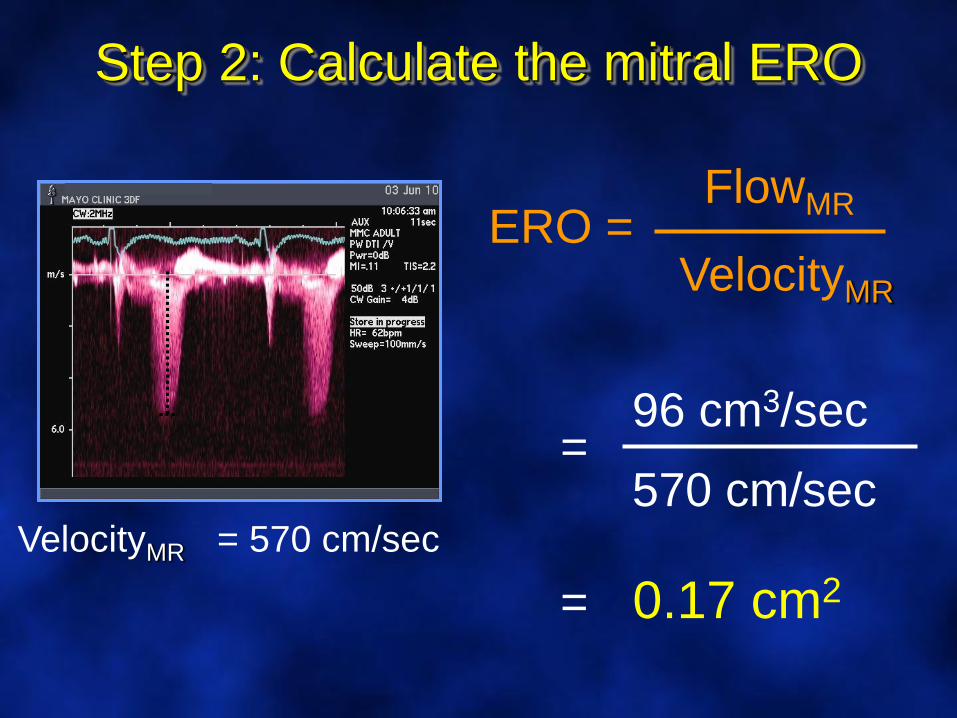
ERO =FlowMR
VelocityMR
Step 2: Calculate the mitral ERO
VelocityMR = 570 cm/sec
96 cm3/sec=
570 cm/sec
= 0.17 cm2
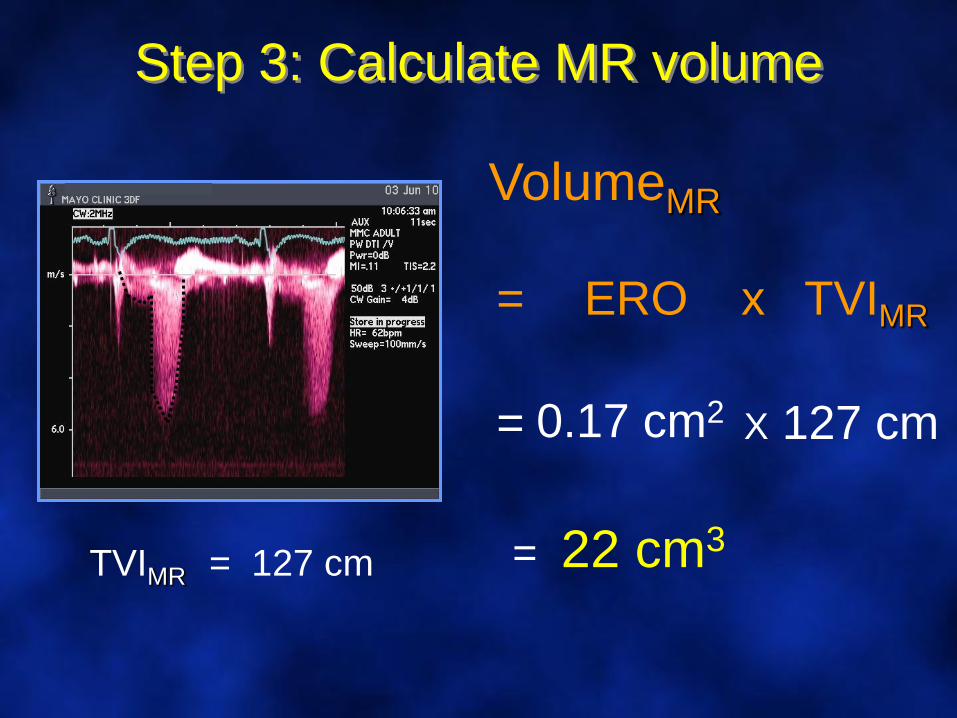
Step 3: Calculate MR volume
VolumeMR
ERO x TVIMR=
TVIMR = 127 cm
0.17 cm2 X 127 cm=
= 22 cm3
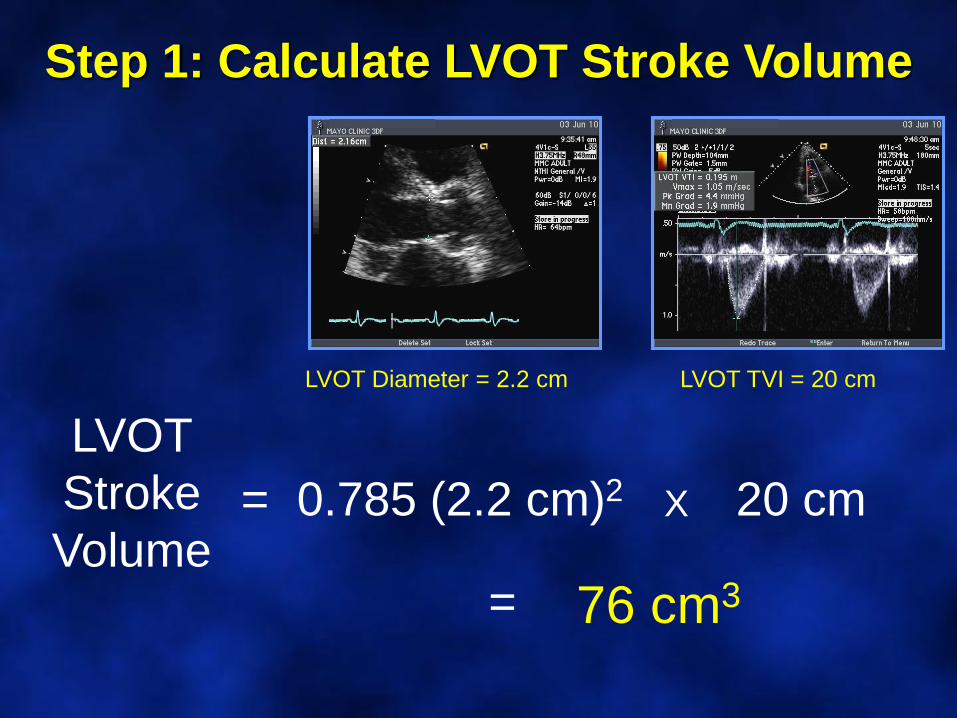
Step 1: Calculate LVOT Stroke Volume
LVOT
Stroke
Volume0.785 (2.2 cm)2 X 20 cm=
LVOT Diameter = 2.2 cm LVOT TVI = 20 cm
76 cm3=
Step 2: Calculate MV Stroke Volume
MV
Stroke
Volume0.785 (3.6 cm)2 X 10 cm=
102 cm3=
MV Annulus TVI = 10 cmMV Annulus = 3.6 cm
Step 3: Calculate MR Volume
MV Stroke
Volume
=
LVOT Stroke
Volume
MR
Volume
-
- = 26 cm3102 cm3 76 cm3
MV Stroke
Volume
=
LVOT Stroke
Volume
-
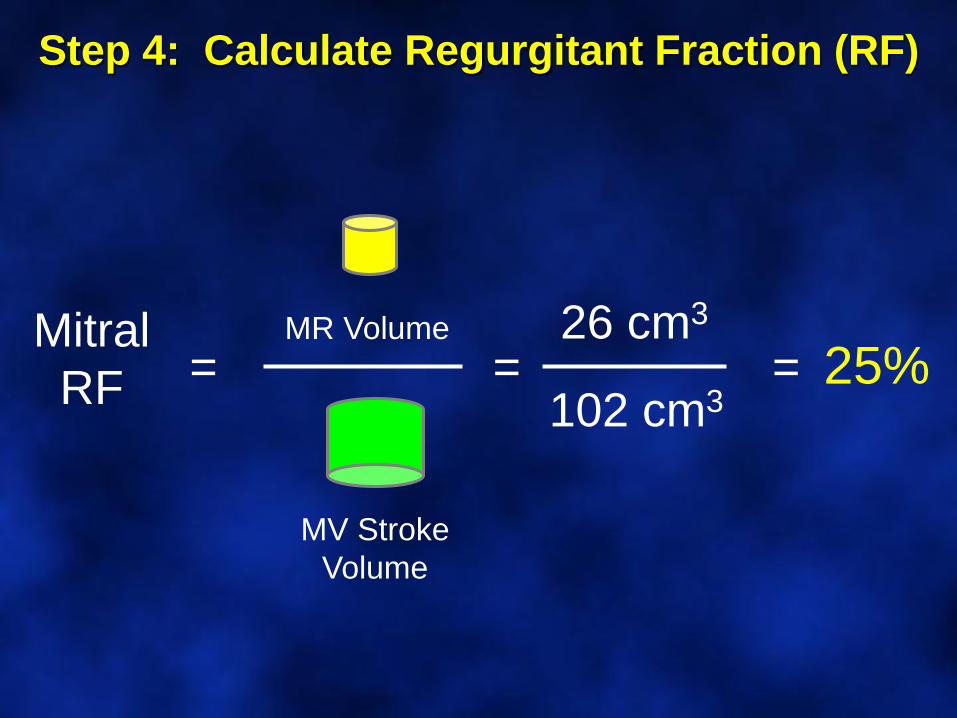
Mitral
RF =
MV Stroke
Volume
MR Volume
Step 4: Calculate Regurgitant Fraction (RF)
= =26 cm3
102 cm325%
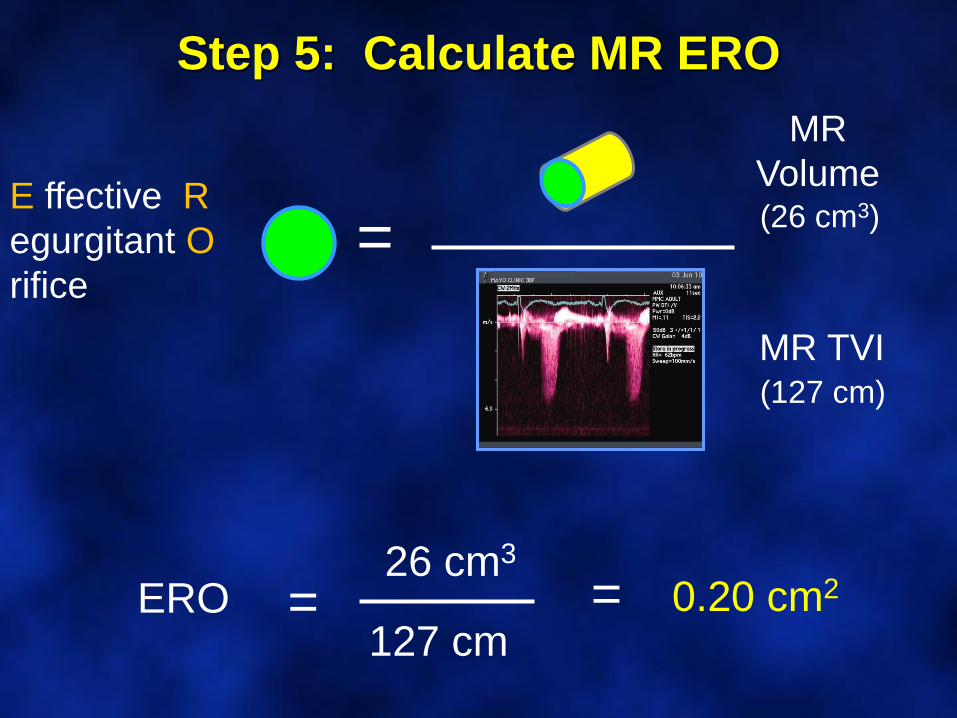
Step 5: Calculate MR ERO
MR
Volume
=E ffective R
egurgitant O
rifice
MR TVI
=ERO26 cm3
127 cm= 0.20 cm2
(127 cm)
(26 cm3)
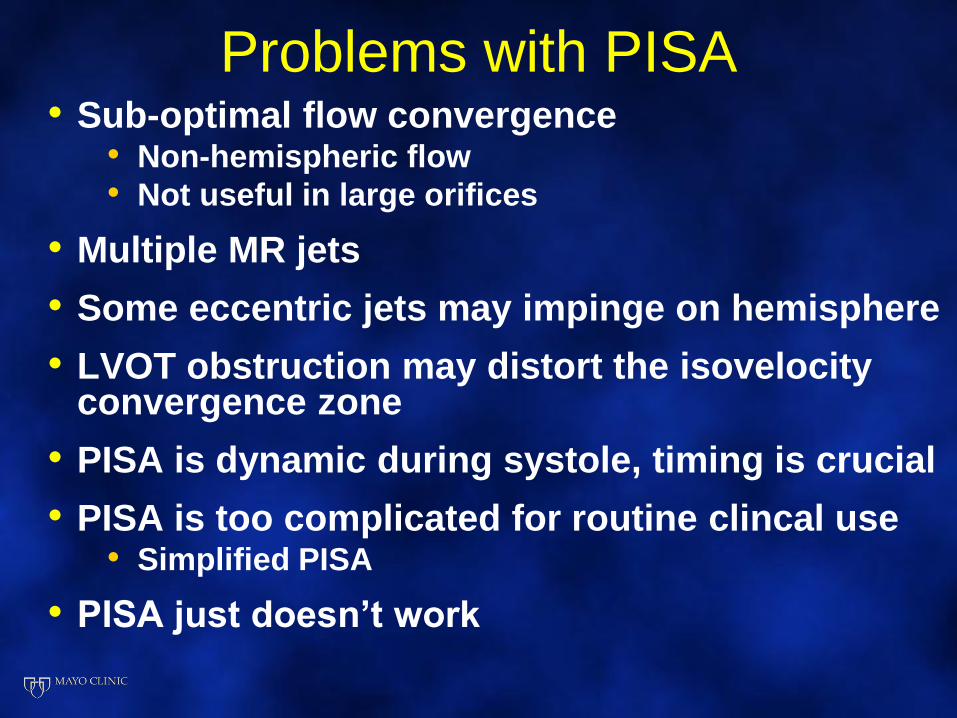
Problems with PISA• Sub-optimal flow convergence
• Non-hemispheric flow
• Not useful in large orifices
• Multiple MR jets
• Some eccentric jets may impinge on hemisphere
• LVOT obstruction may distort the isovelocityconvergence zone
• PISA is dynamic during systole, timing is crucial
• PISA is too complicated for routine clincal use• Simplified PISA
• PISA just doesn’t work
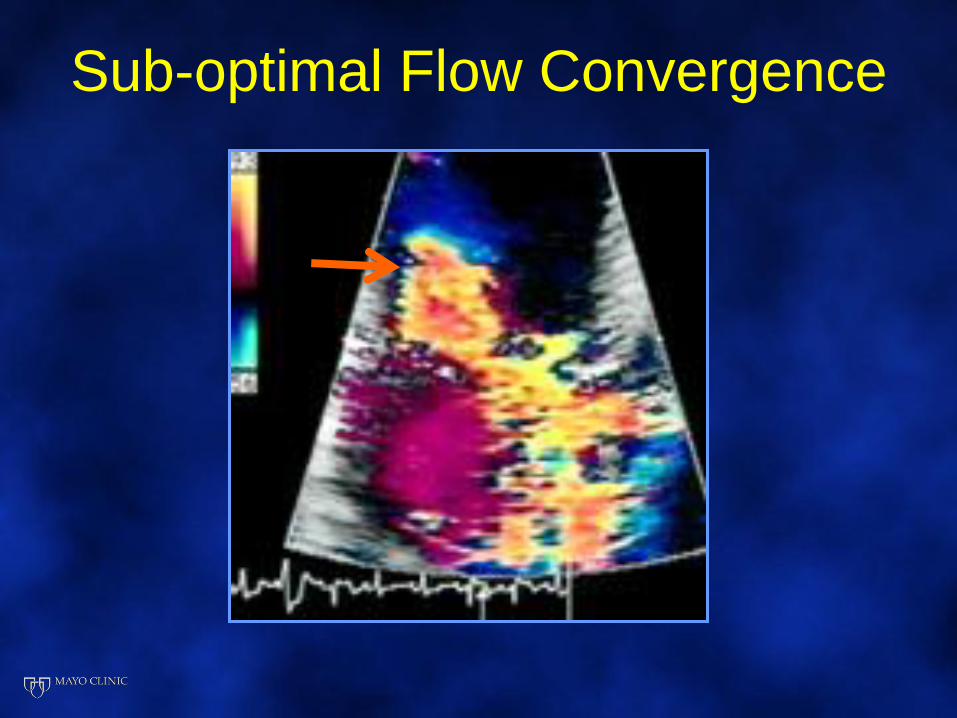
Sub-optimal Flow Convergence
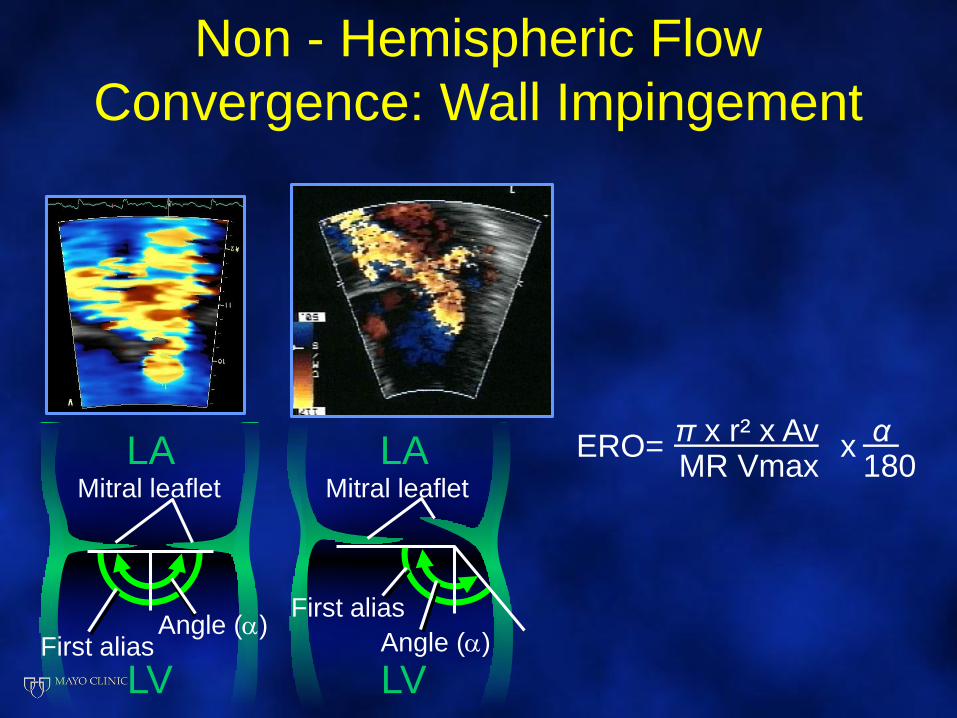
Non - Hemispheric Flow
Convergence: Wall Impingement
LAMitral leaflet
LV
LA
LV
Mitral leaflet
Angle ()First alias Angle ()
First alias
MR Vmax 180π x r² x Av α
ERO= x
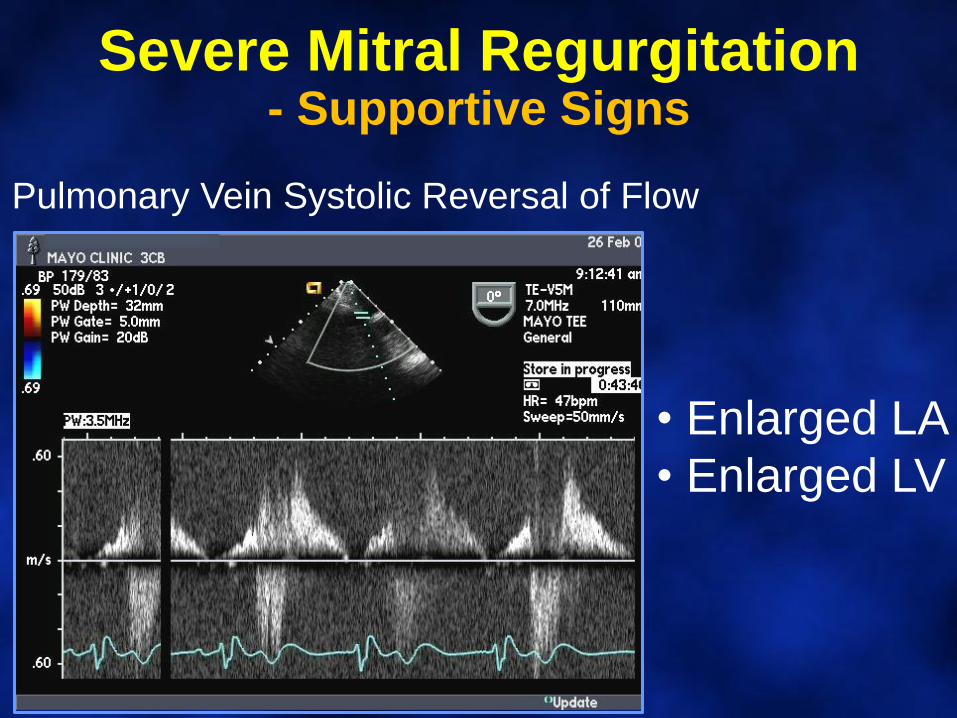
Severe Mitral Regurgitation- Supportive Signs
Pulmonary Vein Systolic Reversal of Flow
• Enlarged LA
• Enlarged LV
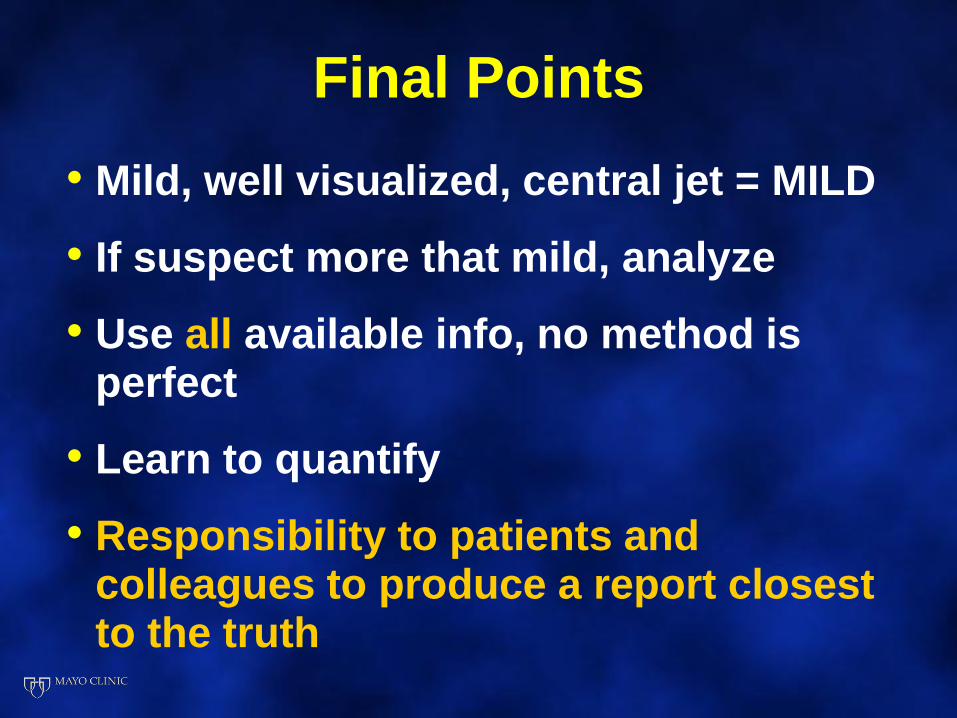
Final Points
• Mild, well visualized, central jet = MILD
• If suspect more that mild, analyze
• Use all available info, no method is perfect
• Learn to quantify
• Responsibility to patients and colleagues to produce a report closest to the truth

To dare is to lose one’s
footing momentarily,
not to dare
is to lose oneself
- Soren Kierkegaard

Post-Test Questions
What is the specific abnormality of the mitral
valve shown on this pre-operative TEE?
3D TEE
View from LA
“Surgeon’s View”
0 View
60 View

What is the specific mitral
valve abnormality?
1. Flail P2
2. Flail P1
3. Flail P3
4. Barlow’s Disease
5. Flail A3
Mitral Valve Anatomy:
View from the Left Atrium
P1P2
P3
A1 A2A3

41 y/o woman: Dyspnea on exertion

PISA Radius = 1.1 cm
Aliasing velocity 49 cm/sec
MR Peak Velocity 570 cm/sec
TVI = 161 cm
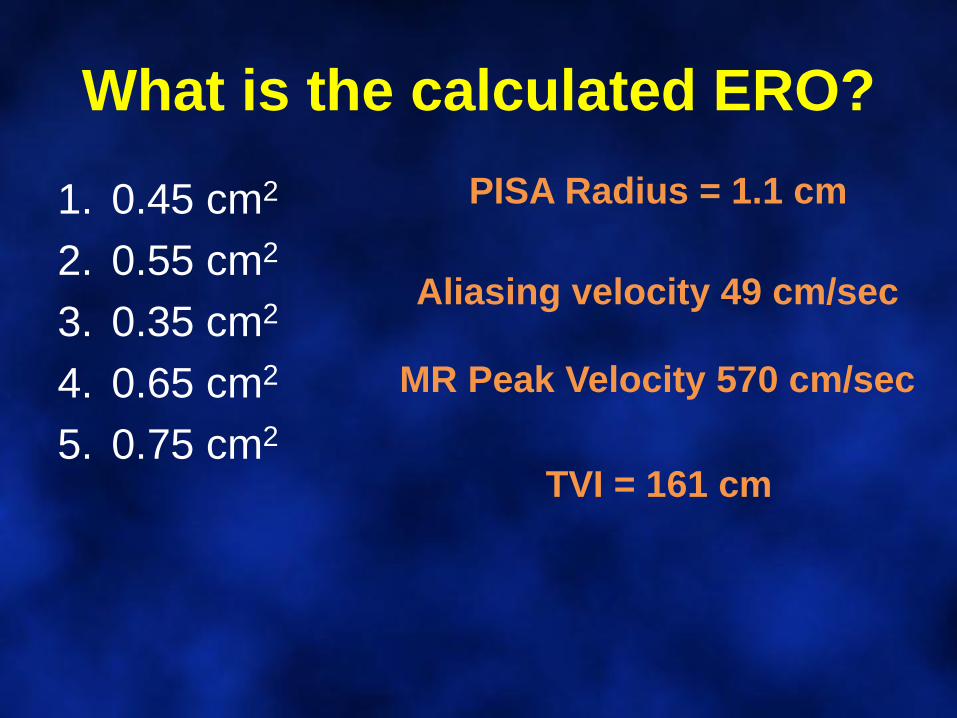
What is the calculated ERO?
1. 0.45 cm2
2. 0.55 cm2
3. 0.35 cm2
4. 0.65 cm2
5. 0.75 cm2
PISA Radius = 1.1 cm
Aliasing velocity 49 cm/sec
MR Peak Velocity 570 cm/sec
TVI = 161 cm
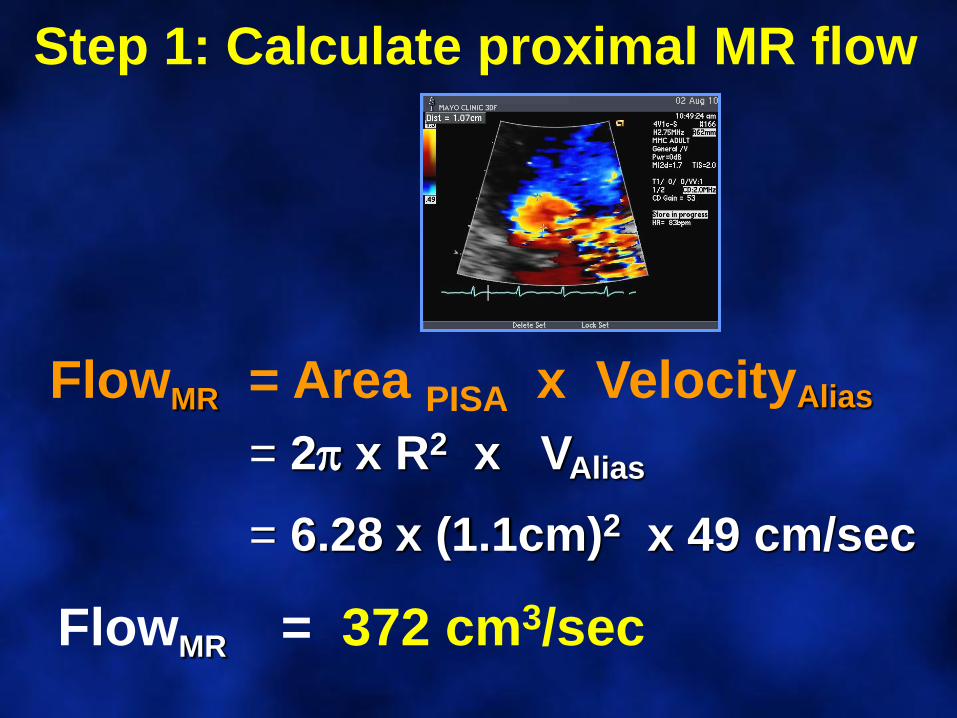
FlowMR = Area PISA x VelocityAlias
= 2 x R2 x VAlias
= 6.28 x (1.1cm)2 x 49 cm/sec
FlowMR = 372 cm3/sec
Step 1: Calculate proximal MR flow
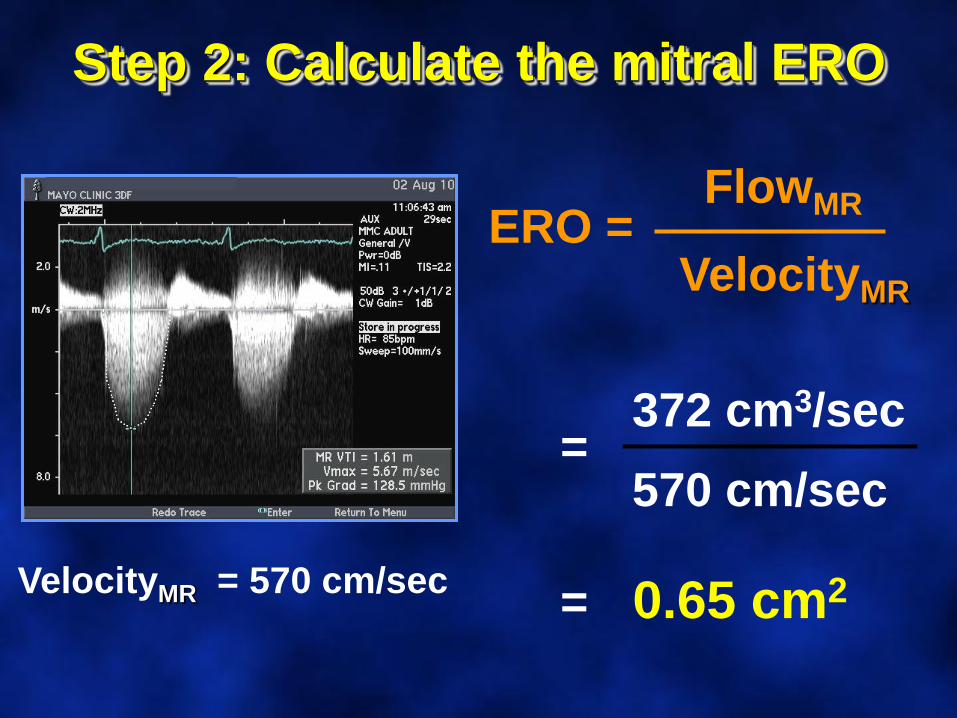
ERO =FlowMR
VelocityMR
Step 2: Calculate the mitral ERO
VelocityMR = 570 cm/sec
372 cm3/sec=
570 cm/sec
= 0.65 cm2

Thank [email protected]