Embed Size (px)
Citation preview

1
ANAN-8000DLE Test Report
By Adam Farson VA7OJ/AB4OJ Iss. 3, August 5, 2017.
Figure 1: Apache Labs ANAN-8000DLE SDR Transceiver.
Introduction: This test report presents results of an RF lab test suite performed on an
Apache Labs ANAN-8000DLE 200W direct-sampling/DUC SDR transceiver loaned by
Apache Labs.
The Orion Mk II receiver/exciter board in this DUT uses the Crystek CVHD-950 TCXO.
No noise-floor degradation with dither enabled was observed in the ANAN-8000DLE.
Software versions: Iss. 1: PowerSDR OpenHPSDR mRX PS v3.4.2
Firmware versions: Iss. 1: Orion MkII v1.6 (Protocol 1)
Performance Tests conducted in my home RF lab, July 5-31, 2017.
A. Receiver 1 (RX1) Tests
Note: Frequency and level calibration (10.000 MHz, -70 dBm) performed at start.
1: MDS (Minimum Discernible Signal) is a measure of ultimate receiver sensitivity. In
this test, MDS is defined as the RF input power which yields a 3 dB increase in the
receiver noise floor, as measured on the S-meter.
Test Conditions: ATT as shown, NR off, NB off, ANF off, AGC Fixd, AGC Gain = 120,
RX1 Meter: Sig, Avg., Dither off, Random off. Table 1: MDS
1 in dBm (RX1).
3.6 MHz 14.1 MHz 28.1 MHz 50.1 MHz
ATT dB SSB 2.4kHz CW 500Hz SSB 2.4kHz CW 500Hz SSB 2.4kHz CW 500Hz SSB 2.4kHz CW 500Hz
0 -126 -133 -126 -133 -126 -134 -135 -142
-20 -106 -113 -105 -113 -106 -113 -120 -127
Notes: 1. Dither and/or Random do not affect MDS. 2. Bypassing Alex preselector does not affect MDS 3. ADC clip level: -5 dBm

2
2: Reciprocal Mixing Noise occurs in a direct-sampling SDR receiver when phase noise
generated within the ADC mixes with strong signals close in frequency to the wanted
signal, producing unwanted noise products at the IF and degrading the receiver
sensitivity. Reciprocal mixing noise in a direct-sampler is an indicator of the ADC
clock’s spectral purity.
In this test, a Wenzel 5 MHz OCXO with low phase noise is connected via a 7 dB pad
and a 0-110 dB step attenuator to the DUT (ANT). The noise floor is read on the DUT S-
meter in CW mode (500 Hz) with ANT terminated in 50Ω. The input power Pi increased
to raise detected noise by 3 dB. Reciprocal mixing dynamic range (RMDR) = Pi – MDS.
Note: The residual phase noise of the OCXO is the limiting factor in measurement
accuracy.
Test Conditions: 5.000 MHz, 250 Hz CW, ATT 0 dB, NR off, ANF off, NB off, negative
offset. AGC Fxd, AGC Gain 120. Dither off, Random off. BH-4 receive filter window,
sample rate 192K, buffer size 1024, filter size 4096. RMDR in dB = input power (Pi) –
MDS (both in dBm). Here, MDS = -136 dBm (B = 250 Hz). RMDR = Pi - MDS.
Phase noise = -(RMDR + 10 log B). Table 2: RMDR & Phase Noise.
Offset kHz Pi dBm RMDR dB PN dBc/Hz
0.5 -27 108 -132
1 -22 113 -137
2 -19 116 -140
3 -17 118 -142
5 -15 120 -144
10 -13 122 -146
20 -10 125 -149
30 -8 127 -151
50 -6 129 -153
Figure 2: RMDR at 1 kHz offset.
3: Channel filter shape factor (-6/-60 dB). This is the ratio of the -60 dB bandwidth to
the -6 dB bandwidth, which is a figure of merit for the filter’s adjacent-channel’s
rejection. The lower the shape factor, the “tighter” the filter.
In this test, an in-channel RF test signal from the Wenzel OCXO is applied at -50 dBm.
The bandwidths at -6 and -60 dB relative to the input power are determined by tuning the
receiver across the signal and observing the S-meter.

3
Test Conditions: 5000 kHz nominal, SSB/CW modes, ATT = 0 dB, AGC med, NR off,
NB off, ANF off, Dither off, Random off. BH-4 filter window. Audio tab: Sample rate
192K, buffer size 1024, filter type Linear Phase. Note: Switching to BH-7 window or
Low Latency does not affect results. Table 3: Channel Filter Shape Factors.
DSP Filter Size 2048 DSP Filter Size 16348
Filter Shape Factor 6 dB BW kHz Shape Factor 6 dB BW kHz
2.4 kHz SSB 1.06 2.40 1.01 2.40
500 Hz CW 1.29 0.50 1.04 0.50
250 Hz CW 1.58 0.25 1.08 0.25
5 kHz AM 1.03 5.0
3a: Ultimate channel filter attenuation. This test is conducted with the Wenzel OCXO
as in 3. above. A test signal is applied at a power level of -26 dBm, and the receiver is
detuned until the S-meter drops no further. The final S-meter reading and the frequency
offset are recorded. Note: The channel filters actually have deeper stopbands than
measured.
Test Conditions: Test signal 5000 kHz at -26 dBm, SSB/CW modes, ATT = 0 dB, AGC
med, NR off, NB off, ANF off. BH-4, sample rate 192K, filter size 2048. Switching to
BH-7 window does not affect results.
Test Results: 2.4 kHz SSB: S-meter minimum = -117 dBm at 1.65 kHz offset.
Ultimate attenuation = -26 - (-117) = 91 dB.
Bandwidth for ultimate attenuation = 2 * 1.5 ≈ 3.3 kHz.
500 Hz CW: S-meter minimum = -123 dBm at 550 Hz offset.
Ultimate attenuation = -26 - (-123) = 97 dB.
Bandwidth for ultimate attenuation = 2 * 0.55 ≈ 1.1 kHz.
4: NR noise reduction, measured as SINAD. This test is intended to measure noise
reduction on SSB signals close to the noise level.
A distortion test set or SINAD meter is connected to the DUT audio output. The test
signal is offset 1 kHz from the receive frequency to produce a test tone, and RF input
power is adjusted for a 6 dB SINAD reading (-122 dBm). NR is then turned on, and
SINAD read at various NR settings.
Test Conditions: 14.100 MHz, 2.4 kHz USB, BH-4 RX filter, sampling rate 192K, buffer
size 1024, filter size 2048, filter type Linear Phase, AGC Med, ATT = 0 dB, NB off,
ANF off, NR/ANF Pre-AGC (in DSP Options), Dither off, Random off. Initial NR
settings (defaults): Taps 64, Delay 16, Gain 100, Leak 100. (Varying Delay does not
significantly affect SINAD readings.) Table 4: NR SINAD.
Taps Delay SINAD dB
NR off 16 6
64 16 13
128 32 18
256 16 24
512 16 30
1024 16 35

4
This shows an SINAD improvement of 29 dB max. with NR at maximum for an SSB
signal roughly 4 dB above the noise floor. This is an approximate measurement, as the
amount of noise reduction is dependent on the original signal-to-noise ratio.
In on-air listening, NR was very effective in reducing band noise (as long as the desired
signal was audible), and did not distort received audio.
5: Auto-Notch Filter (ANF) stopband attenuation. In this test, an RF signal is applied at
a level ≈ 70 dB above MDS. The test signal is offset 1 kHz from the receive frequency to
produce a test tone. ANF is activated and the test signal level is adjusted to raise the
audio output 3 dB above noise floor. The stopband attenuation is equal to the difference
between test signal power and MDS.
Test Conditions: 14.100 MHz, 2.4 kHz USB, sampling rate 192K, BH-4 RX filter, buffer
size 1024, AGC med, ATT = 0 dB, NB off, ANF off, Dither off, Random off. Initial
ANF settings (defaults): Taps 64, Delay 16, Gain 100, Leak 100. AGC Med, Gain 120
(max).
Test Results: Measured MDS = -126 dBm per Test 1. Pi = -56 dBm.
NR/ANF Post-AGC: Stopband attenuation = Pi - MDS = -46 - (-126) = 70 dB. Tone
completely suppressed.
NR/ANF Pre-AGC: Tone partly suppressed. Audible artifacts in RX audio output (raspy
hum and low-level tone) as depicted in Figure 3.
Figure 3: Spectrum and waveform of RX audio with ANF (Pre-AGC).

5
6: Multi-Notch Filter (MNF) Test. Since v3.3.6, PowerSDR OpenHPSDR incorporates a
new Multi-Notch Filter (MNF) tool, which allows the user to specify up to 1024 notches
(bandstop filters). These notches are specified by absolute RF frequency and width; they
will be invoked as needed when they overlap the detection passband. This feature is
useful for suppressing interference which consistently appears on specific frequencies.
To avoid phase distortion, the notches are implemented with linear phase. They introduce
no additional processing delay, nor do they consume any additional CPU cycles once the
receiver is on frequency and the notches are set up. This is all accomplished by simply
"cutting" the notches into the existing bandpass, filters rather than adding additional
filters. (Description courtesy Doug Wigley W5WC.)
To test MNF, it is convenient to generate an FM test signal whose modulating frequency
fm and peak deviation Δf are chosen to yield a specific number of sideband pairs. The
receiver is then set to USB and tuned to the carrier frequency of the test signal. The first
notch is set at the carrier frequency fc , and subsequent notches are set at fc + nfm where n
is the order of the sideband pair. The number of configured notches equals the number of
sideband pairs. With the receiver in USB, only the upper sidebands will appear in the
detection channel, as illustrated in Figures 5 & 6.
When MNF is inactive, a loud composite tone will be heard in the headphones and the S-
meter will indicate the average power of the FM carrier and sidebands. With MNF on, S-
meter reading and the audio output should fall to the receiver noise floor.
Test Conditions: 14.100 MHz, 2.4 kHz USB, ATT 0 dB, NR off, ANF off, NB off, AGC
Med, AGC Gain 120. Dither off, Random off. BH-4 receive filter window, sample rate
192K, buffer size 1024; filter type Linear Phase. S-meter reads Sig Avg. DUT and signal
generator clocked from 10 MHz GPS-derived lab standard. Frequency calibration
performed on DUT prior to starting test. MNF set up for 21 notches at 100 Hz intervals
from 14100.0 (#0) to 14102.0 (#20). See Figure 28.
Test signal: fc = 14100 kHz. fm = 100 Hz. Δf = 1.2kHz. These settings yield 20 usable
sideband pairs at 100 Hz intervals. The upper sidebands fall within the 2.4 kHz SSB
bandwidth.
Figure 4: MNF Setup Tab.

6
Test Results: The test results are shown in Figures 5 and 6 below.
Figure 5: MNF off, 21 notches at 100 Hz intervals. Composite tone in RX audio.
Figure 6: MNF on, 21 notches at 100 Hz intervals. RX audio at noise floor.

7
7: AGC impulse response. The purpose of this test is to determine the Anan-8000DLE's
AGC response in the presence of fast-rising impulsive RF events. Pulse trains with short
rise times are applied to the receiver input.
Test Conditions: 3.6 MHz, 2.4 kHz LSB, sampling rate 192K, BH-4 RX filter, buffer
size 1024, NR on, NB off/on as required, ANF off, ATT= 0 dB, AGC Fast, ANF off,
MNF off, NR/ANF Pre- and Post-AGC (in DSP Options), Dither off, Random off. A
pulse generator is connected to ANT1 via a step attenuator.
The pulse rise time (to 70% of peak amplitude) is 10 ns. Pulse duration t is varied from
20 to 95 ns. In all cases, pulse period is 600 ms. The step attenuator is set at 36 dB.
Pulse amplitude is 16Vpk (e.m.f.)
With NR and noise blankers off, each pulse triggers the AGC, creating a "hole" in the
background noise for the duration of the AGC hang time. There is no audible "tick" at the
leading edge of the pulse for 20 ns ≤ t ≤ 1.25 µs. This is an improvement over earlier
versions of PowerSDR OpenHPSDR mRX, where ticks were always audible in this state.
The pulses create lines on the waterfall. With NR and NB off, the S-meter flicks up to S7
at t = 20 ns and S9 at t = 95 ns.
With NR/ANF Pre-AGC, activating NR suppresses background noise; the effect is to
render "ticks" audible. With NR/ANF Post-AGC and t < 100 ns, NR reduces the ticks to
quiet “holes” in the receiver audio.
With NR2 on, Pre-AGC, a crushing (crunch) sound is heard for each pulse. NR2 (Post-
AGC) reduces the crunch to a quiet "hole" for each pulse..
NB or NB2 suppresses the audible effects of the pulses entirely, whether NR/ANF is Pre-
or Post-AGC. The S-meter, spectrum scope and waterfall responses are suppressed.
7a: SNB (Spectral Noise Blanker). With NR off, SNB changes quiet “holes” to
“thumps”. SNB + NR muffles the "thumps". SNB + NR2 produces “clanking” sounds
(Pre-AGC) or "thumps" (Post-AGC). Unlike NB, SNB does not suppress scope, waterfall
or S-meter reaction to the pulses.
A simulation test was performed by playing the SM5BSZ agctest-96.wav file into the
receiver (Ref. 5). The simulation exercised AGC response to impulses, but not NB. Only
NR + Post-AGC suppressed the audible response almost completely, as well as reducing
the noise level in the audio output. NR + Pre-AGC was far less effective.
8: S-meter tracking: This is a quick check of S-meter signal level tracking.
Test Conditions: 500 Hz CW, ATT = 0 dB, sampling rate 192K, BH-4 RX filter, buffer
size 1024, AGC Med., ANF off, Dither off, Random off. RX1 Meter: Sig Avg. Level
calibration (14.100 MHz, -70 dBm) is performed before starting the test. Next, starting at
-120 dBm, the test signal power is increased and the level corresponding to each S-meter
reading is noted.

8
Table 5: S-Meter Tracking.
Pi dBm -120 -110 -100 -90 -80 -73 -60 -50 -40 -30 -20 -10 -5
Rdg.dBm -119 -109 -99 -89 -79 -72 -59 -49 -39 -29 -19 -9 CLIP
S-meter >S1 S3 <S5 >S6 S8 >S9 S9+13 S9+21 S9+33 S9+41 S9+52 S9+61
Table 6: S-Meter/ATT Tracking
Pi dBm -73
ATT dB 0 10 20 30 31
Rdg. dBm -72 -72 -72 -72 -72 S-meter >S9 >S9 >S9 >S9 >S9
9: Two-Tone IMD3 (IFSS, Interference-Free Signal Strength) tested in CW mode (500
Hz), ATT = 0 dB, AGC Med. Test frequencies: f1 = 14100 kHz, f2 = 14102 kHz. IMD3
products: 14098/14104 kHz. IMD3 product level was measured as absolute power in a
500 Hz detection bandwidth at various test-signal power levels and Dither/Random
combinations, with 0 dB ATT selected. The ITU-R P-372.1 band noise levels for typical
urban and rural environments are shown as datum lines. The S-meter is set at Sig Avg.
Figure 7: RX1 IFSS (2-tone IMD3) vs. test signal level.
Notes on 2-tone IMD3 test: This is a new data presentation format in which the
amplitude relationship of the actual IMD3 products to typical band-noise levels is shown,
rather than the more traditional DR3 (3rd
-order IMD dynamic range) or SFDR (spurious-
free dynamic range). The reason for this is that for an ADC, SFDR referred to input
power rises with increasing input level, reaching a well-defined peak (“sweet spot”) and
then falling off. In a conventional receiver, SFDR falls with increasing input power.
If the IMD3 products fall below the band-noise level at the operating site, they will
generally not interfere with desired signals.

9
The SFDR behavior of an ADC invalidates the traditional DR3 test for a direct-sampling
SDR receiver. Our goal here is to find an approach to SFDR testing which holds equally
for SDR and legacy receiver architecture. See Reference 4.
Figure 8: RX1 2-tone IMD3 spectrum display, Pi = -25 dBm/tone, dither & random on.
10: Two-Tone 2nd
-Order Dynamic Range (DR2).The purpose of this test is to determine
the range of signals far removed from an amateur band which the receiver can tolerate
while essentially generating no spurious responses within the amateur band.
In this test, two widely-separated signals of equal amplitude Pi are injected into the
receiver input. If the signal frequencies are f1 and f2, the 2nd
-order intermodulation
product appears at (f1 + f2). The test signals are chosen such that (f1 + f2) falls within an
amateur band.
The two test signals are combined in a passive hybrid combiner and applied to the
receiver input via a step attenuator. The receiver is tuned to the IMD product (f1 + f2 )
which appears as a 600 Hz tone in the speaker. The per-signal input power level Pi is
adjusted to raise the noise floor by 3 dB, i.e. IMD product at MDS. The Pi value is then
recorded. DR2 = Pi - MDS.
Test Conditions: f1 = 6.1 MHz, f2 = 8.1 MHz, IMD2 product at 14.2 MHz. 500 Hz CW,
AGC slow, ATT = 0 dB, NR off, NB off, CW neutral, ANF off, Alex preselector in or
out as required. DR2 in dB. Measured MDS = -133 dBm (dither & random on). RX S-
meter: Sig Avg.
Table 7: RX1 DR2. f1: 6.1 MHz. f2: 8.1 MHz. IMD product: 14.2 MHz.
Preselector out in
Dither & Random MDS dBm Pi dBm DR2 dBm Pi dBm DR2 dBm
off -133
-74 59 -39 94
on -72 61 -26 107
It will be observed that when the 20m Alex preselector is switched in, it suppresses the f1
and f2 signals. This virtually eliminates the 2nd-order IMD product. Any residual IMD is
further reduced by dither and random, which are much more effective when the
interfering signals are lower down the IFSS curve.

10
11: Noise Power Ratio (NPR): An NPR test is performed, using the test methodology
described in detail in Ref. 2. The noise-loading source used for this test is a noise
generator fitted with bandstop (BSF) and band-limiting filters (BLF) for the test
frequencies utilized.
The noise loading PTOT is applied to ANT1 and increased until ADC clipping just
commences, and then backed off until no clipping is observed for at least 10 seconds.
NPR is then read off the spectrum scope by observation. (NPR is the ratio of noise power
in a channel outside the notch to noise power at the bottom of the notch.)
Test Conditions: Receiver tuned to bandstop filter center freq. f0 ± 1.5 kHz, 2.4 kHz
SSB, ATT = 0/20 dB, NR off, NB off, Notch off, ANF off, AGC Med, Alex on. Display
Averaging: Log Recursive (default). Test results are presented in Table 8.
Table 8: RX1 NPR Test Results
2
BSF kHz BLF kHz BWR dB Alex PTOT dBm NPR dB
1 Theor. NPR3
ATT 0 dB 20 dB 0 dB 20 dB
1940 60…2044 29.2 0 -18 -4 71 65
80 1 -9 +3 78 68
3886 60…4100 32.3 0 -17 +1 73 70
76.9 1 -15 -4 71 60
5340 60…5600 33.6 0 -17 -1 70 68
75.6 1 -15 -4 71 60
7600 316…8160 35.1 0 -17 +3 70 67
74.1 1 -11 0 70 63
11700 0…13000 37.6 0 -16 +4 64 65
71.6 1 -13 +5 65 60
Notes on NPR test:
1. NPR readings were stable over time.
2. Enabling Dither and/or Random did not affect NPR results.
3. Theoretical NPR was calculated for the LTC2208-16 ADC using the method
outlined in Ref. 3. The theoretical NPR value assumes that BRF is not limited by
any filtering in the DUT ahead of the ADC, and that the net gain between the
antenna port and the ADC is 0 dB.

11
Figure 4: NPR spectrum scope display, RX1, 5340 kHz.
B. Receiver 2 (RX2) Tests
12: MDS (Minimum Discernible Signal) is a measure of ultimate receiver sensitivity. In
this test, MDS is defined as the RF input power which yields a 3 dB increase in the
receiver noise floor, as measured at the audio output.
Test Conditions: ATT as shown, NR off, NB off, ANF off, AGC Fxd, threshold AGC
gain 120, Dither off, Random off. Table 9: MDS
1 in dBm (RX2).
3.6 MHz 14.1 MHz 28.1 MHz 50.1 MHz
ATT dB SSB 2.4kHz CW 500Hz SSB 2.4kHz CW 500Hz SSB 2.4kHz CW 500Hz SSB 2.4kHz CW 500Hz
0 -126 -133 -126 -132 -126 -132 -137 -144
20 -105 -112 -105 -112 -106 -112 -121 -129
Notes: 1. Dither and/or Random do not affect MDS. .
13: RX1/RX2 Crosstalk. In this test, RX1 and RX2 are set to the same frequency, mode
and bandwidth. A test signal of amplitude Pi is applied to the RX1 input, and the RX2
input is terminated in 50Ω. The value of Pi required to increase the RX2 audio output by
3 dB is recorded. The test is then repeated with the RX1 input terminated in 50Ω and the
test signal applied to the RX2 input. The receiver to which the test signal applied is
muted.
Test Conditions: RX1 and RX2 set to 500 Hz CW and tuned to f0. ATT = 0 dB, NR off,
NB off, AGC: RX1: Med, Gain = 120. RX2: Fixd, Gain = 120. Repeat: AGC: RX1: Fixd,
Gain = 120. RX2: Med, Gain = 120.
Table 10: RX1/RX2 Crosstalk.
f0 MHz Test signal to Pi dBm for +3 dB output Output from
50.1 RX1 -93 RX2
RX2 -87 RX1
1.9 RX1 -71 RX2
RX2 -84 RX1
14: Noise Power Ratio (NPR): An NPR test is performed, using the test methodology
described in detail in Ref. 1. The noise-loading source used for this test is a noise
generator fitted with bandstop (BSF) and band-limiting filters (BLF) for the test
frequencies utilized.

12
The noise loading PTOT is applied to RX2 and increased until ADC clipping just
commences, and then backed off until no clipping is observed for at least 10 seconds.
NPR is then read off the spectrum scope by observation. (NPR is the ratio of noise power
in a channel outside the notch to noise power at the bottom of the notch.)
Test Conditions: Receiver tuned to bandstop filter center freq. f0 ± 1.5 kHz, 2.4 kHz
SSB, ATT = 0 dB, NR off, NB off, Notch off, ANF off, AGC slow, Alex on. Test results
are presented in Table 11. Table 11: RX2 NPR Test Results
2
BSF kHz BLF kHz BWR dB Alex PTOT dBm NPR dB
1 Theor. NPR3
ATT 0 dB 20 dB 0 dB 20 dB
1940 60…2044 29.2 0 -18 -1 71 68
80 1 -8 -1 79 66
3886 60…4100 32.3 0 -17 -2 70 68
76.9 1 -14 -4 70 60
5340 60…5600 33.6 0 -18 +2 70 67
75.6 1 -14 -8 70 60
7600 316…8160 35.1 0 -17 -1 69 67
74.1 1 -11 +1 70 61
11700 0…13000 37.6 0 -17 +3 66 63
71.6 1 -11 +1 66 60
Notes on NPR test:
1. NPR readings were stable over time.
2. Enabling Dither and/or Random did not affect NPR results.
3. Theoretical NPR was calculated for the LTC2208-16 ADC using the method
outlined in Ref. 3. The theoretical NPR value assumes that BRF is not limited by
any filtering in the DUT ahead of the ADC, and that the net gain between the
antenna port and the ADC is 0 dB.

13
15: Two-Tone IMD3 (IFSS, Interference-Free Signal Strength): Refer to Test 9 (above)
for Test Description and Notes.
Figure 5: RX2 IFSS (2-tone IMD3) vs. test signal level.
16. Two-Tone 2nd
-Order Dynamic Range (DR2). Refer to Test 10 (above) for Test
Description.
Test Conditions: f1 = 6.1 MHz, f2 = 8.1 MHz, IMD2 product at 14.2 MHz. 500 Hz CW,
AGC slow, ATT = 0 dB, NR off, NB off, CW neutral, ANF off. DR2 in dB. Measured
MDS = -132 dBm (dither & random on).
Table 12: RX2 DR2. f1: 6.1 MHz. f2: 8.1 MHz.
Preselector out1 in
Dither & Random MDS dBm Pi dBm DR2 dBm Pi dBm DR2 dBm
off -132
-31 101 -38 94
on -30 102 -28 104
Notes: 1. The modest decrease in DR2 wth preselector out may be an IMD "sweet spot".
14
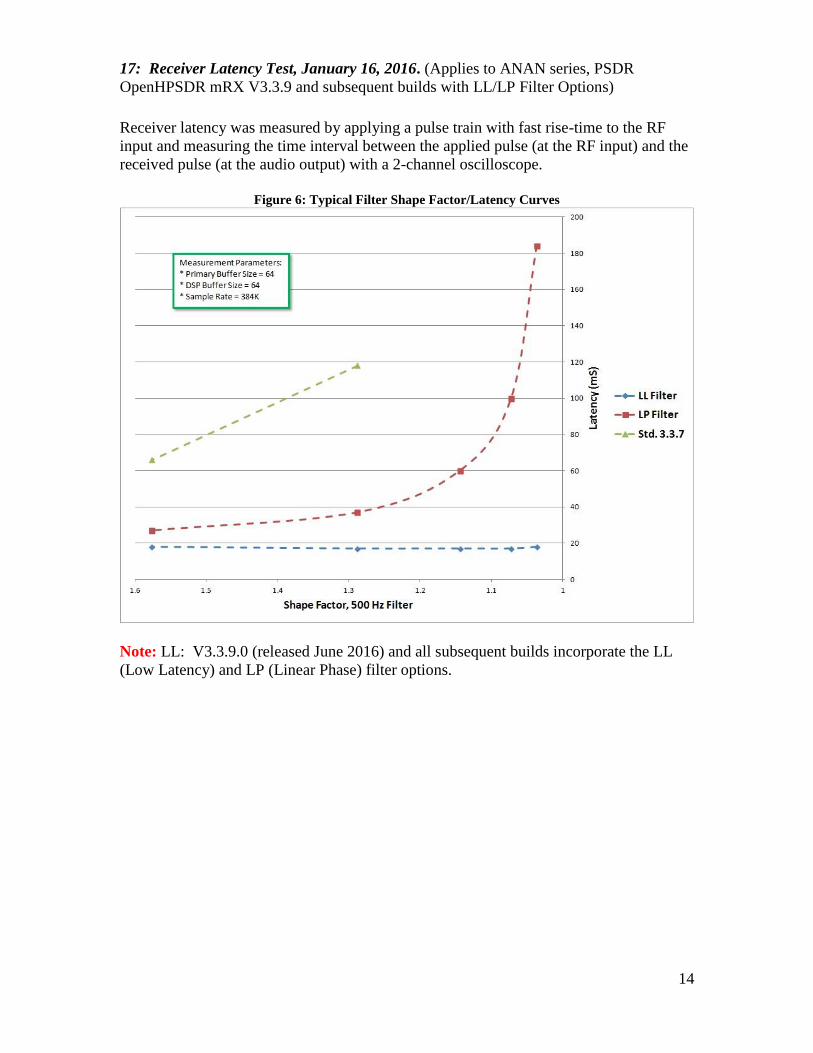
17: Receiver Latency Test, January 16, 2016. (Applies to ANAN series, PSDR
OpenHPSDR mRX V3.3.9 and subsequent builds with LL/LP Filter Options)
Receiver latency was measured by applying a pulse train with fast rise-time to the RF
input and measuring the time interval between the applied pulse (at the RF input) and the
received pulse (at the audio output) with a 2-channel oscilloscope.
Figure 6: Typical Filter Shape Factor/Latency Curves
Note: LL: V3.3.9.0 (released June 2016) and all subsequent builds incorporate the LL
(Low Latency) and LP (Linear Phase) filter options.

15
C. Transmitter Tests
Maximum temperatures: Internal, 47°C. Case, 33°C.
BH-4 TX Filter Window selected for all transmitter tests.
18: CW Power Output. In this test, the RF power output into a 50Ω load is measured at
3.6, 14.1, 28.1, 29.6 and 50.1 MHz in RTTY mode, at a primary DC supply voltage of
+13.8V. A clamp-on ammeter is used to measure DC input current. A thermocouple-type
power sensor and meter are connected to the ANT1 socket via a 50 dB power attenuator.
PA Gain is adjusted on all bands before starting the test.
Test Conditions: 3.6, 14.1, 28.1, 29.6 and 50.1 MHz, 150W nominal. Set Tune Pwr to
100%, or check Use Drive Power and set Drive to 100%.. Adjust PA Gain and Wattmeter
settings as required for nominal PO and correct Fwd Pwr readings. Table 13: CW Power Output.
Freq. MHz Input Current A Fwd Pwr W Meas. PO W
3.6 26.8 200 201
7.1 31.5 200 200
14.1 31.1 200 200
21.1 30.9 200 200
28.1 35.1 200 200
50.11 35.6 150 150 Notes: 1. Po de-rated to 150W due to PSU current foldback.
18: SSB Peak Envelope Power (PEP). Here, an oscilloscope is terminated in 50 and
connected to TX OUT via a 60 dB power attenuator. The scope vertical cursors are
adjusted for 200W CW.
Test Conditions: 14.1 MHz, USB mode, dynamic mic connected, Drive 100%, Mic Gain
27 dB (COMP off), 33 dB (COMP on), compression 6 dB, Transmit Filter 200-3100
(default), supply voltage +13.8V. Leveler settings (default): Max. gain 5 dB, Decay 0.5s.
Speak loudly into the microphone for full-scale ALC reading. Figures 7 & 8 show the
envelope for 200W PEP, without and with compression respectively. Figures 9 & 10
illustrate the effect of CESSB (controlled-envelope SSB) with 10 dB compression. Note:
With MON on, mic/monitor latency ≈ 200 ms.
19: SSB ALC overshoot: A test was conducted in which white noise was applied from
the internal noise generator, and the RF envelope observed on an oscilloscope terminated
in 50and connected to the DUT RF output via a 60 dB power attenuator.
Test Conditions: 14100 kHz USB, compression 20dB. Test signal: white noise. Transmit
Filter 200-3100 (default). Supply voltage +13.8V. Transmit Equalizer +15 dB (all 3
ranges), Preamp max. Test/Noise level +13 dB.
Test Results: No sign of ALC overshoot at 200W PEP. See Figure 11.

16
Figure 7: 200W PEP speech envelope, no compression.
Figure 8: 200W PEP speech envelope, 6 dB compression.

17
Figure 9: 200W speech envelope, 10dB compression, CESSB off.
Figure 10: 200W speech envelope, 10dB compression, CESSB on.

18
Figure 11: 200W white noise test (±3 vert. div. = 200W PEP).
20: ALC Compression Check. In this test, a 2-tone test signal is applied to the USB port
from the internal 2-tone generator. An oscilloscope is connected to the DUT RF output
via a 60 dB power attenuator. RF Power is initially adjusted for 200W CW output.
Test Conditions: 14100 kHz USB, compression off. Test signal: 2-tone. Transmit Filter
200-3100 (default). Test tones: 700 and 1700 Hz, at equal amplitudes. Supply voltage
+13.8V.
Test Result: No flat-topping of the 2-tone envelope was observed (see Figure 12.)

19
Figure 12: 2-tone envelope, 200W PEP.
20a: Subjective TX audio test: In this test, a headset is plugged into the microphone and
headphone jacks and a transmitted SSB signal is monitored with MON active.
Test Procedure:
a. Set COMP to 6 dB.
b. Adjust Mic Gain for no ALC COMP on TX Meter with CESSB off.
c. Set TX EQ off. .
d. Transmit alternately with COMP off and on. Observe that COMP gives monitored
TX audio more audible “punch” and penetrating power.
Test Results: With Mic Gain = 16 dB, CESSB off, COMP on yields audible improvement
in audio "punch",
21: Transmitter 2-tone IMD Test. In this test, a 2-tone test signal is applied from the
internal tone generator. A spectrum analyzer is connected to the DUT RF output via a 50
dB power attenuator. RF Power is initially adjusted for rated CW output on each band in
turn. (Due to lab power supply limitations, it was found necessary to de-rate to 100W on
50 MHz.)
Test Conditions: 3.6, 14.1 and 50.1 MHz USB, compression off. Test signal: 2-tone.
Transmit Filter 200-3100 (default). Test tones: 700 and 1700 Hz, at equal amplitudes.
Supply voltage +13.8V. The -10 dBm reference level RL equates to 200W CW output (=
0 dBc).
20
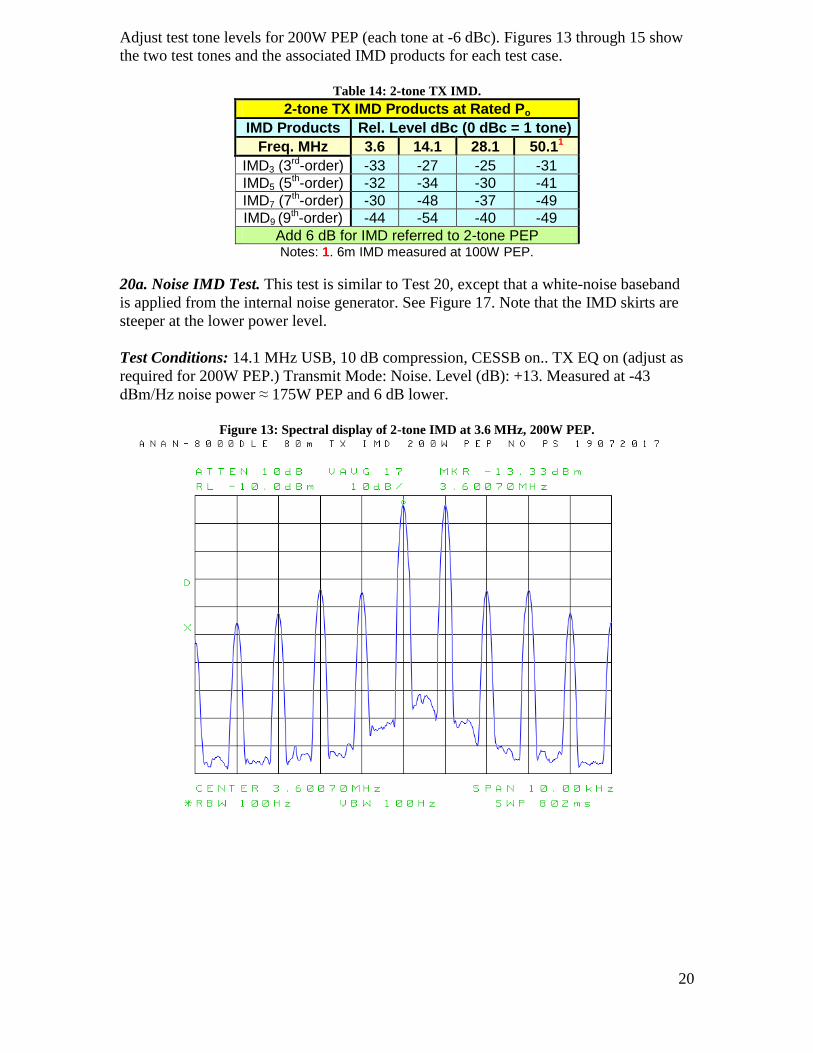
Adjust test tone levels for 200W PEP (each tone at -6 dBc). Figures 13 through 15 show
the two test tones and the associated IMD products for each test case.
Table 14: 2-tone TX IMD.
2-tone TX IMD Products at Rated Po
IMD Products Rel. Level dBc (0 dBc = 1 tone)
Freq. MHz 3.6 14.1 28.1 50.11
IMD3 (3rd-order) -33 -27 -25 -31
IMD5 (5th-order) -32 -34 -30 -41
IMD7 (7th-order) -30 -48 -37 -49
IMD9 (9th-order) -44 -54 -40 -49
Add 6 dB for IMD referred to 2-tone PEP Notes: 1. 6m IMD measured at 100W PEP.
20a. Noise IMD Test. This test is similar to Test 20, except that a white-noise baseband
is applied from the internal noise generator. See Figure 17. Note that the IMD skirts are
steeper at the lower power level.
Test Conditions: 14.1 MHz USB, 10 dB compression, CESSB on.. TX EQ on (adjust as
required for 200W PEP.) Transmit Mode: Noise. Level (dB): +13. Measured at -43
dBm/Hz noise power ≈ 175W PEP and 6 dB lower.
Figure 13: Spectral display of 2-tone IMD at 3.6 MHz, 200W PEP.

21
Figure 14: Spectral display of 2-tone IMD at 14.1 MHz, 200W
PEP.
Figure 15: Spectral display of 2-tone IMD at 28.1 MHz, 200W PEP.

22
Figure 16: Spectral display of 2-tone IMD at 50.1 MHz, 100W PEP.
Figure 17: Noise modulation, showing IMD skirts.

23
21: AM sidebands and THD with single-tone modulation. As in Test 20 above, the
spectrum analyzer is connected to the DUT RF output via a 20 dB 25W attenuator. On
the GUI, RF Power is adjusted for 50W resting carrier. A 1 kHz test tone is applied from
the internal tone generator. The spectrum analyzer records the carrier and sideband
parameters.
Test Conditions: 14100 kHz AM, 50W carrier output, Transmit Mode: Tone, Level: -15
dB. Adjust test tone level for -7 dBc test tone level (90% modulation.) Figure 18 shows
the carrier and sideband levels. Calculated THD ≈ 3%.
Figure 18: AM Sidebands for 90% Modulation.
22: Transmitter harmonics & spectral purity. Once again, the spectrum analyzer is
connected to the DUT RF output via a 60 dB power attenuator. RF Power is adjusted for
200W CW output on each band in turn. RL = -10 dBm equates to 200W. The spectrum
analyzer's harmonics capture utility is started.
Test Conditions: 3.6, 14.1 and 50.1 MHz, TUNE mode, 200W to 50Ω load. Harmonic
data is presented for all frequencies tested (Figures 19 through 21), and a spur sweep
from 1 – 68 MHz in Figure 22. It will be seen that harmonics are well within
specifications. Non-harmonic spurs are within the -60 dBc limit specified in FCC Part
97.307(e). In addition, a spur sweep in the range 14090-14190 kHz shows that the Orion
MkII C326 capacitor upgrade has greatly reduced the transmitted spurs at ±48 kHz offset.
See Figure 23.

24
Figure 18.
Figure 19.
25
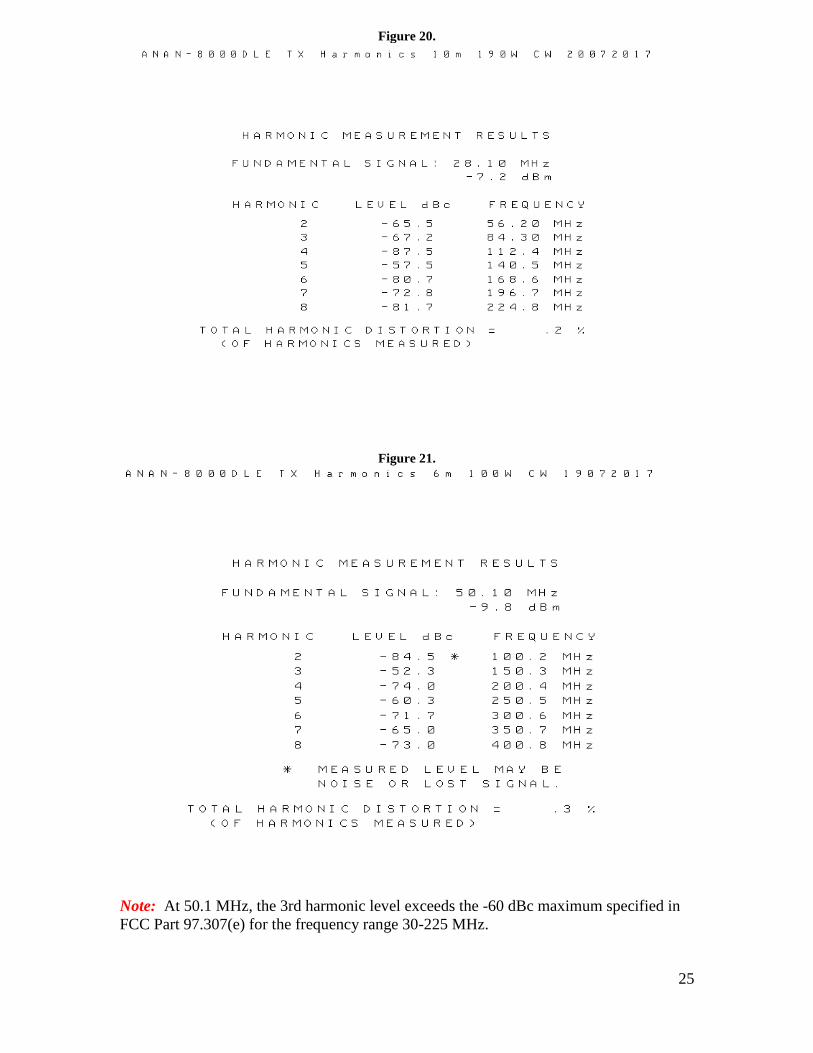
Figure 20.
Figure 21.
Note: At 50.1 MHz, the 3rd harmonic level exceeds the -60 dBc maximum specified in
FCC Part 97.307(e) for the frequency range 30-225 MHz.

26
Figure 22.
Figure 23. Spurs to +90 kHz offset. Note spur at +48 kHz.

27
23: Transmitted composite noise. A Perseus SDR receiver is connected to the DUT RF
output via a 60 dB power attenuator. Figure 23 is the resulting plot.
Test Conditions: 3.6, 14.1 and 28.1 MHz, TUNE mode, 100W output.
Figure 23: TX composite noise at 3.6, 14.1 & 28.1 MHz, 100W, measured on Perseus RX.
23: Spectral display of CW keying sidebands. The spectrum analyzer is connected to the
DUT RF output via a 60 dB RF power attenuator. The -5 dBm reference level equates to
100W. A series of dits is transmitted at 60 wpm.
Test Conditions: 14.1 MHz CW, 100W output. Keying speed 60 wpm using internal
keyer. CW key-down & key-up delays 2 ms. Spectrum analyzer RBW is 10 Hz, video-
averaged; sweep time < 2 sec. Figure 24 shows the transmitter output ±2.5 kHz from the
carrier.

28
Figure 24: Keying sidebands at 60 wpm, Weight = 50%, 14.1 MHz, 100W.
24. CW keying envelope. The oscilloscope is terminated in 50 and connected to the
DUT RF output via a 60 dB 2RF power attenuator. A series of dits is transmitted from the
internal keyer at 60 wpm.
Test Conditions: 14.1MHz CW, 100W output. Keying speed = 60 wpm using internal
keyer. CW key-down & key-up delays 2 ms*. The keying envelope is shown in Figure
25.
* Delays ≥ 25 ms will cause distortion of the keying envelope (uneven dit timing).

29
Figure 25: Keying envelope at 60 wpm
25: PureSignal Adaptive-Predistortion Linearization Test.
Test Setup: PS FEEDBACK-PS INPUT jumper in place on DUT rear panel (default).
PowerSDR Configuration:
1. On Setup, General, Hardware Config tab, uncheck as follows:
2. On PureSignal 2.0/Advanced form, check Auto Attenuate:
Test Conditions: 14.1 and 50.1 MHz USB, compression off. Test signal: 2-tone.
Transmit Filter 200-3100 (default). Test tones: 700 and 1700 Hz, at equal amplitudes.
Supply voltage +13.8V. The -7 dBm reference level RL on spectrum analyzer equates to
200W CW output on 14.1 MHz (0 dBc). PS-A off (initially), then on.
At 50.1 MHz, set reference level to -10 dBm = 100W CW output (0 dBc).

30
Test Procedure:
To start PureSignal, click on Linearity on the menu bar at the top of the main
console. The PureSignal form (Figure 26) will open. If desired, click “Information” to
open a PureSignal user guide.
1. On Setup, Tests tab, set up Two-Tone Test as follows:
2. Click Start and adjust RF Power for 200W PEP (-6 dBc per tone) on spectrum
analyzer. Click Start again to stop transmitting.
3. Now return to PureSignal form and click Two-tone. Non-linearized 2-tone
spectrum will be displayed. Store or capture screen image on spectrum analyzer.
4. Next, turn PS-A on and verify green Correcting indicator.
5. The linearized 2-tone spectrum will be displayed. Store or capture screen image
on spectrum analyzer. (See Figure 25).
6. Click AmpView to display phase/gain transfer curve screen. (See Figure 24).
7. Click Two-Tone again to stop 2-tone test. Do not click OFF.
8. Re-run AM sidebands/THD test (see Test 21) with PureSignal on. Record test
data from spectrum analyzer. (See Figure 29). Calculate THD.

31
Figure 25: PureSignal (Linearity) Advanced form.
Figure 26: AmpView screen for 200W 2-tone test, PureSignal on.
PureSignal Test Results:

32
Figure 27: 2-tone TX IMD at 14.1 MHz, 200W PEP, PureSignal (PS) off & on.
Figure 28: 2-tone TX IMD at 50.1 MHz, 100W PEP, PureSignal (PS) off & on.

33
Figure 29: AM Sidebands for 90% Modulation, PureSignal on. THD ≈ 0.25%.
26. References:
1. Apache Labs website: https://apache-labs.com/
2. “Noise Power Ratio (NPR) Testing of HF Receivers”
http://www.ab4oj.com/test/docs/npr_test.pdf
3. “Theoretical maximum NPR of a 16-bit ADC”
http://www.ab4oj.com/test/docs/16bit_npr.pdf
4. “HF Receiver Testing: Issues & Advances”
http://www.nsarc.ca/hf/rcvrtest.pdf
5. "A New Look at SDR Testing"
http://www.ab4oj.com/sdr/sdrtest2.pdf
6. “Testing AGC in receivers” by SM5BSZ
http://www.sm5bsz.com/lir/agctest/agctest.htm
7. Quick Start Guide for the OpenHPSDR mRX PS CFC Audio Tools
http://tinyurl.com/cfcdoc
27. Acknowledgements: I would like to thank Abhi Arunoday of Apache Labs, Warren
Pratt NR0V and Doug Wigley W5WC for making this ANAN-800DLE available to me for
testing and evaluation. Thanks are also due to Warren, Doug and Abhi for their invaluable
guidance in configuring the radio and activating PureSignal.
Adam Farson, VA7OJ/AB4OJ e-mail: [email protected]
http://www.ab4oj.com/
Iss. 2, July 29, 2017.
Copyright © 2015-2017 A. Farson VA7OJ/AB4OJ. All rights reserved.
34
Appendix 1: CFC Audio Tools Test
The purpose of this test is to verify the effect of CFC tailoring on transmitted voice audio.
A dynamic microphone is connected to the ANAN-8000DLE, a custom CFC profile is
created and the transmitted RF envelope waveforms of an SSB signal with CFC
alternately disabled and enabled are displayed and captured on a digital oscilloscope
connected to ANT1 via a 60 dB RF power attenuator.
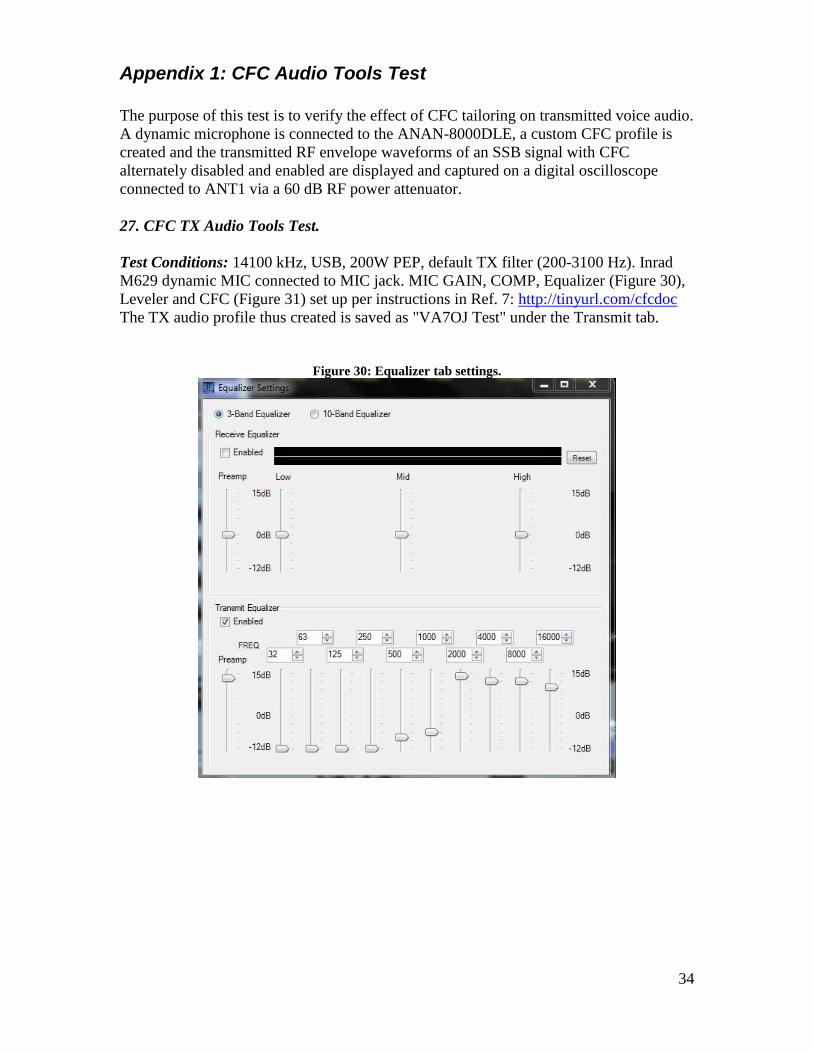
27. CFC TX Audio Tools Test.
Test Conditions: 14100 kHz, USB, 200W PEP, default TX filter (200-3100 Hz). Inrad
M629 dynamic MIC connected to MIC jack. MIC GAIN, COMP, Equalizer (Figure 30),
Leveler and CFC (Figure 31) set up per instructions in Ref. 7: http://tinyurl.com/cfcdoc
The TX audio profile thus created is saved as "VA7OJ Test" under the Transmit tab.
Figure 30: Equalizer tab settings.

35
Figure 31: CFC tab settings.
Test Results: Figures 32 and 33 illustrate the RF envelope waveform with CFC off and
the VA7OJ Test profile enabled, respectively.
Figure 32: Transmitted RF envelope, USB, 200WPEP, CFC off.

36
Figure 33: Transmitted RF envelope, USB, 200WPEP, CFC on, VA7OJ Test profile.
Subjective listening test: By listening via the Monitor facility, it was determined that the
CFC-processed audio had much more pre-emphasis, greatly increased "punch" and a
large improvement in articulation as compared to the audio with CFC off.

37
Appendix 2: Aliasing Suppression Test, Dec. 23, 2015.
The purpose of this test is to measure the suppression of aliasing artifacts generated in
Nyquist Zone 1 when a swept signal covering a frequency offset range in Nyquist Zone 2
is applied to the RX1 input.
The Orion MkII Nyquist frequency (fS/2) is 61.44 MHz. Thus, Nyquist Zone 1 is 0 –
61.44 MHz and Zone 2 is 61.44 – 122.88 MHz.
19. Aliasing suppression for input sweep range 61.44 MHz ≤ f0 ≤ 71.44 MHz. An RF
sweep generator is connected to the RX1 input via a 20 dB attenuator, and set up as
follows: Start Freq: 61.44MHz (fS/2)
Stop Freq: 71.44MHz (fS/2 + 10 MHz)
Sweep Time: 50 ms
Output level: -60 dBm
Attenuator: 10 dB
Test conditions: ANAN-8000DLE, running under PowerSDR OpenHPSDR v3.3.6,
configured as follows: Attenuator: 0 dB
Preselector: None fitted
AGC Gain: 120
Dither & Random: OFF
Zoom: Minimum
AVG: ON, Avg. Time 240 ms
Center freq. 61.170 MHz
Stop freq. 61.440 MHz
Span: ± 270 kHz
FFT: Mid (bin width 5.859 Hz)
Window: Blackman-Harris
Weighted – Log
The test result is shown in Figure 6. An aliasing artifact is observed at 61.386 MHz. See
Figure 27.
Figure 27: Aliasing artifacts vs. frequency.
Copyright © 2016-2017 A. Farson VA7OJ/AB4OJ. January 16, 2016.

38
Appendix 3: Investigation of ALEX Preselector PIM, August 2-5, 2017
A comparison of the RX1 IFSS charts for the ANAN-8000DLE and the stand-alone Rev.
3 Orion MkII board revealed a significant degradation of front-end IMD3 performance
with the ALEX preselector in the signal path. (Refer to Test 9 and Figure 7 on p. 8
above.)
As a result, an additional IFSS test was conducted under the same conditions as for Test
9, but with ALEX alternately on and off. IMD3 amplitudes are significantly higher with
ALEX on, the worst case being 16 dB degradation at -30 dBm/tone input. This leads to a
conclusion that PIM (passive IMD) is occurring in inductor cores in the ALEX filters.
Figure 38: RX1 IFSS (2-tone IMD3) vs. test signal level, with ALEX on and off.
To quantify the PIM, two-port NPR tests were conducted on the BPF1 section of the
ALEX board. (It is assumed that the BPF1 and BPF2 sections are identical.)
Tests were performed with the Wandel & Goltermann RS-50 and RS-25 noise generators
and RE-25 noise receiver. The generators were fitted with band-limiting (BLF) and
bandstop (BSF) filters as listed in Table 15, and the receiver with modules corresponding
to the bandstop filters. The generator in use was connected to the ALEX input via a low-
PIM 75/50Ω transformer, and the ALEX output was connected to the receiver via a MCL
BMP-5075 50/75Ω matching pad.

39
Test Conditions: NPR tests run at 0, -10 and +5 dBm noise loading. Intrinsic (test
system) NPR measured initially at each level by jumpering the 50Ω transformer output
and matching-pad input.
Table 15: Two-port NPR of ALEX Preselector
Noise Loading dBm 0 -10 +5
BSF kHz BLF kHz Intr. NPR ALEX NPR Intr. NPR ALEX NPR Intr. NPR ALEX NPR
1940 60-2044 77.7 70.6 79.9 79.9 77.0 67.9
2438 60-2600 76.6 52.9 76.6 70.5 78.4 48.8
3886 60-4100 79.0 53.3 77.6 64.1 77.7 48.3
4650 60-5600 78.0 55.8 76.8 66.7 73.4* 51
5340 60-5600 77.7 56.1 76.3 67.1 74.7 50.9
7600 316-8160 73.3 63.5 77.7 76.9 67.0* 55.9
11700 0-13000 74.2 62.4 73.7 68.3 73.3 57.4
*Intrinsic NPR degraded due to RE-25 REU module overload at +5 dBm.
Test Results: Severe NPR degradation was observed, increasing sharply with noise
loading, This will severely compromise the receivers' IMD performance under strong-
signal conditions with ALEX in the signal path.
This issue can be rectified by replacing the existing inductors in the ALEX filters with
parts using cores of sufficient cross-section to minimize saturation at high input levels.
Choice of core material will also be an important factor in this remediation process.
Copyright © 2016-2017 A. Farson VA7OJ/AB4OJ. August 5, 2017.