Embed Size (px)
Citation preview

Electronic copy available at: http://ssrn.com/abstract=1970693
Analyzing Valuation Measures:
A Performance Horse-Race over the past 40 Years.
Wesley Gray Drexel University 101 N. 33rd Street
Academic Building 209 Philadelphia, PA 19104
Jack Vogel Drexel University 101 N. 33rd Street
Academic Building 209 Philadelphia, PA 19104
January 2012
Electronic copy available at: http://ssrn.com/abstract=1970693
Analyzing Valuation Measures:
A Performance Horse-Race over the past 40 Years.
ABSTRACT
We compare the investment performance of portfolios sorted on different valuation
measures. EBITDA/TEV has historically been the best performing metric and outperforms
many investor favorites such as price-to-earnings, free-cash-flow to total enterprise value, and
book-to-market. We also explore the investment potential of long-term valuation ratios, which
replaces one-year earnings with an average of long-term earnings. In contrast to prior empirical
work, we find that long-term ratios add little investment value over standard one-year valuation
metrics.
JEL Classification: G10, G14 Key words: enterprise multiple, price to earnings, price to book, free cash flow, gross profits, valuation metrics

We address a basic research question: Which valuation metric has historically performed
the best? Practitioners have relied on a variety of valuation measures, including price to earnings
(P/E), and total enterprise value to earnings before interest and taxes and depreciation and
amortization (TEV/EBITDA). Meanwhile, academic research (e.g., Fama and French [1992])
has traditionally relied on the book to market ratio (B/M) and the more recent gross profits
measure (GP) introduced by Novy-Marx [2010].
Eugene Fama and Ken French consider B/M a superior metric for the following reason:
We always emphasize that different price ratios are just different ways to
scale a stock’s price with a fundamental, to extract the information in the cross-
section of stock prices about expected returns. One fundamental (book value,
earnings, or cashflow) is pretty much as good as another for this job, and the
average return spreads produced by different ratios are similar to and, in
statistical terms, indistinguishable from one another. We like BtM because the
book value in the numerator is more stable over time than earnings or cashflow,
which is important for keeping turnover down in a value portfolio. 1
As stated above, Fama and French suggest that different price ratios are “pretty much as good as
another for this job [explaining returns].” We beg to differ. We find economically and
statistically significant differences in the performance of various valuation metrics. Specifically,
we examine a large swath of pricing metrics (all expressed in “yield” format):
• Earnings to Market Capitalization (E/M)
• Earnings before interest and taxes and depreciation and amortization to total
enterprise value (EBITDA/TEV)
1 http://www.dimensional.com/famafrench/2011/06/qa-why-use-book-value-to-sort-stocks.html, accessed 11/15/2011

• Free cash flow to total enterprise value (FCF/TEV)
• Gross profits to total enterprise value (GP/TEV)
• Book to market (B/M)
• Forward Earnings Estimates to Market Capitalization (FE/M)
Over the 1971 through 2010 period analyzed, we find that EBITDA/TEV is the best
valuation metric to use as an investment strategy relative to other valuation metrics (Loughran
and Wellman 2009 find similar results). The returns to an annually rebalanced equal-weight
portfolio of high EBITDA/TEV stocks, earn 17.66% a year, with a 2.91% annual 3-factor alpha
(stocks below the 10% NYSE market equity breakpoint are eliminated). This compares favorably
to a practitioner favorite, E/M (i.e., inverted Price-to-earnings, or P/E). Cheap E/M stocks earn
15.23% a year, but show no evidence of alpha after controlling for market, size, and value
exposures. The academic favorite, book-to-market (B/M), tells a similar story as E/M and earns
15.03% for the cheapest stocks, but with no alpha. FE/M is the worst performing metric by a
wide margin, suggesting that investors shy away from using analyst earnings estimates to make
investment decisions.
We find other interesting facts about valuation metrics. When we analyze the spread in
returns between the cheapest and most expensive stocks, given a specific valuation measure, we
again find that EBITDA/TEV is the most effective measure. The lowest quintile returns based on
EBITDA/TEV return 7.97% a year versus the 17.66% for the cheapest stocks—a spread of
9.69%. This compares very favorably to the spread created by E/M, which is only 5.82% (9.41%
for the expensive quintile and 15.23% for the cheap quintile).
Valuation metrics that incorporate last year’s earnings or forward earnings are interesting,
but what about “long-term” valuation metrics? Going back to the 1930s, practitioners have

promoted the concept of using “normalized earnings” in place of simple one-year earnings
estimates. For example, Graham and Dodd (1934, p. 452) speak to the use of current earnings in
the context of valuation metrics: “[earnings in P/E] should cover a period of not less than five
years, and preferably seven to ten years.”
More recently, academics such as Campbell and Shiller [1998], suggest that annual
earnings are noisy as a measure of fundamental value. Anderson and Brooks [2006] conduct a
robust study of long-term P/E ratios and find evidence that using a long-term earnings average
(8-years) in place of one-year earnings increases the spread in returns between value and growth
stocks by 6% (their evidence is on the UK stock market from 1975 through 2003). We are unable
to replicate this result in the US stock market and find mixed results with long-term valuation
measures.
Data
Data Description
Our data sample includes all firms on the New York Stock Exchange (NYSE), American
Stock Exchange (AMEX), and Nasdaq firms with the required data on CRSP and Compustat. We
only examine firms with ordinary common equity on CRSP and eliminate all REITS, ADRS,
closed-end funds, utilities, and financial firms. We incorporate CRSP delisting return data using
the technique of Beaver, McNichols, and Price [2007]. To be included in the sample, all firms
must have a non-zero market value of equity as of June 30th of year t. We construct our valuation
measures according to the following formula:
• Total Enterprise Value (TEV)
o Similar to the Loughran and Wellman [2011], we compute TEV as:

TEV = Market Capitalization (M) + Short-term Debt (DLC) +
Long-term Debt (DLTT) + Preferred Stock Value (PSTKRV) –
Cash and Short-term Investments (CHE). This variable is used in
multiple valuation measures.
• Earnings to Market Capitalization (E/M)
o Following Fama and French [2001], we compute earnings as:
Earnings = Earnings Before Extraordinary Items (IB) – Preferred
Dividends (DVP) + Income Statement Deferred Taxes (TXDI), if
available.
• Earnings before interest and taxes and depreciation and amortization to total
enterprise value (EBITDA/TEV)
o EBITDA = Operating Income Before Depreciation (OIBDP) + Non-
operating Income (NOPI).
• Free cash flow to total enterprise value (FCF/TEV)
o Similar to the Novy-Marx [2010] paper, we compute FCF and as:
FCF = Net Income (NI) + Depreciation and Amortization (DP) -
Working Capital Change (WCAPCH) - Capital Expenditures
(CAPX).
• Gross profits to total enterprise value (GP/TEV)
o Following Novy-Marx [2010], we compute GP as:
GP = Total Revenue (REVT) – Cost of Goods Sold (COGS).
• Book to market (B/M)
o Similar to Fama French [2001], we compute Book Equity as:
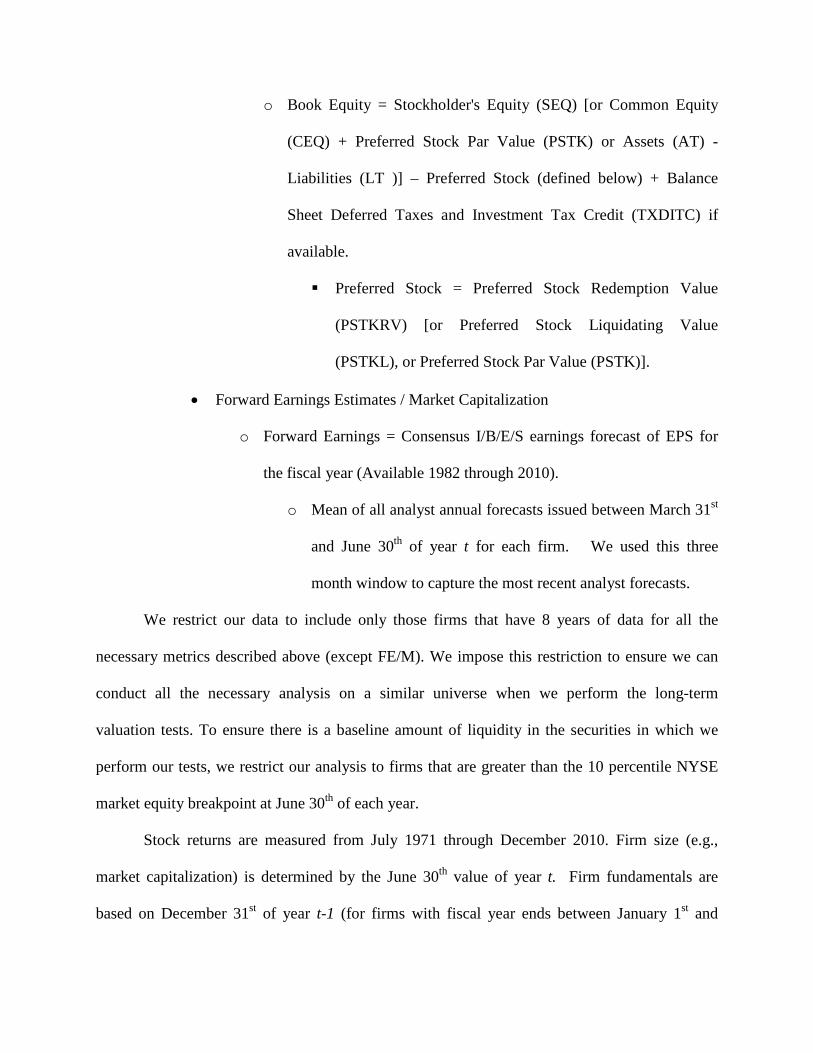
o Book Equity = Stockholder's Equity (SEQ) [or Common Equity
(CEQ) + Preferred Stock Par Value (PSTK) or Assets (AT) -
Liabilities (LT )] – Preferred Stock (defined below) + Balance
Sheet Deferred Taxes and Investment Tax Credit (TXDITC) if
available.
Preferred Stock = Preferred Stock Redemption Value
(PSTKRV) [or Preferred Stock Liquidating Value
(PSTKL), or Preferred Stock Par Value (PSTK)].
• Forward Earnings Estimates / Market Capitalization
o Forward Earnings = Consensus I/B/E/S earnings forecast of EPS for
the fiscal year (Available 1982 through 2010).
o Mean of all analyst annual forecasts issued between March 31st
and June 30th of year t for each firm. We used this three
month window to capture the most recent analyst forecasts.
We restrict our data to include only those firms that have 8 years of data for all the
necessary metrics described above (except FE/M). We impose this restriction to ensure we can
conduct all the necessary analysis on a similar universe when we perform the long-term
valuation tests. To ensure there is a baseline amount of liquidity in the securities in which we
perform our tests, we restrict our analysis to firms that are greater than the 10 percentile NYSE
market equity breakpoint at June 30th of each year.
Stock returns are measured from July 1971 through December 2010. Firm size (e.g.,
market capitalization) is determined by the June 30th value of year t. Firm fundamentals are
based on December 31st of year t-1 (for firms with fiscal year ends between January 1st and

March 31st we use year t fundamentals; for firms with fiscal year ends after March 31st we use
year t-1 fundamentals). Firms are sorted into quintiles on each measure on June 30th of year t,
and this value is used to compute the monthly returns from July of year t to June of year t+1.
Equal-weight and value-weight portfolio returns are buy and hold.
Exhibit 1: Summary Statistics: CRSP Universe Compared to Sample
This table reports summary statistics for CRSP stocks with information on all the variables in the table compared to all stocks with 8 years of data for all variables in the table. The returns are from July 1st, 1971 until December 31st, 2010. This sample excludes financials and utilities, and all firms below the NYSE 10% market capitalization cutoff. These sample statistics do not require firms to have a forward earnings estimate. The portfolio is formed each year on June 30th, and held for one year. The market value of equity (ME) is measured on June 30th each year. B/M is defined as (stockholder’s equity + deferred taxes and investment tax credit + preferred stock redemption value) divided by ME. Leverage is defined as long term debt divided by the book value of assets (described above for B/M). Ret(-2,-12) is the buy-and-hold return from the previous July (t-1) through May (t). Volatility is the standard deviation of daily returns computed over the past year (250 trading days). Turnover is the average daily share turnover during the past year (250 trading days).
Panel A: ALL CRSP Stocks Common Stocks
ME (millions) B/M Leverage Ret(-2,-12) Volatility Turnover
Mean 2198 0.608 0.481 0.227 0.042 0.007
25th Percentile 115 0.254 0.027 -0.112 0.018 0.001 Median 322 0.478 0.269 0.116 0.024 0.003
75th Percentile 1001 0.819 0.623 0.400 0.034 0.007 Panel C: All Stocks with 8 years of data
ME (millions) B/M Leverage Ret(-2,-12) Volatility Turnover Mean 3164 0.665 0.474 0.200 0.041 0.006
25th Percentile 159 0.315 0.075 -0.102 0.017 0.001 Median 471 0.544 0.317 0.110 0.023 0.003
75th Percentile 1546 0.882 0.640 0.369 0.031 0.006 Data Summary Statistics
Exhibit 1 outlines the summary statistics. This table highlights that our universe, which
includes only firms with 8 full years of data for all the variables, is similar to a universe which
only requires firms to have 1 year of data. While the 8 year universe firms are larger than the 1
year firms, we see that B/M, leverage, momentum, volatility, and turnover are similar for the 1
and 8 year universes. We replicate all our analysis using universes that are less constrained than
our requirement that all firms have 8 years of data necessary to calculate all the valuation metrics
analyzed; all results are similar.
Results: A Comparison of Valuation Metrics
Valuation Metric Performance
We analyze the compound annual growth rates (CAGR) of each valuation metric over the
1971 to 2010 period for equal-weight and value-weight portfolios. Exhibit 2 shows the returns to
the portfolio quintiles sorted on cheap (quintile 5) and expensive (quintile 1). Each valuation
metric captures the well-known spread in returns between cheap stocks (i.e., value) and
expensive stocks (i.e, growth). But not all valuation metrics are created equal. For example,
FCF/TEV does a decent job capturing the returns for cheap stocks (16.57%), but has little ability
to identify low-returning growth stocks (11.03%). However, high EBITDA/TEV stocks earn
17.66% relative to low EBITDA/TEV stocks, which earn a meager 7.97%. On an absolute return
basis, evidence suggests that EBITDA/TEV is superior to alternative valuation measures.2
To assess risk-adjusted performance, we control for exposures to the market, size, and
value factor, and calculate 3-factor Fama and French alpha estimates for each of the quintile
portfolios (See Exhibit 2, Panel B). E/M and B/M strategies show no alpha after controlling for
the 3-factor model. This is not particularly surprising since B/M is one of the factors in the 3-
factor model, and B/M and E/M are highly correlated. Nonetheless, alternative valuation metrics
such as EBITDA/TEV, GP/TEV, and FCF/TEV, actually provide economically and statistically
significant alphas. There is also weak evidence that FCF/TEV can identify overvalued stocks, as
evident by the -1.96% alpha on the most expensive FCF/TEV quintile. We conduct the same 2 We perform all analysis with EBIT/TEV in place of EBITDA/TEV and find nearly identical results.

analysis over the more recent 1991 to 2010 period and find similar results (results not shown, but
available upon request).
The value-weight portfolios show less pronounced results compared to the equal-weight
portfolios, suggesting valuation metrics are more effective in smaller stocks. For example, the
value-weight portfolio returns for EBITDA/TEV, which put more weight on larger stocks, earn a
14.39% return for cheap stocks and an 8.16% for expensive stocks. And while there is no clear
“best” strategy for the value-weight results, evidence suggests that EBITDA/TEV and GP/TEV
have the best performance, but all strategies have approximately the same return and the same
spreads between cheap and expensive.
The alpha for value-weight portfolios tells a similar story as the equal-weight portfolios.
There is evidence that EBITDA/TEV and FCF/TEV add value. EBITDA/TEV has a 2.48%
annual alpha and FCF/TEV has a 2.22% annual alpha. The other valuation metrics have no
statistically reliable alpha in the context of the Fama and French 3-factor model.

Exhibit 2: One-Year Valuation Measure Performance
This table reports return statistics for CRSP stocks with 8 years of data for all variables in the table. The returns are from July 1st, 1971 until December 31st, 2010. This sample excludes financials and utilities, and all firms below the NYSE 10% market capitalization cutoff. The sample is sorted into quintiles on June 30th of each year, and each portfolio is held for one year. Panel A reports the annual returns (equal and value-weighted) for each quintile portfolio based on one of the following valuation measures: E/M, EBITDA/TEV, FCF/TEV, GP/TEV, and B/M. Panel A also reports the returns of the equal and value-weight market. Quintile 1 holds “growth” stocks, whereas quintile 5 contains “value” stocks. Last, Panel A compares the returns of the “value” and “growth” stocks for each valuation measure in the 5-1 row. Panel B reports the Fama-French 3-factor alpha for each valuation measure sorted again by quintiles. Alphas are monthly estimates times 12. T-statistics are shown in brackets below each alpha value in Panel B.
Equal-weight portfolio Value-Weight Portfolio E/M EBITD
A/TEV FCF/T
EV GP/TE
V B/M EW Mkt
E/M EBITDA/TEV
FCF/TEV
GP/TEV B/M
VW Mkt
Panel A: Annual Returns
1 10.44% 7.97% 11.03% 8.31% 9.20% 13.04% 9.26% 8.16% 9.76% 7.83% 9.15% 10.09% 2 12.40% 11.36% 11.19% 11.20% 11.93% 13.04% 10.81% 8.97% 10.10% 9.77% 10.61% 10.09% 3 13.74% 12.55% 12.80% 13.41% 13.49% 13.04% 10.42% 9.91% 10.60% 11.29% 10.82% 10.09% 4 14.60% 15.51% 14.38% 15.64% 15.64% 13.04% 11.98% 12.56% 10.74% 13.84% 12.41% 10.09% 5 15.99% 17.66% 16.57% 16.53% 15.03% 13.04% 13.62% 14.39% 13.70% 14.97% 13.62% 10.09%
5-1 5.54% 9.69% 5.54% 8.22% 5.83% N/A 4.37% 6.23% 3.94% 7.14% 4.47% N/A Panel B: 3-Factor Alpha
1 -0.95% -1.11% -1.96% -1.22% 0.41% N/A -0.09% 1.66% -1.95% 0.23% 2.17% N/A (Low) [-0.77] [-0.99] [-1.85] [-1.08] [0.54] N/A [-0.07] [1.61] [-1.56] [0.26] [2.8] N/A
2 1.67% 0.02% -0.50% -0.53% 0.98% N/A 2.34% -0.22% 1.01% 0.36% 0.94% N/A [2.35] [0.02] [-0.71] [-0.65] [1.46] N/A [2.91] [-0.29] [1.27] [0.49] [1.13] N/A
3 1.68% -0.27% 1.27% 0.63% 0.93% N/A 0.60% -0.62% 2.05% 0.63% 0.02% N/A [2.21] [-0.33] [1.82] [0.8] [1.26] N/A [0.66] [-0.64] [2.7] [0.74] [0.03] N/A
4 1.44% 1.58% 1.97% 2.10% 1.70% N/A 0.94% 0.93% 0.73% 2.34% 0.29% N/A [1.77] [1.97] [2.58] [2.69] [2.33] N/A [0.94] [1.01] [0.84] [2.3] [0.3] N/A
5 1.30% 2.91% 2.90% 2.06% -0.67% N/A 1.08% 2.48% 2.22% 1.83% -0.90% N/A (High) [1.37] [3.3] [3.93] [2.25] [-0.7] N/A [0.98] [1.95] [2.09] [1.46] [-0.78] N/A
Valuation Metric Risk
Exhibit 3 presents common risk metrics for the valuation measures. Panel A highlights
the results for cheap stocks (i.e., “value”). The valuation metrics are similar in character,
although EBITDA/TEV and FCF/TEV stand out with favorable Sharpe and Sortino ratios (see
Exhibit 3, Panel A). For example, EBITDA/TEV has a monthly Sortino of .26, which compares
favorably to all other metrics. Max drawdowns are similar across all portfolios, however, the
value-weight EBITDA/TEV and FCF/TEV portfolios have max drawdowns that are considerably
smaller than the other portfolios. Overall, the cheapest-ranked stock portfolios have risk
characteristics that are similar, if not superior, to the buy-and-hold equal-weight and value-
weight benchmarks.
With respect to the most expensive stocks (i.e., “growth”), the results suggest that buying
expensive securities is a poor risk-adjusted bet (see Exhibit 3, Panel B). Max drawdowns, Sharpe
ratios, and Sortino ratios are uniformly worse for expensive stocks relative to cheap stocks,
regardless of the valuation metric employed. Moreover, on every metric, the expensive stocks
underperform the buy-and-hold benchmarks.
Exhibit 4 shows the drawdowns for EBITDA/TEV. Both Panels A and B (value and
equal weighted portfolios) show that “cheap” stocks (value) have better drawdown measures
than “expensive” stocks (growth), or CRSP and SP500 stocks. Looking at the worst
performance over 60 months, we see that “cheap” EBITDA/TEV stocks vastly outperform the
market.
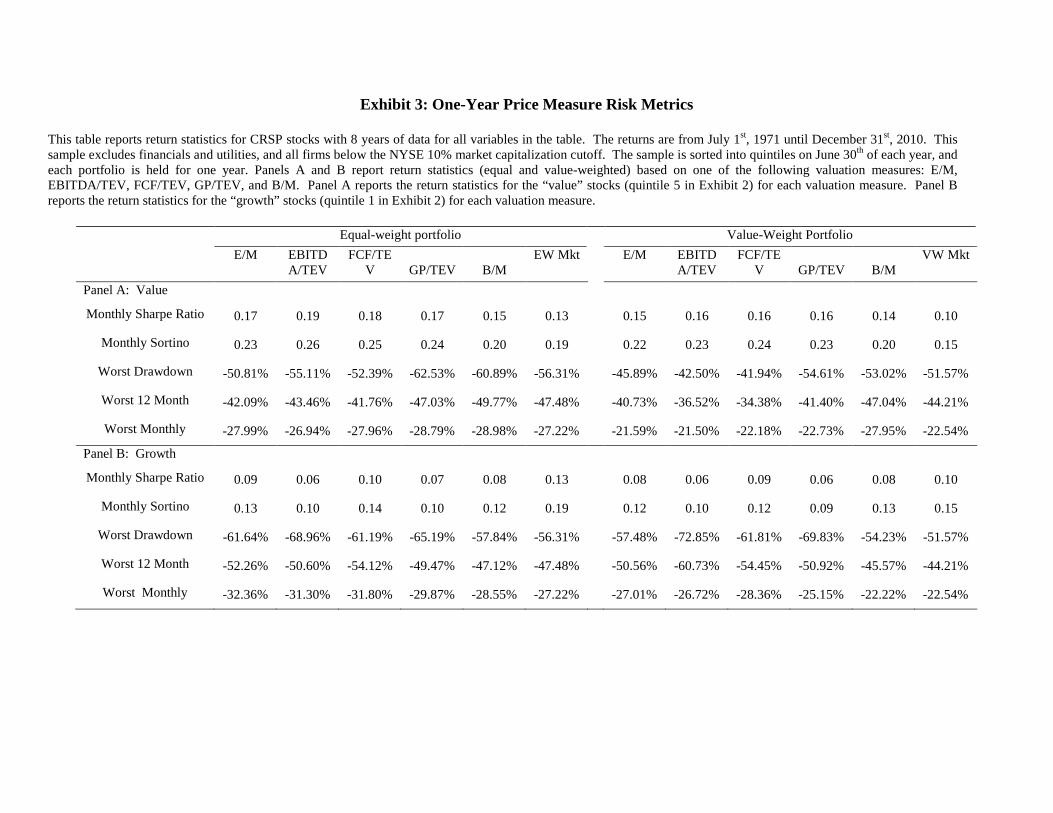
Exhibit 3: One-Year Price Measure Risk Metrics
This table reports return statistics for CRSP stocks with 8 years of data for all variables in the table. The returns are from July 1st, 1971 until December 31st, 2010. This sample excludes financials and utilities, and all firms below the NYSE 10% market capitalization cutoff. The sample is sorted into quintiles on June 30th of each year, and each portfolio is held for one year. Panels A and B report return statistics (equal and value-weighted) based on one of the following valuation measures: E/M, EBITDA/TEV, FCF/TEV, GP/TEV, and B/M. Panel A reports the return statistics for the “value” stocks (quintile 5 in Exhibit 2) for each valuation measure. Panel B reports the return statistics for the “growth” stocks (quintile 1 in Exhibit 2) for each valuation measure.
Equal-weight portfolio Value-Weight Portfolio E/M EBITD
A/TEV FCF/TE
V GP/TEV B/M EW Mkt E/M EBITD
A/TEV FCF/TE
V GP/TEV B/M VW Mkt
Panel A: Value
Monthly Sharpe Ratio 0.17 0.19 0.18 0.17 0.15 0.13 0.15 0.16 0.16 0.16 0.14 0.10
Monthly Sortino 0.23 0.26 0.25 0.24 0.20 0.19 0.22 0.23 0.24 0.23 0.20 0.15
Worst Drawdown -50.81% -55.11% -52.39% -62.53% -60.89% -56.31% -45.89% -42.50% -41.94% -54.61% -53.02% -51.57%
Worst 12 Month -42.09% -43.46% -41.76% -47.03% -49.77% -47.48% -40.73% -36.52% -34.38% -41.40% -47.04% -44.21%
Worst Monthly -27.99% -26.94% -27.96% -28.79% -28.98% -27.22% -21.59% -21.50% -22.18% -22.73% -27.95% -22.54%
Panel B: Growth
Monthly Sharpe Ratio 0.09 0.06 0.10 0.07 0.08 0.13 0.08 0.06 0.09 0.06 0.08 0.10
Monthly Sortino 0.13 0.10 0.14 0.10 0.12 0.19 0.12 0.10 0.12 0.09 0.13 0.15
Worst Drawdown -61.64% -68.96% -61.19% -65.19% -57.84% -56.31% -57.48% -72.85% -61.81% -69.83% -54.23% -51.57%
Worst 12 Month -52.26% -50.60% -54.12% -49.47% -47.12% -47.48% -50.56% -60.73% -54.45% -50.92% -45.57% -44.21%
Worst Monthly -32.36% -31.30% -31.80% -29.87% -28.55% -27.22% -27.01% -26.72% -28.36% -25.15% -22.22% -22.54%
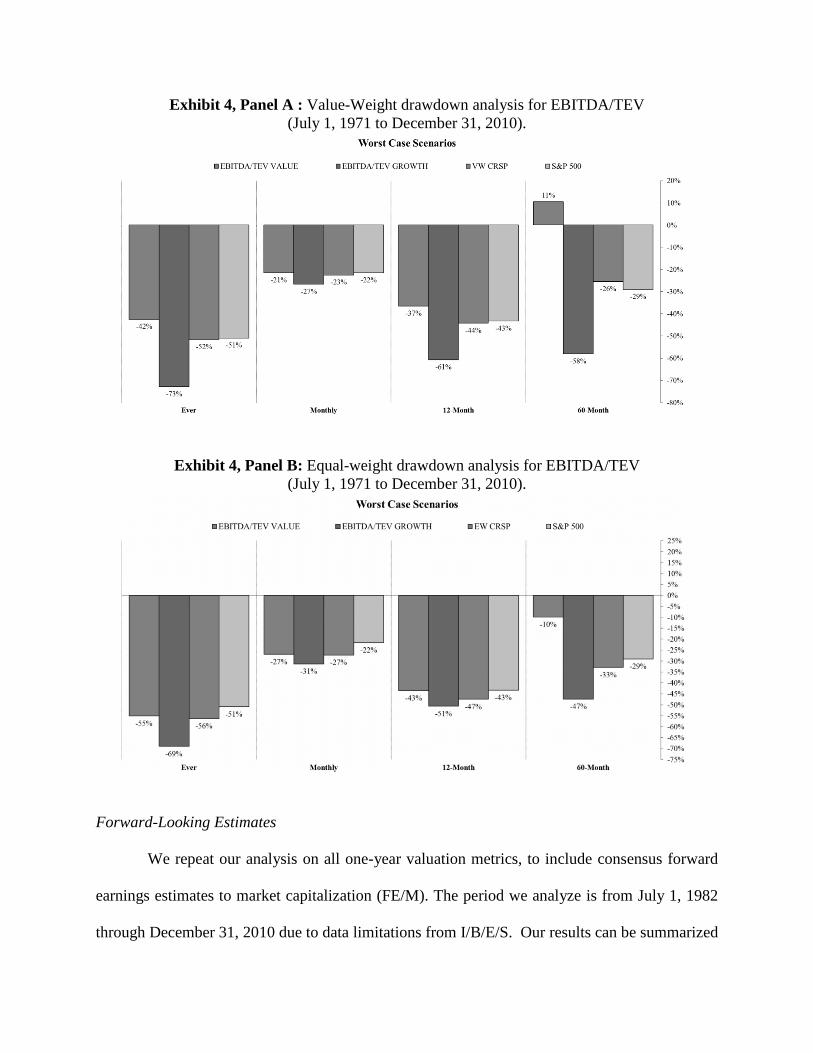
Exhibit 4, Panel A : Value-Weight drawdown analysis for EBITDA/TEV (July 1, 1971 to December 31, 2010).
Exhibit 4, Panel B: Equal-weight drawdown analysis for EBITDA/TEV (July 1, 1971 to December 31, 2010).
Forward-Looking Estimates
We repeat our analysis on all one-year valuation metrics, to include consensus forward
earnings estimates to market capitalization (FE/M). The period we analyze is from July 1, 1982
through December 31, 2010 due to data limitations from I/B/E/S. Our results can be summarized
as follows: The top-ranked FE/M quintile performs considerably worse than all other measures.3
For example, over the 1982-2010 time period the CAGR for the top performing FE/M quintile is
8.63%. This compares poorly with the value-weight market return of 11.73% and the worst
performing valuation measure B/M (earned a 13.63% over the same period). Moreover, these
returns strongly underperformed the best performing metric, EBITDA/TEV (earned 16.37%
from 1982-2010). The evidence suggests that investors should be weary of using forward
earnings estimates in their valuation toolkit.
Results: Examining Long-Term Valuation Measures
Long-Term Valuation Metric Performance
The central hypothesis proposed by proponents of long-term valuation metrics is that
“normalizing” earnings decreases the noise of the valuation signal and therefore increases the
predictive power of the metric. We test this conjecture and highlight the results in Exhibit 5. In
each column of Exhibit 5 we represent a different perturbation of the long-term valuation metric.
For example, the 2yr column uses the 2-year average of the numerator for the valuation metric.
In the case of EBITDA/TEV, this is represented by the following equation:
𝐸𝐵𝐼𝑇𝐷𝐴/𝑇𝐸𝑉𝑛 =
∑ 𝐸𝐵𝐼𝑇𝐷𝐴𝑗𝑛𝑗=1
𝑛𝑇𝐸𝑉
(1)
Turning to Exhibit 5, we find little evidence that normalizing the numerator for a
valuation metric has any ability to predict higher portfolio returns. If anything, the evidence
suggests that the one-year valuation measure is superior to normalized metrics. We are also
unable to replicate the findings from Anderson and Brooks [2006]. These authors find evidence
that the use of long-term valuation metrics increase the spread between value stocks and growth 3 Full results not tabulated, but available upon request.

stocks by 6 percent a year in the UK stock market. In contrast to their results, we find that the
spread between value and growth stocks are very similar across different normalizing periods.
Exhibit 5: Long-Term versus Short-Term Valuation Measures
This table reports return statistics for CRSP stocks with 8 years of data for all variables in the table. The returns are from July 1st, 1971 until December 31st, 2010. This sample excludes financials and utilities, and all firms below the NYSE 10% market capitalization cutoff. The sample is sorted into quintiles on June 30th of each year, and each portfolio is held for one year. Panels A and B report return statistics based on one of the following valuation measures: E/M, EBITDA/TEV, FCF/TEV, GP/TEV, and B/M. The 1 year valuation measure indicates that the measure is constructed using the current numerator and current denominator for each measure. All other year valuation measures (2 years – 8 years) take the average of the numerator over the past N years, and divide this average by the current denominator. For example, the 8 year FCF/TEV measure is constructed by averaging the past 8 years FCF for each company (including the current observation), and dividing this by the company’s current TEV. Panel A reports the equal-weighted return statistics for the “value” stocks (quintile 5) for each valuation measure. Panel B reports the value-weighted return statistics for the “growth” stocks (quintile 1) for each valuation measure. Both panels A and B also compare the “value” and “growth” portfolios by looking at the spread (value – growth).
Panel A: Equal-Weight EW Value 1yr 2yr 3yr 4yr 5yr 6yr 7yr 8yr
E/M 15.99% 15.73% 16.14% 16.16% 15.74% 15.63% 15.65% 15.81% EBITDA/TEV 17.66% 17.30% 17.37% 16.87% 16.79% 16.68% 16.51% 16.49%
FCF/TEV 16.57% 16.03% 15.92% 15.87% 15.77% 15.53% 14.93% 15.12% GP/TEV 16.53% 16.70% 16.67% 16.66% 16.59% 16.44% 16.68% 16.62%
B/M 15.03% 15.47% 15.53% 15.42% 15.36% 15.33% 15.59% 15.59% EW Growth
E/M 10.44% 10.56% 10.21% 10.28% 9.91% 10.02% 9.88% 9.67% EBITDA/TEV 7.97% 7.73% 7.35% 7.28% 7.31% 7.26% 7.33% 7.10%
FCF/TEV 11.03% 11.38% 11.20% 11.46% 11.28% 11.59% 11.91% 11.90% GP/TEV 8.31% 8.07% 8.08% 8.13% 8.23% 8.07% 8.19% 8.37%
B/M 9.20% 8.67% 8.08% 8.04% 8.02% 7.99% 8.10% 8.06% Spread (Value-Growth)
E/M 5.54% 5.17% 5.93% 5.88% 5.84% 5.61% 5.77% 6.14% EBITDA/TEV 9.69% 9.56% 10.01% 9.60% 9.49% 9.42% 9.17% 9.39%
FCF/TEV 5.54% 4.65% 4.72% 4.41% 4.49% 3.95% 3.02% 3.22% GP/TEV 8.22% 8.63% 8.59% 8.53% 8.36% 8.36% 8.49% 8.25%
B/M 5.83% 6.80% 7.45% 7.38% 7.35% 7.34% 7.49% 7.53%

Exhibit 5: Long Term Valuation Measures (continued)
Panel B: Value-Weight Value 1yr 2yr 3yr 4yr 5yr 6yr 7yr 8yr
E/M 13.62% 13.78% 13.91% 14.03% 14.40% 14.16% 13.88% 14.15% EBITDA/TEV 14.39% 14.52% 15.19% 15.21% 14.83% 15.05% 14.41% 14.48%
FCF/TEV 13.70% 12.62% 12.61% 12.59% 12.42% 12.49% 12.41% 12.33% GP/TEV 14.97% 15.16% 15.38% 15.61% 15.33% 15.10% 14.64% 14.41%
B/M 13.62% 13.96% 14.16% 14.05% 13.97% 14.20% 14.34% 14.87% Growth
E/M 9.26% 9.25% 9.61% 9.12% 7.68% 8.21% 8.20% 7.03% EBITDA/TEV 8.16% 8.29% 8.19% 7.92% 8.00% 7.80% 7.82% 7.72%
FCF/TEV 9.76% 10.77% 10.38% 10.48% 10.14% 9.49% 9.70% 10.17% GP/TEV 7.83% 8.41% 8.41% 8.09% 8.07% 7.95% 8.38% 8.16%
B/M 9.15% 8.98% 8.91% 8.64% 8.54% 8.45% 8.67% 8.69% Spread (Value-Growth)
E/M 4.37% 4.53% 4.30% 4.90% 6.72% 5.95% 5.69% 7.12% EBITDA/TEV 6.23% 6.24% 7.01% 7.29% 6.84% 7.24% 6.59% 6.76%
FCF/TEV 3.94% 1.85% 2.22% 2.12% 2.28% 3.01% 2.71% 2.16% GP/TEV 7.14% 6.75% 6.97% 7.52% 7.25% 7.15% 6.26% 6.24%
B/M 4.47% 4.99% 5.25% 5.41% 5.43% 5.75% 5.67% 6.18%
Results: Robustness of Valuation Metrics across the Business Cycle
Given the analysis thus far, EBITDA/TEV is arguably the best performing value
investment strategy (on a risk-adjusted basis); however, one can imagine a world where a
particular valuation metric may outperform another measure in a particular economic
environment. For example, cash-focused measures, such as free-cash-flow, might perform better
during economic downturns than accounting-focused measures like earnings. Or perhaps a more
asset-based measure, like book value, will outperform when the economy is more
manufacturing-based (‘70s and ‘80s), and struggle when the economy is more human capital and
services oriented (therefore making asset-based measures less relevant). To test these
hypotheses, we analyze the returns of the valuation metrics during economic expansions and
contractions. Our definitions for expanding or contracting economic periods are from the
National Bureau of Economic Research.4 Results are shown in Exhibit 6.
Exhibit 6 Panel A presents the returns for value strategies during economic expansions.
B/M enjoys periods of relative out-performance in the early ‘70s, early ‘80s, and in late 2009.
The B/M performance pattern lends weak evidence to the hypothesis that balance-sheet-based
value measures perform better than income or cash-flow statement value metrics when the
economy generates more returns from tangible assets (e.g., property, plant, and equipment)
relative to intangible assets (e.g., human capital, R&D, and brand equity). Overall, there is no
strong evidence that a particular valuation metrics systematically outperform all other metrics
during expanding economic periods.
Exhibit 6 Panel B presents the returns for value strategies during economic contractions.
Similar to the results in Panel A, the results in Panel B suggest there is no clear evidence that a
particular value strategy systematically outperforms all other strategies in contracting economic
periods. For example, during the July 1981 to November 1982 and March 2001 to November
2001 contractions GP/TEV shows strong outperformance, but this same metric has the worst
performance in the December 2007 to June 2009 recession.
Overall, there is little evidence that a particular value strategy outperforms all other
metrics during economic contractions and expansions. However, there is clear evidence that
value strategies as a whole do outperform passive benchmarks in good times and in bad. The one
exception to this rule is during the April 1975 to June 1981 business cycle, a time when a passive
small-cap equity portfolio performed exceptionally well.
4 http://www.nber.org/cycles.html

Exhibit 6: Business Cycle Returns, 1971-2010
This table reports compound annual growth rates during expansion and contraction periods in the US economy. Economic period definitions are from the National Bureau of Economic Research. This table reports return statistics for CRSP stocks with 8 years of data for all variables in the table. This sample excludes financials and utilities, and all firms below the NYSE 10% market capitalization cutoff. The sample is sorted into quintiles on June 30th of each year, and each portfolio is held for one year. Panel A reports the annual returns (equal and value-weighted) for the top quintile portfolio based on one of the following valuation measures: E/M, EBITDA/TEV, FCF/TEV, GP/TEV, and B/M. The best performing portfolio for a given time period is highlighted in bold.
Equal-weight portfolio Value-Weight Portfolio E/M EBITD
A/TEV FCF/TE
V GP/TEV B/M EW Mkt E/M EBITD
A/TEV FCF/TE
V GP/TEV B/M VW Mkt
Panel A: Expansion
July 1971 - Oct. 1973 3.16% 4.52% 2.54% -2.51% 5.35% -6.59% 8.24% 6.04% 0.34% -2.93% 13.84% 4.82%
Apr. 1975 - Dec. 1979 28.57% 27.82% 27.69% 24.60% 27.80% 31.44% 20.60% 20.97% 20.18% 20.31% 20.93% 13.62%
Aug. 1980 - June 1981 33.91% 34.97% 30.12% 34.94% 34.95% 40.88% 18.65% 9.70% 20.93% 17.35% 23.49% 17.69%
Dec. 1982 - Jun. 1990 20.61% 22.60% 20.67% 22.53% 16.90% 10.07% 20.82% 21.96% 19.26% 23.84% 19.12% 15.86%
Apr. 1991 - Feb. 2001 15.33% 17.44% 18.27% 18.31% 14.84% 15.63% 17.71% 18.86% 18.88% 19.77% 15.97% 14.41%
Dec. 2001 - Nov. 2007 16.69% 19.52% 15.50% 14.42% 15.81% 15.95% 14.46% 15.89% 13.49% 12.05% 7.75% 8.48%
Jul. 2009 - Dec. 2010 41.48% 44.22% 40.32% 47.41% 50.08% 38.62% 24.58% 26.18% 19.91% 31.77% 38.52% 28.71%
Panel B: Contraction
Nov. 1973 - Mar. 1975 -6.05% -3.91% -3.90% -6.71% -0.66% -9.78% -10.48% -9.83% -9.74% -6.15% -0.08% -14.82%
Jan. 1980 - July 1980 24.22% 22.82% 28.93% 26.48% 25.84% 33.02% 18.34% 32.76% 36.07% 29.46% 25.95% 29.64%
Jul. 1981 - Nov. 1982 11.02% 16.94% 18.47% 28.91% 9.85% 5.82% 2.37% 1.11% 11.33% 17.86% 9.35% 8.83%
Jul. 1990 - Mar. 1991 3.80% 5.27% 4.91% 6.02% -1.94% 3.84% 0.49% 7.90% 13.27% 10.84% -2.49% 9.64%
Mar. 2001 - Nov. 2001 8.27% 12.31% 7.92% 22.58% 5.04% 2.44% -4.60% -4.24% -7.42% 4.63% -3.13% -9.15%
Dec. 2007 - June 2009 -12.11% -16.30% -16.32% -21.62% -20.07% -17.40% -18.15% -18.35% -16.32% -19.79% -17.22% -23.54%

Conclusion
Evidence suggests that EBITDA/TEV has historically been the best performing valuation
metric based on a variety of analyses. Our analysis of absolute performance, risk metrics, and 3-
factor alpha estimates confirms that EBITDA/TEV has historically been a superior strategy, but
also suggests that FCF/TEV also can add value to a portfolio. Based on analysis of periods of
economic contraction and expansion, we find no evidence that a single valuation measure
outperforms all others in contractions or expansions. However, we do find evidence that
valuation-based strategies do outperform the market in both expanding and contracting economic
environments. Finally, we explore a popular concept in the investment community which
suggests that the use of long-term valuation ratios can enhance portfolio performance. In contrast
to prior empirical work, we find that long-term ratios add little investment value over one-year
valuation metrics.
References
Anderson, Keith, C. Brooks, “The Long-Term Price-Earnings Ratio.” Journal of Business Finance & Accounting 37 (2006), 1063-1086.
Beaver, William, M. McNichols, R. Price, “Delisting Returns and Their Effect on Accounting-
Based Market Anomalies.” Journal of Accounting and Economics 43 (2007), 341-368. Campbell, Jeremy, R. Shiller, “Stock Prices, Earnings, and Expected Dividends.” Journal of
Finance 43 (1998), 661-676. Fama, Eugene F., K. French, “Disappearing Dividends: Changing Firm Characteristics or Lower
Propensity to Pay?” Journal of Financial Economics 60 (2001), 3-43. Graham Benjamin, D. Dodd. Security Analysis, New York: McGraw-Hill, 1934. Loughran, Tim, J. Wellman, “New Evidence on the Relation Between the Enterprise Multiple
and Average Stock Returns” Working Paper, University of Notre Dame, 2011. Novy-Marx, Robert, “The Other Side of Value: Good Growth and the Gross Profitability
Premium,” Working Paper, University of Rochester, 2010.