Embed Size (px)
Citation preview
Analyzing Twitter Sentiment of the 2016 Presidential Candidates
Delenn Chin, Anna Zappone, Jessica Zhao
SECTION 1: TASK DEFINITION
1.1 Introduction Elections empower citizens to choose their leaders. It gives all an opportunity for equal voice and representation in our government. Democracy is government for the people, and by the people, which means government leaders are determined by participation in elections. As we approach the 2016 November presidential election, the public sentiment towards candidates will influence the future leader of our country. We are interested in how the public views the top election candidates, namely Donald Trump, Hillary Clinton, Ben Carson, and Bernie Sanders. Feelings towards candidates fluctuate quickly as interviews, debates, responses to global events, and other issues come to front. To achieve a large, diverse dataset of current public opinions on the candidates, we decided to use Twitter. Twitter provides us with live access to opinions about the election across the globe. We are analyzing recent tweets regarding the top candidates in the 2016 election to predict the public sentiments towards each candidate. Our project attempts to solve the realworld problem of understanding the current sentiment towards election candidates based off the public’s live opinions and emotions rather than off of smaller, localized polls typically done by mainstream media corporations. Furthermore, we are aiming for a larger, more relevant assessment of sentiments towards candidates than the media and polls have. We are expanding on simply positive or negative sentiment towards a candidate by classifying tweets into five emotions happy, sad, fear, laughter, and angry.
1.2 Scope We focused on tweets regarding the presidential election and its candidates. We assessed the sentiment towards each candidate based off recent tweets. We downloaded over 300,000 tweets using keywords. Our keywords for the searches were “politics,” “political candidates,” or the full name of a 2016 presidential candidate. Of the approximately 300,000 tweets downloaded, we obtained almost 3,000 tweets that
contained an emoji in this list:
1
1.3 Input To get our input data, we downloaded tweets using the Twitter API found from a search of our key words or the full name of a 2016 presidential candidate. We then used only the tweets that contain an emoji in the 1.2 list above. For both testing and training input, we used as input the text of tweets stripped of the emojis. We are using the text of the tweet stripped of the emojis in 1.2 to avoid overfitting to emojis and to base our prediction off the text sentiment. Before stripping the emoji, we create a mapping of the tweet to the class in which the first emoji of the tweet belongs for either training or assessing classification accuracy.
Training Input We used 2,000 of our downloaded tweets to train our classifier. Testing Input We used the remaining tweets to test our classifier. We ran our classifier on at least 150 tweets per candidate, with over 900 total tweets tested.
1.4 Output Training Output Our output is the sentiment string that the first emoji in the tweet is mapped to.
For example, a tweet “I love Hillary! ” would be mapped to ‘Happy’ since
is the first emoji and an element of the ‘Happy’ list.
Testing Output Our output is the sentiment string that the tweet most expresses among ‘Happy’, ‘Sad’, ‘Angry’, ‘Laughter’, and ‘Scared’ after fitting our classifier to the training data.
1.5 Evaluation To assess our project’s success, we calculate the accuracy of our predicted sentiments by comparing the outputted classifications for the test tweets with the “correct” sentiments that we detected by using the emojis.
SECTION 2: INFRASTRUCTURE
As for the infrastructure for our machine learning project, we collected data and processed it for sentiment classification. We outline our challenges and decisions below.
2
2.1 Data Source: The first challenge arose in determining our data source. Election sentiments change quickly, as candidates drop out or gain popularity based on events and debates. We decided to use Twitter to handle the temporal nature of elections and still be able to collect relevant data about the candidates. After determining Twitter as our data source, we still faced challenges with our volume of data. While we ultimately were able to get almost 3,000 tweets with our chosen emojis for the project, we were shocked at how few tweets had emojis. Even when we downloaded tweets over days, we would end up with less than 1/100 of those tweets having emojis in our 1.2 list.
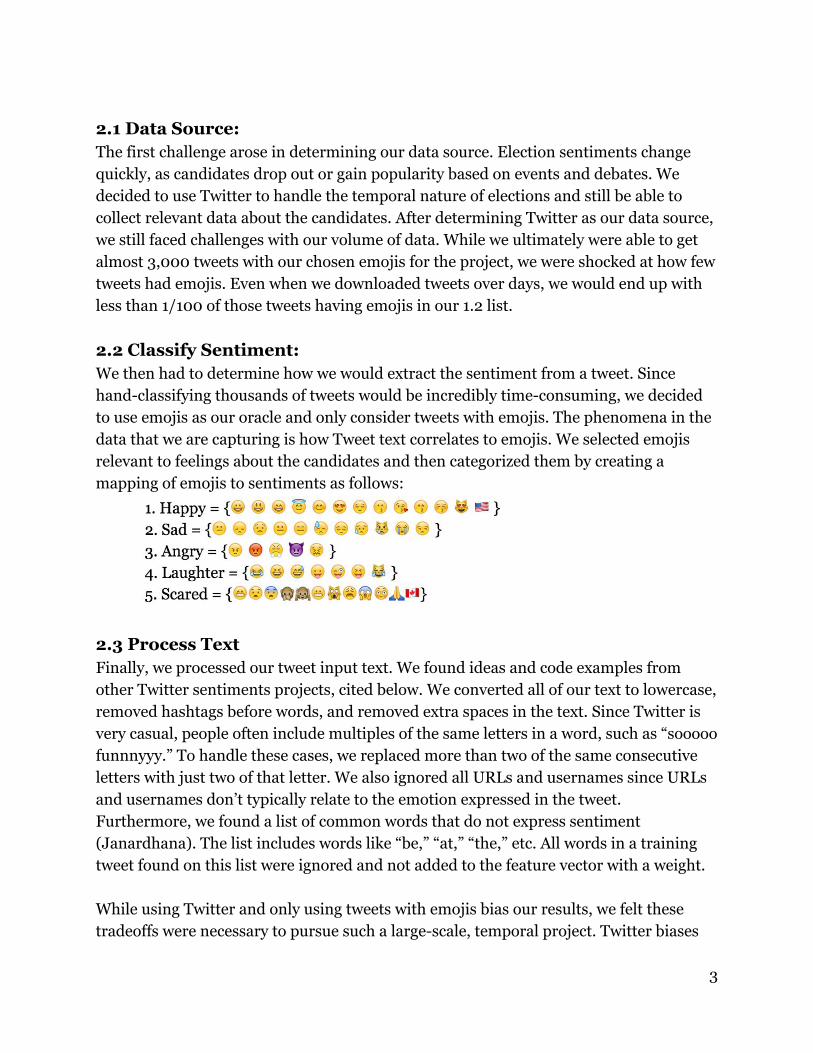
2.2 Classify Sentiment: We then had to determine how we would extract the sentiment from a tweet. Since handclassifying thousands of tweets would be incredibly timeconsuming, we decided to use emojis as our oracle and only consider tweets with emojis. The phenomena in the data that we are capturing is how Tweet text correlates to emojis. We selected emojis relevant to feelings about the candidates and then categorized them by creating a mapping of emojis to sentiments as follows:
2.3 Process Text Finally, we processed our tweet input text. We found ideas and code examples from other Twitter sentiments projects, cited below. We converted all of our text to lowercase, removed hashtags before words, and removed extra spaces in the text. Since Twitter is very casual, people often include multiples of the same letters in a word, such as “sooooo funnnyyy.” To handle these cases, we replaced more than two of the same consecutive letters with just two of that letter. We also ignored all URLs and usernames since URLs and usernames don’t typically relate to the emotion expressed in the tweet. Furthermore, we found a list of common words that do not express sentiment (Janardhana). The list includes words like “be,” “at,” “the,” etc. All words in a training tweet found on this list were ignored and not added to the feature vector with a weight. While using Twitter and only using tweets with emojis bias our results, we felt these tradeoffs were necessary to pursue such a largescale, temporal project. Twitter biases
3
our project towards analyzing feelings of Twitter’s younger, more techsavvy audience and opinions that can be expressed using strict word limits. Similarly, only using tweets with emojis may further bias our projects towards youth and more emotional rather than serious tweets.
SECTION 3: APPROACH
3.1 Baseline: As our lower bound, we set our baseline as randomly predicting 1 of the 5 sentiments, which gives 20% accuracy.
3.2 Oracle: As our upper bound, we used the correct sentiment classification based on the first emoji and seeing how well our classifier does predicting the sentiment expressed by the emoji. This means we define the correct sentiment of the tweet as the first emoji in the tweet. We calculate how well our classification algorithm performs relative to this oracle.
3.3 Feature Extraction: We used the bagofwords model to create our sparse feature vector. Every distinct word from our training tweets is added to a feature vector excluding URLs, usernames, and words on our list of common words that do not express sentiment as described in 2.3.
3.4 Modelling: There were many challenges and things to consider in how to best model our task. We realized that there are many feelings the general public holds towards candidates, so we wanted to account for more than simply positive or negative sentiments achieved through binary classification or even a range between positive and negative through linear regression. Multiclass classification allows us to categorize the tweets into multiple distinct classes to handle a more specific range of emotions. We modelled the task as a multiclass classification problem to account for an array of different emotions that people could realistically feel regarding the election candidates. We tested three algorithms Support Vector Machines, Nearest Neighbors, and Naive Bayes classification. There were many tradeoffs between accuracy and efficiency. The tradeoffs between accuracy are visible in Figure 1 below.
4
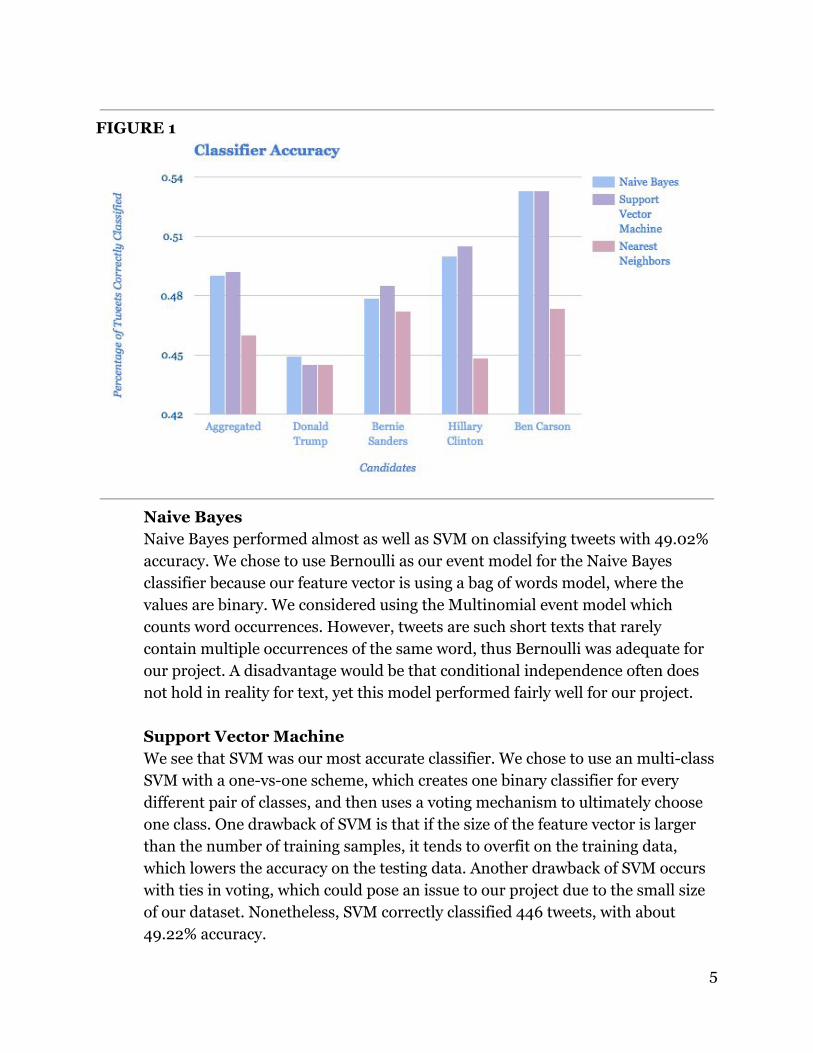
FIGURE 1
Naive Bayes Naive Bayes performed almost as well as SVM on classifying tweets with 49.02% accuracy. We chose to use Bernoulli as our event model for the Naive Bayes classifier because our feature vector is using a bag of words model, where the values are binary. We considered using the Multinomial event model which counts word occurrences. However, tweets are such short texts that rarely contain multiple occurrences of the same word, thus Bernoulli was adequate for our project. A disadvantage would be that conditional independence often does not hold in reality for text, yet this model performed fairly well for our project.
Support Vector Machine We see that SVM was our most accurate classifier. We chose to use an multiclass SVM with a onevsone scheme, which creates one binary classifier for every different pair of classes, and then uses a voting mechanism to ultimately choose one class. One drawback of SVM is that if the size of the feature vector is larger than the number of training samples, it tends to overfit on the training data, which lowers the accuracy on the testing data. Another drawback of SVM occurs with ties in voting, which could pose an issue to our project due to the small size of our dataset. Nonetheless, SVM correctly classified 446 tweets, with about 49.22% accuracy.
5
Nearest Neighbors We set our k value to 6, which gave us most accurate results. The kNearest Neighbors model looks at the k closest neighbors to the given sample and uses a voting mechanism to classify the given sample into the class with the majority of votes. This is an example of lazy learning, because nothing is done with the training data until the model tries to classify the test data. While KNN is one of the simplest machine learning algorithms, it did not perform as well on our dataset. We think KNN’s lower accuracy of 45.99% could relate to the size of the dataset and differences between words in our training dataset and testing dataset resulting in worse plotting. We found that the training tweets we added from keywords of “politics” and “presidential candidates” used different, more formal lexicons than that of the tweets from a presidential candidate’s name as the keyword.
Overall, there were many tradeoffs between the Naive Bayes, Support Vector Machines, and Nearest Neighbors algorithms. In terms of efficiency, Naive Bayes was the most efficient in terms of time, while the KNN algorithm was the slowest because it takes longer to classify each test data point. In terms of accuracy, Support Vector Machines was most accurate and kNearest Neighbors was least accurate.
SECTION 4: LITERATURE REVIEW
We were surprised to find that there has not been much work relating to emojis and sentiment classification. Most work is centered on the polarity of sentiment rather than a diversity of sentiments. We found a similar Indonesian study that used hashtags, emojis, emoticons, and adjectives in tweets for emotion detection of five emotions happy, angry, fear, sad, and surprise (Arifin et al.). Since they were classifying multiple emotions, they saw the same imbalance that we encountered with some emotions having almost double the number of tweets than others. Our models used similar algorithms, though they used matrix manipulation before using nearest neighbors. We found another similar study done in India that does “emotion estimation” using direct words, emojis, and smileys (Yeole et al.). While the researchers considered using SVM, they ultimately used a similar approach to SVM of Artificial Neural Networks with Jaccard similarity. Our project’s modelling and approach seems complementary to the India emotion research. In their use of emojis to estimate sentiments, our work is similar to both these existing works. However, Yeole’s study used emojis only in predicting the emotion and used an existing classified Amazon sentiment dataset for
6
training whereas we used the first emoji as our oracle to create our own sentiment dataset for training. Furthermore, we think our project had a more realworld application as we applied our sentiment classification to the election and only considered tweets relating to specific candidates. We found an interesting project relating to using emojis to obtain the emotional state of users to then better predict music recommendations for the user (Ferwerda, Schedl). While this project also had a realworld application of their emotional classification, our project is still fairly orthogonal to their application.
SECTION 5: ERROR ANALYSIS
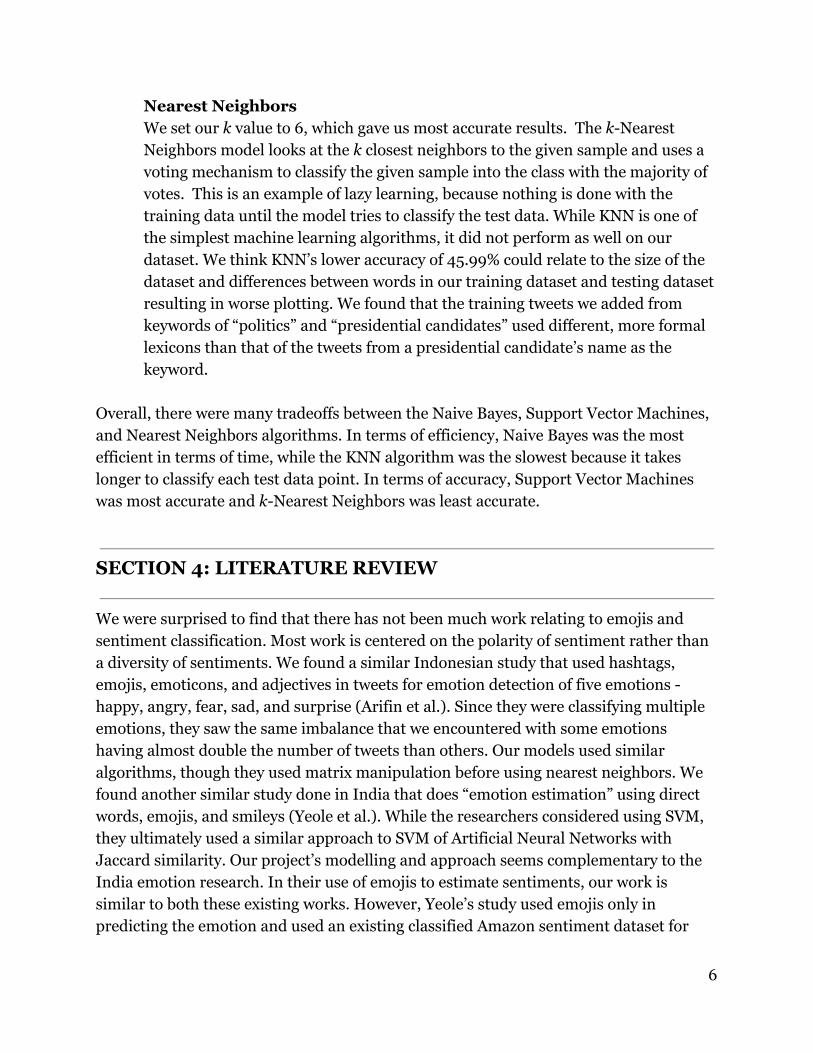
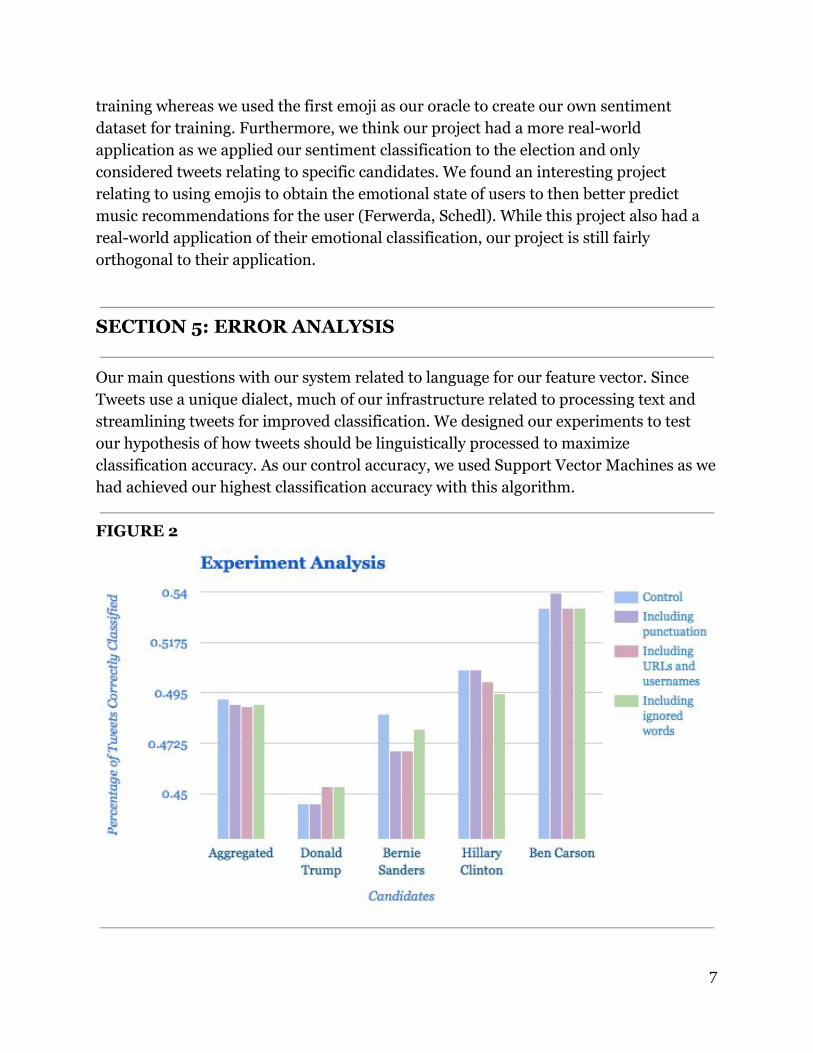
Our main questions with our system related to language for our feature vector. Since Tweets use a unique dialect, much of our infrastructure related to processing text and streamlining tweets for improved classification. We designed our experiments to test our hypothesis of how tweets should be linguistically processed to maximize classification accuracy. As our control accuracy, we used Support Vector Machines as we had achieved our highest classification accuracy with this algorithm.
FIGURE 2
7
5.1 Does ignoring punctuation improve our classification? In our processing, we had trimmed punctuation from tweets because we assumed it was not very related to sentiment. We found that ignoring punctuation does improve our classification, but only slightly. For Hillary Clinton, Donald Trump, and Ben Carson, including punctuation yielded equally effective or better classification. However, it did a much worse job classifying with punctuation for Bernie Sanders. We were surprised that keeping or ignoring punctuation does not have a huge impact on our accuracy.
5.2 Does ignoring URLs and usernames improve our classification? We hypothesized that ignoring URLs and usernames would improve our classification accuracy as they seem unrelated to sentiment. However, we were surprised to find that including URLs and usernames actually improved classification for Donald Trump’s tweets, though it did not for the other candidates. Overall, our hypothesis was correct and ignoring URLs and usernames gave us higher classification accuracy.
5.3 Does ignoring common words unrelated to sentiment improve our classification? We used a list of words that are common, but do not directly express or relate to sentiment from other Twitter sentiment projects. Ignoring these words that didn’t directly correlate to sentiments very slightly improved our classification, but the influence was not nearly as large as we expected it to be. Our main takeaway from our experiments was that our processing of what we thought were extraneous features in the text did not have as large of an impact on our classification results as we expected.
SECTION 6: DATA ANALYSIS
6.1 Overview We constructed maps from the sentiments of the tweets we collected, using metadata for each tweet to find the locations that users inputted into their profile. Twitter’s API does have an entry for latitude and longitude coordinates. However, it requires the user to enable this setting, and we found that less than 1% of users had enabled this feature. We therefore used the userinputted location. This requires handlabelling each location to determine the state the user lived because the userinputted location was in a variety of formats. Some people used area codes, university names, and airport abbreviations, among other things, to describe their location, so we looked up their inputted
8
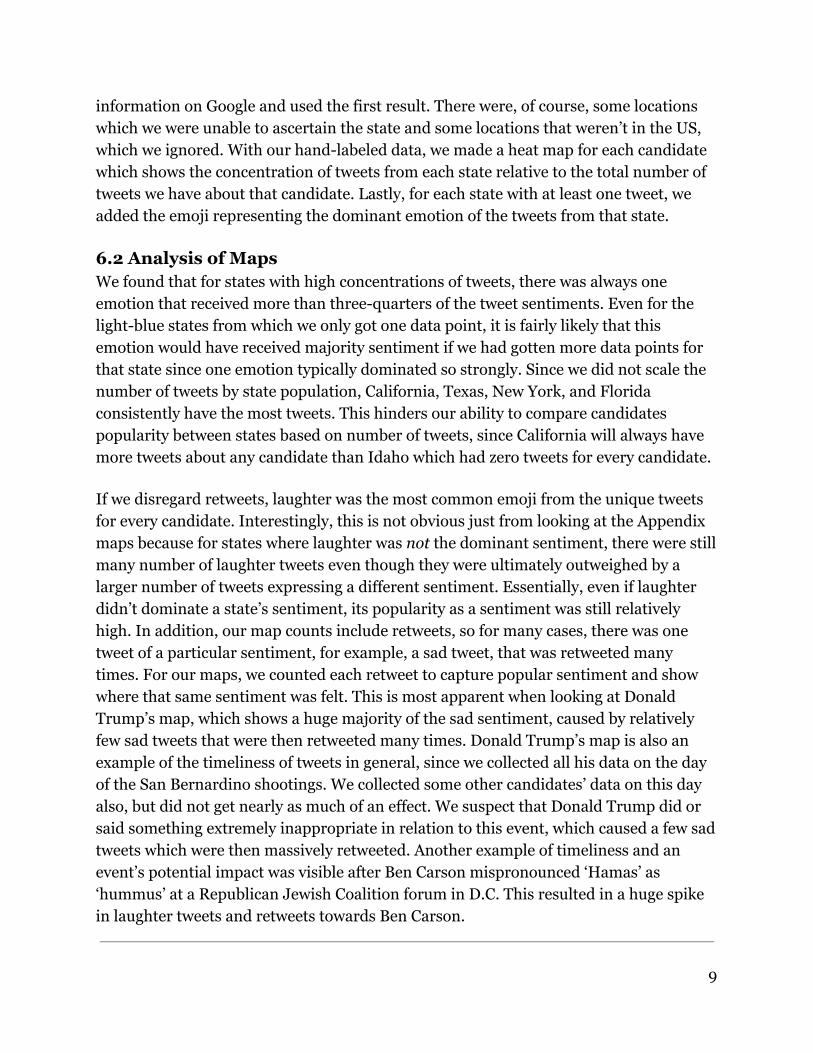
information on Google and used the first result. There were, of course, some locations which we were unable to ascertain the state and some locations that weren’t in the US, which we ignored. With our handlabeled data, we made a heat map for each candidate which shows the concentration of tweets from each state relative to the total number of tweets we have about that candidate. Lastly, for each state with at least one tweet, we added the emoji representing the dominant emotion of the tweets from that state.
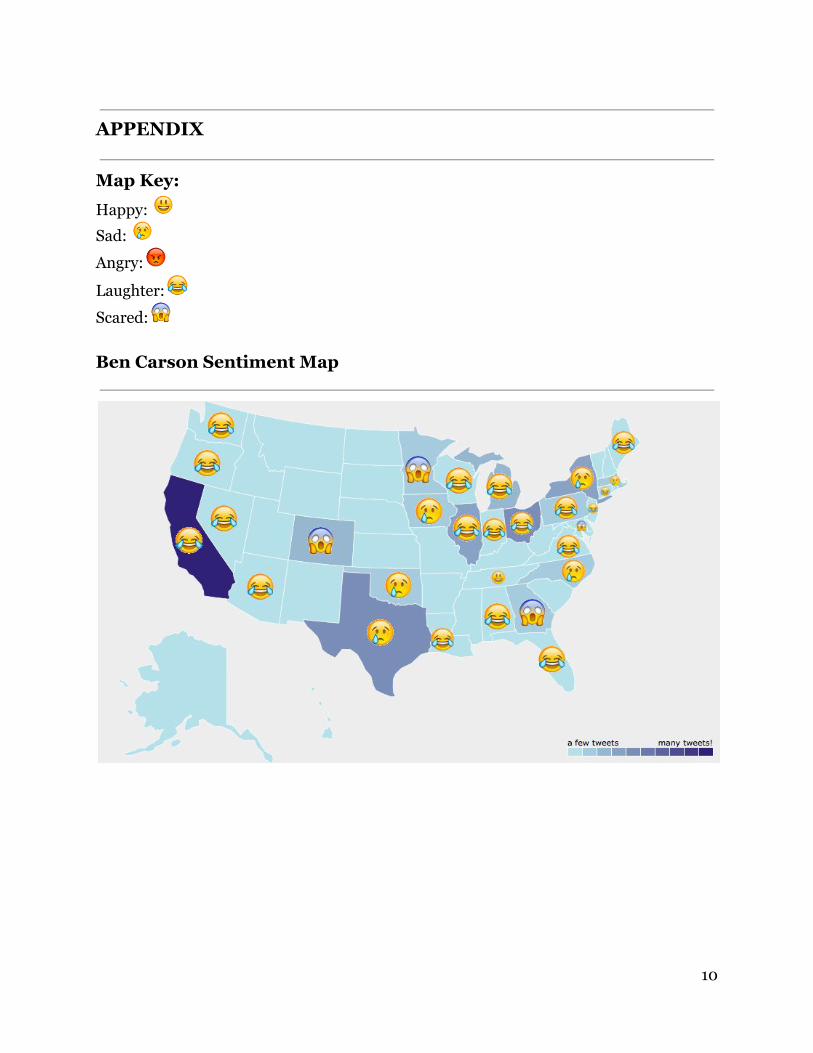
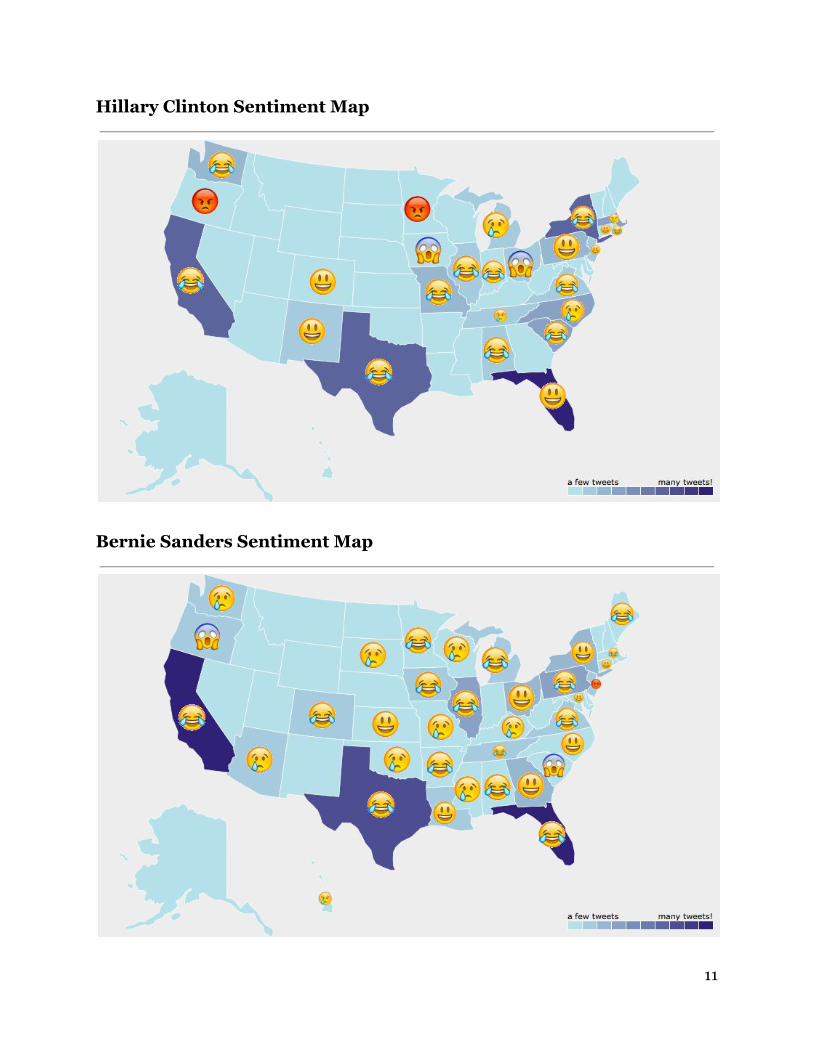
6.2 Analysis of Maps We found that for states with high concentrations of tweets, there was always one emotion that received more than threequarters of the tweet sentiments. Even for the lightblue states from which we only got one data point, it is fairly likely that this emotion would have received majority sentiment if we had gotten more data points for that state since one emotion typically dominated so strongly. Since we did not scale the number of tweets by state population, California, Texas, New York, and Florida consistently have the most tweets. This hinders our ability to compare candidates popularity between states based on number of tweets, since California will always have more tweets about any candidate than Idaho which had zero tweets for every candidate. If we disregard retweets, laughter was the most common emoji from the unique tweets for every candidate. Interestingly, this is not obvious just from looking at the Appendix maps because for states where laughter was not the dominant sentiment, there were still many number of laughter tweets even though they were ultimately outweighed by a larger number of tweets expressing a different sentiment. Essentially, even if laughter didn’t dominate a state’s sentiment, its popularity as a sentiment was still relatively high. In addition, our map counts include retweets, so for many cases, there was one tweet of a particular sentiment, for example, a sad tweet, that was retweeted many times. For our maps, we counted each retweet to capture popular sentiment and show where that same sentiment was felt. This is most apparent when looking at Donald Trump’s map, which shows a huge majority of the sad sentiment, caused by relatively few sad tweets that were then retweeted many times. Donald Trump’s map is also an example of the timeliness of tweets in general, since we collected all his data on the day of the San Bernardino shootings. We collected some other candidates’ data on this day also, but did not get nearly as much of an effect. We suspect that Donald Trump did or said something extremely inappropriate in relation to this event, which caused a few sad tweets which were then massively retweeted. Another example of timeliness and an event’s potential impact was visible after Ben Carson mispronounced ‘Hamas’ as ‘hummus’ at a Republican Jewish Coalition forum in D.C. This resulted in a huge spike in laughter tweets and retweets towards Ben Carson.
9
APPENDIX
Map Key:
Happy:
Sad:
Angry:
Laughter:
Scared: Ben Carson Sentiment Map
10
Hillary Clinton Sentiment Map
Bernie Sanders Sentiment Map
11
Donald Trump Sentiment Map
Test Data Statistics
Donald Trump
● Keyword queries: “trump”, “donald trump” ● Total tweets collected for testing data = 28902 ● Unique tweets out of those collected = 16507 ● Total tweets with emojis used for testing = 256
○ Accuracy: ■ KNN: 0.4453125 ■ SVM: 0.4453125
● Include punctuation: 0.4453125 ● Include username and URLs: 0.453125 ● Include all words: 0.453125
■ Naive Bayes Bernoulli: 0.44921875 Ben Carson
● Keyword queries: “ben carson” ● Total tweets collected for testing data = 21416 ● Unique tweets out of those collected = 13869
12
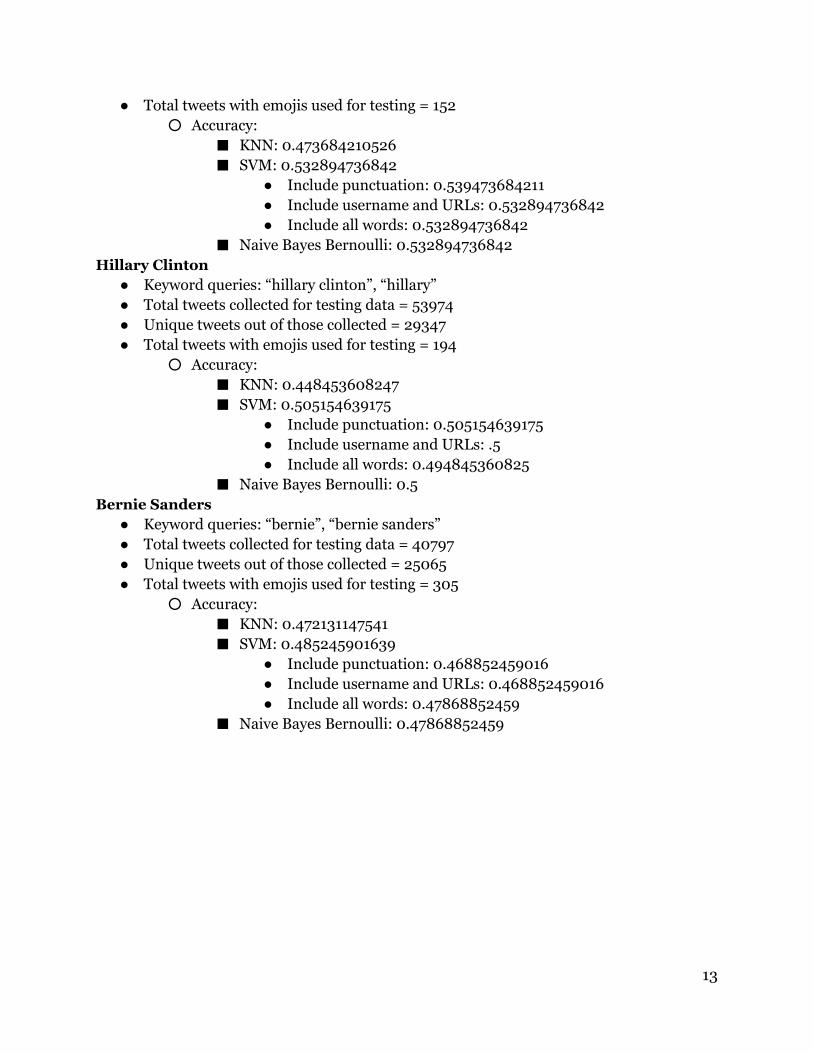
● Total tweets with emojis used for testing = 152 ○ Accuracy:
■ KNN: 0.473684210526 ■ SVM: 0.532894736842
● Include punctuation: 0.539473684211 ● Include username and URLs: 0.532894736842 ● Include all words: 0.532894736842
■ Naive Bayes Bernoulli: 0.532894736842 Hillary Clinton
● Keyword queries: “hillary clinton”, “hillary” ● Total tweets collected for testing data = 53974 ● Unique tweets out of those collected = 29347 ● Total tweets with emojis used for testing = 194
○ Accuracy: ■ KNN: 0.448453608247 ■ SVM: 0.505154639175
● Include punctuation: 0.505154639175 ● Include username and URLs: .5 ● Include all words: 0.494845360825
■ Naive Bayes Bernoulli: 0.5 Bernie Sanders
● Keyword queries: “bernie”, “bernie sanders” ● Total tweets collected for testing data = 40797 ● Unique tweets out of those collected = 25065 ● Total tweets with emojis used for testing = 305
○ Accuracy: ■ KNN: 0.472131147541 ■ SVM: 0.485245901639
● Include punctuation: 0.468852459016 ● Include username and URLs: 0.468852459016 ● Include all words: 0.47868852459
■ Naive Bayes Bernoulli: 0.47868852459
13
Works Cited
Aly, Mohamed. "Survey on Multiclass Classification Methods." Cs.utah.edu. N.p., n.d.
Web. 8 Dec. 2015.
Arifin, Agus Z., Yuita A. Sari, Evy K. Ratnasari, and Siti Mutrofin. "Emotion Detection of
Tweets in Indonesian Language Using NonNegative Matrix Factorization."
International Journal of Intelligent Systems and Applications(IJISA) 6.9
(2014): 5461. IJISA. MECS Publisher, Aug. 2014. Web. 29 Nov. 2015.
Ferwerda, Bruce, and Markus Schedl. "Enhancing Music Recommender Systems with
Personality Information and Emotional States: A Proposal." (2011): n. pag. JKU
Computational Perception. Johannes Kepler University, 2014. Web. 29 Nov.
2015.
Janardhana, Ravikiran. "How to Build a Twitter Sentiment Analyzer." Ravikiranj.net.
Nikola, 08 May 2012. Web. 06 Dec. 2015.
Kim, Jinho, Byungsoo Kim, and Silvio Savarese. "Comparing Image Classification
Methods: KNearestNeighbor and SupportVectorMachines." Wseas.us. N.p.,
n.d. Web. 8 Dec. 2015.
Nakhaeizadeh, Gholamreza. Statistical Data Mining. N.p.: n.p., n.d. UlmUni. Ulm
University, 2007. Web. 8 Dec. 2015.
"Properties of Naive Bayes." The Stanford Natural Language Processing Group.
Cambridge University Press, 07 Apr. 2009. Web. 09 Dec. 2015.
14
Tai, Kai S. "CS229 Final Project Sentiment Analysis of Tweets: Baselines and Neural
Network Models." (n.d.): n. pag. Stanford University, 13 Dec. 2013. Web. 12 Nov.
2015.
Yeole, Ashwini V., P. V. Chavan, and M. C. Nikose. "Opinion Mining for Emotions
Determination." Innovations in Information, Embedded and Communication
Systems (ICIIECS) 2015 International Conference (2015): 15. IEEE Xplore. 20
Mar. 2015. Web. 29 Nov. 2015.
Zhang, Hao, Alexander C. Berg, Michael Maire, and Jitendra Malik. "SVMKNN:
Discriminative Nearest Neighbor Classification for Visual Category Recognition."
(n.d.): n. pag. Web. 8 Dec. 2015.
Sources and Outside Libraries ● Twitter API ● GoogleMaps API ● Tweepy ● Scikitlearn ● AmMap
15