Embed Size (px)
Citation preview

125
ANALYZING THE PERCEPTIONS OF TURKISH UNIVERSITIES USING MULTIDIMENSIONAL SCALING (MDS) ANALYSIS
ULAŞ AKKÜÇÜK* SELİN KÜÇÜKKANCABAŞ**
Boğaziçi University Boğaziçi University
ABSTRACT
With the number of public and private universities in Turkey increasing and with the selection mechanisms offering ever more increased freedom of choice to prospective students, it is becoming important to analyze how students perceive differences among the most preferred Turkish universities. Education marketers may use perceptual maps either to see the current state of the market or to plan for new product launches (in this case, new universities). This paper analyzes the perceptions of the ten most preferred Turkish universities as judged by undergraduate students at universities around Turkey. The Multidimensional Scaling (MDS) technique is used to come up with a perceptual map of the ten most preferred Turkish universities in management education, after obtaining data in the form of similarity judgments, attribute ratings and preference ratings from the respondent students. Additional analyses are performed to attribute meaningful names to perceptual map dimensions, and also to determine the ideal point of the perceptual map. The results indicate that the three private universities plus Galatasaray University form a distinct cluster on their own, while the other six public universities are separated into two distinct groups occupying unique positions in separate quadrants of the perceptual map. It is also found that the ideal point indicates the direction of Boğaziçi University, ODTÜ and İTÜ.
Key Words: Turkish universities, perceptual mapping, Multidimensional Scaling, ALSCAL, PROFIT, PREFMAP.
TÜRK ÜNİVERSİTELERİNİN ALGILAMALARININ ÇOK BOYUTLU ÖLÇEKLENDİRME (MDS) ANALİZİ İLE İNCELENMESİ
ÖZET
Giderek artan kamu ve özel üniversite sayısı ve öğrencilerin seçim yapmasında getirilen esneklikler, öğrencilerin üniversiteler arasındaki farkları nasıl gördüklerinin incelenmesini önemli kılmaktadır. Eğitim pazarlamacıları algısal haritaları kullanarak piyasanın mevcut durumunu anlayabilir ya da yeni ürünlerin (yeni üniversitelerin) nasıl konumlandırılması gerektiğine karar verebilirler.
Boğaziçi Journal Vol. 21, no. 1-2 (2007), pp. 125-141.
* UlaşAkküçükisanAssistantProfessorintheDepartmentofManagementatBoğaziçiUniversity,34342,Bebek,Istanbul,Turkey.E-mail:[email protected]
** SelinKüçükkancabaşisaResearchAssistantintheDepartmentofManagementatBoğaziçiUniversity,34342,Bebek,Istanbul,Turkey.E-mail:[email protected]

126
Bu makalede işletme eğitiminde en çok tercih edilen on Türk üniversitesinin, Türkiye’de çeşitli üniversitelerde okuyan öğrenciler tarafından nasıl algılandığını çok boyutlu ölçeklendirme (MDS) yöntemi ile incelenmiştir. Öğrencilerden, üniversitelerin birbirine yakınlığı ile ilgili veri toplandıktan sonra, çok boyutlu ölçeklendirme tekniği kullanılarak üniversitelerin algısal haritasına ulaşılmıştır. Farklı bazı teknikler kullanılarak ise MDS sonucu ortaya çıkan boyutlara anlamlı isimler verilmiş ve “ideal” üniversite noktası bulunmuştur. Sonuçlar göstermiştir ki üç özel üniversite ve Galatasaray Üniversitesi birbirine yakın bir küme oluştururken, diğer altı kamu üniversitesi üçerli gruplar halinde farklı yerlerde konumlanmıştır. Ayrıca bulunan ideal noktanın Boğaziçi Üniversitesi, ODTÜ ve İTÜ’nün bulunduğu noktalar yönünde olduğu görülmüştür.
Anahtar kelimeler: Türk üniversiteleri, algısal haritalama, çok boyutlu ölçeklendirme, ALSCAL, PROFIT,
PREFMAP.
Facingagrowingcompetitiveenvironment,highereducationinstitutionshavedramaticallyincreasedtheireffortsinrecruitingandretainingstudentsandprovidinghighqualityservice.Universitiesaremobilizingalloftheirresourcesforrecruiting,suchaschangingtheirfinancialaidpoliciestoallowstudentsfromlow-incomefamiliestoenroll,andupdatingtheircampusestobecomemorediverseandattractive,asthesearewhathighschoolseniorsandtheirparentsexpect(Dominoetal.,2006).Theeducationalinstitutionneedstomaintainordevelopadistinctimagetocreateacompetitiveadvantageinanincreasinglycompetitivemarket.
ThestatementbyKeever(1998),“Createanimageforyourcompanyoryourcompetitorswilldoitforyou,”isequallyrelevanttothehighereducationsector.Institutionsarebecomingmoreaggressiveintheirmarketingactivitiesandneedtobeclearabouttheirpositioningandtheimagetheywishtoconveytotheirpublic(RussellandMarilyn,2005).
In order for institutions to understand how customers review their products in relation to otherproductsinthemarket,anumberofmultivariatetechniquesfordatavisualizationcanbeused.Thesevisualizationtechniquesgivedecisionmakersasnapshotofhowthecustomersseeproducts(inthiscase,universities)relativetooneanother.MultidimensionalScaling(MDS)isonesuchvisualizationtechnique among other exploratory techniques used to study the interdependence of a number ofvariablessuchasFactorAnalysis,ClusterAnalysisandCorrespondenceAnalysis(Hairetal.,1998).ObtainingperceptualmapsbyMultidimensionalScalingisacommonlyusedmarketingpracticetoshowhowbrandswithinaproductcategoryaresimilartooneanotherandhowtheydifferfromotherbrands(Parasuramanetal.,2004).
InMDS the objective is to convert consumer judgments of similarity (or dissimilarity) betweenobjectsintodistancesrepresentedinmultidimensionalspace(Hairetal.,1998).Thereareanumberofmethodsforhowdatacanbeobtainedorconvertedtoasimilarity(ordissimilarity)measure.Insomecasesdatamaybeoriginallyintheformofsimilaritiesordissimilarities.Agoodexampleisstore-switchingdata(BucklinandLattin,1992).AnotherwidelycitedexampleisMorseCodeconfusiondata(Rothkopf,1957).
Anothermethodwouldbe toobtainsimilarity judgments in the formofasimilarity rating (inourcasewe use a rating scale between one and seven, one corresponding to least similar and sevencorrespondingtomostsimilar)byaskingrespondentstorateallpossiblepairs.Hence,forthethree

127
objectsQ,W,andEwewouldaskthreesimilarityratingsQW,QEandWE.Athirdmethodwouldbetoderivethedissimilarityorsimilaritymeasure(suchascorrelationorEuclideandistance)fromanotherdataset.Supposeweaskrespondentstorateobjectsbasedonanumberofattributes,computeEuclideandistancesbetweentheobjectsusingtheattributeratings.WewillhaveeffectivelyderivedadissimilaritymeasurethatcouldbeusedasinputtotheMDSanalysis.
Ifdirectdissimilaritiesarenotavailable,webelieve thesecondapproach is themostdesirable. InHair’s(1998)words“…thederivedmeasureistheleastdesirableinmeetingthespiritofMDS–thattheevaluationofobjectsbemadewithminimalinterventionbytheresearcher.”Inderivedmeasures,theresearcher’sattributesmaynotbethecorrectones,andsecond,thereisnostraightforwardrecipefor thedissimilaritymeasurechosenforconversion(correlation,squaredEuclideandistance,City-Blockdistance,etc.).Wehavethuschosentocollectdissimilaritiesdirectlyfromtherespondents.TheattributeratingscollectedaresolelyforthePROFITanalysistofollow.
ThedetailsofthedifferentMDSalgorithmswillnotbeprovidedhere.Foraconcisetreatment,readersarereferredtoLattinetal.(2003).Inthispaperwewill trytoshedlightonhowTurkishstudentsperceivedifferentuniversitiesbytheuseofaparticularMultidimensionalScaling(MDS)algorithmknownasALSCAL(1)andanumberofothercomplementarytechniques(PREFMAPandPROFIT,(2) enablingustointerpretMDSsolutionsmoreaccurately.InusingthecomplementarymethodPROFITwewillusetheimportancecriteriaasidentifiedinthepreviousliteratureonthisfield.
Thepaperwillproceedasfollows:Inthenextsection,wewillexplaintheresearchdesignintermsof sampledetermination and characteristics, the selectionof theuniversities to be included in theperceptualmap,theselectionofattributesusedinthePROFITanalysisandthequestionnairedesign.Subsequently,wewillprovidetheresultsintermsofperceptualmapsandcertainnumericalmeasuresfromtheMDSalgorithmALSCALandthecomplementarymethodsPROFIT(toattributemeaningtoMDSdimensions)andPREFMAP(tofindtheidealpoint/vectorinthesameMDSspace).Finally,wewillpresentadiscussionoftheresultsandfuturedirections.
RESEARCHDESIGN
Sample
Oursampleconsistedof594studentsstudyingatdifferentuniversitiesinTurkey.Thesamplewasmainly a convenience sample; however, it wasmade sure that the views of any one university’sstudentsdidnotdominatethesample.Tobemorespecific,405ofthe594studentswerestudentsofthe10universitiesinquestioninthisstudy.ThemaximumnumberofstudentscamefromBoğaziçiUniversitywith13.5%,andthesecondlargestgroupwasİTÜstudentsat13.1%.Alltheothergroupsfell below10%.Also, therewere a total of52universities represented in the sample. In termsofgender,267respondentswerefemaleand327weremale.Intermsofthehighschoolsfromwhichthestudentsweregraduated,apredominantpercentagewereAnatolianHighSchools(322respondents),thesecondlargestwereScienceHighSchools(100ScienceHighSchoolsand14PrivateScienceHighSchools),thethirdlargestwerePrivateHighSchools(89respondents)andthelastwereStateHighSchools(69respondents).

128
Selection of Objects (Universities) to be Plotted on the Perceptual Map
The total number of universities in Turkey is currently 83, comprising 58 public and 25 privateuniversities(YÖK,2007).Askingpairwise judgmentsfromtheentiresetofpairswouldentail therespondentstoanswer3403questions.Thisisobviouslynotfeasibleandmanystudentswouldnotbefamiliarwithavastmajorityofthe83universities.Inordertoreducethenumberofuniversities,weusedtheresultsofthe2005UniversityEntranceExaminationintermsofthenumberofstudentsuniversitiesreceivedfromthetop500.Generally,themoreprestigiousuniversitiesreceivealargernumberfromthe top500.The tenuniversities,BoğaziçiUniversity,HacettepeUniversity,BilkentUniversity,ODTÜ,SabancıUniversity,KoçUniversity,İstanbulUniversity,GaziUniversity,İstanbulTechnicalUniversityandGalatasarayUniversity,altogetherreceived489studentsoutofthe500intheequallyweightedpoints.Wedecidedthatthissmallgroupofuniversitieswouldhavebeeninthehighlycompetitivesetofschoolsfromwhichcompetitivestudentswouldbemakingtheirselections.
Choice of Attributes to be Used in the PROFIT Analysis
Studentsareveryseriousandcarefulwhenchoosingauniversitytoattend.Whentheymakedecisionsabout attending university, and ultimately what university to attend, they consider factors muchdifferentlythanhowpreviousgenerationsdid,suchaseconomic,academic,geographic,cultural,andevenpoliticalfactors(St.Johnetal.,2005;TeachmanandPaasc,1998;WilsonandWilson,1992;Zuker,2006).Ifuniversitiesaretosatisfystudents’requirements,theymustbeawareoftheirownofferingsandhowtheseareperceivedinthemarketplace.Knowingthoseinfluentialfactorsandtheassociatedimpactonpotentialstudentsisimportantforinstitutionalpolicymakers.
Previousstudieshaveattemptedtodeterminewhatfactorshavethegreatest influenceonstudents’universitychoice.Inaspecificcasestudy,Hanson,NormanandWilliams(1998)reportedthatthethreemostimportantpositivefactorsforstudentsinchoosingtheuniversityinwhichtheywillenrollwereitsnationalacademicreputation,thequalityofeducationalmajorsavailableandtheprestigeoftheuniversity.Other factors thatpositively influencestudents’decisionswerequalityof facilities,varietyofmajors,degreeofacademiccompetition,socialclimateofthecampus,qualityoffaculty,qualityofsociallifeandthedistancetheuniversityisfromhome.
Zuker (2006), theVicePresidentandDeanofStudentServicesat theUniversityofDallas,basedon his personal experience and interactionwith the students and their parents, summarized sevenimportantfactorsthathighschoolstudentsshouldconsiderwhenchoosingauniversity.Thesesevenfactorsare thesizeof theuniversity, the locationof theuniversity, theacademicenvironment, thesocial environment, themajors, the extracurricular activities (e.g., drama,debate, journalism, clubsports,studentgovernment),andthecosts.
MazzarolandSoutar(2002)conductedasurveyamong879studentsatAustralianuniversitiesandfoundthatthemostimportantfactorswerethequalityandreputationoftheuniversityandtherecognitionof the institution’s qualifications in their own country. Jackson (1982) noted that studentswouldremovethealternativesonthebasisofgeographic,economicandacademicfactorswiththeevaluationprocessbeingaffectedbyfamilybackgrounds,socialcontextsandacademicexperiences.Chapman(1981)statedthatuniversitychoicewasinfluencedbystudentcharacteristics(socio-economicstatus,aptitude,levelofeducationalexperiencesandhighschoolcapabilities)aswellasexternalmotivations

129
(influenceofsignificantpersonnel,thefixedfactorsofaninstitutionandtheinstitution’scapabilitiesofcommunicatingwithpotentialstudents).Location,costs,campusenvironment,andtheavailabilityofdesiredprogramswereincludedasrelativelyfixeduniversitycharacteristics.
PreviousworkintheUKconfirmedthatcoursespecifics(content,structure,methodofassessmentofthedegreeprogram)wasthemostpopularlystatedattribute,followedbylocation(distancefromhome,rural/urbanplace,atmosphereofthecampus,facilitiesofthecity/townoftheuniversity)andreputationoftheuniversity(leaguetables,recognizednameordepartment,“old”redbrickuniversities in comparison to “new” universities) (Moogan et al., 1999). For example, somestudentsmightbewillingtochooseauniversitywithanunfavorablelocation(toocloseortoofarfromhome,tooruralortoourban,toobusyortooquiet),inexchangeforamoreappropriatecourse(moreinteresting/relevantmodules,varietyofassessment,inclusionoffieldtrips)whichhadabetterreputation(moreestablisheduniversity) (Mooganetal.,2001).
Gorman(1976)madeadistinctionbetweentheuncontrollablefactorsofhighereducationprovisionsuchaslocationandcontrollablefactorssuchasacademicreputationwherehighstandardscouldbeestablishedandmonitored.Gormanreportedthatlocationandsizewerethecriteriamostfrequentlyused in deciding which university to attend. Reputation for academic quality was of secondaryimportance.
Inthisstudywechosetousefiveattributes,theseare:Theprestigeoftheuniversity1.Qualityofthefacilities2.Qualityofthefaculty3.Qualityofsociallifeandextracurricularactivities4.Thelocationoftheuniversity5.
Questionnaire Design
Thequestionnaireisorganizedinfourparts.Thefirstpart(PartA)askstherespondentstoratethesimilarityofapairofuniversitiesonascale fromone toseven,wheresevencorresponds tomostsimilarandonecorrespondstoleastsimilar.Since10universitiesareselected,thisrepresents45(n(n-1)/2wherenisequaltothenumberofobjects)pairwisesimilarityjudgmentstobecompletedbytherespondents.Thesecondpart(PartB)containsquestionsaboutparticularattributesthathavegenerallybeenusedtoidentifyuniversities,asexplainedintheprevioussection.Inthisparttherespondentsratethe10universitiesonascalefromonetoseven(onebeingverybadandsevenbeingverygood)basedontheaforementionedfiveattributes.Inthethirdpart(PartC)thestudentsareexpectedtoprovidearankorderofthe10universitiesintermsofpreference.Finally,thestudentsansweranumberofdemographicquestions includinggender,and typeofhighschoolgraduated.Thesixcategoriesofdifferent high schools includeAnadoluLisesi (AnatolianHighSchool), FenLisesi (ScienceHighSchool),ÖzelFenLisesi (PrivateScienceHighSchool),ÖzelLise (PrivateHighSchool),DevletLisesi(StateHighSchool),Other(Foreign,VocationalSchool,etc.).Finally,thestudentisaskedtoidentifyatwhichuniversityhe/sheisstudying.Thisparticularvariableisimportantaswedonotwantthesampletobedominatedbymembersofaparticularuniversity.

130
RESULTS
Common Two-Dimensional Space as Seen by the Average University Student
Inordertoseethecommonspaceasseenbytheaveragestudent,the594responsesfromthestudentswereaveragedinordertogetanaveragevalueofperceivedsimilaritybetweentheuniversities.Table1showstheaverageperceivedsimilaritiesbetweentheuniversitiesinthelowerrectangularformat.
Table 1Average Perceived Similarity between Universities
Hct İst Odt Itu Gz Bou Bil Koc Gs
İst 3.68Odt 3.85 3.03Itu 3.45 3.58 4.87Gz 3.95 4.00 3.03 2.83Bou 3.38 3.28 4.83 4.36 2.70Bil 3.63 3.10 4.31 3.82 2.94 4.52Koc 3.39 3.05 3.98 3.77 2.58 4.38 4.85Gs 3.54 3.25 3.79 3.65 2.89 4.47 4.22 4.24Sab 3.23 2.96 3.95 3.75 2.73 4.51 4.93 5.35 4.32
Allofthe45possiblepairsarepresentedhere.ThelowestsimilarityisbetweenKoçandGazi(2.58)and the highest is betweenKoç andSabancı (5.35). In order to get a two-dimensional perceptualmapoftheuniversitiesasseenbythestudents,ALSCAL(YoungandHarris,1990)program(apartofSPSS13.0dataanalysispackage)wasused.SinceALSCALonlyacceptsdissimilaritiesandourdata is originally similarities, the seven-point scalewas reverted such that seven corresponded tomostdissimilarandonecorrespondedtomostsimilar.Afterthisnecessarytransformation,ALSCALwasusedtoobtainatwo-dimensionalsolution.TheresultingmapisgiveninFigure1.Inthismapthefollowingmnemoniccodesareusedinplaceoftheuniversities’fullnames:Bou(Boğaziçi),Bil(Bilkent),Hct (Hacettepe),Odt (ODTÜ),Koc (Koç), Sab (Sabancı), Ist (İstanbulUniversity), Itu(İstanbulTechnicalUniversity),Gz(GaziUniversity),Gs(GalatasarayUniversity).
Figure 1Two-dimensional Perceptual Map of Average Similarities
131
Itisevidentheretheprivateuniversitiesformadistinctgroupatthetopleftcornerofthemap,whilethesixpublicuniversitiesarescatteredacrossdifferentareasofthemap.AlthoughGalatasarayisapublicuniversity, it is locatednear the threeprivateuniversities.Thepublicuniversities formtwogroups:OnegroupinthelowerleftquadrantconsistingofİTÜ,ODTÜandBoğaziçiandtheothergroup located toward therightof thegraphconsistingofGazi,Hacettepeandİstanbul.Hacettepe,whichisactuallyfoundtobeverydissimilarfromallotheruniversities,occupiesadistinctlocationin the lower right quadrant. The closest universities areGazi and İstanbul; howeverHacettepe issomewhatmoredistantthanthegroupcontainingtheGazi-İstanbulpair.
Thenextsectionoutlinesamoreformalapproachinnamingthedimensions,butevenwithoutanymathematical analysis, an examinationof the twodimensionsmay reveal some insights.The firstdimensionmaybeaprivate-publicdimension(fromleft to righton thisdimension:Sabancı,Koç,Bilkent,Boğaziçi,Galatasaray,ODTÜ,İTÜ,Hacettepe, İstanbul,Gazi). Boğaziçi isplacedclosertoprivateuniversitieson thisdimension,perhapsowing to itspast as anAmericanprivatehighereducationinstitution(RobertCollege)inthenearpast.Theseconddimension(fromuptodowninthisdimension:Galatasaray,İstanbul,Sabancı,Koç,Gazi,Bilkent,Hacettepe,Boğaziçi,ODTÜ,İTÜ)maysomewhatreflectthesocialsciencesversusengineeringorientations.Itmayalsorepresentuniversitysize (in termsofnumberofprogramsofferedandnumberof students)and/orhowestablished theuniversityis(withtheupperpositionspertainingtoneweruniversities).Someexceptionsclearlystandouthere,forexample,İstanbulUniversityiswellestablishedandlargebutisontheupperpositions.
Manyinterpretationscanbemaderegardingtheperceptualmapandtheseinterpretationsareonlytheinitialthoughtsoftheauthors.Itisalsoworthwhiletopointoutanyreflection,rotationortranslationofthepointswouldnotchangetheEuclideandistances,andhencewouldgiveessentiallythesamesolution. Interpretationaftersucharotationmaybemoremeaningful.ThePROFITmethod, tobedescribed shortly, does not suffer from this problem as the attributes are plotted as vectors. Therotationwouldnotalterthelocationsoftheuniversitieswithrespecttothevectors.Anothernoteisthatthedimensionalityusedhereistwo,differentdimensionalitiescanalsobeused,andplotscanbegeneratedcomparingpairsofdimensions.threepossibleplotsinthecaseofthreedimensionsandsixpossibleplotsinthecaseoffourdimensions.Thesesolutionsmayalsoleadtodifferentinterpretationsofthedimensions.Thetwo-dimensionalsolutionwillbepresentedhereandlaterthethree-dimensionalsolutionwillalsobepresented.
Thefitofthesolutionisgenerallygood,althoughitcannotbeclassifiedasaperfectorexcellentfit.Thereareanumberofwaysofdetermininghowwellthetwo-dimensionalsolutionsuitstheaveragesimilaritiescalculatedfromthe594subjects(Table1).Thescatterplotofdistancescalculatedfromthe solution given inFigure 1 against the dissimilarities used as input to theALSCALprocedure(generallycalled“disparities,”thesewouldbethevaluesgiveninTable1,exceptthescaleisreversed).ThesmoothnessofthegraphgiveninFigure2indicatesgoodfit.Thissmoothnessisalsocapturedby the square of the correlation between the disparities and the distances. This value, termedR2,indicateshowmuchofthevariationinthedisparitiesisexplainedbythedistancescalculatedfromtheconfigurationfoundbytheMDSprocedure.TheR2valuehereis73.94%,whichisreasonablyhigh.

132
Therearetwoothermeasures,oftencalled“badnessoffit”functions(KruskalandCarroll,1969),aslowervaluesindicatebetterfit,namelyKruskal’sSTRESSformula1(Kruskal,1964a,1964b),andYoung’sSSTRESS(themeasurethatALSCALprogramtriestominimize).Forbothmeasures“0”representsperfectfit.SSTRESSinthisstudyturnsouttobe0.34whileSTRESS1turnsouttobe0.31.STRESS1valueisclassifiedas“poor”fitaccordingtoKruskal’sruleofthumb(Lattinetal.,2003).Thesevaluesimproveasmoredimensionsareused.Tobemorespecific,thethree-dimensionalsolutionhasSTRESS1of0.18595andthefour-dimensionalsolutionhasaSTRESS1of0.14222.TheR2valuesalsoriseto82.31%and84.92%,respectively.InthissectionandthesubsequenttwosectionsusingPROFITandPREFMAPweprefertousethetwo-dimensionalsolution;however,laterwewillalsopresentthethree-dimensionalsolution.
Attributing Meaning to Dimensions Using the PROFIT Approach
Althoughitispossibletoattributemeaningfulnamestothecoordinateaxesbasedonpureinspectionandjudgment,itisalsopossibletouseanswerstoPartBofthequestionnaireandexaminethecorrelationsbetweencoordinatevaluesandratingsoftheuniversitiesonthefiveattributes.Table2providestheaverageratingsofthe10universitiesonthefiveattributes.Table3providesthecorrelationsoftheattributeratingswiththestimuluscoordinates(MDSgeneratedcoordinates).FromTable3wecanseethatalltheattributesarenegativelycorrelatedwithbothofthedimensions.Hence,negativevaluesonbothdimensionsmeanhigherattributeratings.
ThecomputerprogramPROFIT–shortforpropertyfitting–(ChangandCarroll,1989b)ishelpfulin determiningdimensions that are highly correlatedwith the attribute ratings. It employs amoresophisticatedtechniquethantheoneexplainedabove.PROFITtakesthecoordinatevaluesfromtheALSCALoutputand theaverageattribute ratingson thefiveattributesas input.Theoutput is the“directionalcosines”oftheattributes.ThesearepresentedinTable4.Ascanbeseen,thevaluesareveryclosetothecorrelationsreportedinTable3,buttherearesomedifferences.Thehighestvaluesforthefirstdimensionarequalityoffacilitiesandqualityofsociallife.Asfortheseconddimension,
Figure 2Distances vs. Disparities

133
thehighestvaluesareprestigeandlocation(asthesearenegative,thelowervaluesonthesecoordinateaxiscorrespondtohigherratingsontheattributes).Figure3providesaplotoftheoriginalstimuluscoordinatesandthedirectionalvectors.Thedirectionsofthefivevectors(qualityofsociallife,qualityofthefaculty,prestige,location,andqualityoffacilities)aretowardsthethirdquadrant(thequadrantinwhichBoğaziçi,ODTÜandİTÜarelocated).
Table 2Average Attribute Ratings of the Universities
prestige facilities faculty social location
Hct 4.54 4.38 4.50 3.96 3.82İst 4.10 3.79 4.02 3.82 4.39
Odt 6.13 5.67 5.76 5.44 4.77Itu 5.33 5.09 5.22 4.62 5.12Gz 3.26 3.32 3.42 3.29 3.61
Bou 6.38 5.91 6.04 6.25 6.36Bil 5.64 5.58 5.50 5.47 4.72
Koc 5.22 5.41 5.29 5.28 4.05Gs 5.48 5.12 5.24 5.15 6.03Sab 5.37 5.54 5.40 5.14 3.30
Table 3Correlations between Average Attribute Ratings and Dimensions
d1 d2
prestige -0.84 -0.41facilities -0.93 -0.30faculty -0.90 -0.37social -0.90 -0.21location -0.35 -0.27
Table 4PROFIT Output: Directional Cosines of Fitted Vectors
d1 d2
prestige -0.86 -0.51facilities -0.93 -0.35faculty -0.90 -0.44social -0.96 -0.27
location -0.72 -0.69

134
Preference Scaling Using PREFMAP
ThecomputerprogramPREFMAP(ChangandCarroll,1989a)takespreferencedataandthestimuluscoordinates obtained from anMDS analysis as input, and provides the “ideal point” in the samecoordinatespaceasoutput.Hence,theso-called“idealuniversity”canbevisualizedintermsofthecoordinatespacealreadygeneratedfortheperceptualmapoftheuniversities.ThisanalysisneedstheALSCALoutputalreadydiscussedandtheaveragepreferencevaluesforeachuniversitycomputedfromtheanswerstoPartCofthesurveyasinput.Theaveragepreferencevaluesfortheuniversitiesaregiven inTable5. It is seenhere thatBoğaziçihas thehighestaveragepreferencewitha largedifference.ODTÜ,Bilkent,İTÜ,Koç,Sabancı,Galatasaray,Hacettepe,İstanbul,andGazifollow.
Table 5Average Preference Values of Universities
Preference Rank
Hct 7.00 8İst 7.42 9
Odt 3.82 2Itu 4.94 4Gz 8.91 10Bou 2.27 1Bil 4.76 3Koc 5.14 5Gs 5.30 7Sab 5.22 6
ThereareanumberofdifferentmodelsthatPREFMAPusestodisplaytheidealpointsrelativetotheMDSproducedcoordinates.Ofthese,the“vector”model,assumesthattheidealpointisatinfinityandproducesavectorwhichpointsattheidealpoint.Sothedirectionoftheidealpointvectorindicatesthedirectionsalongtheaxesthatproduceanimprovementinpreference.Theidealpointvectorin
Figure 3Direction Vectors of Attributes and Universities (PROFIT)

135
ourcaseisfoundtobe(-0.2690,-0.9631).Theplotofthevectorandtheoriginalobjectcoordinatesare provided in Figure 4.Hence, negative direction in the first axis results in a better evaluationofpreferenceandsimilarlynegativedirection in thesecondaxisalsoresults inabetterpreferencerating.Movementinthesecondaxisresultsinagreaterchangeinthepreferencethananequivalentmovementinthefirstaxis.
Higher Dimensional Solutions and Dimensionality Selection
Asindicatedearlier,whiletwo-dimensionalsolutionsaregenerallypreferableandeasytoobtainasanoutputofcomputersoftware,higherdimensionalsolutionscansometimesleadtobetterresults.This is easily portrayed in the plot of the SSTRESSvalues against dimensionality andR2 againstdimensionalitygiveninFigures5and6,respectively.
Figure 4Universities and Ideal Point Vector (PREFMAP)
Figure 5SSTRESS against Dimensionality (1 to 4)

136
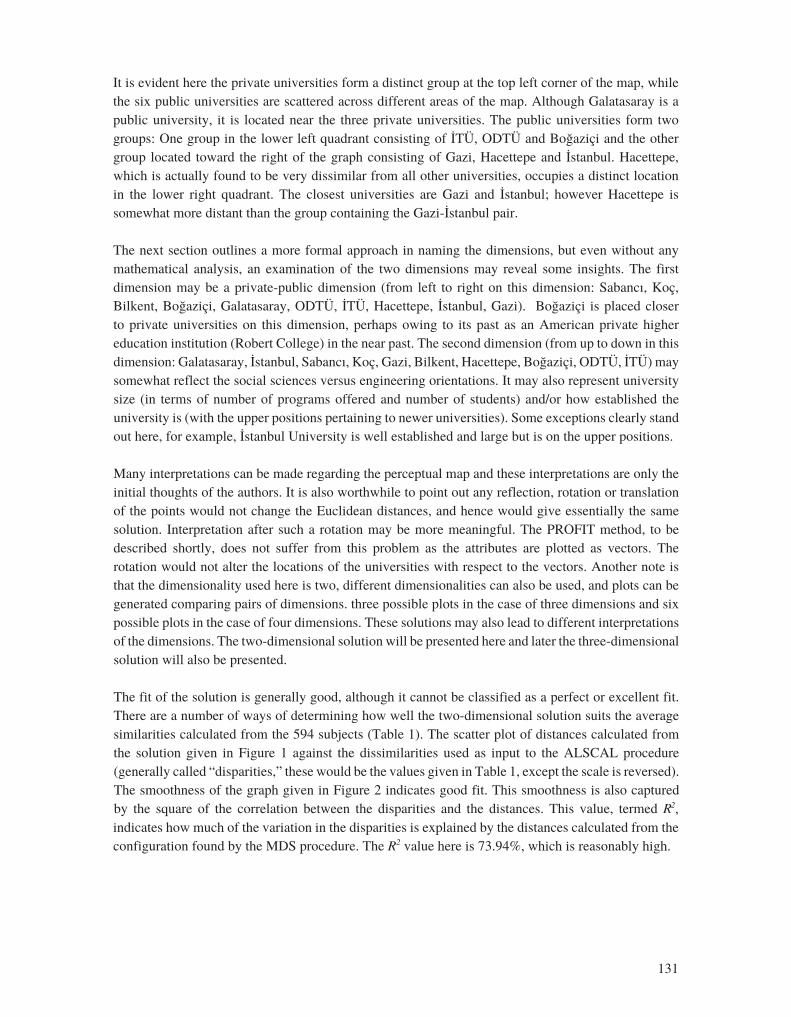
Asseenintheseplotsamajorincrease(ordecrease)isfollowedbysmallerincreases(ordecreases)inthemeasuresoffit.Amajorchangehappenswhenweincreasedimensionalityfromonetotwo,butrelativelysmallerchangeshappenaswemovefromtwotothreeandthreetofourdimensions.ThisisgenerallythecaseinMDSsolutionsasdimensionalityisincreased.Thechoicemustbemadesuchthattheincreasedcomplexityinthesolutionisjustifiedbytheadditionalgaininfit.Inourcasethethree-dimensionalsolutionmayalsobeworthvisualizing.SPSSdoesgiveathree-dimensionalplot,whichisprovidedinFigure7.However,theseparatetwo-dimensionalplotsaremoreuseful.Weneedthreeplotsheretoaccountforallpairsofdimensions.Figures8to10depictthepairwiseplotsforthethree-dimensionalsolution.Uponinspectionofthefirstplot(Figure8–Dimension1andDimension
Figure 6 R2 against Dimensionality (1 to 4)
RSQ
0
0,1
0,2
0,3
0,4
0,5
0,6
0,7
0,8
0,9
1 2 3 4
Figure 7 SPSS Generated 3-Dimensional Plot
Dimension 31,5
1,0
0,5
0,0
-0,5
-1,0
Dimension 1
210
hct
gzDim
ensi
on
2
2,0
1,5
1,0
0,5
0,0
-0,5
odt
bil
itu
ist
koc
sab
bou
gs
-1,5
-1,0
-1
Figure 6R2 against Dimensionality (1 to 4)
Figure 6 R2 against Dimensionality (1 to 4)
RSQ
0
0,1
0,2
0,3
0,4
0,5
0,6
0,7
0,8
0,9
1 2 3 4
Figure 7 SPSS Generated 3-Dimensional Plot
Dimension 31,5
1,0
0,5
0,0
-0,5
-1,0
Dimension 1
210
hct
gzDim
ensi
on
2
2,0
1,5
1,0
0,5
0,0
-0,5
odt
bil
itu
ist
koc
sab
bou
gs
-1,5
-1,0
-1
Figure 7SPSS Generated 3-Dimensional Plot

137
2), it is readilyevident that this isverysimilar to the two-dimensionalsolutiongiven inFigure1.However,thereseemstobeareflectiononthey-axis.Therelativepositionsoftheuniversitiesremainunchangedandthegroupingsarealsosimilar.Theoriginalinterpretationsoftheaxesstillholdherewiththefirstdimensionrepresentingthepublic-privateandthesecondrepresentingperhapsthesocialscience–engineeringorientations.Thethirddimensionwheninspectedcloselyseemstobeoneoflocation.ThisadditionaldimensionseemstoseparateAnkaraandİstanbul.
Figure 83-Dimensional Plot D1 against D2
Figure 93-Dimensional Plot D1 against D3
138
CONCLUSIONSANDDIRECTIONSFORFUTURERESEARCH
AstheÖSSselectionsystemnowinvolvesmakingaselectionafterone’sscorehasbeendetermined,andasthenumberofpublicandprivateuniversitiesisincreasing,itseemsevidentthatuniversitieswillneedtousemoresophisticatedmarketingtoolsthanever.MDSisatoolthatwillallowhighereducationinstitutionstoseehowthegeneralpublicseestheiruniversitieswithrespecttootherschoolsofferingsimilarprogramsofstudy.
Our study (although it has its limitations) shows a number of important properties of BoğaziçiUniversity.Firstofall,theperceptualmapoftheaverageperceptions(Figure1)showsthatBoğaziçi,togetherwithODTÜandİTÜ,occupiesauniquesegment.Uponcloseexaminationwecanalsoseethat Boğaziçi is somewhere in between prestigious public (İTÜ, ODTÜ) and private universities(Sabancı,Koç,Bilkent).Onemayevenstatethatitisa“public”universitythatisofferingmanyoftheadvantagesofa“private”university.Ifwedividetheperceptualmapintofourquadrants,thelowerleftquadrantisoccupiedbyBoğaziçiUniversity,ODTÜandİTÜ.Thisisalsothequadranttowhichalloftheattributevectorspoint.ItisworthwhiletonoteBoğaziçiUniversityhasgottenthehighestscorefromtherespondentsintermsofallfiveattributes.AlsotheidealpointisdirectedatthelocationofBoğaziçiUniversity,ODTÜandİTÜ.
Onemaysaythatsincetheactualuniversityselectiondecisionismadeat thehighschool level, itmaybemore important to study thehigh schoolgraduating class’ opinions inorder toobtain themostaccurateperceptualmap.Afuturestudycanincludehighschoolseniors’perceptions.Anotherrestrictionofthestudyisthelimitednumberofuniversities.Asimilarstudycanbeextendedtoincludemoreuniversities,maybetheentiresetof83universities.However,thelengthofthetimerequiredtofillthesurveysmaybeprohibitivelylarge.Soperhapsasimilarity/dissimilaritymeasurederivedfromattributescanbeused.Todeterminetheattributes,apretestcanbeconducted.
Figure 103-Dimensional Plot D2 against D3

139
Another improvement to the study can be obtained by the use of Individual Differences Scaling(INDSCAL) (Carroll andChang,1970).Thismethod takes inall theproximitymatricesprovidedbytheindividualsandalsofindsouthowindividualsdifferfromoneanotherintermsofhowtheyperceivethedimensions.Thiscanbecomparedtosomeindividualcharacteristicstogainmarketinginsightsintothevariousgroupsofstudents’perceptions.
NOTES
ALSCALcanbefoundintheSPSScomputerpackageunderAnalyze>Scale>Multidimensional1.Scaling(ALSCAL)
These programs areMSDOS executables andwere run underMicrosoftXP operating system.2.Ifprospectiveusersareinterested,PREFMAPcanbefoundpackagedwiththetextLattinetal.(2003).ForPROFITrefertoSmith(1989).
REFERENCES
Bucklin,R.E.andLattin.J.M.(1992).“AModelofProductCategoryCompetitionamongGroceryRetailers,”Journal of Retailing,68:271-293.
Carroll,J.D.andChang,J.J.(1970).“AnalysisofIndividualDifferencesinMultidimensionalScalingViaanN-WayGeneralizationof‘Eckart-Young’Decomposition,”Psychometrika,35:283–319.
Chang,J.J.andCarroll,J.D.(1989a).“HowtoUsePREFMAP–AProgramthatRelatesPreferenceDatatoMultidimensionalScalingSolutions,”inP.E.Green,F.J.Carmone,andS.M.Smith(eds.),Multidimensional Scaling: Concepts and Applications:303–317.Newton,MA:AllynandBacon.
------ (1989b). “How toUsePROFIT–AComputerProgramforPropertyFittingbyOptimizingNonlinearorLinearCorrelation,”inP.E.Green,F.J.Carmone,andS.M.Smith(eds.),Multidimensional Scaling: Concepts and Applications:318–331.Newton,MA:AllynandBacon.
Chapman, D.W. (1981). “AModel of Student University Choice,” Journal of Higher Education,52(5):490-505.
Domino,S.,Libraire,T.,Lutwiller,D.,Supercynzski,S., andTian,R. (2006). “HigherEducationMarketingConcerns:FactorsInfluenceStudents’ChoiceofUniversities,”6(2):101-111.
Gorman,W.P. (1976). “AnEvaluation ofStudentAttractingMethods andUniversityFeatures byAttendingStudents,”University and University,(Winter),51:220-5.
Hair,J.F.,Anderson,R.E.,Tatham,R.L.,andBlack,W.C.(1998).Multivariate Data Analysis.PrenticeHall.
Hanson,G.R.,Norman,T.,andWilliam,A.(1998).“TheDecisiontoAttendUT-Austin:WhatMakesa Difference?” Available at: http://www.utexas.edit/student/ research/reports/ccweb/CCweb.html[accessedinJune2007].

140
Jackson, G.A. (1982). “Public Efficiency and Private Choice in Higher Education,”Educational Evaluation and Policy Analysis,4(2):237-47.
Keever,S.(1998),“BuildingYourImageonCampus,”Journal of Career Planning and Employment,58(2):42-46.
Kruskal, J.B. (1964a). “Multidimensional Scaling forOptimizing aGoodness of FitMetric to aNonmetricHypothesis,”Psychometrika,29:1-27.
------(1964b).“NonmetricMultidimensionalScaling:ANumericalMethod,”Psychometrika,29:115-129.
Kruskal,J.B.,andCarroll,J.D.(1969).“GeometricalModelsandBadness-of-FitFunctions,”inP.R.Krishnaiah(ed.),Multivariate Analysis,2:639–671.NewYork:AcademicPress.
Lattin, J.M., Carroll, J.D., and Green, P.E. (2003). Analyzing Multivariate Data. Pacific Grove:Brooks/Cole.
Mazzarol, T. and Soutar, G.N. (2002), “‘Push-Pull’ Factors Influencing International StudentDestinationChoice,”The International Journal of Educational Management,16(2):82-90.
Moogan,Y.J.,Baron,S.,andBainbridge,S.(2001),“TimingsandTrade-Offs in theMarketingofHigherEducationCourses:AConjointApproach,”Marketing Intelligence and Planning,19(3):179. Parasuraman, A., Grewal, D., and Krishnan, R. (2004). Marketing Research. Boston: HoughtonMiflin.
Punj.G.N.andStaelin,R.(1978).“TheChoiceProcessforGraduateBusinessSchools,”Journal of Marketing Research,15(4):588.
Rothkopf, E.Z. (1957). “AMeasure of Stimulus Similarity and Errors in Some Paired-AssociateLearningTasks,”Journal of Experimental Psychology,53:94-101.
Russell, M. (2005). “Marketing Education: A Review of Service Quality Perceptions amongInternationalStudents,”International Journal of Contemporary Hospitality Management,17(1):65.
Smith,S.M.(1989).PC-MDS: A Multidimensional Statistics Package.Provo,Utah:BrighamYoungUniversity.
St.John,E.P.,Paulsen,M.B.,andCarter,D.F.(2005).“Diversity,UniversityCosts,andPostsecondaryOpportunity:AnExaminationoftheFinancialNexusbetweenUniversityChoiceandPersistenceforAfricanAmericansandWhites,”The Journal of Higher Education,76(5):545-569.
Teachman, J.D. and Paasch, K. (1998). “The Family and Educational Aspirations,” Journal of Marriage and the Family,(August),60:704-714.

141
Young, F.W. and Harris, D.F. (1990). “Multidimensional Scaling: Procedure ALSCAL,” in J.J.Norusis (ed.),SPSS Base System User’s Guide:396-461.Chicago, IL:SPSSInc.Reprinted inJ.J.Norusis(ed.),SPSS Professional Statistics,(1994):155-222.Chicago,IL:SPSSInc.
YÖK(2007).http://www.yok.gov.tr/universiteler/uni_web.htm[accessedinMay2007].
Zuker, R.F. (2006) “Factors to Consider in Selecting a University.” Available at: http://www.thehighschoolgraduate.com/editorial/DF/factors[accessedinApril2006].
Wilson, P.M. and Wilson, J.R. (1992). “Environmental Influences on Adolescent EducationalAspirations:ALogisticTransformModel,”Youth and Society,24:52-70.