Embed Size (px)
Citation preview
ANALYZING THE IMPACTS OF LAND COVER CHANGE TO THE HYDROLOGIC
AND HYDRAULIC BEHAVIOURS OF THE PHILIPPINES' THIRD LARGEST RIVER
BASIN
J.R. Santillan1,2,*, A.M. Amora1, M. Makinano-Santillan1,2, A.L. Gingo1, J.T. Marqueso1
1Caraga Center for Geo-Informatics, Caraga State University, Ampayon, Butuan City, 8600, Philippines
2Department of Geodetic Engineering, College of Engineering and Geo-Sciences, Caraga State University,
Ampayon, Butuan City, 8600, Philippines – (jrsantillan, mmsantillan) @carsu.edu.ph
Commission III, WG III/10
KEY WORDS: Land-cover change, impact analysis, hydrology, hydraulics, Agusan River Basin, Mindanao
ABSTRACT:
Changes in land cover can have negative impacts on the hydrological and hydraulic processes in river basins and watersheds such as
increase in surface runoff and peak flows, and greater incidence, risk and vulnerability of flooding. In this study, the impacts of land-
cover changes to the hydrologic and hydraulic behaviours of the Agusan River Basin (ARB), the third largest river basin in the
Philippines, was analysed using an integrated approach involving Remote Sensing (RS), Geographic Information System (GIS), and
hydrologic and hydraulic models. Different land-cover classes in the ARB for the years 1995 and 2017 were mapped using Landsat 5
TM and Landsat 8 OLI images. Using a post-classification change detection approach, changes in land-cover were then determined.
The impacts of these changes in land-cover to the to the basin discharge were then estimated using a calibrated hydrologic model based
on the Hydrologic Engineering Center - Hydrologic Modeling System (HEC-HMS) under different extreme rainfall conditions. The
impact of the changes in land-cover to flood depth and extent was also determined using a hydraulic model based on the HEC-RAS
(River Analysis System). Land cover classification results revealed that the ARB is 67.7% forest in 1995 but have decreased to 62.8%
in 2017. Agricultural areas in the basin were also found to have increased from 12.2% to 15.5% in the same period. Other notable land
cover changes detected include the increase in built-up lands and range lands, and decrease in barren lands. HEC HMS and HEC RAS
model simulation results showed that there was an increase in discharge, flood depth, and flood extents between 1995 and 2017,
implying that that the detected changes in land cover have negative impacts to hydrologic and hydraulic behaviours of the ARB.
* Corresponding author
1. INTRODUCTION
Many studies have shown that changes in land cover due to
anthropogenic activities have negative impacts on the
hydrological and hydraulic processes in river basins and
watersheds (Matheussen et al., 2009, Zope et al., 2016, Koneti et
al., 2018). Human-induced modifications that alter the land cover
characteristics such as deforestation, urbanization, and croplands
expansions can change how a river basin responds to rainfall
(Isik et al., 2008), and they have been found to increase surface
runoff and peak flows (Koneti et al., 2018, Guzha et al., 2018).
In most cases, these changes led to greater incidence, risk and
vulnerability of flooding (Bronstert et al., 2002, Gao et al., 2013,
Tarigan, 2016, Zope et al., 2016, Liu and Shi, 2017), which
could bring catastrophic damages to human lives and properties
(Tran et al., 2010). Hence, quantifying anthropogenic activities,
and assessing and understanding its impacts to the hydrologic
and hydraulic behaviours of river basins have become very
important nowadays not only for efficient water resources
planning and management (Koneti et al., 2018), but also for
effective flood mitigation and disaster management
(Petchprayoon et al., 2010, Zope et al., 2016).
Studying the impacts of land cover change on flood behaviour is
considered a complex and time-consuming process because the
factors that determine river flow and flood intensity, e.g., land
cover, vary both spatially and temporally (Petchprayoon et al.,
2010). However, such problems have been overcome through the
application of Remote Sensing (RS) and Geographic Information
System (GIS) technologies together with hydrologic and
hydraulic models. RS‟ capability to provide the most
fundamental information describing the nature and extent of land
cover especially over large areas in an accurate and timely
manner, together with GIS as an efficient tool for spatial data
analysis, have been proven to be effective in characterizing the
patterns, intensity and dynamics of land cover change
(Petchprayoon et al., 2010, Santillan et al., 2011, Thakkar et al.,
2017). On the other hand, hydrologic models (also called
rainfall-runoff models) can be used to simulate the hydrology of
the river basins using rainfall and land-cover information as
important inputs (Nie et al., 2011, Santillan et al., 2011). Using
this model, a river basin‟s response to rainfall in the form of
surface runoff and peak flows can be estimated based on
different landcover conditions, and the model outputs (e.g., flow
hydrographs) are compared to determine the impact of land cover
change (Santillan et al., 2011). The flow hydrographs generated
by hydrologic models for certain land cover conditions can also
be used as inputs into hydraulic models to dynamically simulate
ISPRS Annals of the Photogrammetry, Remote Sensing and Spatial Information Sciences, Volume IV-3/W1 TC III WG III/2,10 Joint Workshop “Multidisciplinary Remote Sensing for Environmental Monitoring”, 12–14 March 2019, Kyoto, Japan
This contribution has been peer-reviewed. The double-blind peer-review was conducted on the basis of the full paper. https://doi.org/10.5194/isprs-annals-IV-3-W1-41-2019 | © Authors 2019. CC BY 4.0 License.
41
the movement of water along the rivers and in the floodplains,
thereby generating spatially-distributed flood depths and extents
(Santillan et al., 2016). The outputs of the hydraulic model for
different land cover conditions can then be subjected to spatial
analysis using GIS to ascertain any changes in flood depth and
extent, where the detected changes, if there are any, may be
attributed to changes in land cover (Zope et al., 2016).
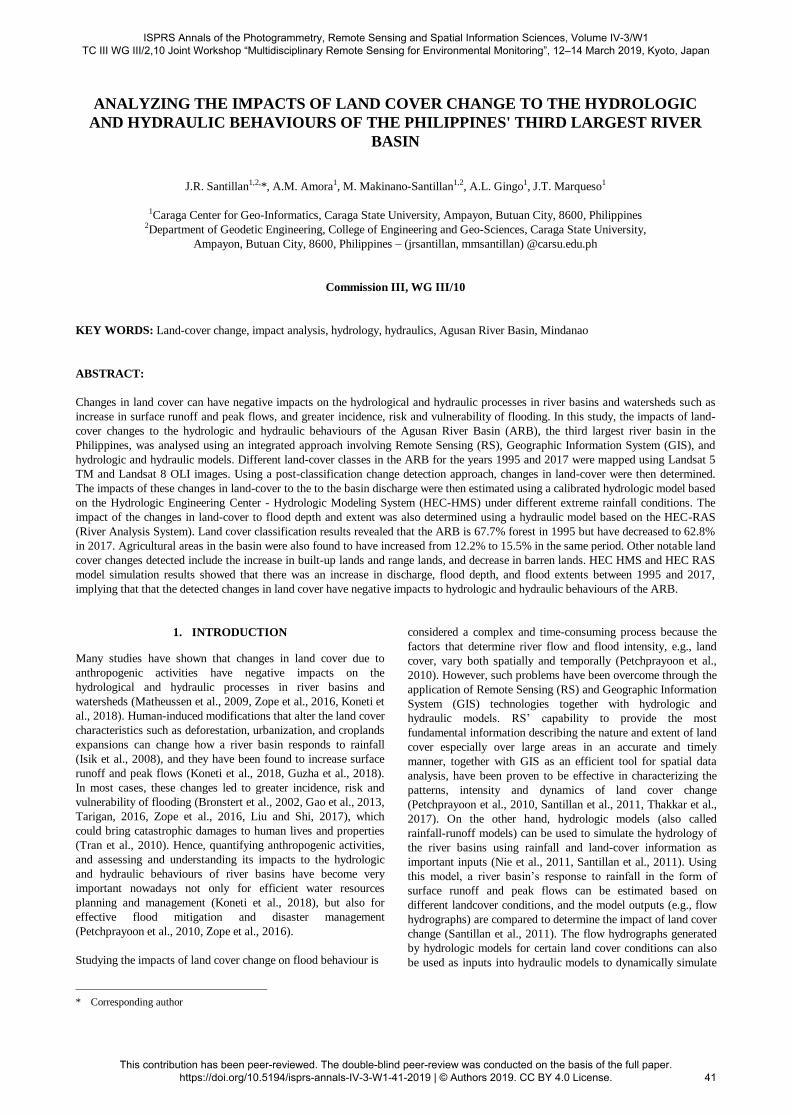
The Agusan River Basin (ARB) is the third largest river basin in
the Philippines (Figure 1), with a drainage area of approximately
10,921 km2, and a main tributary (Agusan River) measuring 350
km long (ADB, 2008). The basin is of great importance due to
its socio-economic contributions that include abundant water
resources, logging, agriculture, and mining. An essential feature
of the ARB is the Agusan Marsh, an extensive floodplain in the
basin where rivers, creeks and tributaries converge and drain
northward to the Agusan River and into Butuan Bay (Primavera
and Tumanda Jr., 2008). The marsh has long been considered to
acts as storage for rain water and reduces the downstream flow of
flood water into population centers situated within the Agusan
River (Ramsar, 1999), particularly Butuan City, a highly-
populated and urbanized city located in the downstream of the
basin. However, recent flooding incidents caused by extreme
rainfall brought about by tropical storms, low pressure systems,
and tail end of a cold front that resulted to fatalities, agricultural
and infrastructure damages around the marsh and in populated
centers (NDRRMC, 2014, NDRRMC, 2017) seem to suggest
that the marsh is no longer functioning as expected. In fact, high
siltation in the marsh due to the deforestation and other
anthropogenic activities, particularly mining, in the watersheds
upstream of the marsh is a problem that remains to be solved
through the years (Ramsar, 1999). Land-use conversions for
agricultural plantation development, particularly rice, oil palm
and banana plantation developments, have also encroached some
of the river basin‟s natural biodiversity and structure (Varela et
al., 2013).
With the increasing presence of anthropogenic activities and
natural changes occurring within the ARB, it is important to
quantify how such activities have modified the basin‟s land-
cover. However, there is a current lack of studies and information
on the spatial extent and dynamics of land-cover in the ARB
through the years. Therefore it cannot be ascertained how such
changes have impacted the hydrologic and hydraulic behaviours
of the basin. Undertaking such studies is of tremendous
importance for purposes of assessing the current status of basin,
and for understanding the impacts of natural changes and human-
induced modifications to the incidence of flooding.
The primary aim of this study is to analyse of the impacts of land
cover changes to the hydrologic and hydraulic behaviours of the
ARB using an integrated approach involving RS, GIS, and
hydrologic and hydraulic models. Using the years 1995-2017 as
the period of analysis, the study specifically aims to (i) map the
different land cover classes in the ARB for 1995 and 2017 using
Landsat images, (ii) detect the changes in land-cover between
these years, (iii) simulate the impacts of the changes in land-
cover to the basin runoff and discharges using a calibrated
hydrologic model based on HEC HMS under different extreme
rainfall conditions, and (iv) simulate the impact of the changes in
land-cover to flood depth and extent using a hydraulic model
based on the HEC-RAS (River Analysis System) under different
extreme rainfall conditions. The year 1995 was considered the
baseline data for the analysis as it can represent the state of the
ARB prior to the implementation of many government laws and
programs such as the Mining Act of 1995 and the National
Greening Program in 2011.
2. METHODS AND MATERIALS
2.1 The Study Area
The analysis is particularly focused on how much change has
occurred in the portions of the ARB that are upstream of Butuan
City (specifically in the upstream of “Dankias Station” as shown
in Figure 1), and how much discharge is generated in the
upstream that flows in the Agusan River towards Butuan City
and Butuan Bay for the two land cover conditions and for
different extreme rainfall conditions. For this study, the
boundary of the ARB was delineated from a 10-m DEM using
watershed delineation tools available in ArcGIS 10.2 software.
This DEM, which was provided by the DREAM Program of the
University of the Philippines-Diliman, was generated from
RADARSAT-2 data gathered during 2012-2013 (Ramirez,
2014). The delineated boundary of the ARB with its outlet
located in Butuan Bay has an area of 12,079 km2 which is larger
than the reported drainage area of 10,921 km2. On the other
hand, the area of the ARB upstream of Dankias Station is
approximately 11,523 km2.
2.2 Land cover mapping and change detection
2.2.1 Landsat images: The land-cover maps for 1995 and 2017
with 30-m spatial resolutions were generated using a total of 23
Landsat images under path 112 and rows 54 and 55 of the
Worldwide Reference System (WRS) where the ARB is entirely
contained. Processing such number of images was necessary in
order address the problem of cloud cover in all available images
of the study area, thereby allowing to substitute or composite
areas having cloud cover (Toure et al., 2018). All images were
downloaded as Standard Terrain Correction L1TP products from
the United States Geological Survey (USGS) Earth Explorer
website (http://earthexplorer.usgs.gov/). Of these, 13 images
acquired by Landsat 5 Thematic Mapper (TM) were utilized for
Figure 1. The Agusan River Basin.
ISPRS Annals of the Photogrammetry, Remote Sensing and Spatial Information Sciences, Volume IV-3/W1 TC III WG III/2,10 Joint Workshop “Multidisciplinary Remote Sensing for Environmental Monitoring”, 12–14 March 2019, Kyoto, Japan
This contribution has been peer-reviewed. The double-blind peer-review was conducted on the basis of the full paper. https://doi.org/10.5194/isprs-annals-IV-3-W1-41-2019 | © Authors 2019. CC BY 4.0 License.
42
deriving the 1995 land-cover map, while 10 images acquired by
Landsat 8 Operational Land Imager (OLI) were utilized to
generate the 2017 land cover map.
For the 1995 land cover mapping, two Landsat 5 TM images (in
rows 54 and 55) acquired on April 12, 1995 have the least cloud
cover and were utilized as the main source for land-cover
mapping of the entire ARB. Missing land cover information in
these images were substituted using information derived from
Landsat 5 TM images acquired on May 30, October 5, October
12, 1995. Some missing data portions that cannot be substituted
using row 54 and 55 1995 images were supplemented using
images acquired on November 3, 1994 and September 21, 1996.
In a similar manner, the main source of land cover information
for 2017 was derived from two Landsat 8 OLI images acquired
on August 30 (row 54) and July 13 (row 55), 2017. Missing data
was supplemented using images acquired on March 23, April 8,
April 24, May 26, June 27, July 13, July 29, and August 30, all
in the year 2017.
The geometric accuracies and co-registrations of the images were
checked using at least 9 ground control points for each image and
using the path 112, row 54 image acquired on April 12, 1995 as
the base image. All images were found to be consistently co-
registered to the base image, with global Root Mean Square
Errors (RMSEs) less than half of a pixel. All the images were
then subjected to radiometric calibration (to generate at-sensor
radiance images) and atmospheric correction (using dark object
subtraction to generate surface reflectance images). Normalized
Difference Vegetation Index (NDVI) images were also derived
from the reflectance images. Finally, for each imagery date, the
reflectance images, NDVI together with a 30-m resolution
Shuttle Radar Topography Mission (SRTM) Digital Elevation
Model (DEM) were layer-stacked into a single file that will be
used as input for image classification. Overall, a total of 23
layer-stacked datasets were produced. Clouds and cloud shadows
were manually digitized from images, and from it a mask band
was prepared to exclude all clouds and cloud shadows during the
classification stage. All image processing and subsequent
analyses were performed using ENVI 5 software.
2.2.2 Image classification: The Maximum Likelihood (ML)
classifier was used to independently classify each of the layer-
stacked image datasets. The goal of the classification is (i.) to
produce land cover maps for assessment of land cover change in
the ARB and as sources for land cover-related parameterization
of the HEC HMS and HEC RAS models. A classification scheme
consisting of seven (7) level 1 classes (agriculture, barren land,
built-up land, forest, rangeland, water, and wetland) based on the
land cover and land use classification system of Anderson et al
(1976) was initially used. Then, each level 1 class were expanded
to into several sub-classes based on their presence in the ARB
except for barren land, built-up land, rangeland, and forest
(Table 1). This resulted to a total of 16 classes for Level 2
classification.
A minimum of 1000 pixels per class were selected for classifier
training except for the “Sago palm” class where only 333 pixels
were selected for the 1995 classifications, and 504 pixels for the
2017 classifications, due to their limited distribution in the ARB.
These Regions of Interests (ROI) were collected through visual
interpretation of the images which was made possible by the
familiarity of the interpreter with the study area, and with the
help of high resolution satellite images in Google Earth. Various
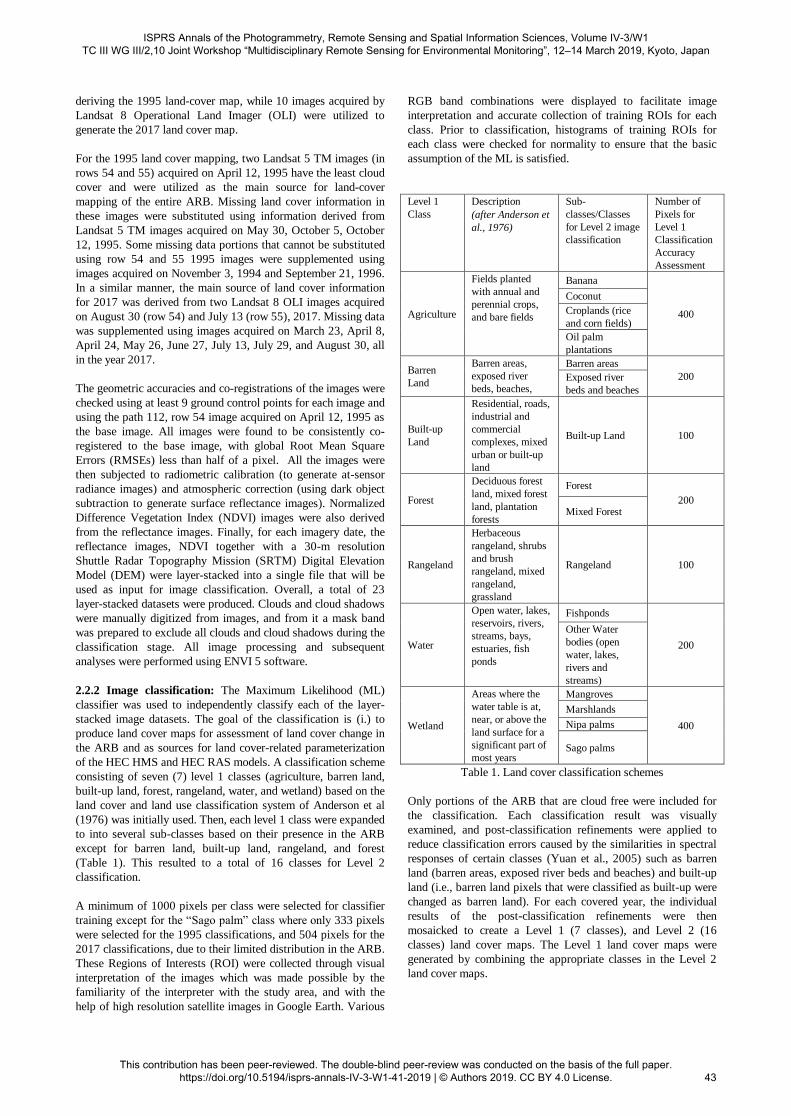
RGB band combinations were displayed to facilitate image
interpretation and accurate collection of training ROIs for each
class. Prior to classification, histograms of training ROIs for
each class were checked for normality to ensure that the basic
assumption of the ML is satisfied.
Level 1
Class
Description
(after Anderson et
al., 1976)
Sub-
classes/Classes
for Level 2 image
classification
Number of
Pixels for
Level 1
Classification
Accuracy
Assessment
Agriculture
Fields planted
with annual and
perennial crops,
and bare fields
Banana
400
Coconut
Croplands (rice
and corn fields)
Oil palm
plantations
Barren
Land
Barren areas,
exposed river
beds, beaches,
Barren areas
200 Exposed river
beds and beaches
Built-up
Land
Residential, roads,
industrial and
commercial
complexes, mixed
urban or built-up
land
Built-up Land 100
Forest
Deciduous forest
land, mixed forest
land, plantation
forests
Forest
200 Mixed Forest
Rangeland
Herbaceous
rangeland, shrubs
and brush
rangeland, mixed
rangeland,
grassland
Rangeland 100
Water
Open water, lakes,
reservoirs, rivers,
streams, bays,
estuaries, fish
ponds
Fishponds
200
Other Water
bodies (open
water, lakes,
rivers and
streams)
Wetland
Areas where the
water table is at,
near, or above the
land surface for a
significant part of
most years
Mangroves
400
Marshlands
Nipa palms
Sago palms
Table 1. Land cover classification schemes
Only portions of the ARB that are cloud free were included for
the classification. Each classification result was visually
examined, and post-classification refinements were applied to
reduce classification errors caused by the similarities in spectral
responses of certain classes (Yuan et al., 2005) such as barren
land (barren areas, exposed river beds and beaches) and built-up
land (i.e., barren land pixels that were classified as built-up were
changed as barren land). For each covered year, the individual
results of the post-classification refinements were then
mosaicked to create a Level 1 (7 classes), and Level 2 (16
classes) land cover maps. The Level 1 land cover maps were
generated by combining the appropriate classes in the Level 2
land cover maps.
ISPRS Annals of the Photogrammetry, Remote Sensing and Spatial Information Sciences, Volume IV-3/W1 TC III WG III/2,10 Joint Workshop “Multidisciplinary Remote Sensing for Environmental Monitoring”, 12–14 March 2019, Kyoto, Japan
This contribution has been peer-reviewed. The double-blind peer-review was conducted on the basis of the full paper. https://doi.org/10.5194/isprs-annals-IV-3-W1-41-2019 | © Authors 2019. CC BY 4.0 License.
43
2.2.3 Classification Accuracy Assessment: The accuracies of
the 1995 and 2017 land cover maps were determined using the
procedures suggested by Congalton (1991) in assessing the
accuracy of land-cover maps with more than 12 classes. An
independent sample of 100 pixels was randomly selected for
each class in the Level 2 land cover maps (total of 1600 pixels).
The actual classes of these pixels were then determined by
overlaying in high resolution Google Earth images, and through
visual interpretation of the Landsat images. The comparisons
between the actual and classified Level 2 land-cover classes for
each random point were then summarized using confusion or
error matrices. The values of Overall Classification Accuracy,
Producer‟s Accuracy and User‟s Accuracy were then computed
from the error matrices.
2.2.4 Land cover change detection: The 1995 and 2017 land-
cover maps were then subjected to post-classification
comparison change detection analysis to identify the location and
extent of land-cover change in the ARB. This approach can
provide „„from–to‟‟ change information and the kind of
transformations that have occurred can be easily calculated and
mapped (Yuan et al., 2005).
2.3 Hydrologic Modeling using HEC HMS
A hydrologic model based on the Soil Conservation Service –
Curve Number (SCS-CN) approach was used to integrate the
land-cover information derived from the analysis of the Landsat
images into a hydrologic model as a means of estimating the
impacts of the differences in land cover conditions to the
hydrological processes of the watershed (Santillan et al., 2011),
specifically in the generation of runoff under different extreme
rainfall scenarios. The goal of hydrologic modeling is to estimate
the amount of runoff generated in the headwaters of Agusan
River, especially in the portions upstream of Dankias Station,
and to determine the amount of discharge that flows into the
portion of the river that traverses Butuan City. The SCS-CN
model computes runoff (Q) from precipitation or rainfall (P) at
the sub-basin level using the following equations (Santillan et al.,
2011):
2
for , otherwise 0
254000.2 where 254
a
a
a
a
P IQ I P Q
P I S
I S SCN
In the above equations, Ia (initial abstraction) includes short-term
losses due to evaporation, interception, surface detention, and
infiltration while S stands for potential maximum retention which
characterizes the sub-basin‟s direct runoff potential (Ponce and
Hawkins, 1996). S is directly related to land cover and soil
infiltration through the CN or Curve Number which ranges from
0-100, depending on the sub-basin‟s antecedent moisture
condition (Santillan et al., 2011). In a sub-basin, CN values can
vary depending on the number of combinations of land-cover and
hydrologic soil group (HSG). Such combination is called a
hydrologic soil-cover complex (HSSC), and for each HSSC, a
CN value is assigned (NRCS, 2004). For hydrologic modelling
purposes, the CN value of a heterogeneous sub-basin can be
estimated through area-based weighted averaging of its CN
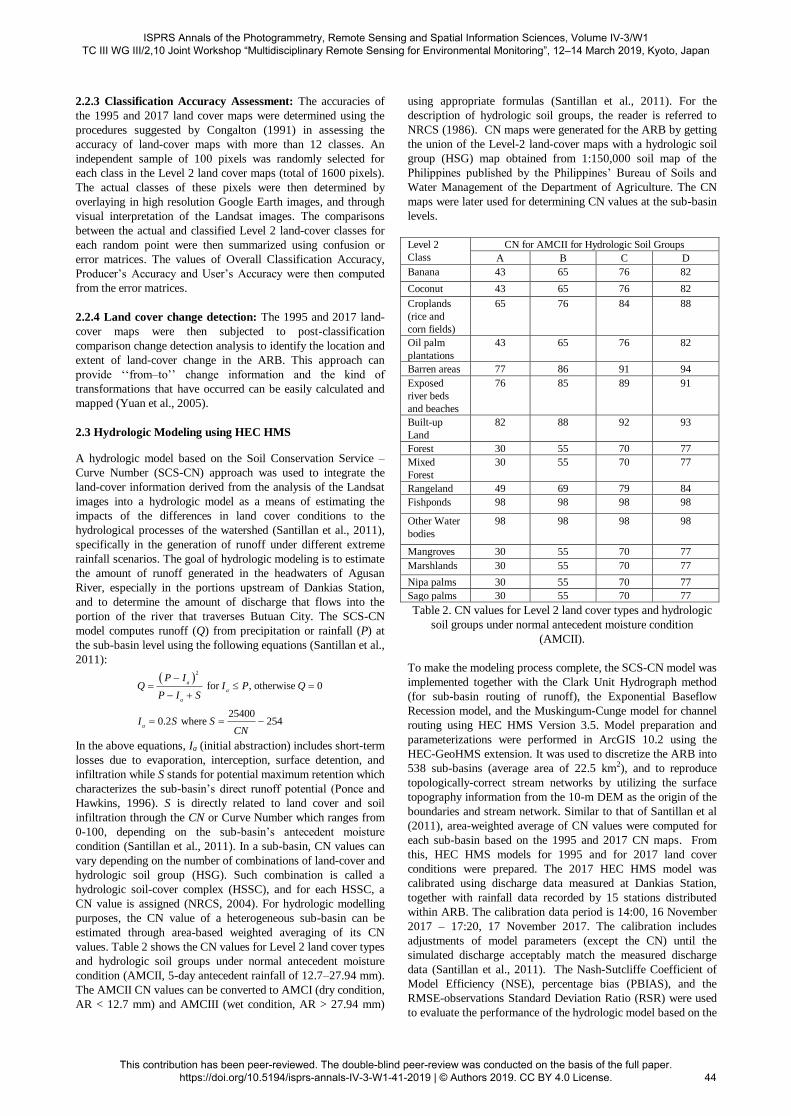
values. Table 2 shows the CN values for Level 2 land cover types
and hydrologic soil groups under normal antecedent moisture
condition (AMCII, 5-day antecedent rainfall of 12.7–27.94 mm).
The AMCII CN values can be converted to AMCI (dry condition,
AR < 12.7 mm) and AMCIII (wet condition, AR > 27.94 mm)
using appropriate formulas (Santillan et al., 2011). For the
description of hydrologic soil groups, the reader is referred to
NRCS (1986). CN maps were generated for the ARB by getting
the union of the Level-2 land-cover maps with a hydrologic soil
group (HSG) map obtained from 1:150,000 soil map of the
Philippines published by the Philippines‟ Bureau of Soils and
Water Management of the Department of Agriculture. The CN
maps were later used for determining CN values at the sub-basin
levels.
Level 2
Class
CN for AMCII for Hydrologic Soil Groups
A B C D
Banana 43 65 76 82
Coconut 43 65 76 82
Croplands
(rice and
corn fields)
65 76 84 88
Oil palm
plantations
43 65 76 82
Barren areas 77 86 91 94
Exposed
river beds
and beaches
76 85 89 91
Built-up
Land
82 88 92 93
Forest 30 55 70 77
Mixed
Forest
30 55 70 77
Rangeland 49 69 79 84
Fishponds 98 98 98 98
Other Water
bodies
98 98 98 98
Mangroves 30 55 70 77
Marshlands 30 55 70 77
Nipa palms 30 55 70 77
Sago palms 30 55 70 77
Table 2. CN values for Level 2 land cover types and hydrologic
soil groups under normal antecedent moisture condition
(AMCII).
To make the modeling process complete, the SCS-CN model was
implemented together with the Clark Unit Hydrograph method
(for sub-basin routing of runoff), the Exponential Baseflow
Recession model, and the Muskingum-Cunge model for channel
routing using HEC HMS Version 3.5. Model preparation and
parameterizations were performed in ArcGIS 10.2 using the
HEC-GeoHMS extension. It was used to discretize the ARB into
538 sub-basins (average area of 22.5 km2), and to reproduce
topologically-correct stream networks by utilizing the surface
topography information from the 10-m DEM as the origin of the
boundaries and stream network. Similar to that of Santillan et al
(2011), area-weighted average of CN values were computed for
each sub-basin based on the 1995 and 2017 CN maps. From
this, HEC HMS models for 1995 and for 2017 land cover
conditions were prepared. The 2017 HEC HMS model was
calibrated using discharge data measured at Dankias Station,
together with rainfall data recorded by 15 stations distributed
within ARB. The calibration data period is 14:00, 16 November
2017 – 17:20, 17 November 2017. The calibration includes
adjustments of model parameters (except the CN) until the
simulated discharge acceptably match the measured discharge
data (Santillan et al., 2011). The Nash-Sutcliffe Coefficient of
Model Efficiency (NSE), percentage bias (PBIAS), and the
RMSE-observations Standard Deviation Ratio (RSR) were used
to evaluate the performance of the hydrologic model based on the
ISPRS Annals of the Photogrammetry, Remote Sensing and Spatial Information Sciences, Volume IV-3/W1 TC III WG III/2,10 Joint Workshop “Multidisciplinary Remote Sensing for Environmental Monitoring”, 12–14 March 2019, Kyoto, Japan
This contribution has been peer-reviewed. The double-blind peer-review was conducted on the basis of the full paper. https://doi.org/10.5194/isprs-annals-IV-3-W1-41-2019 | © Authors 2019. CC BY 4.0 License.
44
guidelines of Moriasi et al (2007). The overall performance of
the hydrologic model before calibration was “Unsatisfactory”
(NSE = -15.64, PBIAS = -30.98, and RSR = 4.08). After the
calibration, the statistics improved (NSE = 0.93, PBIAS = -0.53,
and RSR = 0.27) indicating “Very Good” model performance.
The difference between the simulated and measured peak flow
was minimal (24.80 m3/s). The calibrated 2017 HEC HMS
model parameter values were used as the same values for the
1995 HEC HMS model. The calibrated models were then used
to simulate the volumes and rates of runoff and discharge (at the
sub-basin level and at the Dankias Station) under three 24-hour
duration extreme rainfall scenarios with return periods of 5, 25
and 100 years. The total accumulated rainfall for each scenario is
175.2 mm (5-year), 248.3 mm (25-year), and 308.6 mm (100-
year). These values were based on Rainfall-Intensity Duration
Frequency (RIDF) generated by the Philippine Atmospheric
Geophysical and Astronomical Service Administration
(PAGASA) based historical rainfall data recorded at Butuan
City. The results of the simulations for each year were then
analysed and checked for differences, and correlated with the
changes in land-cover in the ARB. The simulated discharge
hydrographs at Dankias Stations were also used as input into a
two-dimensional (2D) HEC RAS model of Butuan City.
2.4 Hydraulic Modeling using HEC RAS
The 2D HEC RAS models for simulating flood depths and
extents were developed by creating a 2D flow area representing
the entire floodplain of the ARB. The steps in model
development are very similar to the steps employed by Santillan
et al (2016). The 2D model computational domain has an
approximate area of 368.39 km2, and consists of 125,937 cells.
Two models were developed: one for the 1995 land-cover
condition, and another for the 2017 condition. Both models
utilized 1-m LiDAR Digital Terrain Model (DTM) as the
primary source of elevation data. The Manning‟s roughness
parameters of the models were estimated from the appropriate
Level 2 land cover maps and look-up tables available in the HEC
RAS Technical Reference Documents (USACE, 2016). Each
model consisted of 5 boundary conditions (3 inflows, 1 tidal, and
1 boundary condition for the precipitation that falls to the 2D
area). The 3 inflow conditions consist of discharge hydrographs
simulated by the HEC HMS models for Dankias Stations and at
other locations in the downstream portion of the basin. The
simulated flood depths and extents for the flood depths and
extents for 1995 and 2017 conditions under 3 extreme rainfall
scenarios were then compared and checked for differences.
Similarly, correlations of the detected changes to the changes in
land cover were also undertaken. Prior to the simulations, the
accuracy of the 2017 model was determined through simulation
of the actual flooding that occurred in Butuan City last January
2014 during the occurrence of Tropical Storm “Agaton”. The
actual depths at 58 locations were compared from the depths
simulated by the model. In terms of simulation flooded and non-
flooded locations, the model was found to have an overall
accuracy of 75.86%, with Root Mean Square Error (RMSE) of
0.23 m for the simulated flood depths.
3. RESULTS AND DISCUSSION
3.1 Land-cover classification and accuracy
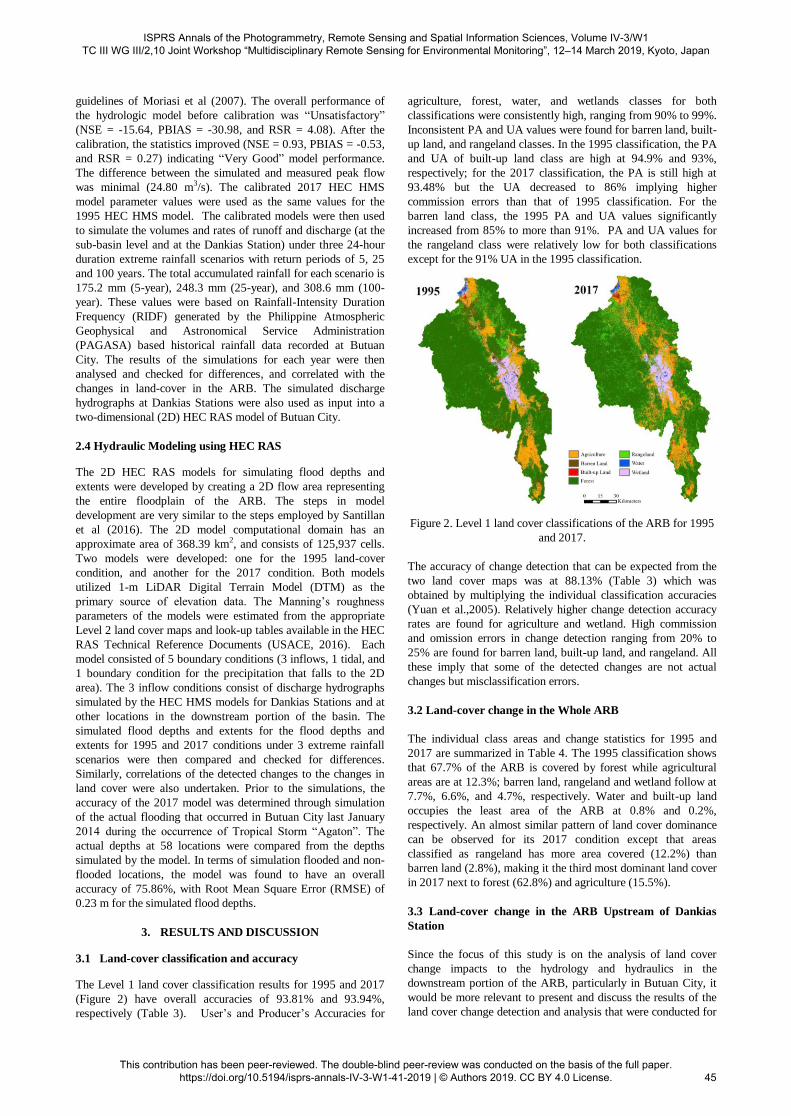
The Level 1 land cover classification results for 1995 and 2017
(Figure 2) have overall accuracies of 93.81% and 93.94%,
respectively (Table 3). User‟s and Producer‟s Accuracies for
agriculture, forest, water, and wetlands classes for both
classifications were consistently high, ranging from 90% to 99%.
Inconsistent PA and UA values were found for barren land, built-
up land, and rangeland classes. In the 1995 classification, the PA
and UA of built-up land class are high at 94.9% and 93%,
respectively; for the 2017 classification, the PA is still high at
93.48% but the UA decreased to 86% implying higher
commission errors than that of 1995 classification. For the
barren land class, the 1995 PA and UA values significantly
increased from 85% to more than 91%. PA and UA values for
the rangeland class were relatively low for both classifications
except for the 91% UA in the 1995 classification.
Figure 2. Level 1 land cover classifications of the ARB for 1995
and 2017.
The accuracy of change detection that can be expected from the
two land cover maps was at 88.13% (Table 3) which was
obtained by multiplying the individual classification accuracies
(Yuan et al.,2005). Relatively higher change detection accuracy
rates are found for agriculture and wetland. High commission
and omission errors in change detection ranging from 20% to
25% are found for barren land, built-up land, and rangeland. All
these imply that some of the detected changes are not actual
changes but misclassification errors.
3.2 Land-cover change in the Whole ARB
The individual class areas and change statistics for 1995 and
2017 are summarized in Table 4. The 1995 classification shows
that 67.7% of the ARB is covered by forest while agricultural
areas are at 12.3%; barren land, rangeland and wetland follow at
7.7%, 6.6%, and 4.7%, respectively. Water and built-up land
occupies the least area of the ARB at 0.8% and 0.2%,
respectively. An almost similar pattern of land cover dominance
can be observed for its 2017 condition except that areas
classified as rangeland has more area covered (12.2%) than
barren land (2.8%), making it the third most dominant land cover
in 2017 next to forest (62.8%) and agriculture (15.5%).
3.3 Land-cover change in the ARB Upstream of Dankias
Station
Since the focus of this study is on the analysis of land cover
change impacts to the hydrology and hydraulics in the
downstream portion of the ARB, particularly in Butuan City, it
would be more relevant to present and discuss the results of the
land cover change detection and analysis that were conducted for
ISPRS Annals of the Photogrammetry, Remote Sensing and Spatial Information Sciences, Volume IV-3/W1 TC III WG III/2,10 Joint Workshop “Multidisciplinary Remote Sensing for Environmental Monitoring”, 12–14 March 2019, Kyoto, Japan
This contribution has been peer-reviewed. The double-blind peer-review was conducted on the basis of the full paper. https://doi.org/10.5194/isprs-annals-IV-3-W1-41-2019 | © Authors 2019. CC BY 4.0 License.
45
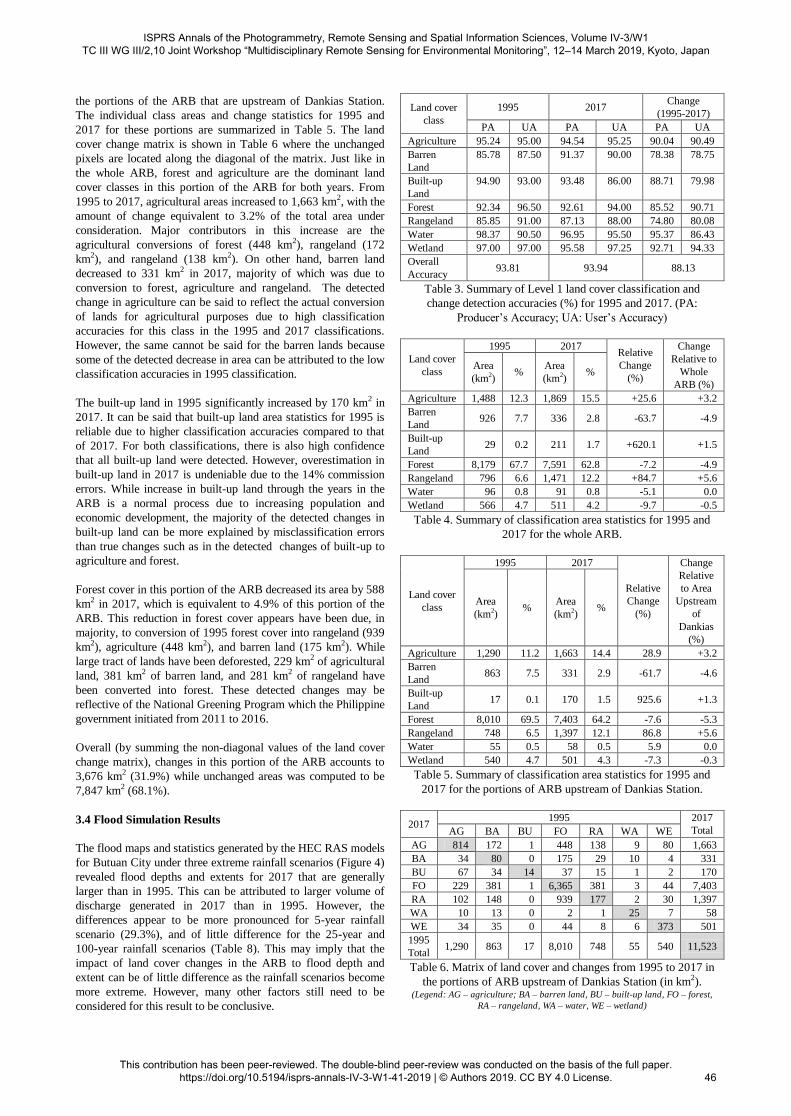
the portions of the ARB that are upstream of Dankias Station.
The individual class areas and change statistics for 1995 and
2017 for these portions are summarized in Table 5. The land
cover change matrix is shown in Table 6 where the unchanged
pixels are located along the diagonal of the matrix. Just like in
the whole ARB, forest and agriculture are the dominant land
cover classes in this portion of the ARB for both years. From
1995 to 2017, agricultural areas increased to 1,663 km2, with the
amount of change equivalent to 3.2% of the total area under
consideration. Major contributors in this increase are the
agricultural conversions of forest (448 km2), rangeland (172
km2), and rangeland (138 km2). On other hand, barren land
decreased to 331 km2 in 2017, majority of which was due to
conversion to forest, agriculture and rangeland. The detected
change in agriculture can be said to reflect the actual conversion
of lands for agricultural purposes due to high classification
accuracies for this class in the 1995 and 2017 classifications.
However, the same cannot be said for the barren lands because
some of the detected decrease in area can be attributed to the low
classification accuracies in 1995 classification.
The built-up land in 1995 significantly increased by 170 km2 in
2017. It can be said that built-up land area statistics for 1995 is
reliable due to higher classification accuracies compared to that
of 2017. For both classifications, there is also high confidence
that all built-up land were detected. However, overestimation in
built-up land in 2017 is undeniable due to the 14% commission
errors. While increase in built-up land through the years in the
ARB is a normal process due to increasing population and
economic development, the majority of the detected changes in
built-up land can be more explained by misclassification errors
than true changes such as in the detected changes of built-up to
agriculture and forest.
Forest cover in this portion of the ARB decreased its area by 588
km2 in 2017, which is equivalent to 4.9% of this portion of the
ARB. This reduction in forest cover appears have been due, in
majority, to conversion of 1995 forest cover into rangeland (939
km2), agriculture (448 km2), and barren land (175 km2). While
large tract of lands have been deforested, 229 km2 of agricultural
land, 381 km2 of barren land, and 281 km2 of rangeland have
been converted into forest. These detected changes may be
reflective of the National Greening Program which the Philippine
government initiated from 2011 to 2016.
Overall (by summing the non-diagonal values of the land cover
change matrix), changes in this portion of the ARB accounts to
3,676 km2 (31.9%) while unchanged areas was computed to be
7,847 km2 (68.1%).
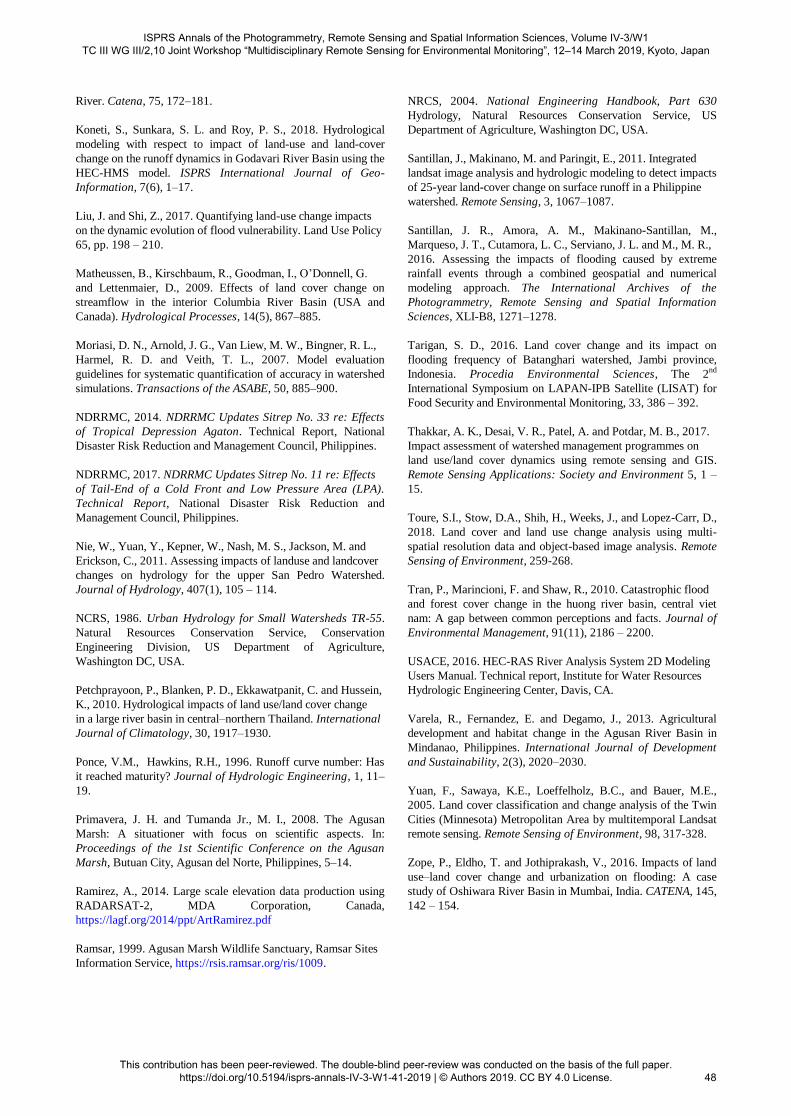
3.4 Flood Simulation Results
The flood maps and statistics generated by the HEC RAS models
for Butuan City under three extreme rainfall scenarios (Figure 4)
revealed flood depths and extents for 2017 that are generally
larger than in 1995. This can be attributed to larger volume of
discharge generated in 2017 than in 1995. However, the
differences appear to be more pronounced for 5-year rainfall
scenario (29.3%), and of little difference for the 25-year and
100-year rainfall scenarios (Table 8). This may imply that the
impact of land cover changes in the ARB to flood depth and
extent can be of little difference as the rainfall scenarios become
more extreme. However, many other factors still need to be
considered for this result to be conclusive.
Land cover
class
1995 2017 Change
(1995-2017)
PA UA PA UA PA UA
Agriculture 95.24 95.00 94.54 95.25 90.04 90.49
Barren
Land
85.78 87.50 91.37 90.00 78.38 78.75
Built-up
Land
94.90 93.00 93.48 86.00 88.71 79.98
Forest 92.34 96.50 92.61 94.00 85.52 90.71
Rangeland 85.85 91.00 87.13 88.00 74.80 80.08
Water 98.37 90.50 96.95 95.50 95.37 86.43
Wetland 97.00 97.00 95.58 97.25 92.71 94.33
Overall
Accuracy 93.81 93.94 88.13
Table 3. Summary of Level 1 land cover classification and
change detection accuracies (%) for 1995 and 2017. (PA:
Producer‟s Accuracy; UA: User‟s Accuracy)
Land cover
class
1995 2017 Relative
Change
(%)
Change
Relative to
Whole
ARB (%)
Area
(km2) %
Area
(km2) %
Agriculture 1,488 12.3 1,869 15.5 +25.6 +3.2
Barren
Land 926 7.7 336 2.8 -63.7 -4.9
Built-up
Land 29 0.2 211 1.7 +620.1 +1.5
Forest 8,179 67.7 7,591 62.8 -7.2 -4.9
Rangeland 796 6.6 1,471 12.2 +84.7 +5.6
Water 96 0.8 91 0.8 -5.1 0.0
Wetland 566 4.7 511 4.2 -9.7 -0.5
Table 4. Summary of classification area statistics for 1995 and
2017 for the whole ARB.
Land cover
class
1995 2017
Relative
Change
(%)
Change
Relative
to Area
Upstream
of
Dankias
(%)
Area
(km2) %
Area
(km2) %
Agriculture 1,290 11.2 1,663 14.4 28.9 +3.2
Barren
Land 863 7.5 331 2.9 -61.7 -4.6
Built-up
Land 17 0.1 170 1.5 925.6 +1.3
Forest 8,010 69.5 7,403 64.2 -7.6 -5.3
Rangeland 748 6.5 1,397 12.1 86.8 +5.6
Water 55 0.5 58 0.5 5.9 0.0
Wetland 540 4.7 501 4.3 -7.3 -0.3
Table 5. Summary of classification area statistics for 1995 and
2017 for the portions of ARB upstream of Dankias Station.
2017 1995 2017
Total AG BA BU FO RA WA WE
AG 814 172 1 448 138 9 80 1,663
BA 34 80 0 175 29 10 4 331
BU 67 34 14 37 15 1 2 170
FO 229 381 1 6,365 381 3 44 7,403
RA 102 148 0 939 177 2 30 1,397
WA 10 13 0 2 1 25 7 58
WE 34 35 0 44 8 6 373 501
1995
Total 1,290 863 17 8,010 748 55 540 11,523
Table 6. Matrix of land cover and changes from 1995 to 2017 in
the portions of ARB upstream of Dankias Station (in km2). (Legend: AG – agriculture; BA – barren land, BU – built-up land, FO – forest,
RA – rangeland, WA – water, WE – wetland)
ISPRS Annals of the Photogrammetry, Remote Sensing and Spatial Information Sciences, Volume IV-3/W1 TC III WG III/2,10 Joint Workshop “Multidisciplinary Remote Sensing for Environmental Monitoring”, 12–14 March 2019, Kyoto, Japan
This contribution has been peer-reviewed. The double-blind peer-review was conducted on the basis of the full paper. https://doi.org/10.5194/isprs-annals-IV-3-W1-41-2019 | © Authors 2019. CC BY 4.0 License.
46
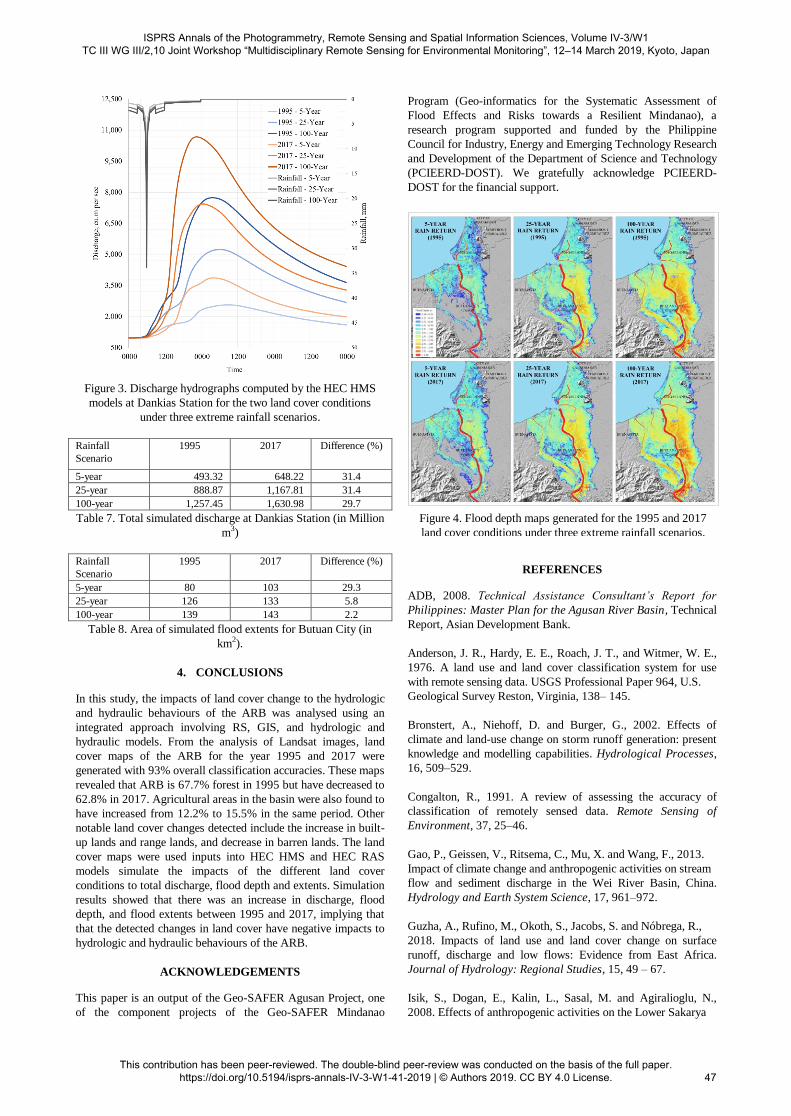
Figure 3. Discharge hydrographs computed by the HEC HMS
models at Dankias Station for the two land cover conditions
under three extreme rainfall scenarios.
Rainfall
Scenario
1995 2017 Difference (%)
5-year 493.32 648.22 31.4
25-year 888.87 1,167.81 31.4
100-year 1,257.45 1,630.98 29.7
Table 7. Total simulated discharge at Dankias Station (in Million
m3)
Rainfall
Scenario
1995 2017 Difference (%)
5-year 80 103 29.3
25-year 126 133 5.8
100-year 139 143 2.2
Table 8. Area of simulated flood extents for Butuan City (in
km2).
4. CONCLUSIONS
In this study, the impacts of land cover change to the hydrologic
and hydraulic behaviours of the ARB was analysed using an
integrated approach involving RS, GIS, and hydrologic and
hydraulic models. From the analysis of Landsat images, land
cover maps of the ARB for the year 1995 and 2017 were
generated with 93% overall classification accuracies. These maps
revealed that ARB is 67.7% forest in 1995 but have decreased to
62.8% in 2017. Agricultural areas in the basin were also found to
have increased from 12.2% to 15.5% in the same period. Other
notable land cover changes detected include the increase in built-
up lands and range lands, and decrease in barren lands. The land
cover maps were used inputs into HEC HMS and HEC RAS
models simulate the impacts of the different land cover
conditions to total discharge, flood depth and extents. Simulation
results showed that there was an increase in discharge, flood
depth, and flood extents between 1995 and 2017, implying that
that the detected changes in land cover have negative impacts to
hydrologic and hydraulic behaviours of the ARB.
ACKNOWLEDGEMENTS
This paper is an output of the Geo-SAFER Agusan Project, one
of the component projects of the Geo-SAFER Mindanao
Program (Geo-informatics for the Systematic Assessment of
Flood Effects and Risks towards a Resilient Mindanao), a
research program supported and funded by the Philippine
Council for Industry, Energy and Emerging Technology Research
and Development of the Department of Science and Technology
(PCIEERD-DOST). We gratefully acknowledge PCIEERD-
DOST for the financial support.
REFERENCES
ADB, 2008. Technical Assistance Consultant’s Report for
Philippines: Master Plan for the Agusan River Basin, Technical
Report, Asian Development Bank.
Anderson, J. R., Hardy, E. E., Roach, J. T., and Witmer, W. E.,
1976. A land use and land cover classification system for use
with remote sensing data. USGS Professional Paper 964, U.S.
Geological Survey Reston, Virginia, 138– 145.
Bronstert, A., Niehoff, D. and Burger, G., 2002. Effects of
climate and land-use change on storm runoff generation: present
knowledge and modelling capabilities. Hydrological Processes,
16, 509–529.
Congalton, R., 1991. A review of assessing the accuracy of
classification of remotely sensed data. Remote Sensing of
Environment, 37, 25–46.
Gao, P., Geissen, V., Ritsema, C., Mu, X. and Wang, F., 2013.
Impact of climate change and anthropogenic activities on stream
flow and sediment discharge in the Wei River Basin, China.
Hydrology and Earth System Science, 17, 961–972.
Guzha, A., Rufino, M., Okoth, S., Jacobs, S. and Nóbrega, R.,
2018. Impacts of land use and land cover change on surface
runoff, discharge and low flows: Evidence from East Africa.
Journal of Hydrology: Regional Studies, 15, 49 – 67.
Isik, S., Dogan, E., Kalin, L., Sasal, M. and Agiralioglu, N.,
2008. Effects of anthropogenic activities on the Lower Sakarya
Figure 4. Flood depth maps generated for the 1995 and 2017
land cover conditions under three extreme rainfall scenarios.
ISPRS Annals of the Photogrammetry, Remote Sensing and Spatial Information Sciences, Volume IV-3/W1 TC III WG III/2,10 Joint Workshop “Multidisciplinary Remote Sensing for Environmental Monitoring”, 12–14 March 2019, Kyoto, Japan
This contribution has been peer-reviewed. The double-blind peer-review was conducted on the basis of the full paper. https://doi.org/10.5194/isprs-annals-IV-3-W1-41-2019 | © Authors 2019. CC BY 4.0 License.
47
River. Catena, 75, 172–181.
Koneti, S., Sunkara, S. L. and Roy, P. S., 2018. Hydrological
modeling with respect to impact of land-use and land-cover
change on the runoff dynamics in Godavari River Basin using the
HEC-HMS model. ISPRS International Journal of Geo-
Information, 7(6), 1–17.
Liu, J. and Shi, Z., 2017. Quantifying land-use change impacts
on the dynamic evolution of flood vulnerability. Land Use Policy
65, pp. 198 – 210.
Matheussen, B., Kirschbaum, R., Goodman, I., O‟Donnell, G.
and Lettenmaier, D., 2009. Effects of land cover change on
streamflow in the interior Columbia River Basin (USA and
Canada). Hydrological Processes, 14(5), 867–885.
Moriasi, D. N., Arnold, J. G., Van Liew, M. W., Bingner, R. L.,
Harmel, R. D. and Veith, T. L., 2007. Model evaluation
guidelines for systematic quantification of accuracy in watershed
simulations. Transactions of the ASABE, 50, 885–900.
NDRRMC, 2014. NDRRMC Updates Sitrep No. 33 re: Effects
of Tropical Depression Agaton. Technical Report, National
Disaster Risk Reduction and Management Council, Philippines.
NDRRMC, 2017. NDRRMC Updates Sitrep No. 11 re: Effects
of Tail-End of a Cold Front and Low Pressure Area (LPA).
Technical Report, National Disaster Risk Reduction and
Management Council, Philippines.
Nie, W., Yuan, Y., Kepner, W., Nash, M. S., Jackson, M. and
Erickson, C., 2011. Assessing impacts of landuse and landcover
changes on hydrology for the upper San Pedro Watershed.
Journal of Hydrology, 407(1), 105 – 114.
NCRS, 1986. Urban Hydrology for Small Watersheds TR-55.
Natural Resources Conservation Service, Conservation
Engineering Division, US Department of Agriculture,
Washington DC, USA.
Petchprayoon, P., Blanken, P. D., Ekkawatpanit, C. and Hussein,
K., 2010. Hydrological impacts of land use/land cover change
in a large river basin in central–northern Thailand. International
Journal of Climatology, 30, 1917–1930.
Ponce, V.M., Hawkins, R.H., 1996. Runoff curve number: Has
it reached maturity? Journal of Hydrologic Engineering, 1, 11–
19.
Primavera, J. H. and Tumanda Jr., M. I., 2008. The Agusan
Marsh: A situationer with focus on scientific aspects. In:
Proceedings of the 1st Scientific Conference on the Agusan
Marsh, Butuan City, Agusan del Norte, Philippines, 5–14.
Ramirez, A., 2014. Large scale elevation data production using
RADARSAT-2, MDA Corporation, Canada,
https://lagf.org/2014/ppt/ArtRamirez.pdf
Ramsar, 1999. Agusan Marsh Wildlife Sanctuary, Ramsar Sites
Information Service, https://rsis.ramsar.org/ris/1009.
NRCS, 2004. National Engineering Handbook, Part 630
Hydrology, Natural Resources Conservation Service, US
Department of Agriculture, Washington DC, USA.
Santillan, J., Makinano, M. and Paringit, E., 2011. Integrated
landsat image analysis and hydrologic modeling to detect impacts
of 25-year land-cover change on surface runoff in a Philippine
watershed. Remote Sensing, 3, 1067–1087.
Santillan, J. R., Amora, A. M., Makinano-Santillan, M.,
Marqueso, J. T., Cutamora, L. C., Serviano, J. L. and M., M. R.,
2016. Assessing the impacts of flooding caused by extreme
rainfall events through a combined geospatial and numerical
modeling approach. The International Archives of the
Photogrammetry, Remote Sensing and Spatial Information
Sciences, XLI-B8, 1271–1278.
Tarigan, S. D., 2016. Land cover change and its impact on
flooding frequency of Batanghari watershed, Jambi province,
Indonesia. Procedia Environmental Sciences, The 2nd
International Symposium on LAPAN-IPB Satellite (LISAT) for
Food Security and Environmental Monitoring, 33, 386 – 392.
Thakkar, A. K., Desai, V. R., Patel, A. and Potdar, M. B., 2017.
Impact assessment of watershed management programmes on
land use/land cover dynamics using remote sensing and GIS.
Remote Sensing Applications: Society and Environment 5, 1 –
15.
Toure, S.I., Stow, D.A., Shih, H., Weeks, J., and Lopez-Carr, D.,
2018. Land cover and land use change analysis using multi-
spatial resolution data and object-based image analysis. Remote
Sensing of Environment, 259-268.
Tran, P., Marincioni, F. and Shaw, R., 2010. Catastrophic flood
and forest cover change in the huong river basin, central viet
nam: A gap between common perceptions and facts. Journal of
Environmental Management, 91(11), 2186 – 2200.
USACE, 2016. HEC-RAS River Analysis System 2D Modeling
Users Manual. Technical report, Institute for Water Resources
Hydrologic Engineering Center, Davis, CA.
Varela, R., Fernandez, E. and Degamo, J., 2013. Agricultural
development and habitat change in the Agusan River Basin in
Mindanao, Philippines. International Journal of Development
and Sustainability, 2(3), 2020–2030.
Yuan, F., Sawaya, K.E., Loeffelholz, B.C., and Bauer, M.E.,
2005. Land cover classification and change analysis of the Twin
Cities (Minnesota) Metropolitan Area by multitemporal Landsat
remote sensing. Remote Sensing of Environment, 98, 317-328.
Zope, P., Eldho, T. and Jothiprakash, V., 2016. Impacts of land
use–land cover change and urbanization on flooding: A case
study of Oshiwara River Basin in Mumbai, India. CATENA, 145,
142 – 154.
ISPRS Annals of the Photogrammetry, Remote Sensing and Spatial Information Sciences, Volume IV-3/W1 TC III WG III/2,10 Joint Workshop “Multidisciplinary Remote Sensing for Environmental Monitoring”, 12–14 March 2019, Kyoto, Japan
This contribution has been peer-reviewed. The double-blind peer-review was conducted on the basis of the full paper. https://doi.org/10.5194/isprs-annals-IV-3-W1-41-2019 | © Authors 2019. CC BY 4.0 License.
48