Embed Size (px)
Citation preview
© Copyr i gh t 2014- 15 O SIs o f t , LLC .
Presented by
Analyzing Location
for the Most
Profitable Supply
Chain
Ryan Schacht, Account Executive

Esri 130 Countries
1969
ArcGIS
Location Technology
5,000

Nearly all Business Data has a Geographic Component
Transportation Networks
Sourcing Regions
Shipping Lanes
Plant Locations
Demand Signals

Spatial Analysis
Geography DataSpatial
Relationships

ArcGIS Enables every employee in your organization to easily discover, make, share, and use maps on any device anytime and any where.
The ArcGIS Location Platform Supports EveryoneCollaboration, Communication, Understanding

Connecting Time & Location for a More Integrated Supply Chain
Demand Supply
Production
Time + Location
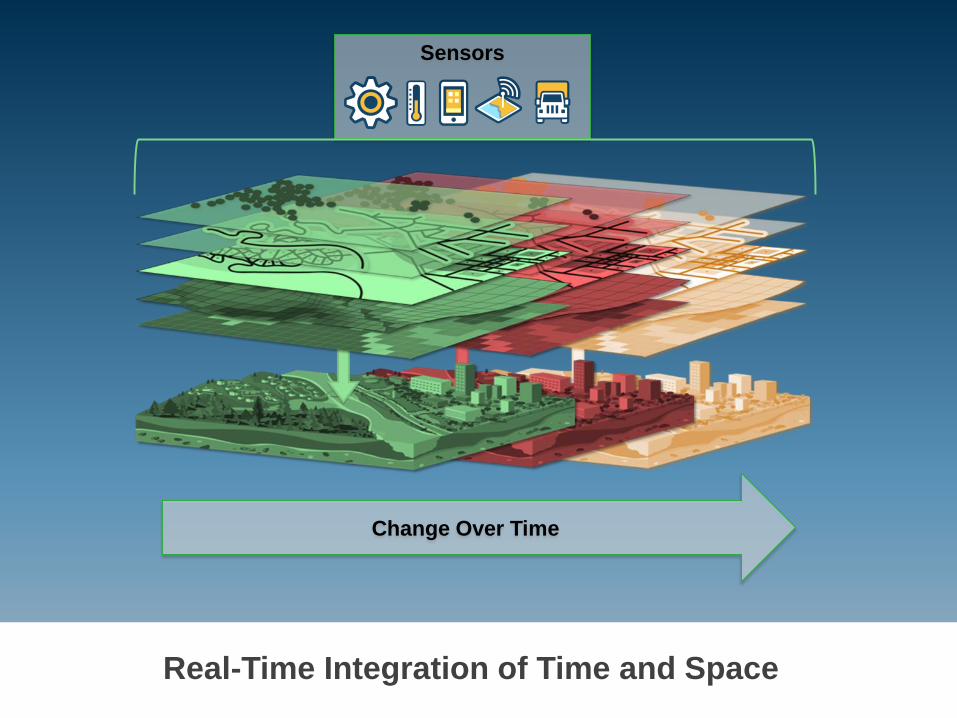
Sensors
Real-Time Integration of Time and Space
Change Over Time


The Value of Integration: A KPI PerspectiveHow Do Time and Location Impact KPI’s?
Demand
• Point of Sale
• On-Shelf Availability
Supply
• On-Time Delivery
• Sourcing Cycles
• Cost to Source
• Supplier’s Quality Incoming
• Sustainability
Production
• Throughput
• Plant Downtime
• Asset Utilization
• Energy
• R.M.A.

Time and Location are Critical Factors in Every Link of the Supply Chain
Commodities
Supply Chain
Production
ConsumersField to
Shelf

Traditional Commodity Market Zone Map

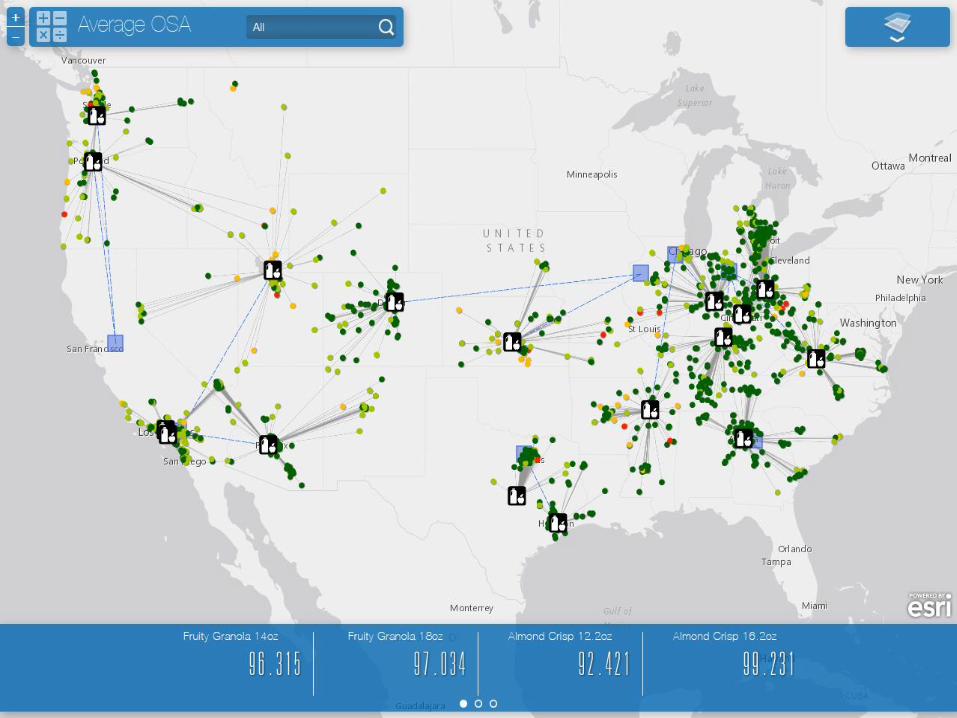
Esri + OSIsoft: Commodity Market Zone Map

DemandSupply
Chain
• Cost to Source
• Supplier’s Quality Incoming
Production
• Cost/Unit
• W.A.G.E.S.
• Throughput Yield
• Energy/Product
KPI Impacts

Demo:
Plant to Plant Comparison
&
Supply Chain Vulnerability


Demand
• Point of Sale
• On-Shelf Availability
Supply
Chain
• On-Time Delivery
• Agility
Production
• Plant Downtime
• Maintenance
KPI Impacts

Demo:Integrating Delivery Information and Demand Signals

Demand
• Point of Sale
• On-Shelf Availability
Supply
Chain
• On-Time Delivery
• Agility
Production
• W.I.P.

Additional Resources: ArcGIS for Manufacturing
• Supply Chain: http://www.esri.com/industries/business/manufacturing/supply-chain
• Market Planning: http://www.esri.com/industries/business/manufacturing/supply-chain
• Facilities Management: http://www.esri.com/industries/business/manufacturing/facilities-management
• Performance Management: http://www.esri.com/industries/business/manufacturing/performance-management

Other demonstrations in the pods:
Stop by the demonstration pods!
• Sales Dashboards
• RMA Analysis
• Market Research


© Copyr i gh t 2014- 15 O SIs o f t , LLC .
Brought to you by

© Copyr i gh t 2014- 15 O SIs o f t , LLC .28
Agenda
07:30 - 08:30 a.m. Registration and Continental Breakfast
08:30 – 09:00 a.m. Welcome: Industry Trends & Manufacturing Operational Excellence - OSIsoft Jason Kurdziel, Account Manager
09:00 - 09:30 a.m. The Journey to Real Time Operational Intelligence - OSIsoft Marc Gallant, Regional Manager
09:30 - 10:15 a.m. Journey to Asset-Based Data – The Kellogg Story John Gothberg, IT & Control Systems Manager
10:15 - 10:30 a.m. Break / Demo Pods
10:30 - 11:15 a.m. Integrating your Plant Information Management System: Strategies for Success Kirt Anderson, Senior MES Project Manager – Stone Technologies
11:15 - 12:00 p.m. Rapid Insights with Data Analytics - Tate & Lyle Mark Massey, Process Control Software Manager: Global Manufacturing
12:00 - 01:30 p.m. Lunch / Demo Prods
01:30 – 02:15 p.m. Analyzing Location for the Most Profitable Supply Chain – Esri Ryan Schacht, Account Executive
02:15 – 03:00 p.m. Chocolate PI - The Hershey Company Russell Gregg, Sr. Project Manager: IS Global Supply Chain/Manufacturing Systems
03:00 – 03:45 p.m. Evolution of OSIsoft PI to an Enterprise Agreement - Abbott Nutrition Rich Colvin, Area IT Manager: ANSC Asia & Ireland
03:45 - 04:15 p.m. Roundtable Review
04:15 - 04:30 p.m. Wrap-up/Seminar Conclusion – Jason Kurdziel, Account Manager, OSIsoft
04:30 - 06:00 p.m. Networking Reception / Demo Pods