Embed Size (px)
Citation preview
Analyzing Linear Equations: SLOPE & Y-Intercept: What are
they really?! Made for the 9th grade Algebra course
A 5-day Plan (of an 11 day unit)
Technology Used: TI-84 (or other graphing calculator)
Graphing calculator display panel (for overhead) TI-Smart View CBR (at least 4)
Overhead
** This chapter is expected to take 11 days, including two extra days for review and the chapter test **
Note: This chapter is to be completed within the first month of the freshman Algebra course. Its main goal is to provide a solid foundation as to what a graph looks like and what
changes this appearance- but NO numbers are used until day 4/5!
JANELLE FILBERT I2T2 FINAL PROJECT
SUMMER 2006
2
Materials Necessary (complete list): 1. Rulers (class set)
2. TI-84 (or other graphing calculator) 3. TI-Smartview
4. CBR 5. Overhead
6. Graphing calculator display panel (for overhead) 7. Graph Paper (multiple sizes)
8. Colored Pencils 9. Construction Paper 10. Pen/pencil (daily)
11. Textbook (Glencoe Algebra NYS Edition) 12. Balls (golf-balls, tennis balls, etc.) **Various sizes and many of each**
13. Match Box Cars and other objects that will “roll”
All problems used for each worksheet and the textbook referenced throughout the entire project can be found in:
2005 Glencoe McGraw-Hill Algebra Teacher Edition Textbook
written by: Holliday, Cuevas, Moore-Harris, Carter, Marks, Casey, Day and Hayek. Chapter 5 pages 254-314
**All student work assigned from the book is from this same text however the
student edition is created for NYS specifically**
3
NYS Standards:
These are the “new 2005 NYS” standards for the entire chapter; the items in bold are demonstrated here
A.A.32- Explain slope as a rate of change between dependent and
independent variables A.A.33- Determine the slope of a line, given the coordinates of two points
on the line A A.A.34- Write the equation of a line, given its slope and the coordinates of a
point on the line A.A.35- Write the equation of a line, given the coordinates of two points on that
line A.A.36- Write the equation of a line parallel to the x- or y-axis
A.A.37- Determine the slope of a line, given its equation in any form A.A.38- Determine if two line are parallel, given their equations in any form A.G.5- Investigate and generalize how changing the coefficients of a
function affects its graph
NCTM Standards Addressed: 1. Algebra
2. Geometry 3. Problem Solving 4. Representation
5. Connections 6. Communication

4
Unit Objectives: At the completion of this unit, students should be able to:
(Listed are the objectives for my 5-day unit - this unit is expected to last 3 full weeks)
π Be able to describe a graph and tell a story as to what is happening based only on the graph (no numbers or labels)
π Be able to read the graph π Be able to relate the concept of rate-of-change over to slope π Be able to identify that the “starting point” (distance) of graphs is the y-
intercept π Graph multiple lines simultaneously on the graphing calculator π Draw valid conclusions from observing multiple graphs simultaneously π Observe the difference/similarities in multiple graphs π Observe the difference/similarities among the equations π Relate each equation to its appropriate graph π Draw conclusions about the situation of a graph π Recognize what the different directions of a line on a given graph means π Use the graphing calculator to “trace” the path of a moving object π Adjust their own speed to match the lines on the graph; relate their speed
to the steepness π Determine that the graph does not start at zero and try to determine
where exactly it does start π Separate the graph into parts π Be able to explain why lines are going in certain directions- What is
happening?
5
OVERVIEW:
Day #1: CBR Activity ** The students will use various size balls and their own movement to create different graphs with the CBR and the graphing calculator. They will be asked to draw conclusions on why the graph looks the way it does at certain points and what that means about the ball placement. Day #2: CBR Activity continued and Wrap-Up ** Students will wrap up conclusions within their groups. As a class within their smaller groups we will then play “The Match Game” on the graphing calculators where students have to use their knowledge of the graphs to try and move along to match the graph exactly. Day #3: Analyze Given Graphs with NO Values/Labels- Tell Me a Story ** Each group will use construction paper, colored pencils and other materials to create a graph using multiple straight lines. Each will be posted on the board and they must tell their story to the class. Day #4: Higher Rate of Change means what about the graph?? ** Students will use graphing calculators to graph multiple equations at the same time. They will each have different coefficients and the students will have to draw conclusions as to what the coefficient is representing and also what effect it has (if any) on the appearance of the graph. Day #5: From Rate of Change and Starting Point to Slope and Y-Intercept ** Using graph paper, the students (within groups) will come up with a linear graph. As a class we will describe each one and begin to use the proper math vocabulary (slope and y-intercept).
6
Day 1: CBR Introduction and Activity
Objectives: Students will be able to: 1. Draw conclusions about the situation of a graph 2. Recognize what the different directions of a line on a given graph means 3. Use the graphing calculator to “trace” the path of a moving object Materials: 1. Graphing Calculator 2. CBR (1 per group) 3. Ruler 4. Paper (construction) 5. Various Size Balls 6. Colored Pencils/Markers Warm Up: A crucial part of this activity rests on the successful use of the graphing calculator. Since this lesson is used in the beginning of the freshman year of high school, the students would have completed a previous Introduction to the Calculator lesson. To start the day, a brief warm-up (see attached) would be performed individually using the calculators. Since the students have just been introduced to the calculators, most are not proficient yet. This will help strengthen their skills. Lesson/Activities: Students will be placed into groups of three or four randomly. Within each group one student will start with the calculator while the others are the “performers”. After demonstrating how to use the CBR along with the graphing calculator, the students will then split back up. As a group they are to record on the calculator 3 movement graphs and transfer each graph to construction paper (the calculator DOES NOT save graphs so the students will be asked to draw each graph before they create another one). These graphs are tracing movement (straight line only-no bouncing balls) and so the students will be recommended that they may push a ball at different speeds towards and away from the CBR, that one student may walk at different speeds towards and away from the CBR and any other movement that they would like to record. After the three graphs are created, the students will then be asked to describe what happened on the back of each. This is meant to summarize why the graph looks the way that it does and will also help the students relate a certain appearance (direction of the line) to a certain movement (or lack there of). Closure: As part of the daily journal (short responses) that each student completes, their task will be to respond to the following: You are looking at a graph and you notice that at one section on the graph, the
line is horizontal. Without having been told what graph you are looking at, describe in your own words why it may be horizontal.
Homework: Complete the descriptions of your graphs for homework. Each description must be in complete sentences and fully describe the situation from start to end.
7
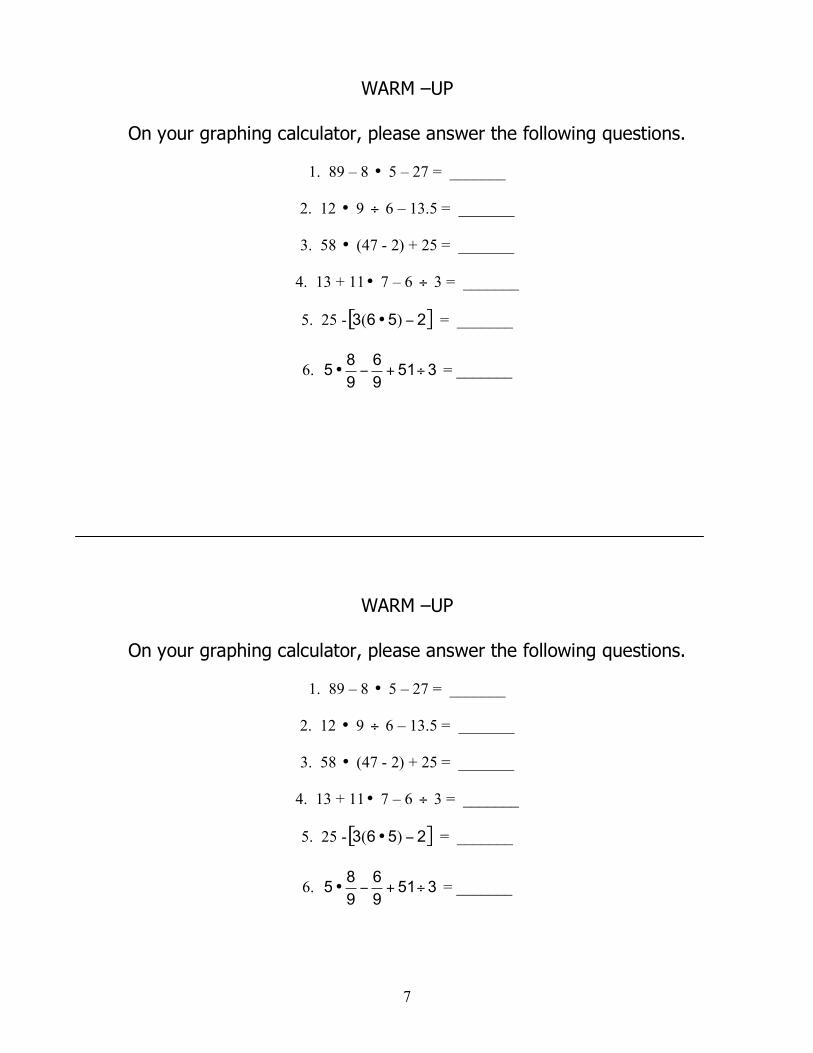
WARM –UP
On your graphing calculator, please answer the following questions.
1. 89 – 8 • 5 – 27 = _______
2. 12 • 9 ÷ 6 – 13.5 = _______
3. 58 • (47 - 2) + 25 = _______
4. 13 + 11• 7 – 6 ÷ 3 = _______
5. 25 -[ ]2563 !• )( = _______
6. 3519
6
9
85 ÷+!• = _______
WARM –UP
On your graphing calculator, please answer the following questions.
1. 89 – 8 • 5 – 27 = _______
2. 12 • 9 ÷ 6 – 13.5 = _______
3. 58 • (47 - 2) + 25 = _______
4. 13 + 11• 7 – 6 ÷ 3 = _______
5. 25 -[ ]2563 !• )( = _______
6. 3519
6
9
85 ÷+!• = _______
8
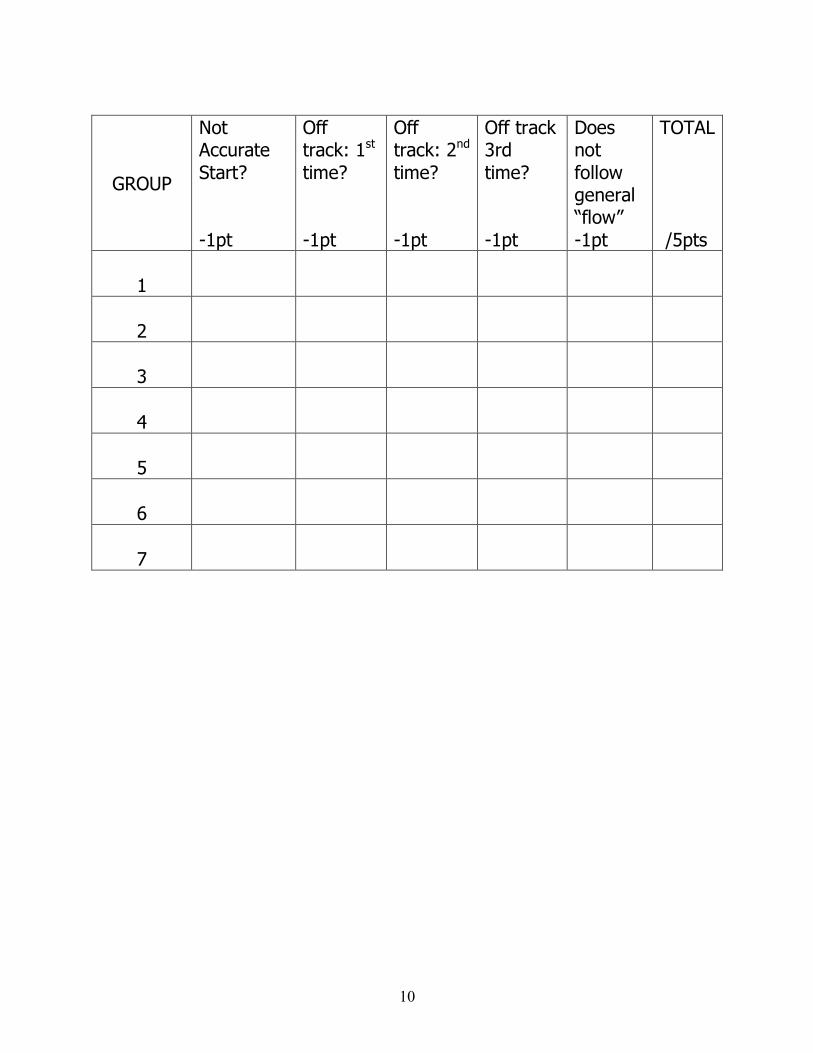
Day 2: CBR Activity Continued Objectives: Students will be able to: 1. Determine why a graph looks the way it does 2. Relate the distance between themselves and the “starting point” to that of the graph 3. Follow and try to mimic the path of a given graph through their individual movement 4. Adjust their own speed to match the lines on the graph; relate their speed to the steepness 5. Determine that the graph does not start at zero and try to determine where exactly it does start Materials: 1. Graphing Calculator 2. CBR 3. Overhead 4. Graphing calculator overhead panel Warm Up: As each student enters the class they will be asked to take out a half sheet of paper. They will then be asked to write one thing that they recall about the appearance of graphs from their summaries yesterday in a complete sentence. Lesson/Activities: The students will be asked to get back into the same groups that they were in yesterday. On the front overhead the program “Easy Data” will be displayed and the students will be shown a demonstration of the day’s activity. This will be turned into a contest among groups. Each group will get two attempts at matching the graph (non-consecutive) to ensure that all groups get a fair chance. A random graph from the program will be displayed on the screen. Along the floor in front of the table where the CBR is resting (so that it is straight) will be masking tape with each meter marked off (1 meter from the CBR and so on). The students as a group will choose one walker and another group member to hold the calculator to start and stop the recording. The other members will be coaches. As a group they should determine where the walker should start and quickly (limit to 1 min) come up with the walking pace and direction. The goal is for the walker’s movements to best match the given random graph. Each group will get one go at the game before they receive their second chance. To ensure that the votes are accurate, each group will be rated by the entire class individually on a 5 point system. Each group will start with 5 points and then points will be deducted as per the recording chart. After all groups have had 2 opportunities the group(s) that were best able to match their graph will have the option as to what their prize is (either extra credit points or 1 free homework pass). This will help solidify the starting point of graphs based on where the person begins standing (not always at 0) and also the different speeds at which they walk and how steep the line appears.

9
Closure: Daily journal/reflection:
Give me one example of what a graph would be representing (the axis labels) where the starting point WOULD NOT be at zero.
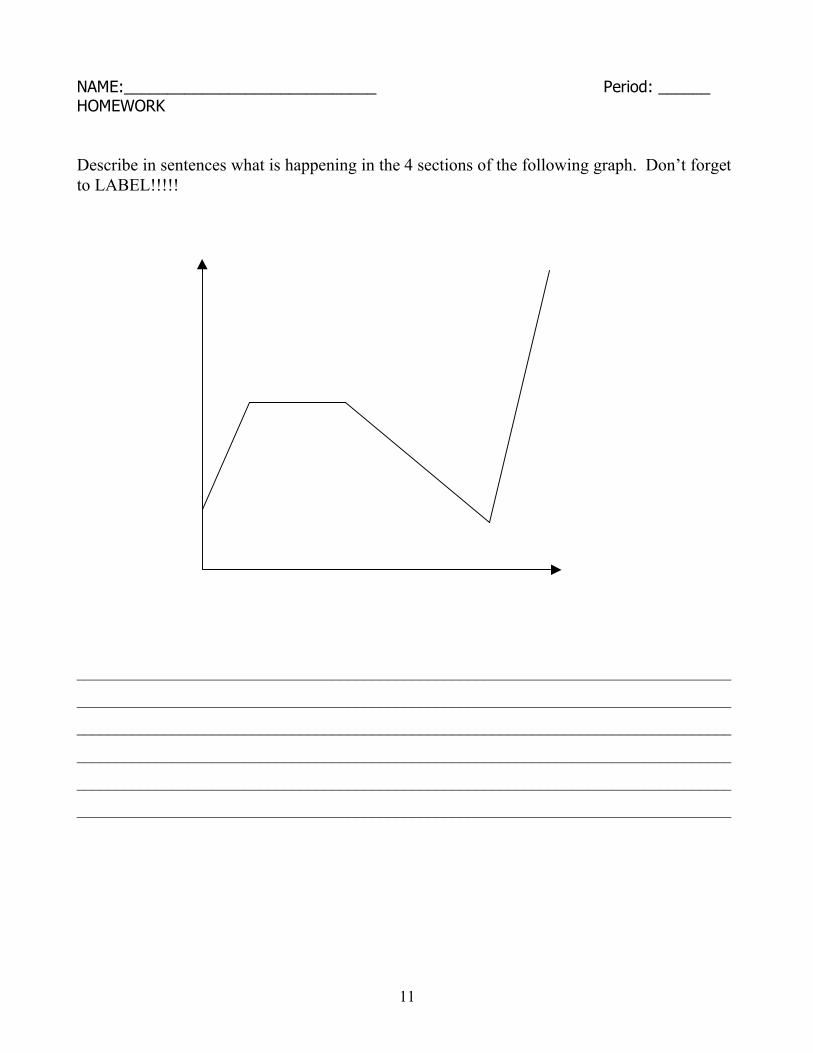
Homework: Attached is a graph with no labels and/or numbers on either axis. Please describe the
graph, using your own labels that make sense, in complete sentence form.
10
GROUP
Not Accurate Start? -1pt
Off track: 1st time? -1pt
Off track: 2nd time? -1pt
Off track 3rd time? -1pt
Does not follow general “flow” -1pt
TOTAL /5pts
1
2
3
4
5
6
7
11
NAME:_____________________________ Period: ______ HOMEWORK Describe in sentences what is happening in the 4 sections of the following graph. Don’t forget to LABEL!!!!!
__________________________________________________________________________________
__________________________________________________________________________________
__________________________________________________________________________________
__________________________________________________________________________________
__________________________________________________________________________________
__________________________________________________________________________________
12
Day 3: Analyze Graphs with No Values- Tell Me a Story
Objectives: Students will be able to: 1. Separate the graph into parts 2. Identify the location where the lines change direction 3. Be able to explain why lines are going in certain directions- What is happening? 4. Be able to identify labels for the axis appropriate to the starting point of the graph Materials: 1. Pen or a pencil 2. Notebook 3. Worksheet for class 4. Paper Warm Up: Today’s lesson/activity within the group and then the class presentations of the work will require the entire 40 minutes in the class period. As a result, no warm-up activity is planned for today to ensure that the lesson is completed. Lesson/Activities: As the students enter the classroom, they will be asked to pass up their completed homework. Once again, the students will be asked to get into their groups (the same groups that they have been in all week). Each group will need a sheet of large construction paper, a ruler and markers/colored pencils. Each group will be asked to draw a graph that meets the following criteria: 1. You may only use straight lines 2. These lines must be continuous across the graph; they may not cross 3. There must be at least 4 changes in direction and 5 lines The groups will be also informed ahead of making their graph that they will be telling a story that must match the picture. So they may want to write a story before they draw as to make sure they are able to match up. The groups will be given 20 minutes to complete a graph and write a brief story telling what is going on. They will each write their story on a separate sheet of paper from their graph. Collecting them all, I will then place each picture on the wall and label each randomly 1-? (depending on how many groups) and also place each description on the wall, labeling each a,b,c,etc. The students will have to match each graph to its proper story as they travel around the room looking at each graph and reading each description. Each group will complete the activity by matching each numbered graph to its proper description on a provided chart. Closure: Since the activities for the day will last the period, the students will complete an exit ticket. Their completed matching chart will serve as their ticket out the door. Homework: Complete the worksheet on describing graphs with no numbers. The descriptions must be in complete sentence form and must be clearly labeled.
13
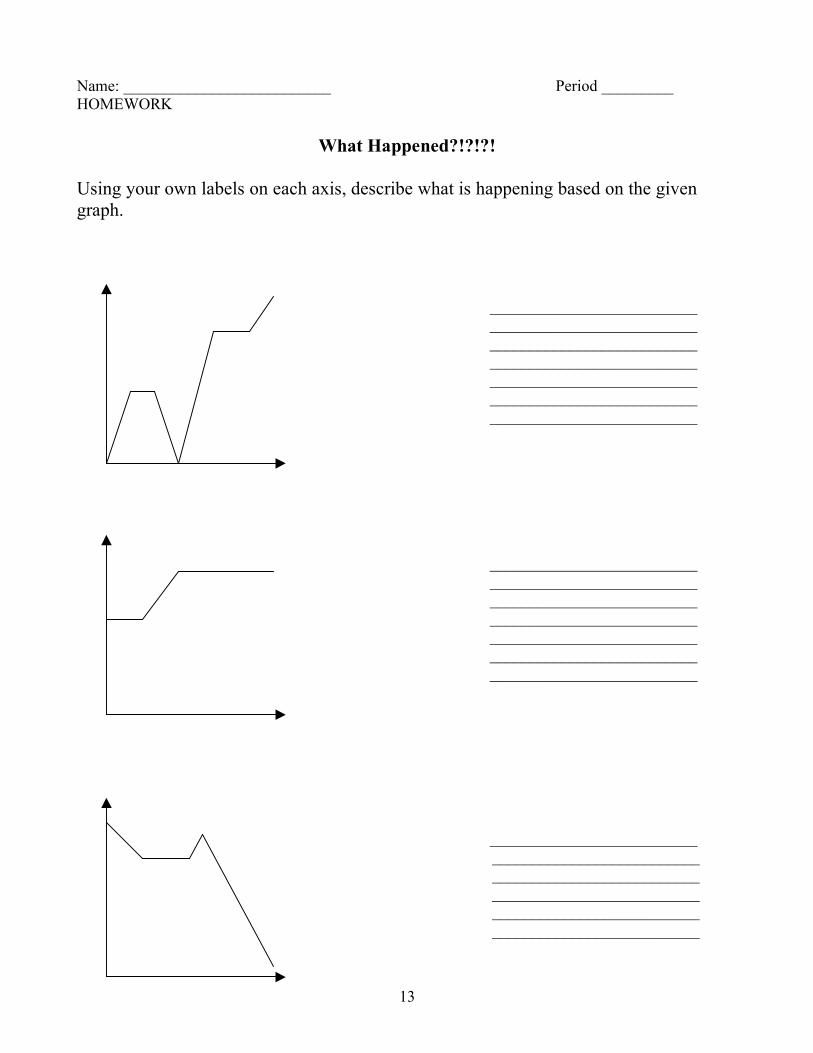
Name: __________________________ Period _________ HOMEWORK
What Happened?!?!?!
Using your own labels on each axis, describe what is happening based on the given graph. __________________________ __________________________ __________________________ __________________________ __________________________ __________________________ __________________________ __________________________ __________________________ __________________________ __________________________ __________________________ __________________________ __________________________ __________________________ __________________________ __________________________ __________________________ __________________________ __________________________
14
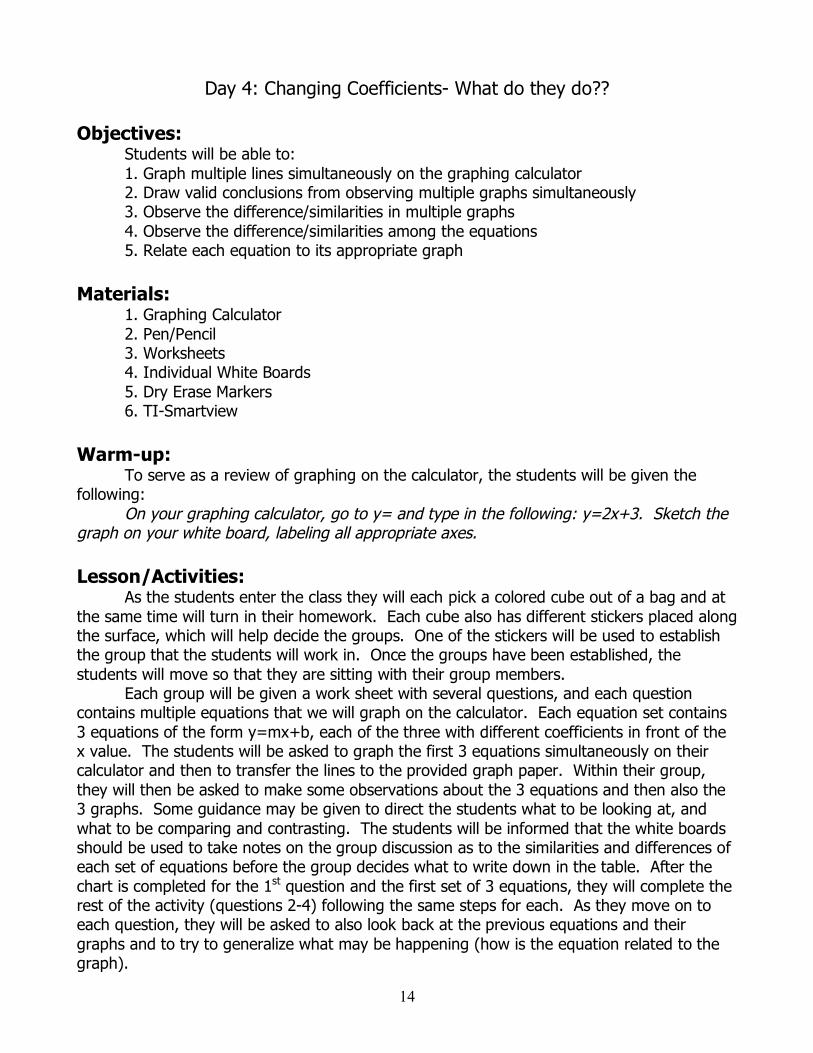
Day 4: Changing Coefficients- What do they do??
Objectives: Students will be able to: 1. Graph multiple lines simultaneously on the graphing calculator 2. Draw valid conclusions from observing multiple graphs simultaneously 3. Observe the difference/similarities in multiple graphs 4. Observe the difference/similarities among the equations 5. Relate each equation to its appropriate graph Materials: 1. Graphing Calculator 2. Pen/Pencil 3. Worksheets 4. Individual White Boards 5. Dry Erase Markers 6. TI-Smartview Warm-up: To serve as a review of graphing on the calculator, the students will be given the following:
On your graphing calculator, go to y= and type in the following: y=2x+3. Sketch the graph on your white board, labeling all appropriate axes. Lesson/Activities: As the students enter the class they will each pick a colored cube out of a bag and at the same time will turn in their homework. Each cube also has different stickers placed along the surface, which will help decide the groups. One of the stickers will be used to establish the group that the students will work in. Once the groups have been established, the students will move so that they are sitting with their group members. Each group will be given a work sheet with several questions, and each question contains multiple equations that we will graph on the calculator. Each equation set contains 3 equations of the form y=mx+b, each of the three with different coefficients in front of the x value. The students will be asked to graph the first 3 equations simultaneously on their calculator and then to transfer the lines to the provided graph paper. Within their group, they will then be asked to make some observations about the 3 equations and then also the 3 graphs. Some guidance may be given to direct the students what to be looking at, and what to be comparing and contrasting. The students will be informed that the white boards should be used to take notes on the group discussion as to the similarities and differences of each set of equations before the group decides what to write down in the table. After the chart is completed for the 1st question and the first set of 3 equations, they will complete the rest of the activity (questions 2-4) following the same steps for each. As they move on to each question, they will be asked to also look back at the previous equations and their graphs and to try to generalize what may be happening (how is the equation related to the graph).
15
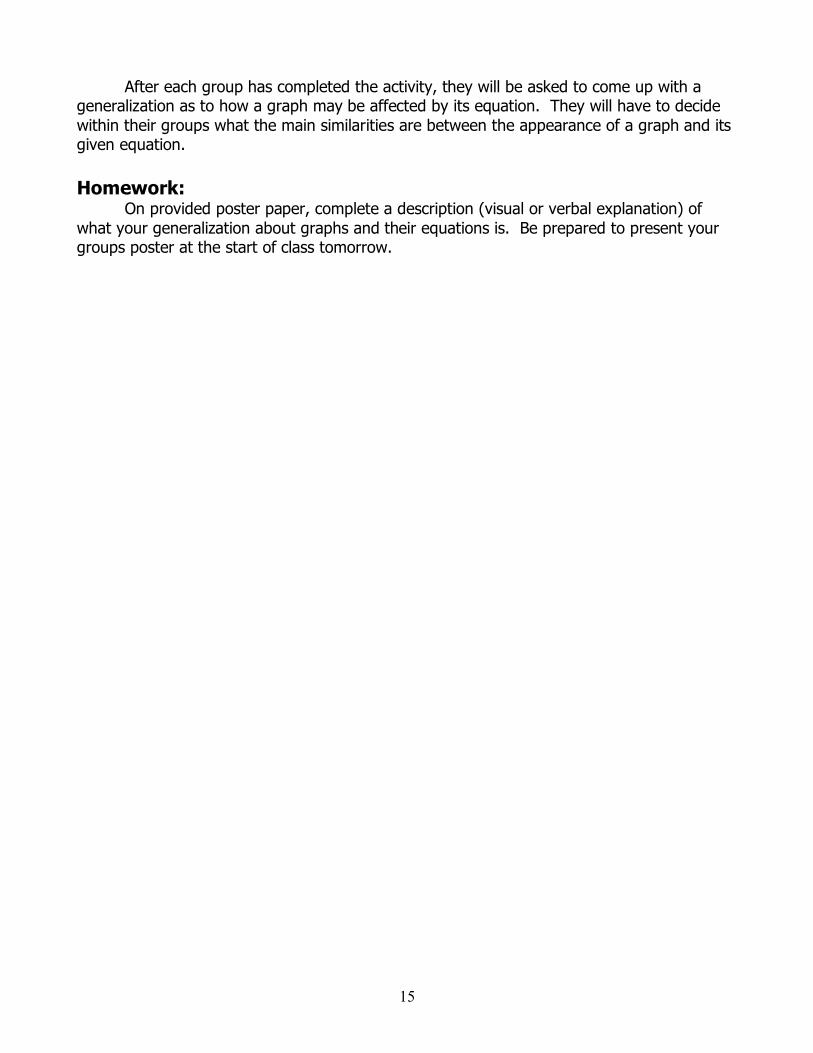
After each group has completed the activity, they will be asked to come up with a generalization as to how a graph may be affected by its equation. They will have to decide within their groups what the main similarities are between the appearance of a graph and its given equation. Homework: On provided poster paper, complete a description (visual or verbal explanation) of what your generalization about graphs and their equations is. Be prepared to present your groups poster at the start of class tomorrow.

16
Name: __________________________ For each question, graph a,b and c at the same time on your calculator. Copy each graph onto the axis graph paper. Complete the chart for both the equation and the graph. Describe the graph (i.e. what is the direction, how steep/shallow is each, etc) and the equations by comparing and contrasting their properties. 1. a. y=4x-2 b. y=1/4x-2 c. y=1x+1
2. a. y=-1/2x+0
b. y=-6x+0 c. y=-1x
Equation Graph
Equation Graph
17
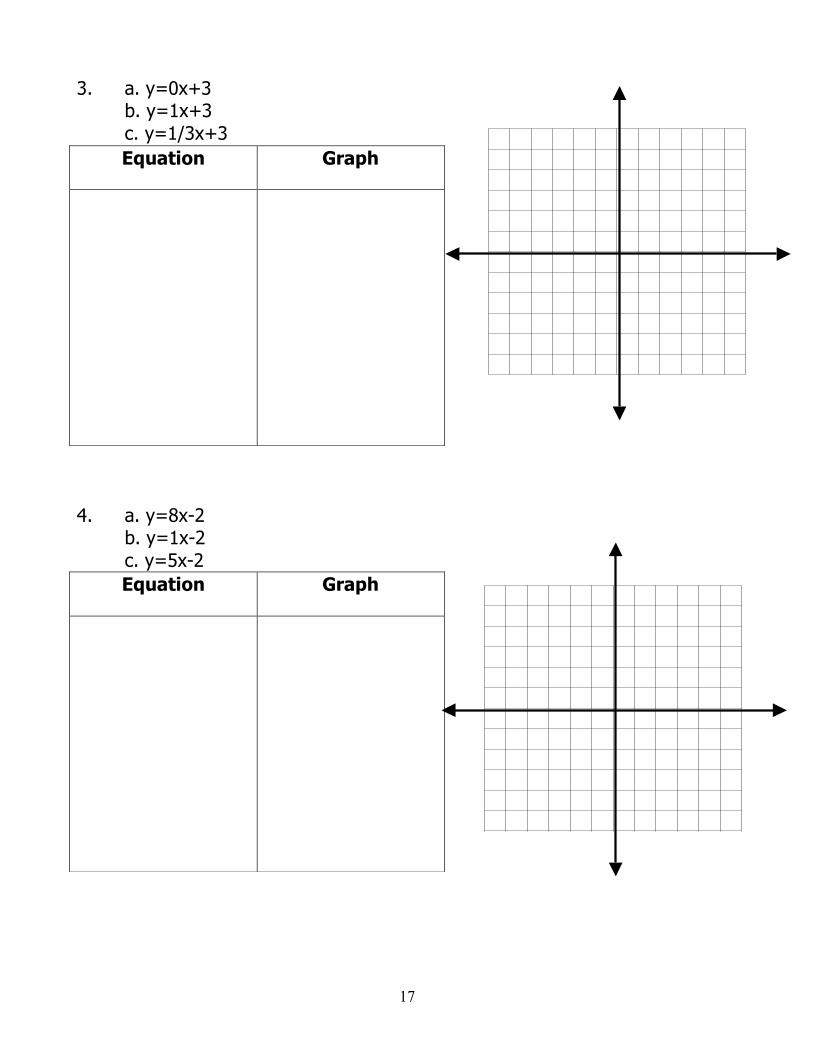
3. a. y=0x+3 b. y=1x+3 c. y=1/3x+3
4. a. y=8x-2 b. y=1x-2 c. y=5x-2
Equation Graph
Equation Graph
18
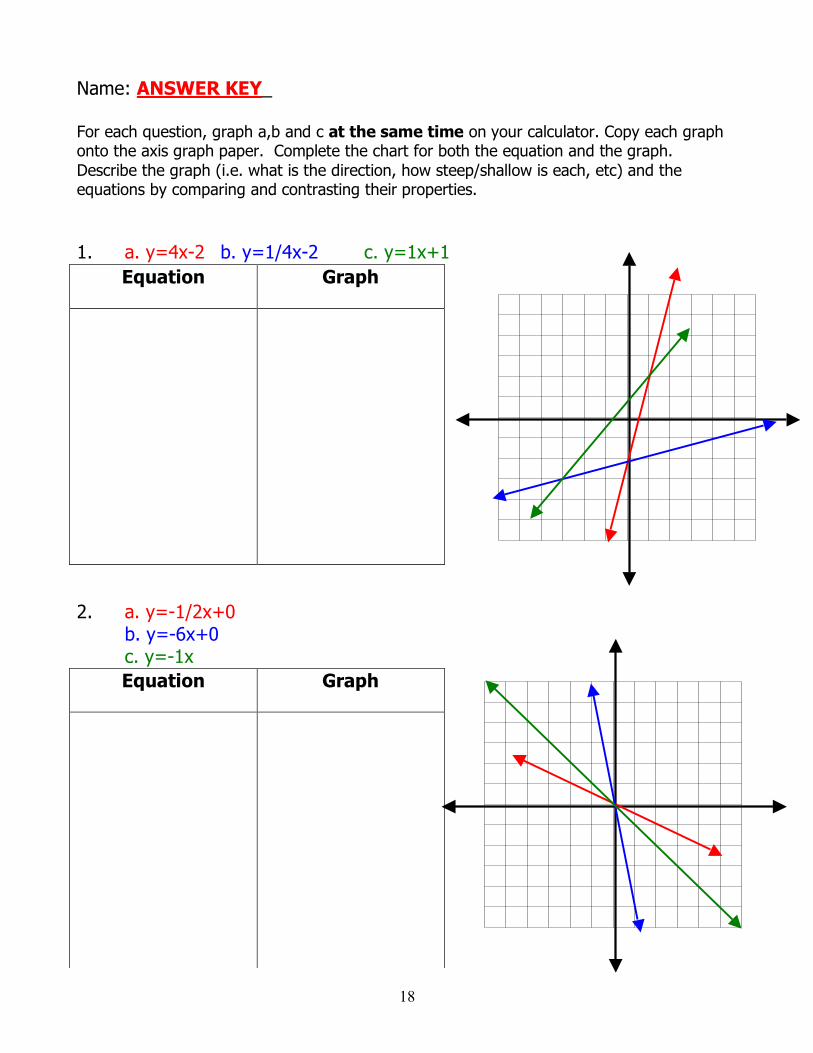
Name: ANSWER KEY_ For each question, graph a,b and c at the same time on your calculator. Copy each graph onto the axis graph paper. Complete the chart for both the equation and the graph. Describe the graph (i.e. what is the direction, how steep/shallow is each, etc) and the equations by comparing and contrasting their properties. 1. a. y=4x-2 b. y=1/4x-2 c. y=1x+1
2. a. y=-1/2x+0
b. y=-6x+0 c. y=-1x
Equation Graph
Equation Graph
19
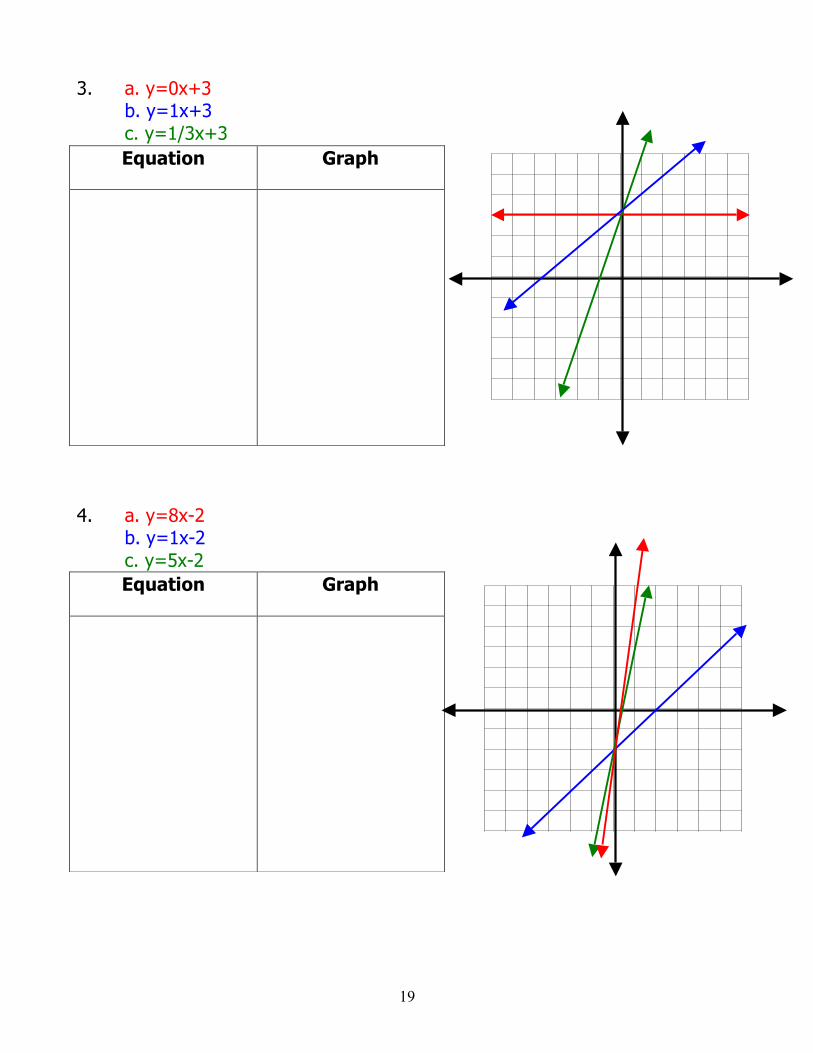
3. a. y=0x+3 b. y=1x+3 c. y=1/3x+3
4. a. y=8x-2 b. y=1x-2 c. y=5x-2
Equation Graph
Equation Graph
20
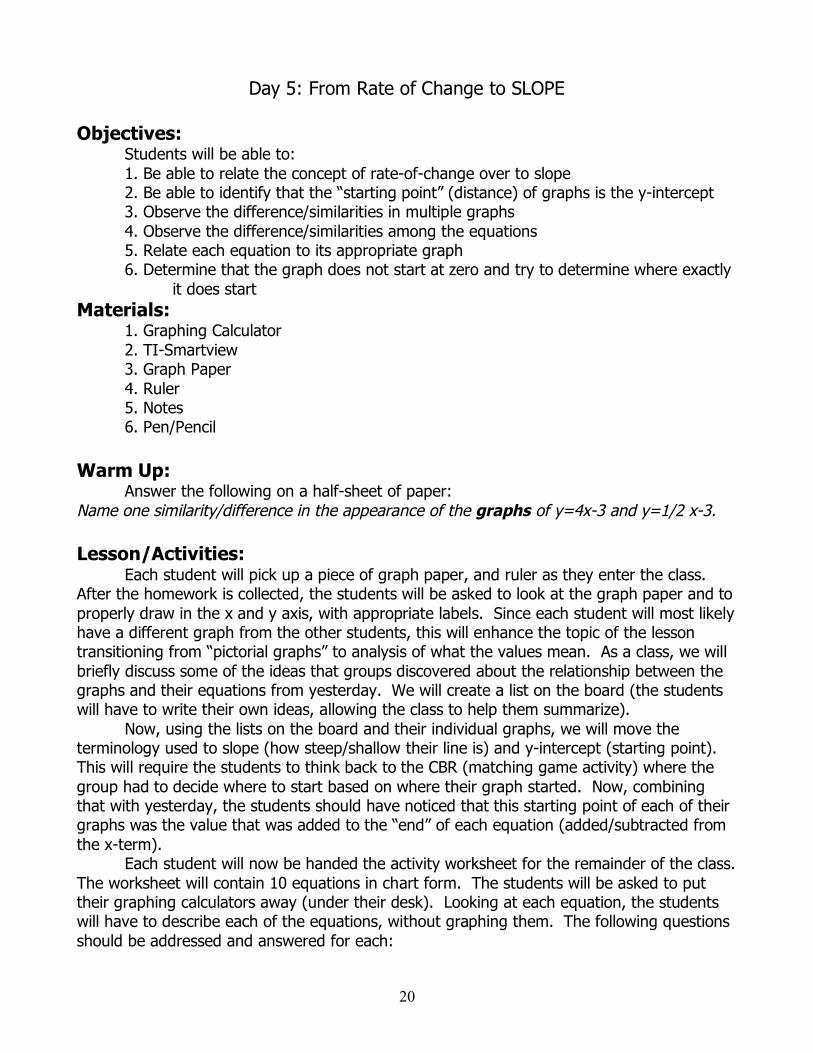
Day 5: From Rate of Change to SLOPE
Objectives: Students will be able to:
1. Be able to relate the concept of rate-of-change over to slope 2. Be able to identify that the “starting point” (distance) of graphs is the y-intercept 3. Observe the difference/similarities in multiple graphs 4. Observe the difference/similarities among the equations 5. Relate each equation to its appropriate graph 6. Determine that the graph does not start at zero and try to determine where exactly it does start
Materials: 1. Graphing Calculator 2. TI-Smartview 3. Graph Paper 4. Ruler 5. Notes 6. Pen/Pencil Warm Up: Answer the following on a half-sheet of paper: Name one similarity/difference in the appearance of the graphs of y=4x-3 and y=1/2 x-3. Lesson/Activities: Each student will pick up a piece of graph paper, and ruler as they enter the class. After the homework is collected, the students will be asked to look at the graph paper and to properly draw in the x and y axis, with appropriate labels. Since each student will most likely have a different graph from the other students, this will enhance the topic of the lesson transitioning from “pictorial graphs” to analysis of what the values mean. As a class, we will briefly discuss some of the ideas that groups discovered about the relationship between the graphs and their equations from yesterday. We will create a list on the board (the students will have to write their own ideas, allowing the class to help them summarize). Now, using the lists on the board and their individual graphs, we will move the terminology used to slope (how steep/shallow their line is) and y-intercept (starting point). This will require the students to think back to the CBR (matching game activity) where the group had to decide where to start based on where their graph started. Now, combining that with yesterday, the students should have noticed that this starting point of each of their graphs was the value that was added to the “end” of each equation (added/subtracted from the x-term). Each student will now be handed the activity worksheet for the remainder of the class. The worksheet will contain 10 equations in chart form. The students will be asked to put their graphing calculators away (under their desk). Looking at each equation, the students will have to describe each of the equations, without graphing them. The following questions should be addressed and answered for each:
21
1. Is the line steep/shallow? 2. Where does the graph start? 3. Describe the overall appearance of the line. 4. What is the y-intercept? 5. What is the slope? This worksheet is necessary for homework, so it will not be collected until tomorrow’s class. Closure: Which line would be steeper, y=1/4x+6 or y=1/2x-5? Why? Homework: From the 10 equations described in class, sketch each of the graphs on the provided graph paper (all 10 graphs on the same axes). Label each one appropriately.
22
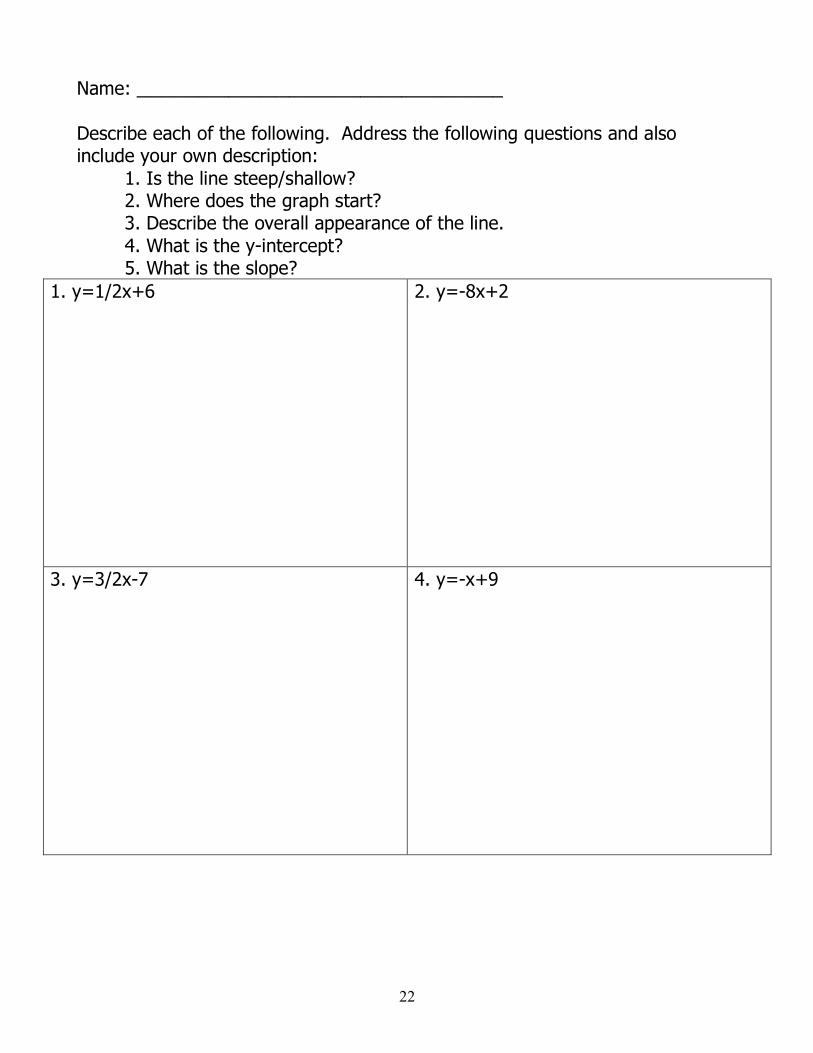
Name: ____________________________________ Describe each of the following. Address the following questions and also include your own description: 1. Is the line steep/shallow? 2. Where does the graph start? 3. Describe the overall appearance of the line. 4. What is the y-intercept? 5. What is the slope?
1. y=1/2x+6 2. y=-8x+2
3. y=3/2x-7 4. y=-x+9
23
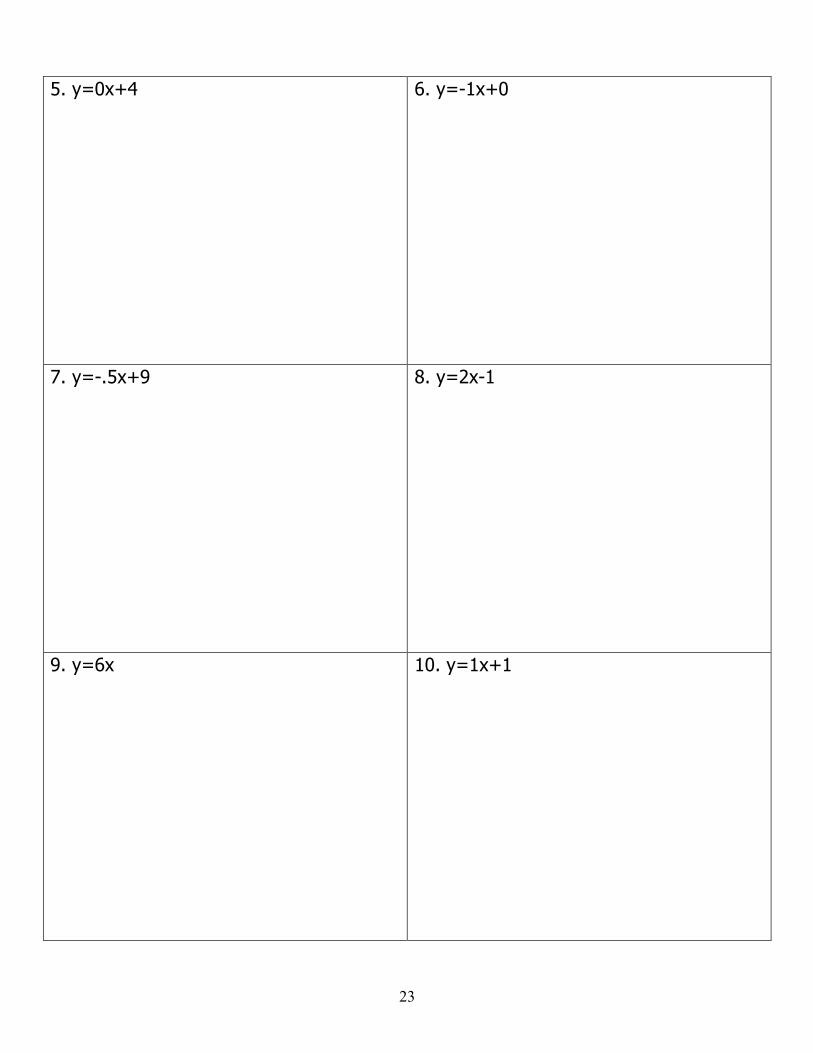
5. y=0x+4 6. y=-1x+0
7. y=-.5x+9 8. y=2x-1
9. y=6x 10. y=1x+1
24
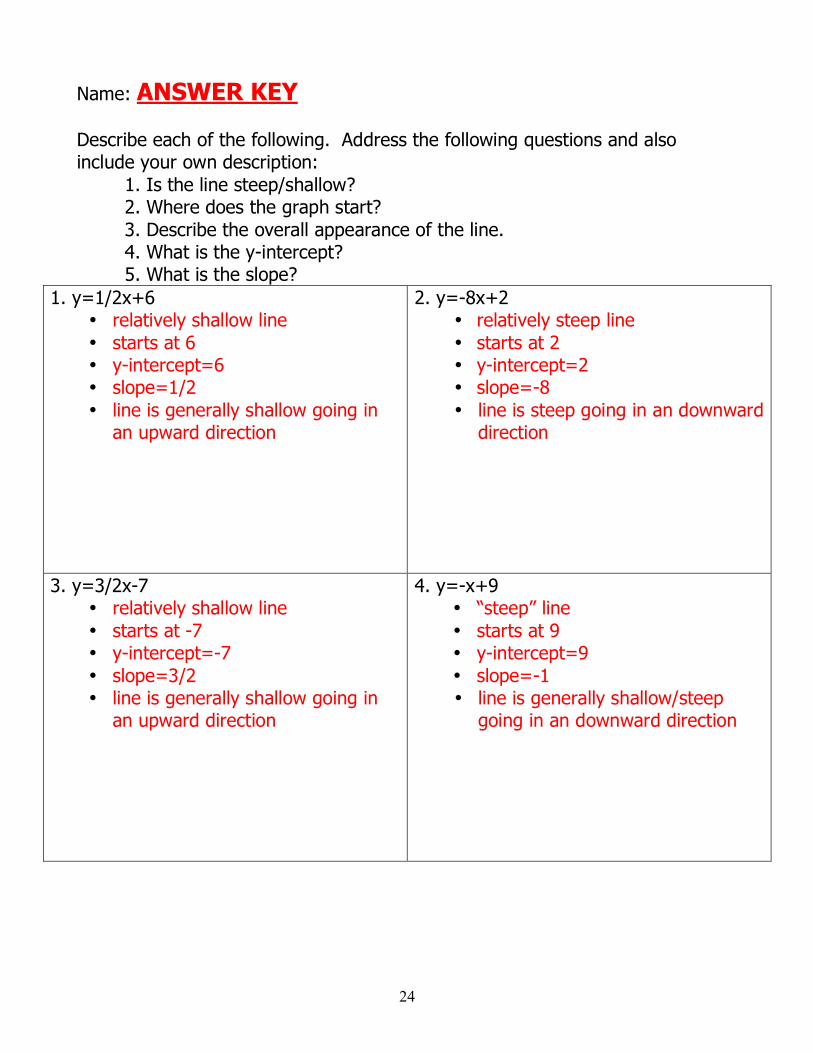
Name: ANSWER KEY Describe each of the following. Address the following questions and also include your own description: 1. Is the line steep/shallow? 2. Where does the graph start? 3. Describe the overall appearance of the line. 4. What is the y-intercept? 5. What is the slope?
1. y=1/2x+6 • relatively shallow line • starts at 6 • y-intercept=6 • slope=1/2 • line is generally shallow going in
an upward direction
2. y=-8x+2 • relatively steep line • starts at 2 • y-intercept=2 • slope=-8 • line is steep going in an downward
direction
3. y=3/2x-7 • relatively shallow line • starts at -7 • y-intercept=-7 • slope=3/2 • line is generally shallow going in
an upward direction
4. y=-x+9 • “steep” line • starts at 9 • y-intercept=9 • slope=-1 • line is generally shallow/steep
going in an downward direction
25
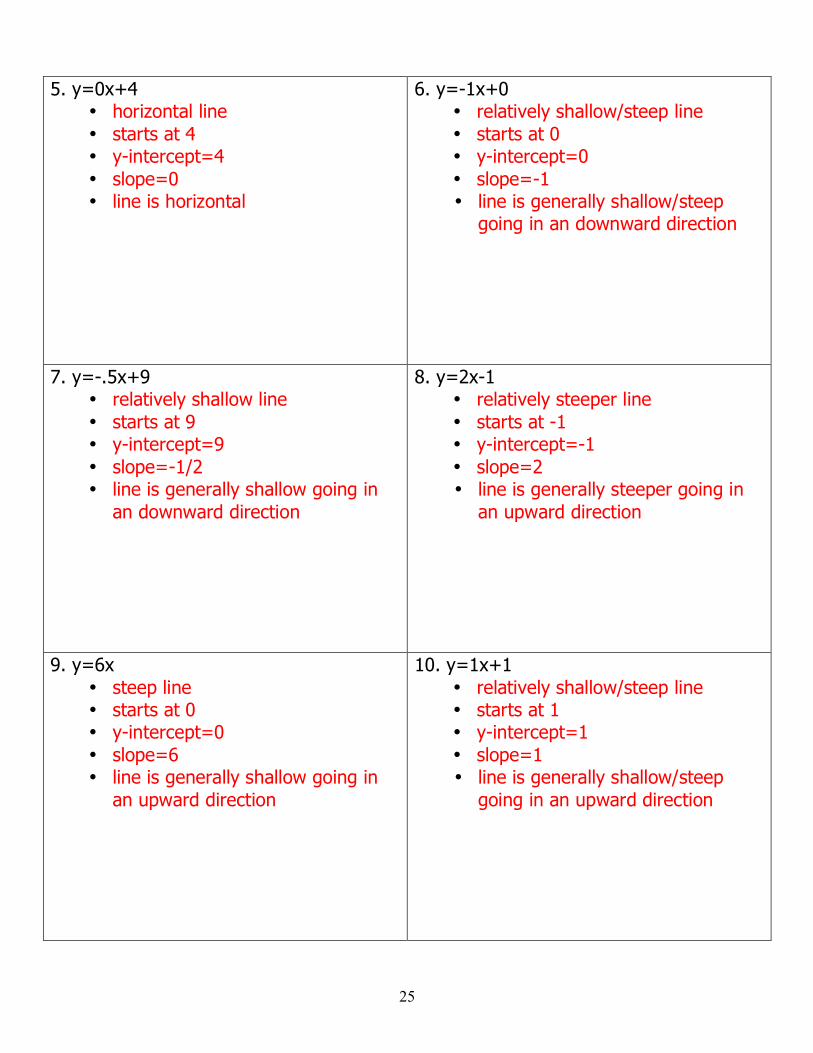
5. y=0x+4 • horizontal line • starts at 4 • y-intercept=4 • slope=0 • line is horizontal
6. y=-1x+0 • relatively shallow/steep line • starts at 0 • y-intercept=0 • slope=-1 • line is generally shallow/steep
going in an downward direction
7. y=-.5x+9 • relatively shallow line • starts at 9 • y-intercept=9 • slope=-1/2 • line is generally shallow going in
an downward direction
8. y=2x-1 • relatively steeper line • starts at -1 • y-intercept=-1 • slope=2 • line is generally steeper going in
an upward direction
9. y=6x • steep line • starts at 0 • y-intercept=0 • slope=6 • line is generally shallow going in
an upward direction
10. y=1x+1 • relatively shallow/steep line • starts at 1 • y-intercept=1 • slope=1 • line is generally shallow/steep
going in an upward direction