Embed Size (px)
Citation preview
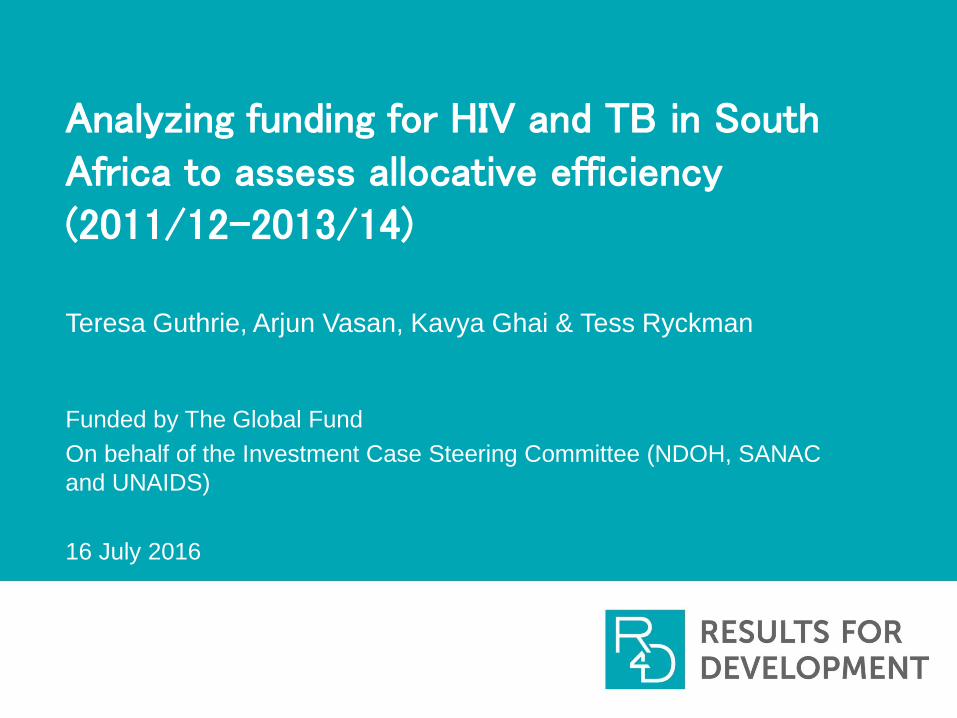
Analyzing funding for HIV and TB in South Africa to assess allocative efficiency
(2011/12-2013/14)
Funded by The Global Fund
On behalf of the Investment Case Steering Committee (NDOH, SANAC
and UNAIDS)
16 July 2016
Teresa Guthrie, Arjun Vasan, Kavya Ghai & Tess Ryckman

Outline of this presentation
Purpose and methodology
Key Findings:
National analysis
Provincial breakdown
District breakdown
Key Messages
2 | R4D.org

Purpose of this analysis
The national, provincial, and district-level analysis of spending on
HIV and TB in South Africa was intended to supplement the cost
estimates undertaken for the Investment Case, and attempted to
answer the following questions:
1. How much money was spent on HIV and TB by the South African
Government (SAG), PEPFAR, and the Global Fund in the years
2011/12 to 2013/14 – are there issues affecting sustainability?
2. How was this money spent across interventions and geographies,
and by funding source – were these the ‘optimal’ mix/ balance?
3. What financial and epidemiological data challenges limit our
understanding – what needs to be improved to ensure that
geographical targeting (hotspots) has the impact we hope for?
3 | R4D.org

Basic Methodology
4 | R4D.org
• Collected HIV and TB
spending from PEPFAR
EA, Global Fund EFRs,
and SAG BAS & NT
reports
• SAG = DOH, DOE,
DSD, DCS, SAPS, DOD
and other ES (if labelled
HIV (BAS records & NT
records)
• TB out-patient estimated
spending was calculated
based on provincial
patient # and unit costs
• 3 datasets consolidated
into one (common
structure based on BAS –
country suitability)
• 6 sets of spending
categories were
“crosswalked” or
reconciled
• Analysis of Excel
consolidated database
• Matrices and graphs
generated
• Draft figures were
approved by NDOH, NT,
PEPFAR and GF
Collect Inputs Crosswalk Analysis
1 2 3

Six sets of spending categories were “crosswalked” (or reconciled) to the public BAS ‘common codes’
6 | R4D.org
Spending Category Example
South Africa IC Categories “Treatment & Care”
NASA Categories
“ASC.02.01.03.98
Antiretroviral therapy not
disaggregated neither by age
nor by line of treatment”
SHA Categories“HC.1.3.1 General outpatient
curative care”
Global Fund SDA
Categories *
“Care and support for the
chronically ill”
PEPFAR EA Program Areas
**“FBTCS”
BAS – 300 different names
for 35 core programs -
consolidated
“ART”
BAS
Common
Codes
* Global Fund EFR data were not split by district. Estimates were used based on
indicative split
** PEPFAR data not split by district
1
2
3
4
5
6

Outline
Purpose and methodology
Key Findings:
National analysis
Provincial breakdown
District breakdown
Key Messages
9 | R4D.org

National Analysis – SAG, GF, PEPFAR
10 | R4D.org

The SAG contributes the majority of funding, which mainly goes to HIV
11 | R4D.org
5
20
10
15
0
25
2013
17.8
22.1
3.7
3.9
0.2
0.719.217.4
13.3
0.4
2011
14.9
3.9
2012
GF
PEPFAR
SAG
Total HIV and TB spending by source
ZAR Billions
25
20
15
10
5
0
15.7
2011
17.4
3.30.2
13.8
0.23.4
3.7
2013
22.1
0.4
18.0
2012
19.2
Total HIV and TB spending by focus
ZAR Billions
TB
HIV/TB
HIV
US$ 2.3 billion in 2013/14SAG = 80% (16% inc ann.av)PEFPAR = 17% (5% dec)GF = 3% (77% increase)
NB. GF TB expenditure could not be separated within the SDAs. Excludes USAID additional contributions to TB (not reported in the EA data): USG FY11: $13,972,000, USG FY12: $12,000,000, USG FY13: $12,008,901.

Spending by thematic split for HIV has changed over time, but what should be the optimal mix?
18
16
10
6
4
2
0
8
14
12
7
2008 (NASA)
1
2012 (IC)
2010 (est)
2009 (NASA)
2007 (NASA)
2011 (IC)
2013 (IC)
4
12
Billions ZAR
Enabling Env
Social ProtectionPrevention OVC Support
Treatment & Care Prog, Mgmt & Sys Strgthening
Research
0%
10%
20%
30%
40%
50%
60%
70%
80%
90%
100%
2010 (est)
2012 (IC)
2011 (IC)
72.8%
2009 (NASA)
2008 (NASA)
13.0%
2007 (NASA)
2013 (IC)
65.8%
20.0%
Historical Thematic Spending Historical Thematic Spending (%)

Comparing 2013/14 spending with 2014/15 Resource Needs Estimates could help answer adequacy and allocative efficiency questions
10
24
6
4
26
2
20
16
8
0
22
14
18
12
Non SA IC plus not disagg.TB
Billions ZAR
Social behaviour change communication
Programme & Social Enablers
PMTCT
Other biomedical prevention
26
Care and treatment
17%
RNE 2014/15
49%
12%24%
15%
40%
Actual 2013/14
22
18%
HCT
Comprehensive condom programming
Medical male circumcision
Key populations
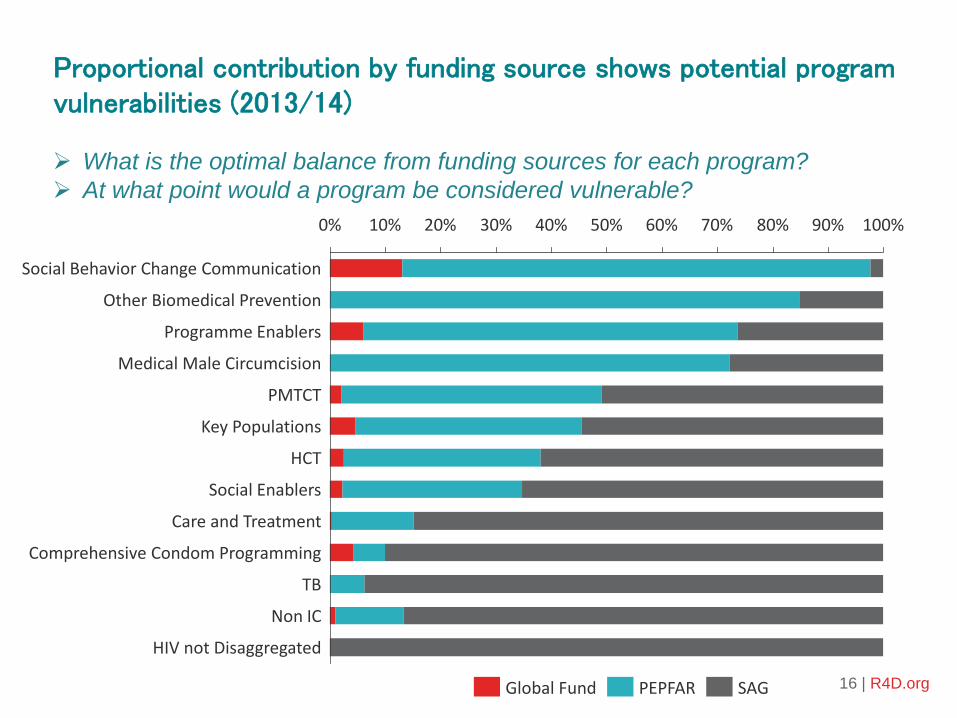
Proportional contribution by funding source shows potential program vulnerabilities (2013/14)
16 | R4D.org
10% 40%0% 30%20% 70% 90%60% 100%50% 80%
TB
Social Enablers
Medical Male Circumcision
PMTCT
Key Populations
HCT
Non IC
HIV not Disaggregated
Comprehensive Condom Programming
Other Biomedical Prevention
Programme Enablers
Care and Treatment
Social Behavior Change Communication
Global Fund SAGPEPFAR
What is the optimal balance from funding sources for each program?
At what point would a program be considered vulnerable?
Provincial Analysis – SAG, GF, PEPFAR
17 | R4D.org

Does variance in spending per HIV+ person imply technical and/or allocative efficiency? (2012/13, ZAR)
5,271
2,401
3,437
2,469
1,900
3,258
0
500
1,000
1,500
2,000
2,500
3,000
3,500
4,000
4,500
5,000
5,500
3.0
2.5
1.0
1.5
2.0
0.5
0.0
3.5
4.0
Ab
ove
Nat
ion
al
Nat
ion
al
HIV
Spe
nd
pe
r HIV
+ Pe
rson
(ZAR
)To
tal P
rovi
nci
al S
pe
nd
(B
illio
ns
ZAR
)
2,560
KwaZ
ulu
Nat
al
Gau
ten
g
1,9531,788
East
ern
Cap
e
No
rth
ern
Cap
e
Free
Sta
te
No
rth
Wes
t
Nat
& P
rov
no
t d
isag
greg
Mp
um
alan
ga
Lim
po
po
Wes
tern
Cap
e
SAGPEPFARGlobal Fund
National Avg. Spend per HIV+ Person
(2,480)

Provincial proportional HIV spending by intervention – by all 3 sources (2013/14). What is the best mix?
• Treatment & Care = on average 48% [26% in NW – 66% in GP]• HCT = average 6% [2% NW – 10% KZN]• MMC = average 3% [1% in EC, NW, LP, NC – 8% in MP]• PMTCT = average 3% [0% in NW – 6% in WC]• Prog. Enablers = average 7% [1% in KZN – 52% in NW]• National level = 40% not disagg.,15% prog.enablers, 12% SBCC, 9% treatment
0% 10% 20% 30% 40% 50% 60% 70% 80% 90% 100%
KwaZuluNatal
Gauteng
EasternCape
WesternCape
Mpumalanga
NorthWest
FreeState
Limpopo
NorthernCape
Nat&Provnot
Na onal
AboveNa onal
Averageofprovinces
Careandtreatment
Compr.condomprogramming
HCT
HIVnotdisaggregated
Keypopula ons
Medicalmalecircumcision
NonSAIC
Otherbiomedicalpreven on
PMTCT
ProgrammeEnablers
Socialbehaviourchangecommunica on
SocialEnablers
IC % Priority Split
District Analysis: Gauteng, preliminary data example
(noting a lack of district specific HIV-prevalence data limiting comparison – pending)
21 | R4D.org

Gauteng DOH spending: total and per HIV+ person, per year (2013/14, ZAR)
1,0321,072
1,685
1,8191,861
0
500
1,000
1,500
2,000
ZAR
Tsh
wan
e
Joh
ann
esb
urg
Eku
rhu
len
i
Sed
iben
g
Wes
t R
and
Provincial Average (1,419)
1.0
0.7
0.8
0.9
0.4
0.5
0.6
0.1
0.3
0.0
0.2
Joh
ann
esb
urg
Wes
t R
and
Tsh
wan
e
No
t D
isag
g.
Pro
vin
cial
Lev
el
Sed
iben
g
0.20.2
HIV
Sp
en
din
g B
illio
ns
ZAR
Eku
rhu
len
i
0.4
0.0
1.0
0.1
0.5
DOH Voted
DOH HIV CG
Total spending Spending per HIV + person

Gauteng DOH District HIV Spending by intervention (2013/14)
• District split mostly similar• Provincial level mostly training• MMC and key population spending was not
disaggregated by district – so cannot see what was the % of total prevention spending per district – but appears to be less than 20%
0.0
0.1
0.5
0.2
0.7
0.4
0.9
0.6
0.3
0.8
1.0
Eku
rhu
len
i
Sed
iben
g
Job
urg
Tsh
wan
e
Bill
ion
s ZA
R
Pro
v. L
evel
Wes
t R
and
ND
Key Pops
Medical Male Circumcision
Other biomedical prevention
Prog Enablers HCT
Condom Programming
Non IC
Care and Trx
30%
0%
90%
20%
60%
50%
10%
70%
80%
100%
40%
Tsh
wan
e
Eku
rhu
len
i
Job
urg
Wes
t R
and
ND
Sed
iben
g
Pro
v. L
evel
Gauteng District Spending (%)Gauteng District Spending

Key Messages
• South Africa appears to be achieving, or moving towards, allocativeefficiency – at national level. Spending on mostly priority interventions with proven cost effectiveness according to Investment Case.
• The non-IC spending (15% of ’13/’14 total spending) was on interventions with limited evidence of efficacy. But are these the supportive (programme enablers) that are essential for greatest impact?
• Sub-national analysis shows variations warranting further examination, mostly explained by poor financial management systems.
• Important to align and consolidate expenditure data from key funding sources – make routine in-country (aligned to the public financial reporting structure & SHA for sustainability/ routine monitoring eg. Botswana, Zimbabwe, Kenya).
• Difficult to ascertain the optimal mix of services, and the most efficient allocation of resources – without an Investment Case or Optima.
• Lack of financial and prevalence data at the district-level hinders district comparisons. This is critical going forward to ascertain the best targeted use of resources.
• TB: limited cost, spending, and impact data.

Thanks to:
July 2016
• Global Fund• Investment Case Steering Committee: • NDOH, SANAC & UNAIDS• Nat Treasury• Gesine Meyer Rath• The R4D Team
Teresa Guthrie (Independent Consultant)[email protected] Vasan (Results for Development Institute)[email protected]