Embed Size (px)
Citation preview

Portland State UniversityPDXScholarCivil and Environmental Engineering Master'sProject Reports Civil and Environmental Engineering
2015
Analyzing Free-Base Nicotine Content in the Particulate Matter ofMainstream Tobacco Smoke Using a Headpace Solid-PhaseMicroextraction GC/MS MethodChristopher S. MottiPortland State University, [email protected]
Let us know how access to this document benefits you.Follow this and additional works at: http://pdxscholar.library.pdx.edu/cengin_gradprojects
Part of the Civil and Environmental Engineering Commons
This Project is brought to you for free and open access. It has been accepted for inclusion in Civil and Environmental Engineering Master's ProjectReports by an authorized administrator of PDXScholar. For more information, please contact [email protected].
Recommended CitationMotti, Christopher S., "Analyzing Free-Base Nicotine Content in the Particulate Matter of Mainstream Tobacco Smoke Using aHeadpace Solid-Phase Microextraction GC/MS Method" (2015). Civil and Environmental Engineering Master's Project Reports. Paper16.

ANALYZING FREE-BASE NICOTINE CONTENT IN THE
PARTICULATE MATTER OF MAINSTREAM TOBACCO SMOKE
USING A HEADSPACE SOLID-PHASE MICROEXTRACTION
GC/MS METHOD
BY
CHRISTOPHER S. MOTTI
A research project report submitted in partial fulfillment
of the requirement for the degree of
MASTER OF SCIENCE
IN
CIVIL AND ENVIRONMENTAL ENGINEERING
Project Advisor:
James F. Pankow
Portland State University
©2015

ii

iii
ACKNOWLEDGMENTS
Many thanks to:
Dr. James F. Pankow
Wentai Luo
The faculty and staff of Maseeh College of Engineering & Computer Science, Civil &
Environmental Engineering Department
My fellow engineering students
My parents
Without the exceptional guidance and support from these people, this project would have
never been possible.

iv
ABSTRACT
The acid/base chemistry of cigarette smoke allows nicotine, the primary drug in
mainstream tobacco smoke, to exist in protonated and free-base forms. Evidence suggests that
most of the nicotine present in mainstream tobacco smoke is in the particle phase. αfb is the
fraction of particle-phase nicotine in the free-base form. The magnitude and rate of nicotine
deposition in the respiratory tract is dependent on αfb because only the free-base form of nicotine
can volatilize from the particle phase of an inhaled aerosol and, once gaseous, rapidly deposit.
This study develops a headspace solid-phase microextraction technique coupled with gas
chromatography/mass spectrometry analysis that effectively quantifies αfb. The developed
method is used to study the αfb of several commercial cigarette brands. This research has
important implications on the drug delivery rate and addiction potential of inhaled mainstream
tobacco smoke particulate matter.
v
TABLE OF CONTENTS
1.0 INTRODUCTION ......................................................................................................................................... 1
1.1 ACID/BASE CHEMISTRY OF NICOTINE ................................................................................................. 1 1.2 THEORY OF SPME ...................................................................................................................................... 2 1.3 HS-SPME APLIED TO TOBACCO SMOKE ............................................................................................... 3
2.0 METHODS .................................................................................................................................................... 4
2.1 PARTICLE COLLECTION/EXTRACTION PROTOCOL .......................................................................... 4 2.2 METHOD DEVELOPMENT ........................................................................................................................ 5 2.3 FINAL METHOD .......................................................................................................................................... 7 2.4 GC/MS PARAMETERS ................................................................................................................................ 8
3.0 RESULTS AND DISCUSSION .................................................................................................................... 9
3.1 DEVELOPMENT PHASE ............................................................................................................................ 9 3.2 FINAL EXPERIMENTAL PHASE ............................................................................................................. 15
4.0 CONCLUSION ............................................................................................................................................ 17
5.0 REFERENCES ............................................................................................................................................ 18
6.0 APPENDIX .................................................................................................................................................. 19
6.1 TABLES ...................................................................................................................................................... 19 6.2 FIGURES ..................................................................................................................................................... 26

vi
LIST OF TABLES
Table 1. HS-SPME/GC/MS replicate results for Marlboro Special Blend 100s............................................................ 9 Table 2. Free-base nicotine percentage for four vials containing PM from the same filter (Silver Eagle Gold 100s). 14 Table 3. Mainstream tobacco smoke particulate matter free-base nicotine content for various brands/types of
cigarettes and “cigars”. ............................................................................................................................... 15 Table 4. Free-base nicotine percentage, percent errors, and αfb values for Marlboro Red Label 100s (soft-pack). ..... 15 Table 5. Free-base nicotine percentage, percent errors, and αfb values for Cheyenne Full Flavor 100s “Cigars”. ...... 15 Table 6. HS-SPME/GC/MS FB nicotine peak area variations with increasing nicotine content. Data corresponds to
Figure 5. ..................................................................................................................................................... 19 Table 7. HS-SPME/GC/MS FB nicotine peak area variations with increasing nicotine content. Data corresponds to
Figure 11. ................................................................................................................................................... 19 Table 8. Nicotine response for various SPME fiber exposure times. Data corresponds to Figures 6 and 7. ............... 20 Table 9. Nicotine response for various SPME fiber exposure times. Data corresponds to Figures 12 and 13. ........... 20 Table 10. GC/MS nicotine peak area variations over multiple gas phase ammonia additions. Data corresponds to
Figure 8. ..................................................................................................................................................... 21 Table 11. GC/MS nicotine peak area variations over multiple gas phase ammonia additions. Data corresponds to
Figure 14 and Table 3. ................................................................................................................................ 21 Table 12. GC/MS nicotine peak area variations over multiple gas phase ammonia additions. Data corresponds to
Figure 15. ................................................................................................................................................... 22 Table 13. GC/MS nicotine peak area variations over multiple gas phase ammonia additions using a metal filter
holder with conical headspace. Data corresponds to Figure 9. ................................................................... 22 Table 14. GC/MS nicotine peak area variations over multiple gas phase ammonia additions using a glass VOA vial
as the filter holder. Data corresponds to Figure 10. .................................................................................... 23 Table 15. GC/MS nicotine peak area variations over multiple gas phase ammonia additions using a metal filter
holder with cylindrical headspace. Data corresponds to Figure 16. ........................................................... 23 Table 16. Nicotine response for four vials containing PM from the same filter. This data corresponds to Table 2. ... 24 Table 17. Nicotine response for three samples of MTS PM from Marlboro Red Label 100s. This data corresponds to
Table 4. ....................................................................................................................................................... 24 Table 18. Nicotine response for three samples of MTS PM from Cheyenne Full Flavor 100s Cigars. This data
corresponds to Table 5. ............................................................................................................................... 25

vii
LIST OF FIGURES
Figure 1. The three forms of nicotine (1). ...................................................................................................................... 1 Figure 2. Schematic of HS-SPME extraction from a sealed vial. .................................................................................. 2 Figure 3. The smoking apparatus. .................................................................................................................................. 4 Figure 4. The SPME fiber holder and filter holder during SPME fiber headspace exposure. ....................................... 6 Figure 5. HS-SPME/GC/MS FB nicotine peak area variations with increasing nicotine content. .............................. 10 Figure 6. Pre-ammonia addition nicotine peak areas for a range of exposure times (Marlboro Special Blend 100s). 11 Figure 7. Post-ammonia addition peak areas for a range of exposure times (Marlboro Special Blend 100s). ............ 11 Figure 8. GC/MS nicotine peak area variations over multiple gas phase ammonia additions (Marlboro Special Blend
100s). .......................................................................................................................................................... 12 Figure 9. GC/MS nicotine peak area variations over multiple gas phase ammonia additions using a metal filter
holder with conical headspace (Silver Eagle Gold 100s). .......................................................................... 13 Figure 10. GC/MS nicotine peak area variations over multiple gas phase ammonia additions using a glass VOA vial
to contain the filter (Silver Eagle Gold 100s). ............................................................................................ 14 Figure 11. HS-SPME/GC/MS FB nicotine peak area variations with increasing nicotine content (second run). ....... 26 Figure 12. Pre-ammonia addition nicotine peak areas for a range of exposure times Silver Eagle Gold Cigarettes
(100s, flip-top box). .................................................................................................................................... 26 Figure 13. Post-ammonia addition nicotine peak areas for a range of exposure times Silver Eagle Gold Cigarettes
(100s, flip-top box). .................................................................................................................................... 27 Figure 14. GC/MS nicotine peak area variations over multiple gas phase ammonia additions (American Spirit
Natural). ...................................................................................................................................................... 27 Figure 15. GC/MS nicotine peak area variations over multiple gas phase ammonia additions (Silver Eagle Gold
100s). .......................................................................................................................................................... 28 Figure 16. GC/MS nicotine peak area variations over multiple gas phase ammonia additions using a metal filter
holder with cylindrical headspace (Silver Eagle Gold 100s). ..................................................................... 28

1
1.0 INTRODUCTION
1.1 ACID/BASE CHEMISTRY OF NICOTINE
Due to its acid/base chemistry, nicotine can exist in three forms in the particulate matter of
(PM) mainstream tobacco smoke (MTS), a diprotonated form, a monoprotonated form, and an
unprotonated or free-base (FB) form. The protonated forms are non-volatile and therefore only
occur in the PM of the smoke. Evidence suggests that most of the nicotine in MTS is found in the
PM phase (1). Smoke particles have been observed to deposit in the respiratory tract (RT) with
about 50% efficiency, while gas phase nicotine deposits rapidly. Since protonated nicotine is not
volatile, only the free-base form may volatilize from the PM phase to the gaseous phase of an
inhaled aerosol. Thus, the fraction of nicotine that exists in the free-base form is important when
understanding the magnitude and rate of nicotine absorbed by a smoker.
Figure 1. The three forms of nicotine (1).
As the effective pH of MTS PM increases from above about 6.0, an increasing amount of
nicotine occurs in the free-base form (2). This volatile form is rapidly absorbed and believed to
be perceived by the smoker as a nicotine “impact” or “kick”. The greater the impact, the more
addictive the cigarette. The free-base form is denoted as Nic, the monoprotonated form as NicH+,
and the deprotonated as NicH22+
(Figure 1). Due to its relatively low concentrations for typical
effective pH ranges of MTS, the diprotonated form can be neglected. Therefore, the fraction of
volatile, free-base nicotine (αfb) in the PM phase of tobacco smoke is approximated by:
��� � �Nic
�Nic � �NicH
(1)

2
1.2 THEORY OF SPME
Headspace solid-phase microextraction (HS-SPME) is a useful sample extraction
technique that has unique capabilities for the chromatographic analysis of chemicals in difficult
matrices (3), making it well suited for measuring αfb. The technique relies on the extraction of
analytes from a headspace (HS) of an sample. The fiber is held over a sealed sample for a set
period of time at a constant temperature. The equilibrated sample will predictably partition
between the liquid phase and the gas phase. A sorptive coating on the SPME fiber absorbs
analytes from the HS. The exposure time selected is affected by the Henry’s Constant (Kh) of the
analyte. Substances with high Kh values require a shorter exposer time because there will be an
abundance of analyte in the gaseous HS. Conversely, substances with low Kh values can require
longer exposure times because the process of diffusion from the condensed phase to the gas
phase will be slow (4). After fiber exposure, solutes are transferred from the SPME coating to an
inlet system that desorbs the solutes into a flowing gas phase for determination by gas
chromatography/mass spectrometry (GC/MS) (3).
Figure 2. Schematic of HS-SPME extraction from a sealed vial.

3
1.3 HS-SPME APLIED TO TOBACCO SMOKE
The evaluation of the FB nicotine content of MTS PM collected on a Cambridge filter pad
(CFP) can proceed by the HS-SPME process. After MTS PM is collected on the CFP, the filter is
sealed retained in the filter holder, and a septum is added at the top. After allowing sufficient
time for particles to settle and analytes to equilibrate between the PM phase (on the filter) and
the gas phase (in the HS), the SPME fiber is exposed to the HS for a set period of time. Any
nicotine present in the gas phase is in the FB form (5). Analysis by GC/MS can then separate,
identify, and quantify the compounds that were sorbed on the fiber, including nicotine. Finally,
the base ammonia is injected as a gas into the HS. This process strips the protonated nicotine
trapped within the PM on the CFP of its charge, chemically transforming it to FB nicotine,
allowing some to volatilize into gas phase. After allowing for the requisite equilibration time, the
fiber is again exposed for the same set period of time to the HS above the filter pad now
containing more gaseous nicotine. GC/MS analysis yields a new, larger nicotine response. The
original nicotine response over the post-ammonia addition response represents the αfb of the
tobacco smoke PM.
4
2.0 METHODS
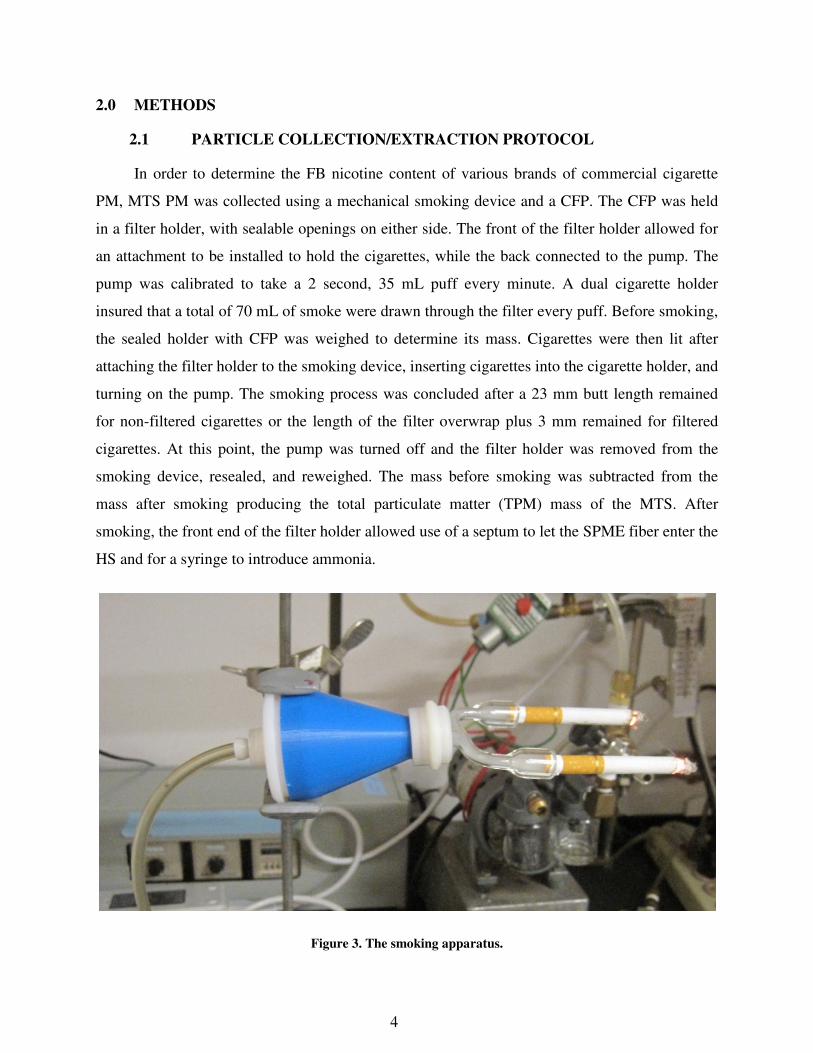
2.1 PARTICLE COLLECTION/EXTRACTION PROTOCOL
In order to determine the FB nicotine content of various brands of commercial cigarette
PM, MTS PM was collected using a mechanical smoking device and a CFP. The CFP was held
in a filter holder, with sealable openings on either side. The front of the filter holder allowed for
an attachment to be installed to hold the cigarettes, while the back connected to the pump. The
pump was calibrated to take a 2 second, 35 mL puff every minute. A dual cigarette holder
insured that a total of 70 mL of smoke were drawn through the filter every puff. Before smoking,
the sealed holder with CFP was weighed to determine its mass. Cigarettes were then lit after
attaching the filter holder to the smoking device, inserting cigarettes into the cigarette holder, and
turning on the pump. The smoking process was concluded after a 23 mm butt length remained
for non-filtered cigarettes or the length of the filter overwrap plus 3 mm remained for filtered
cigarettes. At this point, the pump was turned off and the filter holder was removed from the
smoking device, resealed, and reweighed. The mass before smoking was subtracted from the
mass after smoking producing the total particulate matter (TPM) mass of the MTS. After
smoking, the front end of the filter holder allowed use of a septum to let the SPME fiber enter the
HS and for a syringe to introduce ammonia.
Figure 3. The smoking apparatus.

5
Supelco (Bellefonte, PA) was the source of the SPME fiber, purchased from Sigma-
Aldrich (Milwaukee, WI). The 1 cm fiber was coated with a
polydimethylsiloxane/divinylbenzene (PDMS/DVB) (65 µm thick coating, and 24 gauge needle).
Nicotine is a semi-volatile, polar compound with a molecular weight (MW) of 162.23 g mol-1
.
This particular fiber is compatible for volatile analytes with MW from 50 to 300 g mol-1
, making
it a good choice for determining MTS volatiles, and specifically FB nicotine.
Accurate results for FB nicotine extraction with HS-SPME require equilibrium for the FB
nicotine on the filter pad, the (HS), and the SPME fiber. Based on previous studies (5,6), a
minimum aerosol pre-equilibration time of 1-hour was proposed for this study, determined to be
adequate time for the polar, semi-volatile compound to reach partitioning equilibrium between
the CFP and HS. After this time, the FB nicotine present in the HS has been found to remain
constant for up to 20-hours (6), meaning that the window for performing HS-SPME may be 1 to
20 hours after collecting MTS PM on a CFP.
2.2 METHOD DEVELOPMENT
Before a finalized HS-SPME method could be followed, certain developmental
experiments were conducted to ensure that FB nicotine measurements would be accurate.
Multiple brands of cigarettes were selected in order to ensure that differing brands would not
yield inconsistent results for method conditions. The first experiment focused on confirming that
the SPME fiber produced similar responses for a constant exposure time. To test this, the fiber
was exposed to the HS of the equilibrated sample for 20 minutes, after which GC/MS data was
obtained. This process was repeated six times. Next, the system received 6.0 mL of ammonia and
sat for the minimum 1-hour equilibration time. The process was repeated six more times.
The next experiment involved assessing whether a SPME fiber carried a proportional
response for varied nicotine content. Differing amounts of nicotine were dissolved in pyridine
(0.1, 0.5, 1.0, 2.0, 4.0, and 6.0% nicotine by mole fraction) and HS-SPME/GC/MS tests were
conducted for each sample. A linear response for peak area versus nicotine percentage would
confirm that the SPME fiber’s response to FB nicotine both before and after the ammonia
addition would be proportional to the amount of FB nicotine present in the HS for each case.

6
Another method development experiment involved collecting data that varied SPME fiber
exposure time and examining the GC/MS nicotine response. This would help determine the
appropriate length of exposure for the final experiments. Responses should increase linearly at
first and then may begin to approach a constant after a long enough exposure time as the sorptive
fiber reaches a state of equilibrium with the surrounding HS.
Figure 4. The SPME fiber holder and filter holder during SPME fiber headspace exposure.
After the pre-ammonia addition FB nicotine response was determined, gaseous ammonia
was introduced to the sealed filter holder. It was imperative that the amount of ammonia added to
the system be sufficient to completely deprotonate all of the nicotine within the PM trapped on
the CFP, transforming it to FB nicotine. Some of this newly formed FB nicotine could then
volatilize and reach a new equilibrium between the PM and the HS. To determine the proper
amount to add, 3 mL volumes of ammonia were incrementally added to the HS. After each

7
addition, the 1-hour minimum equilibration time interval passed and the system was reanalyzed
using HS-SPME/GC/MS. Chromatogram results were compared for nicotine for each ammonia
addition. At a certain point, the peak area for nicotine stopped increasing. The total volume of
ammonia added at that point was selected as the amount to add for the main experiment, the
volume needed to completely deprotonate the nicotine in the system. (Note that not all of the
ammonia added actually participated in deprotonation: some remained as NH3.)
In order to assess whether filter holder material had an effect on the amount of ammonia
needed to deprotonate the nicotine present on the CFP, metal filter holders were used to perform
the same experiment as the previous paragraph. One had a conical HS volume and the other a
cylindrical shape. This was done to prove that the ammonia was not permeating into the walls of
the plastic filter holder, meaning more would be needed to deprotonate the nicotine on the CFP.
To further test required ammonia addition, a CFP with MTS PM was placed inside a volatile
organics analysis (VOA) vial. The same amount of ammonia was needed to stabilize post-
ammonia addition GC/MS nicotine response for both the metal and glass holders would confirm
that the plastic filter holder could be used to measure FB nicotine content.
In the final method development experiment, a CFP coated with MTS was cut into four
equal-sized pieces. Each piece was inserted into a separate VOA vial, allowed at least a 1-hour
equilibration time, and twice analyzed by HS-SPME/GC/MS. After analysis, 12 mL of ammonia
was injected into each vial and each sample re-equilibrated and reanalyzed. Minimal variation in
FB nicotine content would further validate the method.
2.3 FINAL METHOD
The final method for our experiment consisted of smoking dual cigarettes in the way
previously discussed and allowing a minimum of 1-hour to elapse for the closed system to reach
partitioning equilibrium. Next, the SPME fiber was exposed to the HS in the filter holder for 20
minutes, immediately after which it was analyzed by GC/MS. This exposure/GC/MS process
was immediately repeated to verify consistency in the data. After the second run, 12 mL of
ammonia was injected into the HS via a syringe inserted into the septum at the top of the filter
holder and the system was allowed to reach a new partitioning equilibrium. The SPME fiber was
again exposed to the HS above the MTS PM containing filter for 20 minutes and subsequently

8
analyzed by GC/MS. Exposure and GC/MS were repeated to verify consistency. This process
was repeated for a total of three times for each brand of cigarette. FB nicotine content (αfb) was
calculated as the average of the nicotine peak areas before the ammonia addition over the
average of the peak areas post-ammonia addition. Percent error was calculated for both pre-
ammonia and post-ammonia cases.
2.4 GC/MS PARAMETERS
The GC/MS analysis was carried out on an Agilent-6890N (G 1540N) GC coupled to a
Leco Pegasus IV mass spectrometer. After HS exposure, the PDMS/DVB fiber was thermally
desorbed in the GC injection port. The GC injector was run in split mode at 250 ⁰C, with a 30:1
split ratio. Complete desorption of analytes was accomplished after 4 minutes at 250 ⁰C. The GC
Agilent DB-5 column had a length of 30 m, an internal diameter of 250 µm, and a film thickness
of 0.25 µm. The carrier gas flow rate was 1.2 mL min-1
for the duration of the run, with helium
as the carrier gas. The GC oven temperature was 80 ⁰C for 2 minutes, increased to 200 ⁰C at a
rate of 10 ⁰C min-1
, and finally increased to 260 ⁰C at a rate of 20 ⁰C min-1
. The GC method total
run time was 1020 seconds. The MS operated from a starting mass of 34 amu to an ending mass
of 400 amu with a 1450 acquisition voltage and -70 volts electron energy. The ion source was
operated at 225 ⁰C.

9
3.0 RESULTS AND DISCUSSION
3.1 DEVELOPMENT PHASE
A 65 µm PDMS/DVB SPME fiber sampled the HS of a filter holder with CFP containing
the MTS PM from two cigarettes. Before HS sampling, the closed system was allowed to reach
partitioning equilibrium between gas phase and PM phase nicotine. Method development efforts
yielded the following results.
Marlboro Special Blend 100s (red, flip-top pack) were smoked for the first experiment.
Table 1. HS-SPME/GC/MS replicate results for Marlboro Special Blend 100s.
Before NH3 addition, 20 minutes fiber exposure
Sample # Nicotine peak area
1 lost
2 5.07E+06
3 5.50E+06
4 5.54E+06
5 5.47E+06
6 5.94E+06
After 6mL NH3 addition, 20 minutes fiber exposure
Sample # Nicotine peak area
1 6.53E+07
2 6.52E+07
3 6.08E+07
4 5.93E+07
5 6.01E+07
6 6.09E+07
Average response (before NH3 addition): 5.51E+06
Average response (after NH3 addition): 6.19E+07
Free-base nicotine (%): 8.9
Standard deviation (before NH3 addition): 3.07E+05
Standard deviation (after NH3 addition): 2.63E+06
CV (before NH3 addition): 5.6
CV (after NH3 addition): 4.2
Results from the multiple tests show excellent agreement with 5.6 and 4.2% coefficient of
variation (CV) for before and after ammonia addition, respectively. As expected the nicotine
response increased after the addition of the ammonia and αfb equaled 0.089 (8.9% FB nicotine).
10
The GC/MS machine was recalibrated after analyzing sample #1 before the addition of ammonia
leading to an unusable peak area. All other results display desired agreement between data
points.
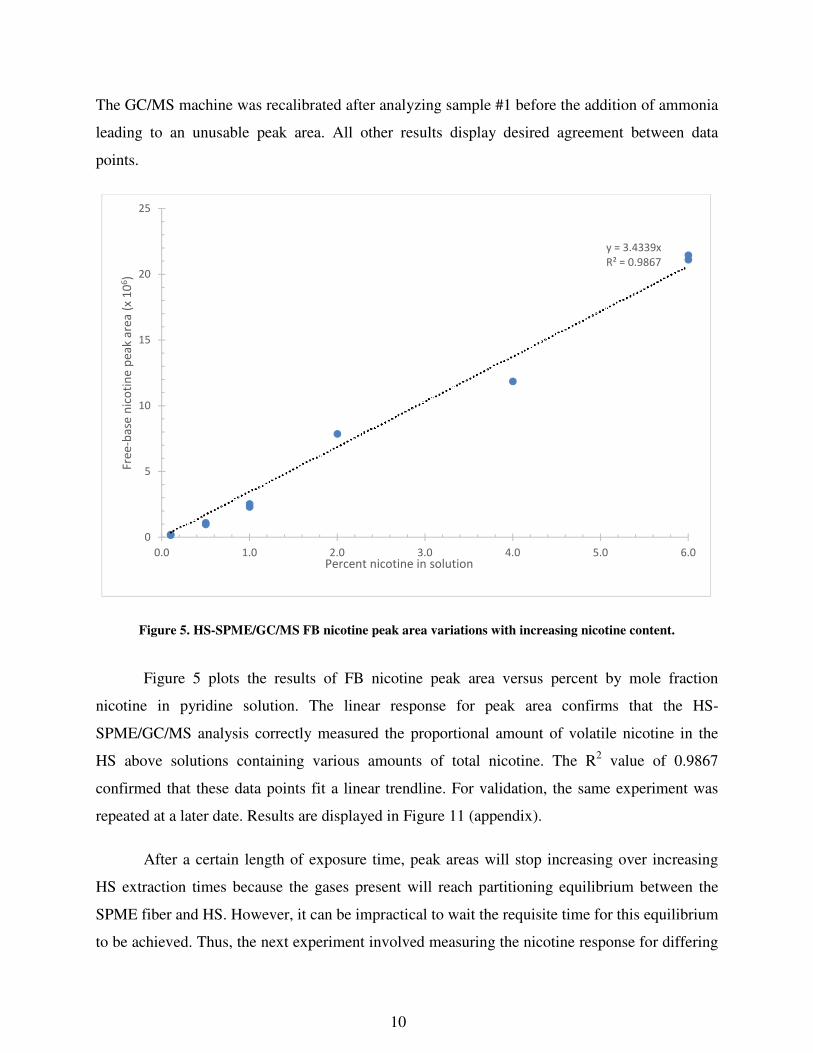
Figure 5. HS-SPME/GC/MS FB nicotine peak area variations with increasing nicotine content.
Figure 5 plots the results of FB nicotine peak area versus percent by mole fraction
nicotine in pyridine solution. The linear response for peak area confirms that the HS-
SPME/GC/MS analysis correctly measured the proportional amount of volatile nicotine in the
HS above solutions containing various amounts of total nicotine. The R2 value of 0.9867
confirmed that these data points fit a linear trendline. For validation, the same experiment was
repeated at a later date. Results are displayed in Figure 11 (appendix).
After a certain length of exposure time, peak areas will stop increasing over increasing
HS extraction times because the gases present will reach partitioning equilibrium between the
SPME fiber and HS. However, it can be impractical to wait the requisite time for this equilibrium
to be achieved. Thus, the next experiment involved measuring the nicotine response for differing
y = 3.4339x
R² = 0.9867
0
5
10
15
20
25
0.0 1.0 2.0 3.0 4.0 5.0 6.0
Fre
e-b
ase
nic
oti
ne
pe
ak
are
a (
x 1
06)
Percent nicotine in solution

11
exposure times for both before and after ammonia addition in order to determine an appropriate
exposure time. Marlboro Special Blend 100s were smoked for these results.
Figure 6. Pre-ammonia addition nicotine peak areas for a range of exposure times (Marlboro Special Blend
100s).
Figure 7. Post-ammonia addition peak areas for a range of exposure times (Marlboro Special Blend 100s).
y = 0.3202x
R² = 0.9995
0
2
4
6
8
10
12
14
16
18
0 5 10 15 20 25 30 35 40 45 50
Fre
e-b
ase
nic
oti
ne
pe
ak
are
a (
x 1
06)
Exposure time (minutes)
y = 2.831x
R² = 0.9761
0
20
40
60
80
100
120
140
160
0 5 10 15 20 25 30 35 40 45 50
To
tal n
ico
tin
e p
ea
k a
rea
(x
10
6)
Exposure time (minutes)

12
Both pre-ammonia and post-ammonia regimes displayed linearity for up to 30 minute exposure
times. A slight drop in peak area after a 50 minute exposure time was observed for a post-
ammonia sample. However, any exposure under the 30 minute mark should be within the linear
period. Thus, a 20 minute exposure was selected as optimal for our final αfb tests. These linear
results confirmed that equal exposure times legitimized the comparison of FB nicotine and total
nicotine peaks. A similar experiment was conducted at a later date with Silver Eagle Gold
Cigarettes (100s, flip-top box). Exposure times ranged from 5 to 80 minutes. Results are shown
in Figures 12 and 13 (appendix).
Figure 8. GC/MS nicotine peak area variations over multiple gas phase ammonia additions (Marlboro Special
Blend 100s).
After some volume of gas phase ammonia injected into the filter holder, the system had
enough base to completely deprotonate all PM phase nicotine. According to Figure 8, that point
occurred from 12 mL to 15 mL, when the nicotine peak area stopped increasing. These results,
obtained from Marlboro Special Blend 100s, confirmed that 12 mL of ammonia would be
adequate to deprotonate all PM phase nicotine and therefore accurately assess MTS PM FB
0
10
20
30
40
50
60
70
0 2 4 6 8 10 12 14 16
Nic
oti
ne
pe
ak
are
a (
x 1
06)
Total ammonia volume (mL)

13
nicotine content. Figures 14 and 15 (appendix) display the results for a similar experiment run
with American Spirit Natural (blue, flip-top box, full-bodied taste, made with organic tobacco)
and Silver Eagle Gold Cigarettes (100s, flip-top box), respectively. Results show that between 12
mL to 18 mL there was little increase in nicotine peak for American Spirit and a slight decrease
for Silver Eagle Gold.
The following figures display results from the ammonia addition experiments with metal
and glass as the filter holders. Silver Eagle Gold 100s were used to obtain this data.
Figure 9. GC/MS nicotine peak area variations over multiple gas phase ammonia additions using a metal
filter holder with conical headspace (Silver Eagle Gold 100s).
0
10
20
30
40
50
60
0 2 4 6 8 10 12 14 16
Nic
oti
ne
pe
ak
are
a (
x 1
06)
Total ammonia volume (mL)

14
Figure 10. GC/MS nicotine peak area variations over multiple gas phase ammonia additions using a glass
VOA vial to contain the filter (Silver Eagle Gold 100s).
Figure 16 (appendix) displays the results for the metal filter holder with cylindrical HS. The data
for this particular filter holder shows that less ammonia was required to deprotonate the nicotine
on the CFP, possibly due to the different HS shape. Figures 9 and 10 show that 12 mL of
ammonia was still required to deprotonate the nicotine trapped on the CFP for both the VOA vial
and the metal filter holder with conical HS, meaning that the plastic filter holders did not require
more ammonia compared to metal or glass.
Table 2 presents the data from the experiment in which a CFP with MTS PM was cut into
4 pieces and each piece placed inside a separate VOA vial.
Table 2. Free-base nicotine percentage for four vials containing PM from the same filter (Silver Eagle Gold
100s).
Vial 1 Vial 2 Vial 3 Vial 4
FB nicotine %: 5.5 3.6 7.0 6.6
% error (before NH3 addition): 11.1 3.7 19.0 19.9
% error (after NH3 addition): 6.9 9.9 8.9 9.9
Silver Eagle Gold 100s were smoked during this experiment. Vials 1, 3 and 4 show similar FB
nicotine content. Vial 2 is an outlier, possibly because not enough PM was collected by that
0
10
20
30
40
50
60
0 2 4 6 8 10 12 14 16
Nic
oti
ne
pe
ak
are
a (
x 1
06)
Total ammonia volume (mL)

15
portion of the CFP. The CG/MS nicotine response for Vial 2 was lower than for the other 3 vials.
This result further confirms that these methods yield consistent results.
3.2 FINAL EXPERIMENTAL PHASE
Finally, the main experiment determined the αfb of the smoke PM for multiple brands of
commercial cigarette and one type of cigarette-like “cigars”. The brands investigated for this
report include: Marlboro Special Blend 100s, Silver Eagle Gold 100s, American Spirit Natural,
Marlboro Red Label 100s (soft pack), and Cheyenne Full Flavor 100s “Cigars”. Table 3 presents
the αfb for each of these tobacco products.
Table 3. Mainstream tobacco smoke particulate matter free-base nicotine content for various brands/types of
cigarettes and “cigars”.
Cigarette/cigar brand/type αfb
Marlboro Special Blend 100s 0.051
Silver Eagle Gold 100s 0.069
American Spirit Natural 0.185
Marlboro Red Label 100s 0.065
Cheyenne Full Flavor 100s cigars 0.057
The αfb for the Marlboro Special Blend 100s, Silver Eagle Gold 100s, and American Spirit
Natural were inferred from the method development phase of this research. αfb values for the
other two products were determined using the final method protocol. The details of these tests
are displayed in the following tables.
Table 4. Free-base nicotine percentage, percent errors, and αfb values for Marlboro Red Label 100s (soft-
pack).
Sample 1 Sample 2 Sample 3 Average
FB nicotine %: 5.4 6.3 7.9 6.5
% error (before NH3 addition): 2.1 6.6 2.1 % error
% error (after NH3 addition): 3.3 1.8 1.7 5.1
αfb: 0.054 0.063 0.079 0.065
Table 5. Free-base nicotine percentage, percent errors, and αfb values for Cheyenne Full Flavor 100s
“Cigars”.
Sample 1 Sample 2 Sample 3 Average
FB nicotine %: 5.2 6.5 5.3 5.7
% error (before NH3 addition): 3.9 8.8 1.1 % error
% error (after NH3 addition): 5.3 3.4 2.5 7.9
αfb: 0.052 0.065 0.053 0.057

16
According to these results, American Sprit Natural cigarettes contain the largest amount
of FB nicotine. This result indicates that the MTS from these cigarettes has the highest pHeff
because a more basic smoke will have less hydrogen ions available to protonate nicotine. Smoke
PM from the other cigarettes/cigar investigated does not show an extreme range in αfb,
suggesting that these products have similar smoke pHeff values. In any case, the results indicate
that there is a measurable and significant amount of FB nicotine in MTS PM. Furthermore,
commercial cigarettes/cigars can show a considerable range in αfb values. As previously
discussed, a higher αfb translates into a greater magnitude and rate of nicotine uptake by smokers
because PM phase FB nicotine can volatilize and then efficiently deposit in the RT. Calculated
αfb values support the concept that the volatilization of FB nicotine from inhaled particles can
occur within the RT. Therefore, the amount of FB nicotine in MTS PM carries important
implications for how cigarette smoke nicotine is deposited in the RT.

17
4.0 CONCLUSION
Deposition rate in the RT is influenced by the composition of the inhaled aerosol. Soluble
gases will deposit with high, nearly complete, efficiency, while only 50% of particles typically
deposit (the other 50% are exhaled.) Due to its acid/base chemistry, nicotine present in MTS can
be in either protonated forms or FB form. Furthermore, only the FB nicotine can volatilize from
smoke PM into the gas phase of an inhaled stream of MTS. Nicotine delivery magnitude and rate
due to changes in the fraction of FB nicotine are associated with addiction potential. These
phenomena indicate the importance of the question: how much gaseous nicotine is present in a
stream of inhaled MTS?
In order to answer this question, this study focused on determining αfb, the fraction of FB
nicotine in MTS. Several brands of cigarettes were tested using HS-SPME/GC/MS analysis. This
method requires exposing a PDMS/DVB SPME fiber to the HS of a MTS PM CFP sample,
allowing some of the FB nicotine in the HS to sorb onto the fiber. After GC/MS analysis, a base
(ammonia) is injected into the filter holder containing the smoke PM, stripping the protons from
the protonated nicotine and transforming it to FB nicotine. However, before an exact method
could be finalized, a method development stage refined the procedures needed to accurately
assess αfb. Fiber testing, exposure time, and ammonia addition were all details that needed
calibration. Various filter holders were tested to ensure that their composition did not affect
ammonia addition. Results of this testing process yielded that the fiber produced a repeatable,
linear response to varying exposure times; a 20 minute fiber exposure time was sufficient to
produce a desired nicotine response, 12 mL of ammonia was adequate to strip the H+ ions from
the protonated nicotine and transform it to FB nicotine, and the plastic filter holder did not
absorb appreciable amounts of ammonia and was fit to conduct the testing.
This study examined the PM FB nicotine of four brands of commercial cigarettes and one
cigar brand. Results presented αfb values that ranged from 0.051 for Marlboro Special Blend
100s to 0.185 for American Spirit Natural cigarettes. These FB nicotine totals indicate that the
volatilization of significant amounts of FB nicotine can occur from the PM of MTS. Thus,
assessed αfb values from each brand/type of commercial tobacco product have important
implications on the addiction potential and delivery magnitude and rate of the nicotine present in
the tobacco smoke.

18
5.0 REFERENCES
(1) Pankow, James F., Ameer D. Tavakoli, Wentai Luo, and Lorne M. Isabelle. "Percent Free
Base Nicotine in the Tobacco Smoke Particulate Matter of Selected Commercial and
Reference Cigarettes." Chemical Research in Toxicology 16.8 (2003): 1014-018.
(2) Pankow, James F. "A Consideration of the Role of Gas/Particle Partitioning in the
Deposition of Nicotine and Other Tobacco Smoke Compounds in the Respiratory Tract."
Chemical Research in Toxicology 14.11 (2001): 1465-481.
(3) Hinshaw, John V. "Solid-Phase Microextraction." LC/GC North America 21.11 (2003):
1057-061.
(4) Pawliszyn, Janusz. "Theory of Solid-Phase Microextraction." Journal of
Chromatographic Science 38 (2000): 270-78.
(5) Watson, Clifford H., Jenna S. Trommel, and David L. Ashley. "Solid-Phase
Microextraction-Based Approach To Determine Free-Base Nicotine in Trapped
Mainstream Cigarette Smoke Total Particulate Matter." Journal of Agricultural and Food
Chemistry 52.24 (2004): 7240-245.
(6) Bao, Mingliang, Peter Joza, William S. Rickert, and John H. Lauterbach. "An Improved
Headspace Solid-phase Microextraction Method for the Analysis of Free-base Nicotine in
Particulate Phase of Mainstream Cigarette Smoke." Analytica Chimica Acta 663.1
(2010): 49-54.
(7) Supelco. SOLID PHASE MICROEXTRACTION. Sigma-Aldrich. 2013. Web.
<http://www.sigmaaldrich.com/content/dam/sigmaaldrich/docs/Supelco/Brochure/1/supel
co-7-spme.pdf>.

19
6.0 APPENDIX
6.1 TABLES
The following tables contain the raw data for the figures or tables listed in each table caption.
Table 6. HS-SPME/GC/MS FB nicotine peak area variations with increasing nicotine content. Data
corresponds to Figure 5.
Date: 1/18/2015
Nicotine in pyridine solution (20 min fiber exposure)
Sample (% by mole fraction) Nicotine response
0.1% Nic in PY 170336
0.1% Nic in PY 205703
0.5% Nic in PY 985809
0.5% Nic in PY 1105946
1.0% Nic in PY 2541416
1.0% Nic in PY 2315977
2.0% Nic in PY 7870046
4.0% Nic in PY 11863309
6.0% Nic in PY 21118027
6.0% Nic in PY 21455564
Table 7. HS-SPME/GC/MS FB nicotine peak area variations with increasing nicotine content. Data
corresponds to Figure 11.
Date: 2/19/2015
Nicotine in pyridine solution (20 min fiber exposure)
Sample (% by mole fraction) Nicotine response
0.1% Nic in PY 570128
0.5% Nic in PY 1576115
1.0% Nic in PY 2863703
2.0% Nic in PY 6681879
4.0% Nic in PY 13935252
6.0% Nic in PY 26480621
20
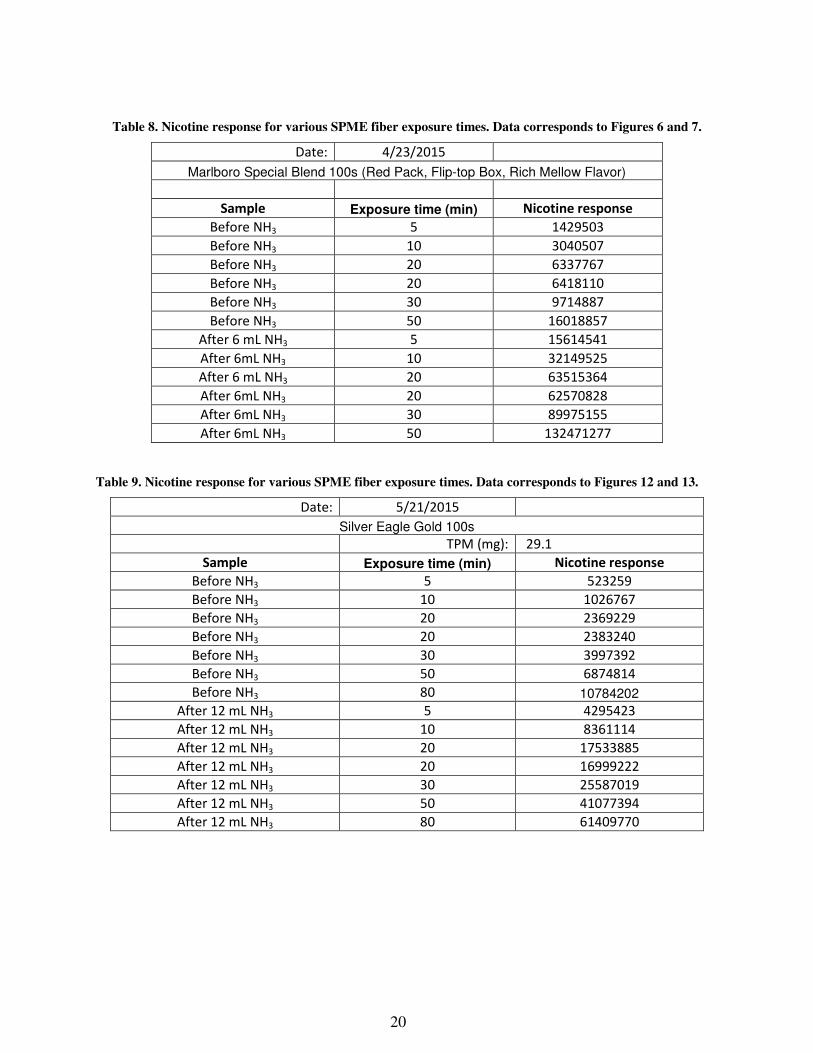
Table 8. Nicotine response for various SPME fiber exposure times. Data corresponds to Figures 6 and 7.
Date: 4/23/2015
Marlboro Special Blend 100s (Red Pack, Flip-top Box, Rich Mellow Flavor)
Sample Exposure time (min) Nicotine response
Before NH3 5 1429503
Before NH3 10 3040507
Before NH3 20 6337767
Before NH3 20 6418110
Before NH3 30 9714887
Before NH3 50 16018857
After 6 mL NH3 5 15614541
After 6mL NH3 10 32149525
After 6 mL NH3 20 63515364
After 6mL NH3 20 62570828
After 6mL NH3 30 89975155
After 6mL NH3 50 132471277
Table 9. Nicotine response for various SPME fiber exposure times. Data corresponds to Figures 12 and 13.
Date: 5/21/2015
Silver Eagle Gold 100s
TPM (mg): 29.1
Sample Exposure time (min) Nicotine response
Before NH3 5 523259
Before NH3 10 1026767
Before NH3 20 2369229
Before NH3 20 2383240
Before NH3 30 3997392
Before NH3 50 6874814
Before NH3 80 10784202
After 12 mL NH3 5 4295423
After 12 mL NH3 10 8361114
After 12 mL NH3 20 17533885
After 12 mL NH3 20 16999222
After 12 mL NH3 30 25587019
After 12 mL NH3 50 41077394
After 12 mL NH3 80 61409770

21
Table 10. GC/MS nicotine peak area variations over multiple gas phase ammonia additions. Data
corresponds to Figure 8.
Date: 4/28/2015
Marlboro Special Blend 100s
TPM (mg): 39.7
Sample Exposure time (min) Nicotine response
Before NH3 20 3370339
Before NH3 20 3214994
Before NH3 20 3045942
After 1 mL NH3 20 29363202
After 1 mL NH3 20 26489884
After 3 mL NH3 20 47762130
After 3 mL NH3 20 44777014
After 6 mL NH3 20 54138809
After 6 mL NH3 20 51159987
After 12 mL NH3 20 63690924
After 12 mL NH3 20 61752140
After 15 mL NH3 20 64733070
After 15 mL NH3 20 61935874
Table 11. GC/MS nicotine peak area variations over multiple gas phase ammonia additions. Data
corresponds to Figure 14 and Table 3.
Date: 5/12/2015
American Spirit Natural
TPM (mg): 42.9
Sample Exposure time (min) Nicotine response
Before NH3 20 21069592
Before NH3 20 27187681
Before NH3 20 MS power failure
After 6 mL NH3 20 115035516
After 6 mL NH3 20 116955155
After 9 mL NH3 20 128664795
After 9 mL NH3 20 125249071
After 12 mL NH3 20 131876284
After 12 mL NH3 20 128791413
After 15 mL NH3 20 133969305
After 15 mL NH3 20 132719467
After 18 mL NH3 20 137180259
After 18 mL NH3 20 135881151

22
Table 12. GC/MS nicotine peak area variations over multiple gas phase ammonia additions. Data
corresponds to Figure 15.
Date: 5/14/2015
Silver Eagle Gold 100s
TPM (mg): 27.9
Sample Exposure time (min) Nicotine response
Before NH3 20 3457871
Before NH3 20 3228456
Before NH3 20 3021259
After 6 mL NH3 20 40984771
After 6 mL NH3 20 39178112
After 9 mL NH3 20 44841187
After 9 mL NH3 20 41256803
After 12 mL NH3 20 45162143
After 12 mL NH3 20 42140565
After 15 mL NH3 20 44676202
After 15 mL NH3 20 40738908
After 18 mL NH3 20 43984651
After 18 mL NH3 20 43263592
Table 13. GC/MS nicotine peak area variations over multiple gas phase ammonia additions using a metal
filter holder with conical headspace. Data corresponds to Figure 9.
Date: 5/28/2015
Silver Eagle Gold 100s
Sample Exposure time (min) Nicotine response
Before NH3 20 4746974
Before NH3 20 4920165
Before NH3 20 5387388
After 6 mL NH3 20 54157254
After 6 mL NH3 20 51580431
After 9 mL NH3 20 55833343
After 9 mL NH3 20 53535514
After 12 mL NH3 20 58364085
After 12 mL NH3 20 57202031
After 15 mL NH3 20 58302540
After 15 mL NH3 20 55192397

23
Table 14. GC/MS nicotine peak area variations over multiple gas phase ammonia additions using a glass
VOA vial as the filter holder. Data corresponds to Figure 10.
Date: 6/2/2015
Silver Eagle Gold 100s
TPM (mg): 18.0
Sample Exposure time (min) Nicotine response
Before NH3 20 3070047
Before NH3 20 3341565
Before NH3 20 3944610
After 6 mL NH3 20 38178270
After 6 mL NH3 20 38657661
After 9 mL NH3 20 47600050
After 9 mL NH3 20 47777551
After 12 mL NH3 20 55857029
After 12 mL NH3 20 55510099
After 15 mL NH3 20 51804071
After 15 mL NH3 20 54248616
Table 15. GC/MS nicotine peak area variations over multiple gas phase ammonia additions using a metal
filter holder with cylindrical headspace. Data corresponds to Figure 16.
Date: 5/29/2015
Silver Eagle Gold 100s
TPM (mg): 32.6
Sample Exposure time (min) Nicotine response
Before NH3 20 3184724
Before NH3 20 3372906
Before NH3 20 3544608
After 6 mL NH3 20 70866234
After 6 mL NH3 20 66243481
After 9 mL NH3 20 71558681
After 9 mL NH3 20 68343152
After 12 mL NH3 20 70124849
After 12 mL NH3 20 65387401

24
Table 16. Nicotine response for four vials containing PM from the same filter. This data corresponds to Table
2.
Date: 6/3/2015
Silver Eagle Gold 100s
TPM (mg): 29.7
Sample Exposure time (min) Nicotine response
Vial 1, Before NH3 20 1753947
Vial 1, Before NH3 20 1498783
Vial 2, Before NH3 20 1247279
Vial 2, Before NH3 20 1183702
Vial 3, Before NH3 20 2564553
Vial 3, Before NH3 20 1957553
Vial 4, Before NH3 20 2430578
Vial 4, Before NH3 20 1831342
Vial 1, After 4 mL NH3 20 31049689
Vial 1, After 4 mL NH3 20 28152042
Vial 2, After 4 mL NH3 20 36631344
Vial 2, After 4 mL NH3 20 31834434
Vial 3, After 4 mL NH3 20 34087407
Vial 3, After 4 mL NH3 20 30060038
Vial 4, After 4 mL NH3 20 34762282
Vial 4, After 4 mL NH3 20 30234611
Table 17. Nicotine response for three samples of MTS PM from Marlboro Red Label 100s. This data
corresponds to Table 4.
Date: 6/4/2015
Marlboro Red Label 100s
TPM#1: 44.4 mg TPM#2: 35.6 mg TPM#3: 39.5 mg
Sample Exposure time (min) Nicotine response
#1, Before NH3 20 2889625
#1, Before NH3 20 2977588
#2, Before NH3 20 3893802
#2, Before NH3 20 3548529
#3, Before NH3 20 5735646
#3, Before NH3 20 5570997
#1, After 12 mL NH3 20 55539409
#1, After 12 mL NH3 20 53034835
#2, After 12 mL NH3 20 59943696
#2, After 12 mL NH3 20 58440816
#3, After 12 mL NH3 20 72271360
#3, After 12 mL NH3 20 70593847

25
Table 18. Nicotine response for three samples of MTS PM from Cheyenne Full Flavor 100s Cigars. This data
corresponds to Table 5.
Date: 6/5/2015
Cheyenne Full Flavor 100s Cigars
Sample Exposure time (min) Nicotine response
#1, Before NH3 20 1013498
#1, Before NH3 20 1070887
#2, Before NH3 20 1287636
#2, Before NH3 20 1458936
#3, Before NH3 20 1292106
#3, Before NH3 20 1271360
#1, After 12 mL NH3 20 20639697
#1, After 12 mL NH3 20 19156104
#2, After 12 mL NH3 20 20537518
#2, After 12 mL NH3 20 21554980
#3, After 12 mL NH3 20 23706113
#3, After 12 mL NH3 20 24546500

26
6.2 FIGURES
Figure 11. HS-SPME/GC/MS FB nicotine peak area variations with increasing nicotine content (second run).
Figure 12. Pre-ammonia addition nicotine peak areas for a range of exposure times Silver Eagle Gold
Cigarettes (100s, flip-top box).
y = 4.0464x
R² = 0.9729
0
5
10
15
20
25
30
0.0 1.0 2.0 3.0 4.0 5.0 6.0
Fre
e-b
ase
nic
oti
ne
p
ea
k a
rea
(x
10
6)
Percent nicotine in solution
y = 0.1337x
R² = 0.9958
0
2
4
6
8
10
12
0 10 20 30 40 50 60 70 80
Fre
e-b
ase
nic
oti
ne
pe
ak
are
a (
x 1
06)
Exposure time (minutes)

27
Figure 13. Post-ammonia addition nicotine peak areas for a range of exposure times Silver Eagle Gold
Cigarettes (100s, flip-top box).
Figure 14. GC/MS nicotine peak area variations over multiple gas phase ammonia additions (American Spirit
Natural).
y = 0.7953x
R² = 0.9943
0
10
20
30
40
50
60
70
0 10 20 30 40 50 60 70 80 90
To
tal n
ico
tin
e p
ea
k a
rea
(x
10
6)
Exposure time (minutes)
0
20
40
60
80
100
120
140
0 2 4 6 8 10 12 14 16 18
Nic
oti
ne
pe
ak
are
a (
x 1
06)
Ammonia addition (mL)

28
Figure 15. GC/MS nicotine peak area variations over multiple gas phase ammonia additions (Silver Eagle
Gold 100s).
Figure 16. GC/MS nicotine peak area variations over multiple gas phase ammonia additions using a metal
filter holder with cylindrical headspace (Silver Eagle Gold 100s).
0
5
10
15
20
25
30
35
40
45
50
0 2 4 6 8 10 12 14 16 18
Nic
oti
ne
pe
ak
are
a (
x 1
06)
Total ammonia volume (mL)
0
10
20
30
40
50
60
70
80
0 2 4 6 8 10 12
Nic
oti
ne
pe
ak
are
a (
x 1
06)
Total ammonia volume (mL)