Embed Size (px)
Citation preview

ANALYZING ARMY RESERVE UNSATISFACTORY PARTICIPANTS THROUGH LOGISTIC REGRESSION
A thesis presented to the Faculty of the US Army Command and General Staff College in partial
fulfillment of the requirements for the degree
MASTER OF MILITARY ART AND SCIENCE
General Studies
by
BRIAN A. DAVIS, MAJOR, USAR B.S., East Tennessee State University, Johnson City, Tennessee, 1996
Fort Leavenworth, Kansas 2012-01
Approved for public release; distribution is unlimited.
ii
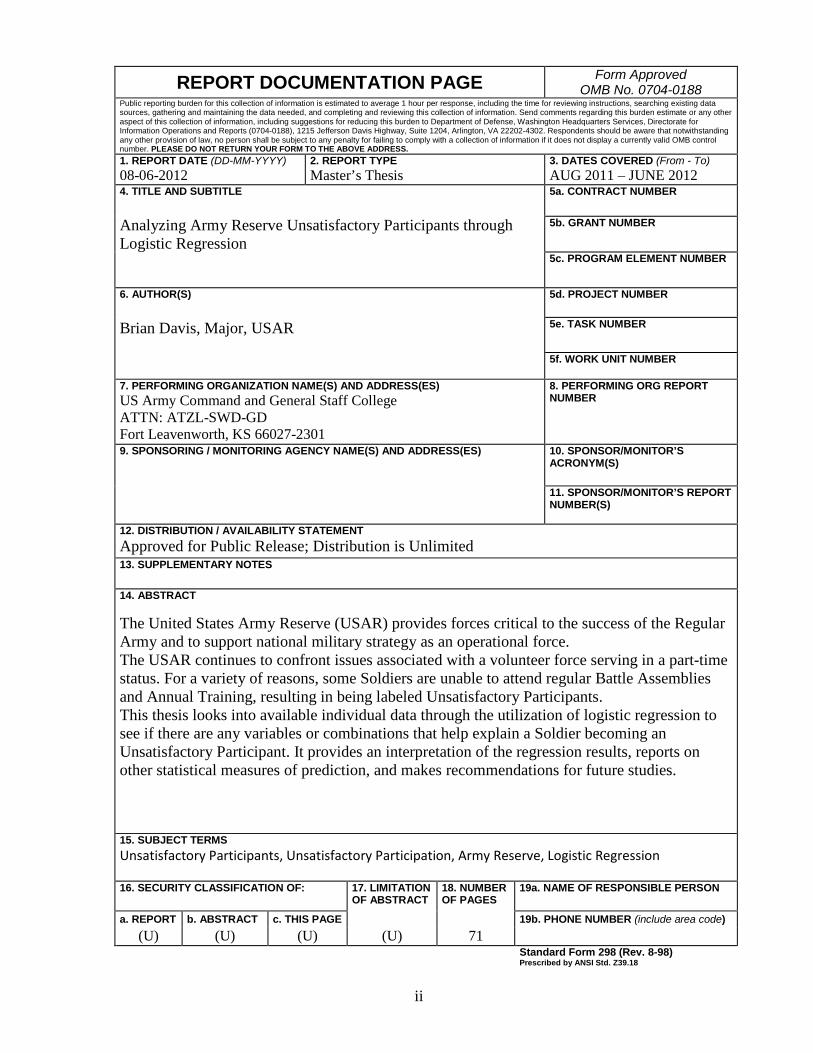
REPORT DOCUMENTATION PAGE Form Approved OMB No. 0704-0188
Public reporting burden for this collection of information is estimated to average 1 hour per response, including the time for reviewing instructions, searching existing data sources, gathering and maintaining the data needed, and completing and reviewing this collection of information. Send comments regarding this burden estimate or any other aspect of this collection of information, including suggestions for reducing this burden to Department of Defense, Washington Headquarters Services, Directorate for Information Operations and Reports (0704-0188), 1215 Jefferson Davis Highway, Suite 1204, Arlington, VA 22202-4302. Respondents should be aware that notwithstanding any other provision of law, no person shall be subject to any penalty for failing to comply with a collection of information if it does not display a currently valid OMB control number. PLEASE DO NOT RETURN YOUR FORM TO THE ABOVE ADDRESS. 1. REPORT DATE (DD-MM-YYYY) 08-06-2012
2. REPORT TYPE Master’s Thesis
3. DATES COVERED (From - To) AUG 2011 – JUNE 2012
4. TITLE AND SUBTITLE Analyzing Army Reserve Unsatisfactory Participants through Logistic Regression
5a. CONTRACT NUMBER 5b. GRANT NUMBER 5c. PROGRAM ELEMENT NUMBER
6. AUTHOR(S) Brian Davis, Major, USAR
5d. PROJECT NUMBER 5e. TASK NUMBER 5f. WORK UNIT NUMBER
7. PERFORMING ORGANIZATION NAME(S) AND ADDRESS(ES) US Army Command and General Staff College ATTN: ATZL-SWD-GD Fort Leavenworth, KS 66027-2301
8. PERFORMING ORG REPORT NUMBER
9. SPONSORING / MONITORING AGENCY NAME(S) AND ADDRESS(ES)
10. SPONSOR/MONITOR’S ACRONYM(S) 11. SPONSOR/MONITOR’S REPORT NUMBER(S)
12. DISTRIBUTION / AVAILABILITY STATEMENT Approved for Public Release; Distribution is Unlimited 13. SUPPLEMENTARY NOTES 14. ABSTRACT The United States Army Reserve (USAR) provides forces critical to the success of the Regular Army and to support national military strategy as an operational force. The USAR continues to confront issues associated with a volunteer force serving in a part-time status. For a variety of reasons, some Soldiers are unable to attend regular Battle Assemblies and Annual Training, resulting in being labeled Unsatisfactory Participants. This thesis looks into available individual data through the utilization of logistic regression to see if there are any variables or combinations that help explain a Soldier becoming an Unsatisfactory Participant. It provides an interpretation of the regression results, reports on other statistical measures of prediction, and makes recommendations for future studies.
15. SUBJECT TERMS Unsatisfactory Participants, Unsatisfactory Participation, Army Reserve, Logistic Regression
16. SECURITY CLASSIFICATION OF: 17. LIMITATION OF ABSTRACT
18. NUMBER OF PAGES
19a. NAME OF RESPONSIBLE PERSON a. REPORT b. ABSTRACT c. THIS PAGE 19b. PHONE NUMBER (include area code)
(U) (U) (U) (U) 71 Standard Form 298 (Rev. 8-98)
Prescribed by ANSI Std. Z39.18

iii
MASTER OF MILITARY ART AND SCIENCE
THESIS APPROVAL PAGE
Name of Candidate: Major Brian Davis Thesis Title: Analyzing Army Reserve Unsatisfactory Participants through Logistic
Regression Approved by: , Thesis Committee Chair Bill J. McCollum, Ed.D. , Member David Bitters, Ph.D. , Member William J. Maxcy, M.A. Accepted this 8th day of June 2012 by: , Director, Graduate Degree Programs Robert F. Baumann, Ph.D. The opinions and conclusions expressed herein are those of the student author and do not necessarily represent the views of the US Army Command and General Staff College or any other governmental agency. (References to this study should include the foregoing statement.)

iv
ABSTRACT
ANALYZING ARMY RESERVE UNSATISFACTORY PARTICIPANTS THROUGH LOGISTIC REGRESSION, by Major Brian A. Davis, 71 pages. The United States Army Reserve (USAR) provides forces critical to the success of the Regular Army and to support national military strategy as an operational force. The USAR continues to confront issues associated with a volunteer force serving in a part-time status. For a variety of reasons, some Soldiers are unable to attend regular Battle Assemblies and Annual Training, resulting in being labeled Unsatisfactory Participants. This thesis looks into available individual data through the utilization of logistic regression to see if there are any variables or combinations that help explain a Soldier becoming an Unsatisfactory Participant. It provides an interpretation of the regression results, reports on other statistical measures of prediction, and makes recommendations for future studies.

v
ACKNOWLEDGMENTS
First, I must thank my wife, Tamatha, for her love, support, and patience.
Tamatha, I truly am blessed to have your by my side and look forward to many decades
together.
My daughters, Elizabeth, Emileigh, and Erika, are beautiful, strong-minded,
resilient ladies and I am proud of you and thankful that you embrace the “Army Life.”
I am in awe of the professionalism and dedication to student success provided by
my thesis committee. Dr. McCollum, Dr. David Bitters and Mr. William Maxcy provided
continuous support, recommendations and motivation transforming a hodgepodge of
thoughts into this thesis. Mr. Mark Williams, Staff Group Advisor, not only acted as a
mentor, but continually volunteered his time to ensure all his students succeeded.
In fifteen plus years in the Army, there have been numerous Civilians and
Soldiers, who have enhanced my career, and thus contributed directly and indirectly to
the completion of this thesis for whom I will always be indebted.

vi
TABLE OF CONTENTS
Page
MASTER OF MILITARY ART AND SCIENCE THESIS APPROVAL PAGE ............ iii
ABSTRACT ....................................................................................................................... iv
ACKNOWLEDGMENTS ...................................................................................................v
TABLE OF CONTENTS ................................................................................................... vi
ACRONYMS ................................................................................................................... viii
ILLUSTRATIONS ............................................................................................................ ix
TABLES ..............................................................................................................................x
CHAPTER 1 INTRODUCTION .........................................................................................1
Problem Statement .......................................................................................................... 2 Army Reserve Structure .................................................................................................. 2 USAR Composition ........................................................................................................ 4 USAR Forces .................................................................................................................. 4 Unsatisfactory Participation ............................................................................................ 6 Research Questions ......................................................................................................... 8 Limitations and Data Sources ......................................................................................... 9 Thesis Scope ................................................................................................................... 9 Thesis Outline ................................................................................................................. 9
CHAPTER 2 LITERATURE REVIEW ............................................................................11
Demographics ............................................................................................................... 11 Socialization .................................................................................................................. 14 Regression ..................................................................................................................... 17
CHAPTER 3 RESEARCH METHODOLOGY ................................................................22
Data Inputs and Software .............................................................................................. 22 Regression Analysis ...................................................................................................... 24 Data Transformation/Selection ..................................................................................... 27 Model and Variable Inclusion/Exclusion ..................................................................... 29 Purpose/Output ............................................................................................................. 29 Further Review ............................................................................................................. 31

vii
CHAPTER 4 FINDINGS ...................................................................................................34
Model Selection ............................................................................................................ 35 Understanding Coefficients .......................................................................................... 38 Model Power ................................................................................................................. 40 Empirical Data Review ................................................................................................. 41 Contingency Tables ...................................................................................................... 46 Summary ....................................................................................................................... 48
CHAPTER 5 CONCLUSIONS AND RECOMMENDATIONS ......................................49
Conclusions ................................................................................................................... 49 Recommendations ......................................................................................................... 51
APPENDIX A Excerpt from DA Form 3540 ....................................................................54
APPENDIX B Termination of Incentive Payments...........................................................55
APPENDIX C Demographic Codes ..................................................................................57
BIBLIOGRAPHY ..............................................................................................................59
INITIAL DISTRIBUTION LIST ......................................................................................61

viii
ACRONYMS
BA Battle Assembly
MSC Major Support Command
RA Regular Army
RSC Regional Support Command
UIC Unit Identification Code
USAR United States Army Reserve

ix
ILLUSTRATIONS
Page Figure 1. USAR Unit Types ..............................................................................................3
Figure 2. RSCs/MSCs .....................................................................................................23
Figure 3. Logistic Regression Model–(Natural Log of Odds Ratio) ...............................26
Figure 4. Logistic Regression Model–Probability (antilog of odds ratio) ......................27
Figure 5. Akaike Information Criteria (AIC) ..................................................................31
Figure 6. Chi–Square Statistic Calculations ....................................................................32
Figure 7. Model Comparisons with Interaction...............................................................37
Figure 8. Best Model in Coefficient Format ...................................................................38
Figure 9. Standardized Coefficients ................................................................................39
Figure 10. Percent of Unsatisfactory Participants by Grade .............................................42
Figure 11. Percent of Unsatisfactory Participants by Age ................................................43
Figure 12. Percent of Unsatisfactory Participants by RSC ...............................................45
Figure 13. Percent of Unsatisfactory Participants by State/Territory ...............................45
Figure 14. Observed vs. Expected Unsatisfactory Participants by Grade .........................47
Figure 15. Observed vs. Expected Unsatisfactory Participants by Age ............................47

x
TABLES
Page Table 1. Selected Reserves Composition .........................................................................5
Table 2. Breakdown of Assigned Selected Reservists .....................................................6
Table 3. Output of Logistic Regression without Interaction ..........................................36
Table 4. Model Accuracy ...............................................................................................41
Table 5. Breakdown of Unsatisfactory Participants .......................................................50

1
CHAPTER 1
INTRODUCTION
Behind the regular army must always stand the great reserve army consisting of able-bodied men of the nation, so trained as to be promptly available for military service if needed, but following their normal occupations in time of peace.
— Major General Leonard Wood, 1916 Since the first 160 surgeons were recommended for appointment into the Medical
Reserve Corps in 1908, the Soldiers of United States Army Reserve (USAR) have
defended the United States at home and in foreign lands alongside their active duty
counterparts. These “Citizen Soldiers,” a title bestowed upon reservists during the
Revolutionary War, augment the Regular or Standing Army.1 Since these modest
beginnings, the USAR has grown to fiscal year 2011 authorized end strength of 205,000.
Over half of the Reservists serve in a variety of Combat Service Support (CSS) roles, to
include the only Army organization with Military Occupation Skills (MOS) in railway
operations and over 90 percent of the Army’s Civil Affairs organizations. The skills
possessed by USAR Soldiers make the Army Reserve critical in supporting the Regular
Army (RA), ultimately contributing to the success of long-term military operations as
expressed in the USAR mission statement:
The Army Reserve's mission, under Title 10 of the US Code, is to provide trained, equipped, and ready Soldiers and cohesive units to meet the global requirements across the full spectrum of operations. The Army Reserve is a key element in The Army multi-component unit force, training with Active and National Guard units to ensure all three components work as a fully integrated team.2
The USAR owes its creation to the need for a strategic reserve available during
times of national emergency, but since the Gulf War in 1990 the focus and utilization of

2
reserves is as an operational force. Lieutenant General Jack C. Stultz, Commanding
General, United States Army Reserve Command (USARC) stated on 22 April 2011:
For more than 100 years, the United States Army Reserve has served as the nation’s federal strategic force in reserve, supporting the war and peacetime needs of the Regular Army….The steady, consistent, and recurring demand for Army Reserve capabilities during this decade has posed significant challenges for a force organized and resourced as a strategic reserve. In response, the Army Reserve recast itself from the part-time strategic reserve role to a fully integrated and critical part of an operational, expeditionary Army that supports the nation’s evolving and challenging wartime requirements.3
Major General Wood recognized in 1916 that the military readiness of these reserve units
must be equal to that of the RA units. But that was nearly 100 years ago; accomplishing
today’s Reserve mission requirements is more complicated due to the duality of the
Reservist.
Problem Statement
The Army Reserve requires commitment and participation from the members of
its force to accomplish its mission. Approximately 90 percent of the Selected Reservists
are Troop Program Unit (TPU) Soldiers with requirements to participate in drill
weekends and Annual Training. Unfortunately, today over six percent of these TPU
Soldiers are labeled Unsatisfactory Participants for their failure to attend mandatory
formations. The holes in formations created by absent Soldiers affect unit readiness and
ultimately force commanders to cross-level Soldiers to meet mission requirements.
Army Reserve Structure
The USAR command structure consists of various units classified into three
command types: Operational and Functional (O&F) Commands, Training Commands,
and Support Commands. There are sixteen O&F Commands that are deployable as

3
headquarters or as commanding units regardless of geographic location.4 Six Training
Commands provide training for Army National Guard (ARNG), RA and USAR Soldiers,
to include the 166th Aviation Brigade, which has the responsibility for all reserve
aviation mobilizations.5 The Support Commands are distributed geographically
throughout the US in seven commands that provide base operation and administrative
support, as well as an eighth unit that is the Army Reserve Careers Division.6 The
majority of USAR units are responsible for combat service support; only one percent of
the manning is in combat arms (figure 1).
Figure 1. USAR Unit Types
Source: Created by author, data from Army Reserves Website, “Every Soldier has a role. Every role has a purpose,” www.armyreserve.com (accessed October 14, 2011).
Every military organization has a six alpha-numeric character Unit Identification
Code (UIC) that provides the basic building block for accountability, responsibility, and
command structure of all reserve units. The first four digits of the UIC provide the
detailed information necessary to identify the unit at the battalion level and provide the
lowest command data used for determining the frequency of Unsatisfactory Participants
for this thesis.
Combat Arms (1%)
Combat Support (18%)
Mobilization Base Expansion (27%)
Combat Service Support (54%)

4
USAR Composition
Over half of the assigned USAR strength consists of junior enlisted Soldiers in the
ranks of Private through Specialist or Skill Level One (SL1) according to data from Army
Reserve G1 Manning Division (September 2011). Non-Commissioned Officers account
for a third of the force and the rest are Officers and Warrant Officers. Despite being a
combat multiplier and not combat arms heavy, the reserves are primarily male: nearly 77
percent. Caucasians are the dominant ethnicity in reserve formations at over 50 percent of
the strength, while Caucasians, Blacks and Hispanics account for all but 6.7 percent of
the total ethnic makeup. The ethnic composition of the Reserves is slightly more diverse
than in 2001 as Caucasians, Blacks, and Hispanics made up 94.2 percent of the force.
Over the past decade the force has become slightly “younger” with SL1’s accounting for
just over 47 percent as of September, 2001, while in 2011 accounting for over 50 percent.
There currently are two percent more males now than in 2001. The demographic makeup
of the Reserves has remained nearly unchanged since 2001 despite being engaged in
combat operations nearly as long.
USAR Forces
All members of the Army Reserve, to include those on the retired rolls, are part of
the Total US Army Reserve, while the Selected Reserves are those serving either as
Troop Program Unit (TPU), as Active Guard Reserve (AGR), or as Individual
Mobilization Augmentee (IMA) Soldiers as seen in table 1. The Ready Reserve is
composed of TPU, AGR, and IMA Soldiers along with those in the Individual Ready
Reserve (IRR).

5
Source: Created by author. Table data from the Army Reserve, G-1, Manning Division, Fort Belvoir, Virginia, current as of September 2011.
Troop Program Unit Soldiers are the ones normally associated with the word
“Reservist,” as they are required by regulation to attend all Battle Assemblies (BAs) and
Annual Training (AT). Battle Assemblies are four-hour blocks of time with a Soldier
acquiring four BAs over a typical training weekend (multiple Battle Assemblies or
(MBAs)) for a total of 48 BAs annually. AGR Soldiers serve in full-time support roles
either in reserve units or alongside RA Soldiers in multi-component commands.
Individual Mobilization Augmentees, the smallest group in the Selected Reserve,
are Soldiers called to serve in the temporary mobilization actions. According to Army
Regulation (AR) 140-145 paragraph 1.6a, “The projected military manpower
requirements needed to respond to future contingency operations and/or actual
mobilization far exceed the Army’s normal peacetime staffing levels.”7 Soldiers in IMA
status must also be prepared to be called to active duty in a time of war.
All Soldiers are required to serve a minimum of eight years, but not all Soldiers
sign up to serve on active duty or in a reserve unit for this required time. Those Soldiers
who have served less than eight years are automatically placed in the IRR. Soldiers in the
Table 1. Selected Reserves Composition
Composition Gender Race/Ethnicity
Source Selected Reserves Male Female Hispanic Caucasian Black Other
Enlisted 82.7% 63.8% 18.9% 12.1% 46.4% 18.9% 5.3% Officer 15.8% 11.8% 4.0% 1.1% 10.7% 2.7% 1.2%
WO 1.6% 1.3% 0.2% 0.1% 1.1% 0.3% 0.1%

6
IRR are subject to recall to active or reserve duty depending on the needs of the Army.
The approximate count of these Soldiers in the Selected Reserves is found in table 2.
Table 2. Breakdown of Assigned Selected Reservists
Category Count Percent TPU 185995 90.80% AGR 15950 7.80% IMA 2858 1.40% Selected Reservists 204803 100.00%
Source: Created by author. Table data from the Army Reserve, G-1, Manning Division, Fort Belvoir, Virginia, current as of September 2011.
Unsatisfactory Participation
There are multiple reasons why TPU Soldiers become Unsatisfactory Participants,
varying from lack of integration in the unit to civilian job requirements. These multiple
reasons create the difficulties that commanders have to address when categorizing a
missed drill or missed Annual Training as unexcused. If Soldiers miss nine BAs without
being excused by the Commander, or fail to attend all of the Annual Training events in a
rolling annual period, they are labeled Unsatisfactory Participants. The IMA and IRR
Soldiers who are called back to reserve duty are subject to the same accountability rules
as TPUs, but their frequency of missed attendance is outside the scope of this study.
Soldiers may receive no more than four unexcused absences during a training weekend
(four four-hour periods). For every unexcused absence, the commander sends a letter
(Army Regulation (AR) 135-91, 1-20) to the Soldier listing the total number of
unexcused absences and providing a warning about becoming an Unsatisfactory

7
Participant. The commander has the ultimate decision authority about how to characterize
absences.
The commander may label an absence as excused depending on the circumstances
and whether the Soldier provides justification for missing the training. AR 135-91
provides guidance on how to handle reasons for missing drill; in particular, section II,
paragraph 4-8 states “Absences may be excused when sickness, injury, or some other
circumstance beyond the Soldier’s control caused the absence.”8 Thus, a commander has
the ability to decide how to characterize missed training, either increasing or decreasing
the number of Unsatisfactory Participants, because of interpretation of the regulation.
Becoming an Unsatisfactory Participant is a violation of the Uniform Code of
Military Justice (UCMJ), causing the Soldier potentially to be removed from military
service. Upon entrance into the Army Reserves, the Soldier must sign a contract which
states the length of service, MOS, etc. Included in the documentation that each enlisted
member must sign is Department of the Army Form 3540 (DA 3540) “Certificate and
Acknowledgment United States Army Reserve Service Requirements and Methods of
Fulfillment,” which includes a discussion of required attendance. Section VII of DA
3540, unsatisfactory participation, spells out the requirements for attendance and the
consequences of failing to meet requirements; it can be reviewed at the army publication
website. An excerpt is at Appendix A.
A Soldier who becomes an Unsatisfactory Participant may be reduced in rank (if
enlisted), reassigned, or placed in the IRR depending on commander’s discretion. A
Soldier considered by the commander as unsuitable for service is discharged from the
Reserves.9 The service of a discharged Service Member may be characterized as Other

8
Than Honorable, resulting in annulment of education incentives and cancellation of any
unpaid bonuses which are part of the Selected Reserve Incentive Program (SRIP). Most
recently a memorandum, “Termination and Recoupment of Incentives for Unsatisfactory
Participants,” dated October 31, 2011 was sent out to all Reservists (Appendix B). This
memorandum states “Effective 1 Nov 11, Soldiers with an unexcused absence from
Battle Assembly (BA) that remains unexcused for more than 90 days will have their SRIP
incentives terminated.”
The ambiguity within the regulation for the determination of unexcused or
excused absences forces the question of whether variation in the number of
Unsatisfactory Participants is solely commander-based or whether there are other factors
that lead to a Soldier becoming an Unsatisfactory Participant.
Research Questions
What demographic data best explain a Reservist’s becoming an Unsatisfactory
Participant from missing scheduled drills and Annual Training?
The secondary research questions are:
1. What personal situations to include age, marital status, and rank best explain
absenteeism?
2. What environmental conditions such as geographic region best explain
absenteeism?
3. What is the best model, given available data, to explain the observed levels of
unsatisfactory participation?

9
Limitations and Data Sources
This thesis uses only unclassified data and sources. The current count used for
Unsatisfactory Participants is as of September 2011. This thesis will review previous
studies to determine potential for forecasting Unsatisfactory Participants. It will limit the
discussion just to those Soldiers in TPUs and based on the outcome of the study will
make recommendations for future work. All quantifiable data, unless otherwise noted, are
provided by Army Reserve, G-1, Manning Division, as the proponent for personnel data
for the Reserves.
Thesis Scope
Despite the Army Reserve’s division into distinct separate but supporting groups
ranging from the IRR to AGR, this thesis focuses only on the accountability of TPU
Soldiers. It reviews the combination of characteristics of those Soldiers who routinely are
at training and those prone to fall into the category of Unsatisfactory Participant to
identify any explanatory variables or combinations thereof. The purpose is to determine if
there are factors that explain which Soldiers are most apt to become Unsatisfactory
Participants and to create a model capable of identifying those Soldiers.
Thesis Outline
Chapter 2 consists of a literature review of previous work and findings related to
the topic of unsatisfactory performance. Chapter 3 explains the methodology used in
contrasting the characteristics of the Soldiers deemed Unsatisfactory Participants with
those of the Soldiers who routinely appear for required formations. Chapter 4 develops a
regression model commanders can use to assess the likelihood of Soldiers being absent

10
from BAs and Annual Training. Chapter 5 provides findings and recommendations for
future studies.
1Morris Janowitz, “The Citizen Soldier and National Service,” Airpower Journal
(November-December 1979), http://www.airpower.maxwell.af.mil (accessed September 9, 2011).
2United States Army Reserve, “The Mission of the Army Reserve,” http://www.usar.army.mil/ (accessed October 14, 2011).
3My Army Reserve, “Army Reserve- celebrating 103 Years with Soldiers and Families,” http://myarmyreserve.dodlive.mil/ (accessed October 14, 2011).
4United States Army Reserve, “U.S. Army Reserve Command,” http://www. usar.army.mil/ (accessed October 14, 2011).
5United States Army Reserve, “Operational and Functional Commands,” http://www.usar.army.mil/ (accessed October 14, 2011).
6United States Army Reserve, “Training Commands,” http://www. usar.army.mil/ (accessed October 14, 2011).
7Department of the Army, Army Regulation (AR) 140-45, Individual Mobilization Augmentee (IMA) Program (Washington, DC: Government Printing Office, 2007), 3.
8Department of the Army, Army Regulation 135-91, Service Obligations, Methods of Fulfillment, Participation Requirements, and Enforcement Procedures (Washington, DC: Government Printing Office, 2005), 12.
9Ibid., 32.

11
CHAPTER 2
LITERATURE REVIEW
With unsatisfactory participation averaging 4.8 percent from April 2006 to
September 2011, the problem has habitually caught the eyes of commanders, and has
served as the basis for multiple studies on this topic. This thesis will review previous
research, as well as journal articles that have used various methods of researching the
ongoing issue of voided spaces within the USAR ranks resulting from Unsatisfactory
Participants. This chapter begins with a review of a demographic study followed by a
review of the socialization process that includes demographics and survey data. The final
review is of a study similar to this thesis that is quantitative in nature and looks at
descriptive factors of the Soldiers to gain insight into Unsatisfactory Participants.
Demographics
In 1999, Kathryn M. Kocher and George W. Thomas conducted a study entitled
“Profile of Unsatisfactory Participant Losses from the USAR” on similarities between not
only Unsatisfactory Participants, but all Soldiers leaving the USAR. This looked at
common characteristics of those leaving the Reserves because of chapter action as
Unsatisfactory Participants, Voluntary Leavers (those that separate from the service), No
Shows (those that never show to their units), transfers to RA, and those that fulfilled their
service obligation, using data from 1994 to 1996.1 The study focused only on enlisted
prior service and non-prior service Soldiers and chose not to consider Officers, or
Warrant Officers. The commonalities of the TPUs gleaned from the study do not appear

12
different from today, yet the count of Unsatisfactory Participants has declined
dramatically from over 23,000 to an approximate 12,000 in September 2011.
Regardless of time or mission the USAR has had the same issues and concerns
over unsatisfactory participation: understanding factors common to those who fail to
attend mandatory formations.
Service in a USAR Troop Program Unit requires a substantial commitment of time and energy and often competes with family and civilian job responsibilities. Some reservists never appear at their assigned TPUs (no shows) while others participate initially but eventually fail to attend required drills and are dropped from the organization (Unsatisfactory Participants).2
The study aimed to identify significant characteristics of an Unsatisfactory Participant:
from basic characteristics of ethnicity, sex, age, and mental proficiency on required Army
entry tests to those characteristics associated with the Army: MOS, rank, and previous
military experience. “A typical 1995-96 USAR Unsatisfactory Participant was a white,
unmarried male whose highest level of education was a high school diploma.”3 Once a
Soldier had served on active duty or had prior Reserve service, he was considered prior
service, but regardless of previous experience or not the most likely rank for an
Unsatisfactory Participant was E4. But it also should be noted that the rank with the most
Soldiers is E4; currently, 31.4 percent of the Soldiers in TPUs are E4s.
The Kocher and Thomas thesis used data provided by the Standard Installation
and Division Personnel Reporting System (SIDPERS), the Army’s personnel system,
which provides a wealth of personal data on each Soldier. One category located on each
enlisted member’s personnel file is the Soldier’s Armed Services Vocational Aptitude
Battery (ASVAB) scores. Soldiers joining the Army as Officers are not required to
participate in the same testing. In times of greater demand for recruits, entrance exam

13
standards may be lowered; in 2011, the Army had some of the most rigid requirements in
its history for entrance into the service. However, in 1996 there were more categories of
acceptable scoring criteria, but even so those entering the Army in the grade of E4 were
to be “considered high quality” based upon the outcome of entrance exam testing.4 As in
most other professions there are some positions that are more critical than others, and the
Army’s MOSs are no different. The Unsatisfactory Participant as an E4 typically did not
have a priority MOS, but was receiving a bonus despite being at the same pay grade for
nearly two years.5 It appears that those Soldiers who became Unsatisfactory Participants
had been integrated into a unit, were not straight out of high school, and had competent
skills. However, the study profoundly concludes that Unsatisfactory Participants “joined
the Reserves at an earlier age than did USAR members or other loss groups. They are
younger, lower ranking, have spent less time-in-grade, and have received fewer incentive
benefits than other types of losses.”6
Unsatisfactory Participants are not the only way a TPU, as well as the entire
USAR, loses trained Soldiers from their formations. There are Soldiers who go through
Basic Training and Advanced Individual Training, but never report to their units (No
Shows) for a variety of reasons from lack of transportation to job conflicts. Thus, another
category is Voluntary Leavers who request a release from their obligation for very similar
reasons as No Shows. The findings of the study show that the category of Voluntary
Leavers is the highest loss category for prior service Soldiers, while Unsatisfactory
Participants is the number one loss category for non-prior service.7 The conclusion of this
study is that Soldiers who are likely to become Unsatisfactory Participants display many
personal and military background issues indicating that they face particular challenges

14
when adjusting to the TPU environment and that they may be seriously "at risk" of
dropping-out.8
The Kocher and Thomas study falls short of pinpointing why a Soldier becomes
an Unsatisfactory Participant, and settles for drawing a picture of a Soldier who stops
showing up for drill. It states that there are challenges for these Soldiers that are red flags,
but for the most part these challenges are the same as for other Reservists–civilian career
conflicts, distance from the TPU and personal conflicts. However, there does appear to be
a difference in commitment between prior service and non-prior service Soldiers; non-
prior service are more inclined to have a pattern of missed BAs. While this study is over a
decade old, it still describes of a force looking to fill its ranks more completely and it
improves understanding of why some fail to fulfill their duties.
Socialization
Whereas the Kocher and Thomas thesis draws the line at quantifiable data, Bob
Barrios-Choplin, Aimee Kominiak, and George Thomas collected survey data in 1999 in
their study entitled “Reasons for Unsatisfactory Participation in the Army Reserve: A
Socialization Perspective.”9 The study was conducted through surveys to 100 junior
enlisted Soldiers who became Unsatisfactory Participants within their first year in a unit
in an effort to determine factors that led to the Soldiers’ decisions to stop participating in
BAs. The article provides linkages among recruiting, expectations, job satisfaction, and
other factors and their impacts on the Soldier’s decision to exceed the Army’s allowed
standards for missed training. Through these surveys the authors were able to gain insight
into subjective reasons for no longer attending drills and to provide potential
recommendations for reducing the occurrences of unsatisfactory participation.

15
Choplin and his team looked at the various ways a civilian receives information
about beginning the transformation into becoming a Soldier. The first step the civilian
makes is as an applicant entering a recruiting station where he or she is introduced to the
vast opportunities of Army service. The recruiter has the opportunity to assist the
applicant in deciding whether to join the USAR or RA and in selecting an MOS, typically
through several meetings. This interaction between applicant and recruiter begins the
maturation process of the prospect by aligning what is perceived as life in the Army with
actually serving in that Army. The initial focus of Choplin and his colleagues was on the
relationship between recruiter and applicant and his/her assimilation into Army life.
The recruiting of non-prior service applicants is handled by the United States
Army Recruiting Command (USAREC) as the only command that recruits both USAR
and RA Soldiers. Soldiers who have prior-service experience are recruited by USAREC
Human Resources Command (HRC), which focuses on those Soldiers leaving active duty
and United States Army Reserve Command (USARC), which utilizes the Individual
Ready Reserve (IRR) database. Once the Soldier joins the Reserves, the recruiter’s job is
complete and the new Soldier receives a sponsor from the unit as part of the Command
Sponsorship Program. The sponsor and the full-time support members of the unit provide
the initial unit integration as directed by the commander. The study looked at these
interactions, and referenced Dr. Fredric Jablin’s four stages of socialization (anticipatory
socialization, organizational encounter, metamorphosis, and exit) to show how Soldiers
and units meld.10 “The anticipatory socialization stage of the model is categorized by the
Reservist receiving information from sources which form the newcomer’s first
impressions and expectations of the Reserves.”11

16
Using the survey method the authors asked questions related to Soldiers’ initial
beliefs and concepts about their prospective unit and MOS. The authors learned that the
majority of Soldiers gained knowledge about the Army and the TPU from their recruiter.
However, nearly 50 percent of the Soldiers who received information from their
recruiters said it was less than accurate.12 This initial miscommunication or
misinterpretation provides false and potentially impossible expectations that contribute to
dissatisfaction. The requirements for the recruiter to take the applicant to the TPU vary,
but during this study the majority of recruiters delivered the Soldier to the unit while
simultaneously explaining the mission.13 Despite the efforts of recruiters and members of
the unit, the Soldiers who have unobtainable expectations or envision lofty goals are
inclined to become Unsatisfactory Participants due to disappointment in the unit or
personnel.
Expectations are enhanced or diminished by those Soldiers already in the unit.
Once the Soldier arrives at the unit, he begins to meet fellow Soldiers, i.e., enters the
encounter phase in which expectations are either achieved or discovered to be far-
fetched. If the Soldier’s encounter is positive he begins the metamorphosis stage, which
“marks the newcomer’s alignment of expectations to those of the organization, otherwise
dissatisfaction may lead to missed Battle Assemblies.14 The questions asked by the
researchers centered on the initial reception by the unit, commanders brief and
sponsorship programs. Over 70 percent of the new Soldiers completed in processing
within the first two drill weekends.15 The authors found that 11 of the surveyed Soldiers
left during the encounter phase; with all but two of the departures blamed on the unit (two
did not have adequate transportation).16 This exodus so early in a military career could

17
indicate a lack of dedication and commitment and very little knowledge of military
operations.
Although Jablin does not tie a quantifiable time to each of his phases, it appears
that the Soldiers in the anticipatory socialization, encounter, and metamorphosis stages
do not have enough time in the unit to make educated decisions. The metamorphosis
stage should be a time when the Soldier becomes more committed to the unit and vice
versa, but these newly minted Soldiers found training, administrative functions and
leadership worse than expected.17 The final stage of the indoctrination and unit alignment
is exit, which is the ceasing of fulfilling his/her contract requirements. The main fact
from the exit section is that only 41 percent of the Unsatisfactory Participants received
contact from anyone from the unit; this suggested that they had not become contributors
to the unit and there were failures in the sponsorship program. The study suggested that
70 percent of the Soldiers surveyed would rejoin the unit if issues were resolved.
However, the perception associated with this recommendation is that if Soldiers stop
making formations, then units will alter the unit’s tactics, techniques and practices; thus
the delinquent Soldier is rewarded for his actions.
Regression
Shelley Perry, James Griffith and Terry White demonstrate how previous research
had been contradictory and had failed to provide a clear picture of identifiers for
Unsatisfactory Participants. In the research article entitled “Retention of Junior Enlisted
Soldiers in the All-Volunteer Army Reserve,” Perry et al. discovered a high correlation
between prior-service Soldiers with low educational and low aptitude levels and high rate
of separation, while other studies divulged the fact that “personal characteristics” have

18
very low explanatory power.”18 Job satisfaction for reservists is a driving factor in staying
in a unit regardless of incentives, while significant changes in lifestyle greatly impacted
the likelihood of attriting from the reserves. The difficulty with identifying characteristics
that may lead a commander to better predict who will become an Unsatisfactory
Participant is still as much of a problem in 2011 as it was 10 years ago.
Perry, Griffith, and White in 1991 conducted a quantitative analysis to try to
determine likely predictors of Unsatisfactory Participants by using multi-year samples
from over 3,500 TPUs.19 The study focused on rank, age, marital status, ethnicity and
gender - weighted to gain proportionality among the sample. The researchers developed
survey questionnaires to answer a variety of questions ranging from reasons for joining
the reserves to reasons why Soldiers stop coming to drills. The responses were graded
from most likely to not likely, and given a numerical value to lay the qualitative analysis
foundation. The study used correlation analysis, which showed that the following
variables were not significant predictors of Unsatisfactory Participants: “gender, marital
status, prior active-duty experience, unemployed status, full- or part-time employment in
a civilian job, annual income, and ‘MOS.’”20 The fact that the above factors had limited
strength in identifying Unsatisfactory Participants led the researchers to begin conducting
analysis using three regression models, which consisted of varying the model variables
from solely career intent (Soldier centered) to the impact on career intent when taking
family into account. These variables were created as a result of Soldiers’ answers to a
questionnaire.
Regression modeling involves weighing the correlation between factors to
determine their ability to serve as predictors. Through modeling the researchers found the

19
strongest predictors of a Soldier leaving the service were a lack of “skill development,
lack of belonging to and personal meaning in the Army Reserve, and pay problems.”21
The correlation between civilian and military life was found to be tied to spousal
approval and the degree to which the drill weekends disrupted the home.22 The authors
combined all the factors and looked at the linkages between not only age, ethnicity, and
education, but also less tangible factors from impressions of the unit to family
perceptions. These combined factors indicated attrition to be centered “on perceptions of
Soldiers that they are not important contributors to the unit, that they are not worthy of
job- and military-skill development and utilization, and that leaders do not recognize their
importance.”23
The study suggested that junior enlisted, high school educated, white males had
the highest likelihood of attriting, but this also represents the largest demographic in both
Reserves and Regular Army. Once these commonalities are accounted for, the study
tends to demonstrate that the perceptions of the unit by the family and the feelings of self-
worth and potential for advancement are additional intangible factors. If it were not for
these intangible factors, then the commanders could concentrate more easily on those
Soldiers with similar visible characteristics of Unsatisfactory Participants. Identifying the
common factors of the Unsatisfactory Participants was the main goal of this study and the
authors provided relevant data-centric analysis for commanders.
The three studies reviewed in this chapter have a wide range of research
methodology for conducting analysis, but all have a common underlying goal of
identifying the characteristics of an Unsatisfactory Participants. However, all three of the
studies demonstrate that creating a general description of an Unsatisfactory Participant is

20
a difficult task because of intricacies of determining demographic and social interactions.
When conducting analysis the researchers are normally at the mercy of the data and
sources, which implies the possibility of different outcomes depending on the available
data. Chapter 3 will consider the use of various descriptive data to determine which
factors, if any, have any significance in predicting attrition due to Soldiers ending their
service prematurely.
1Kathryn M. Kocher and George W. Thomas, “Profile of Unsatisfactory
Participant Losses from the USAR” (Master’s Thesis, Naval Postgraduate School, Monterey, CA, 1999), 1.
2Ibid.
3Ibid., 9.
4Ibid..
5Ibid..
6Ibid., 59.
7Ibid.
8Ibid., 60.
9Bob Barrios-Choplin, Aimee Kominiak, and George W. Thomas, “Reasons for Unsatisfactory Participation in the Army Reserve” (Master’s Thesis, Naval Postgraduate School, Monterey, CA, 1999).
10Ibid., 16.
11Ibid., 25.
12Ibid.
13Ibid., 30.
14Ibid., 16.
15Ibid., 31.

21
16Ibid.
17Ibid., 40.
18James Griffith, Shelley Perry, and Terry White, “Retention of Junior Enlisted Soldiers in the All-Volunteer Army Reserve,” Armed Forces and Society (1991): 113.
19Ibid., 116.
20Ibid., 120.
21Ibid., 121.
22Ibid.
23Ibid., 130.

22
CHAPTER 3
RESEARCH METHODOLOGY
The objective of this thesis is to develop a model that assists commanders in
identifying characteristics that explain why Soldiers become Unsatisfactory Participants.
The present chapter begins with a discussion of data selection and software to be used for
calculations. The subsequent section discusses model selection criteria followed by the
model output and the procedure for converting input variables into a useful format. The
final portion of this chapter discusses expected outcomes and hypothesis testing.
Data Inputs and Software
When a commander looks around the formation, each Soldier can be identified
readily by various visible traits such as gender and race, while other characteristics may
not be visible, i.e., marital status. However, the combination of these characteristics helps
to create a better picture of the Soldier. This grouping of characteristics leads to the quest
to find a combination that helps to identify commonalities in those Unsatisfactory
Participants versus those attending regularly. Given previous research, the data used in
this study include ten separate characteristics for each Soldier chosen based upon
historical data, descriptive value, and availability. The individual innate characteristics
are gender and ethnicity while data points that are subject to change are age, rank, MOS,
location (UIC), Regional Support Command (RSC)/Major Support Command (MSC)
(which is a grouping of UICs by state as seen in figure 2) and marital status. The only
characteristic not innate or quickly subject to change is whether or not the Soldier has

23
prior service experience. These characteristics, coupled with the Soldier’s performance
status, provide the variables used in the development of a model.
Figure 2. RSCs/MSCs
Source: Created by author with data from Army Reserve, G-1, Manning Division. The RSCs are those CONUS (Continental United States) units while the MSCs are OCONUS (Outside of the Continental United States).
Three sequential steps were necessary to produce an acceptable explanatory
model: data preparation, model determination, and error checking. First, in December
2011 Army Reserve, G-1, Manning Division provided data for each individual TPU
Soldier in Microsoft Excel. These were prepared for model use by converting categorical
data into numerical values followed by pairing with participation status (Satisfactory or
Unsatisfactory). Once the data were properly coded, the various data points were
reviewed for accuracy and missing values. The next step was to determine the form of
regression that produced the optimal model given that the dependent variable can only

24
assume two values and that there are multiple independent variables. Once the model
type was determined and run, the final step was error checking coupled with reviewing
measures of performance to determine the explanatory power of the model. Thus, the
goal of this chapter is to determine if there are variables that can be modeled to assist
commanders in identifying characteristics of incoming Soldiers that may lead to an
increased chance that they become Unsatisfactory Participants.
The primary software used to prepare the data for conducting regression analysis
was Microsoft Excel. However, due to concerns about regression output using Excel, the
open source Software, R (www.r-project.org), was utilized to conduct regression analysis
with Analysis 6 (Analysis Studio) for verification. The demographic data used in this
thesis had an “as of” date of September 2011. Due to data utilization coming from a time
slice, slight changes in reported and actual data were possible - for example, a Soldier
may have divorced but may not have updated personnel data, thus slightly skewing the
personal information. With the completion of data identification for each chosen TPU
Soldier, the focus shifts to regression analysis.
Regression Analysis
Regression analysis is defined as “the part of statistics that deals with the
investigation of the relationship between two or more variables related in a
nondeterministic fashion.”1 Regression models look to mathematically explain the
relationships between independent or explanatory variables, such as age and rank, and a
dependent variable–Unsatisfactory Participant, for example.2 The difficulty with the topic
of unsatisfactory participation is determining which type of model to utilize for the best
explanatory analysis. The basic regression model, referred to as a simple linear regression

25
model, typically entails an interval-scale dependent variable. However, in this study the
dependent variable is dichotomous (two possible outcomes)–Unsatisfactory Participant or
not. Thus, linear regression is not the best in this instance and another method allowing
for multiple variables constrained by the dependent variable data type must be used.
The goal of this thesis is to identify factors that suggest whether a Soldier
becomes an Unsatisfactory Participant (the dependent variable), or not. Because of the
nature of the dependent variable, the use of logistic regression appears appropriate since
it is “well suited for describing and testing hypotheses about relationships between a
categorical outcome variable and one or more categorical or continuous predictor
variables.”3 The method of logistic regression used for this thesis is stepwise, which “is
designed to find the most parsimonious (stingy or restrictive) set of predictors that are
effective in predicting the dependent variable. Variables are added or removed from the
logistic regression equation one at a time. After each variable is entered, each of the
previously included variables is tested to see if the model would be better with the latter
variable excluded.”4 Factors excluded by the process are assumed in this thesis to be
unrelated to the dependent variable. In some studies stepwise regression is frowned upon
because the software makes the decision for inclusion/exclusion; however, in predictive
and exploratory research stepwise regression is commonly used.5 This research attempts
to determine a predictive model and thus stepwise logistic is chosen with the selection of
each variable reviewed in each step.
Using logistic regression, the probability that an event will occur based upon
provided explanatory variables will be denoted by Y, while each explanatory variable will
be represented by an X with a numerical subscript to show each is a unique variable. The

26
final component of the logistic regression model, which is part of the output, is the
regression coefficients (or multipliers) for each of the X terms, denoted by β. The α (the
intercept term) and the β terms are estimated by applying the method of least squares
regression to the logarithmically transformed odds ratio to “maximize the likelihood of
reproducing the data given the parameter estimates.”6 Typically in linear regression, the α
and β terms are estimated using the least squares method, but because the dependent
variable is dichotomous this is not the best estimation method for logistic regression.
There are two interpretations of the outcome from logistic regression depending
on the desired output: (1) the outcome is a representation of odds using the logit or
natural log of the odds ratio as seen in figure 3, with π representing the probability of Y
occurring or (2) the outcome is a probability estimate as in figure 47 and is derived from
figure 3 by solving for π. For this thesis figure 4 will be the method used to display and
discuss the outcomes from modeling. However, either outcome method requires the
transformation from demographic data to quantitative data among TPU Soldiers. The
model potentially will include interactions of the variables to see if a combination is more
telling than just using the using individual variables alone. For example, grade and age
provide explanatory power but inclusion of the combination (grade*age) may
demonstrate greater explanatory power.
odds = logit(π) = ln �𝜋
1 − 𝜋� = 𝛼 + 𝛽1𝑋1+ . . + 𝛽𝑘𝑋𝑘
Figure 3. Logistic Regression Model–(Natural Log of Odds Ratio) Source: (Formula constructed data provided from www.luna.cas.usf.edu). The subscripts are used to represent the different factors and the related coefficients regression. The symbol α signifies the intercept while 𝛽1𝑋1 is the combintaion of the coefficient (β) and the variable (𝑋).

27
𝑃(𝑈𝑛𝑠𝑎𝑡𝑖𝑠𝑓𝑎𝑐𝑡𝑜𝑟𝑦 𝑃𝑎𝑟𝑡𝑖𝑐𝑖𝑝𝑎𝑛𝑡) = 𝜋 = 𝑒𝛽0+𝛽𝑘𝑋𝑘
1 + 𝑒𝛽0+𝛽𝑘𝑋𝑘
Figure 4. Logistic Regression Model–Probability (antilog of odds ratio)
Source: Created by author using constructed data from Michael Brannic and the University of Southern Florida Website, “Logistic Regression.” The subscripts are used to represent the different factors and the related regression coefficients. 𝛽0 represents the constant for example while 𝛽𝑘𝑋𝑘 is the last factor and its corresponding coefficient.
Taking the dependent variable (π), the probability that the Soldier is an
Unsatisfactory Participant, and dividing by the probability that the Soldier is a
Satisfactory Participant creates the odds calculation� 𝜋1−𝜋
�. The logit (the natural log of
odds) is used as an intermediate step to compute the odds of being an Unsatisfactory
Participant.8 The β terms relate to the effects the associated variables have on the logit,
with large positive terms having a greater positive effect and conversely when negative.
If the goal is a probability instead of the logit, this is derived by exponentiation and then
by solving for π. For further discussion of natural log and exponentiation, see chapter 13
of Probability and Statistics for Engineering and the Sciences (2008) by Jay Devore.
Data Transformation/Selection
The first step taken to prepare the selected data for input is to verify their quality
to ensure there are no gaps or missing information. Missing information such as PMOS,
age, and race, required 1,478 data points to be removed from the study. Of these, 17 were
Unsatisfactory Participants. To create a dichotomous model, the number of missed drills
is transformed into either Unsatisfactory Participant (missed drills at least nine times) or
not, represented as a 1 or 0 with 1=Unsatisfactory Participant and 0=Satisfactory
Participant for all 184,517 TPU Soldiers. This resulted in 11,775 Soldiers coded as a 1, or

28
as an Unsatisfactory Participant. So, the percent of Unsatisfactory Participants is π =
11,775184,517
=0.064, and furthermore the odds of being an Unsatisfactory Participant is
� 𝜋1−𝜋
� = .0641−.064
= .068.
Next, all verbal descriptors must be coded in order to be modeled. An example of
this kind of coding is taking gender terms of female and male and replacing them with a
1=female and 2=male. Once all the data are converted to numerical representations, they
can be inserted into the model. The outcome is merely a process executed by the
computer software, but the results must be reviewed to determine efficacy and resulting
errors.
The final step before implementation is to select a group, or sample, from the
entire number of TPU Soldiers, or population, to be modeled. This step is necessary due
to software limitations available for this thesis–a maximum of 100,000 possible rows
could be computed using the purchased version of Analysis Studio software used to
verify the output from R. The results of this step provide the model for the sample, which
is annotated by n. If the model had included all variables then N would have been used to
represent the population. The sample size should be at a minimum10:1, but at least 50 to
provide the opportunity to select a reasonable representation of the population.9The
sample selected for this thesis is a stratified sample, which “entails separating the
population in non-overlapping groups and taking a sample from each one.”10 The groups
for sampling are the RSCs/MSCs with 25 percent, or 46,131 Soldiers, taken from each
and chosen by assigning a random number to each Soldier and then ranking from highest
to lowest. The stratified sample provides a more confined sample ensuring that all

29
RSCs/MSCs are included while the use of a random number generator ensures no bias in
data selection. This method of data selection yielded 2,991 Unsatisfactory Participants or
6.48 percent with the remaining 43,140 as satisfactory performers for the purpose of
modeling.
Model and Variable Inclusion/Exclusion
The determination of whether or not a variable is included in the model will be
based on the p-value, which is defined as the “smallest level at which the data is
significant.”11 The p-value is computed from a formula or obtained from tabled values; if
the computed p-value is smaller than .05 the corresponding variable is assessed as
significant (with a maximum 5 percent chance of error) and should be included in the
model. The computations for the p-value is outside the scope of this thesis, but can be
reviewed on page 15 of Probability and Statistics for Engineering and the Sciences
(2008) by Jay Devore.
Purpose/Output
The output from the logistic regression program includes the model equation itself
and a variety of statistical summaries. This output from the program helps in determining
the value added by the inclusion of the variables as well as the selection of the model.
The model will be evaluated using hypothesis testing to see if it provides a better fit for
the data than under the null hypothesis (Ho) that no variables help explain Unsatisfactory
Participants. The definition of hypothesis testing is:
The null hypothesis underlying the overall model states that all βs (coefficients) equal zero. A rejection of this null hypothesis implies that at least one β does not equal zero in the population, which means that the logistic regression equation

30
predicts the probability of the outcome better than the mean of the dependent variable Y.12
The null hypothesis implies that the coefficients associated with all the variables are
equal to zero, i.e. that there are no significant explanatory variables for Unsatisfactory
Participants.
The test of significance based on the p-value is further refined by determining the
explanatory power of each variable, assessing the adequacy of the model fit to the output,
and finally reviewing the predictions of the model. Part of the evaluation of the models is
to look at the goodness of fit measurement (Akaike Information Criteria (AIC)) for each
model, with the lowest being deemed the best fitting model, to see if the modeled data are
more predictive than not using a model. AIC is determined by multiplying 2 by the
number of parameters and subtracting 2 times the natural log of the likelihood (ratio),
which produces a value to be compared against other models; see figure 5. “The
likelihood ratio approach can be used to provide a test of significance of regression in
logistic regression.”13 The AIC approach to comparing models does not validate the
accuracy or worth of the models, it is only used as a comparative tool.
In itself, the value of the AIC for a given data set has no meaning. It becomes interesting when it is compared to the AIC of a series of models specified a priori, the model with the lowest AIC being the “best” model among all models specified for the data at hand. If only poor models are considered, the AIC will select the best of the poor models.14

31
AIC = 2k − 2 (ln (L))
Where: k = number of parameters Ln = Natural Log
L = Likelihood or odds ratio
Figure 5. Akaike Information Criteria (AIC) Source: Created by author using constructed data from Michael Brannic and the University of Southern Florida Website, “Logistic Regression.” The AIC allows the reader to determine which model is best among those selected.
Further Review
Due to the possibility that the results of logistic regression may produce
unremarkable findings, this study also includes a review of the empirical data for the
TPU Soldiers. Each variable used during the regression analysis will be handled
independently to see if there are any clear signs that it can assist the commander in
determining Soldiers at risk for becoming Unsatisfactory Participants–e.g., whether the
percentage of non-prior service Soldiers failing to make drill requirements is substantially
higher than prior-service counterparts. Once the “obvious” nuggets of information are
collected a Chi-Square Test will be utilized to finalize the testing done as part of this
paper. Not all outcomes will be available using the Chi-Square Tests, for technical
reasons.
The Chi-Square Test (𝜒2) “is used to determine whether there are significant
differences between the observed and expected frequencies.”15 The result is determined
by summing the squared differences between observed and expected values divided by
the expected value, as seen in figure 6. This comparison between observed and expected
values may be computed for any of the variables. The 𝜒2 statistic is routinely compared
against tabled data of critical values based upon degrees of freedom (number of

32
parameters–1) along with the p-value. This critical value, for example, for 4 degrees of
freedom (5-1=4) and a significance level of .05 using a 𝜒2 table is 9.488 (as visible in
Appendix A.7 of Probability and Statistics for Engineering and the Sciences (2008) by
Jay Devore). If the 𝜒2 statistic is less than the critical value, then there is insufficient
evidence to reject the null hypothesis that any differences between the observed and
expected values could be due to chance and not a “systematic error.”16 The calculation of
the critical value is outside the scope of this thesis.
𝜒2 = �(𝑛𝑘 − 𝑝𝑘)2
𝑝𝑘
Where: 𝜒2 = Chi-Square Statistic 𝑛𝑘 = the kth observed frequency
𝑝𝑘 = the kth predicted frequency17
Figure 6. Chi–Square Statistic Calculations Source: Created from Thad Mirer, Economic Statistics and Econometrics, 344. The 𝜒2 allows the reader to determine if the differences between observed and predicted values are due to chance or if there is a systematic error.
This chapter provided the guidelines for conducting testing by describing the
inputs, or variables, and by determining which of these variables aid in predicting the
outcome, or dependent variable. Furthermore, additional testing definitions are contained
in this chapter to understand the data review in chapter 4 better. These evaluation results
will be discussed further as part of the findings in chapter 4 along with the results of the
model selection.

33
1Jay L. Devore, Probability and Statistics for Engineering and the Sciences
(Belmont, CA: Duxbury, 2008), 447.
2Ruth Ravid, Practical Statistics for Educator (Lanham, MD: University Press of America, 2005), 111.
3Gary M. Ingersoll, Kuk L. Lee, and Chao-Ying R. Peng, “An Introduction to Logistic Regression Analysis and Reporting,” The Journal of Educational Research 96, no. 1 (September/October 2002): 4.
4University of Texas, “Solving Problems in SPSS,” http://www.utexas.edu/ courses/schwab/sw388r7_spring_2007/SolvingProblemsInSPSS/Solving%20Stepwise%20Logistic%20Regression%20Problems.ppt (accessed February 24, 2012).
5Scott Menard, Applied Logistic Regression Analysis, 2nd ed. (Thousand Oaks, CA: Sage University, 2002), 63.
6Peng, 5.
7Ibid.
8Michael Brannic, “Logistic Regression,” http://www.luna.cas.usf.edu (accessed 21 January 2012).
9Peng, 10.
10Devore, 7..
11Ibid., 313.
12Ibid., 5.
13Douglas Montgomery, Elizabeth Peck, and Geoffrey Vining. Introduction to Linear Regression Analysis, 4th ed. (Hoboken, NJ: JohnWiley, 2006), 436.
14Marc J. Mazerolle, “Making sense out of Akaike’s Information Criterion (AIC),” http://archimede.bibl.ulaval.ca/archimede/fichiers/21842/apa.html (accessed April 10, 2012).
15Ravid, 153.
16Ibid., 155.
17Thad Mirer, Economic Statistics and Econometrics (New York: Macmillan, 1983), 344.

34
CHAPTER 4
FINDINGS
The purpose of this thesis is to answer the primary research question: what
characteristics, if any, best explain a Reservist’s missing scheduled drills and Annual
Training? In answering the primary question, this thesis also aims to look at those factors
that are significant to improving the identification of future Unsatisfactory Participants.
Answers, or lack thereof, to these questions may suggest that commander’s discretion
needs to be reviewed at a later date. Attacking the problem statistically allows for the
evaluation of data to provide commanders a quantitative framework for identifying
potential Unsatisfactory Participants.
Once the individual factors are selected, their combination leads to the
development of a model for explaining Unsatisfactory Participants. Two basic questions
must be answered to assess the validity and usefulness of the model selected for its
explanatory strength.
1. How well does the overall model work?
2. If the overall model works well, how important is each of the independent
variables?1
This model must have greater explanatory power than just guessing who will become an
Unsatisfactory Participant. All variables that are statistically significant warrant inclusion
in the recommended model. These factors contribute to the likelihood of becoming an
Unsatisfactory Participant, but provide no guarantees. This chapter will review the
findings to demonstrate that the included variables and their interactions provide the
greatest explanatory power for commanders.

35
The GLM (Generalized Linear Model) library of functions in the software
package R (http://www.r-project.org/) performed the statistical tests necessary not only to
produce the calculations to select the significant variables, but to determine the model
itself. Three of the ten original variables (gender, marital status, and primary MOS) were
eliminated immediately because their p-values were greater than .05. These variables are
unlikely to contain significant explanatory information. Each time a variable is added or
removed a new AIC will be generated. The decision to continue looking at more models
is reliant upon each subsequent model having a lower AIC than its predecessor; if not, the
process concludes that the best model has been identified. This best regression model, the
one with the lowest AIC, includes only variables that are statistically significant.
Model Selection
The left panel of table 3 shows the culmination of the first three steps of stepwise
regression (variables being removed at each model iteration not meeting certain criteria).
The first three iterations removed gender, marital status, and PMOS from consideration
for inclusion in the model. The basis for elimination of these factors from the model
(column two) is that the corresponding p-values are greater than .05. The intercept
(expected value of the dependent variable), which is the first variable listed in table 3, is a
constant term contained in each formula unless equal to zero. The software package R
also helps in the analysis by the default symbol of * to right of the p-value with a single
(*) representing some usefulness to a maximum of three (***). No asterisk in the third
column implies that the corresponding variable provides no contribution to the model.
The AIC (relative measure of goodness of fit) of the model with all the variables included
and no interactions proves to be the worst (20876). The AIC value is used only to
36
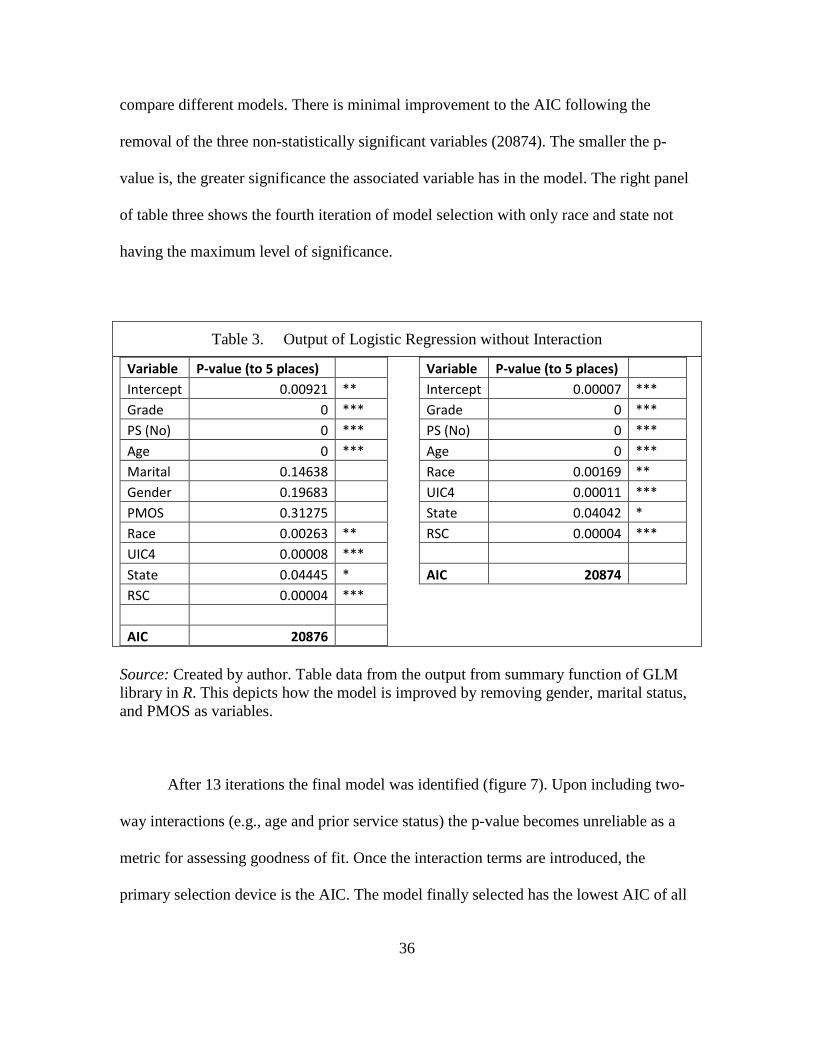
compare different models. There is minimal improvement to the AIC following the
removal of the three non-statistically significant variables (20874). The smaller the p-
value is, the greater significance the associated variable has in the model. The right panel
of table three shows the fourth iteration of model selection with only race and state not
having the maximum level of significance.
Table 3. Output of Logistic Regression without Interaction
Variable P-value (to 5 places)
Variable P-value (to 5 places) Intercept 0.00921 **
Intercept 0.00007 ***
Grade 0 ***
Grade 0 *** PS (No) 0 ***
PS (No) 0 ***
Age 0 ***
Age 0 *** Marital 0.14638
Race 0.00169 **
Gender 0.19683
UIC4 0.00011 *** PMOS 0.31275
State 0.04042 *
Race 0.00263 **
RSC 0.00004 *** UIC4 0.00008 ***
State 0.04445 *
AIC 20874 RSC 0.00004 ***
AIC 20876
Source: Created by author. Table data from the output from summary function of GLM library in R. This depicts how the model is improved by removing gender, marital status, and PMOS as variables.
After 13 iterations the final model was identified (figure 7). Upon including two-
way interactions (e.g., age and prior service status) the p-value becomes unreliable as a
metric for assessing goodness of fit. Once the interaction terms are introduced, the
primary selection device is the AIC. The model finally selected has the lowest AIC of all

37
the competing models, with AIC equal to 20761. The regression coefficiant estimates
(column two) are used along with the variables to create the model shown in Figure 8. To
determine the probability that a Soldier will become an Unsatisfactory Participant, the
Soldiers’ data values will be multiplied by the corresponding coefficient estimates, with
results closer to unity being interpreted as suggesting greater probability of missing drills.
Figure 7. Model Comparisons with Interaction Source: Created from summary function of GLM library in R. This figure depicts how the best model is achieved through the introduction of interaction terms.
For example, consider a model using only the rank of Specialist (E4). The
corresponding numeric value of an E4, 14 from Appendix C, is multipled by the

38
regression coefficient for rank; all other variables are set equal to zero, yielding a formula
reflecting rank and the constant (intercept) term: ( 1(1+𝑒(−(−3.45+14∗.1)))
)= .114. In other
words, given 100 E4s, about 11 are expected to become Unsatisfactory Participants when
no other factors are considered. Typically, however, more information will be available,
since if only rank is known then using the model results in a Major (O4) having a 26
percent chance of becoming an Unsatisfctory Particpant. Using age and rank and their
interaction demonstrates that a 21-year-old E4 (.069) has a higher chance of becoming an
Unsatisfactory Participant than a 38-year-old O4 (.027).
1/(1+exp(-(-3.45 + 0.10grade + 2.31ps + 0.03age - 0.15race - 0.0003uic4 + 0.007state - .02rsc - 0.02ps:age - 0.004grade:age + 0.03race:rsc + 0.00002age:uic4 - 0.08grade:ps - 0.002state:rsc + 0.00004uic4:rsc + 0.0002ps:uic4 - 0.00005grade:uic4 + 0.004age:rsc + 0.00005race:uic4 - 0.01grade:rsc))
Figure 8. Best Model in Coefficient Format
Source: Created from summary function of GLM library in R. By using this model format a commander can input the individual factors and obtain a probability of becoming an Unsatisfactory Particpant. The symbol (:) represents the interaction between two terms.
Understanding Coefficients
To better understand the contribution of the coefficients it is useful to place them
on the same scale to compare their relative magnitudes and importance to the model.
Standardized coefficients are coefficients adjusted so that they may be interpreted as having the same, standardized scale and the magnitude of the coefficients can be directly compared (ranked). The greater the absolute value of the standardized coefficient, the greater the predicted change in the probability of the outcome given a 1-standard deviation change in the corresponding predictor variable, holding constant the other predictors in the model.2

39
As seen in figure 8, the coefficients are small with the exception of prior service status
and the intercept, which serves as a measure of the unconditional probability of being an
Unsatisfactory Participant. The variables, however, have varied types of scales: prior
service status can only be “yes” or “no” while battalion level Unit Identification Code
(UIC4) has over 2000 possible values. The use of standardized coefficients provides clear
evidence of the strength of each variable (figure 9). The larger the magnitude of each
variable’s bar is in figure 9, the greater its statistical importance is to the model. For
example, lack of prior service experience has a substantial impact on increasing the
likelihood of missing BAs while the interaction term between an increase in grade and
prior service experience (grade*ps) relates to an increased likelihood that a Soldier
regularly makes all drill requirements.
Figure 9. Standardized Coefficients Source: Created from output from XLstat add-in for Microsoft Excel. By normalizing the coefficients the reader can see how the change in one variable directly effects the other variables.
grad
e
ps
age
race
uic4
stat
e
rsc
grad
e*ps
grad
e*ag
e
grad
e*ui
c4
grad
e*rs
c
ps*a
ge
age*
race
age*
uic4
race
*uic
4
uic4
*rsc
stat
e*rs
c
-1.5
-1
-0.5
0
0.5
1
1.5
Scal
e fo
r Sta
ndar
dize
d Co
effic
ient
s (c
ompu
ted
in sa
me
scal
e)
Variable
Standardized Coefficients (95% conf. interval)

40
Model Power
The goal of regression analysis is to identify variables that aid in explaining the
variation in the values of a dependent variable beyond pure chance. The best model, as
identified by the procedures described above, does have some explanatory power.
However, it does not explain as much of the variation in the dependent variables as might
be desired; model accuracy is 62.5 percent correct (table 4) calculated using Analysis
Studio 6. To better understand this, there is a need to look at where errors in predicting
the likelihood of becoming an Unsatisfactory Participant occur. Two types of errors result
from inaccurate labeling of Soldiers: Unsatisfactory Participant labeled as Satisfactory
and Satisfactory Participants as Unsatisfactory.
The greatest amount of error occurs when predicting Unsatisfactory Participants.
The model incorrectly identified 16,280 Satisfactory Participants as Unsatisfactory while
only correctly labeling 1,970 Unsatisfactory Participants for an accuracy rate of 10.8
percent. False positives, mislabeling Satisfactory Participants as Unsatisfactory, can be
slightly improved by changing the coding methodology. Recoding all Soldiers missing at
least one event increases Unsatisfactory Participants by 1,740 and improves accuracy
(10.8 percent to 16.2 percent). On the other hand, the model correctly identifies
Satisfactory Participants at a rate of 96.3 percent. The false negatives, misidentifying
Unsatisfactory Participants as Satisfactory, happened only 1,021 times (3.7 percent). This
much higher accuracy rates for Satisfactory Participants is aided by the much larger
population of those who routinely attend training. Table 4 reflects the accuracy for each
category.

41
Table 4. Model Accuracy
Source: Created by author with data from regression output. The model predicts a Satisfactory Participant at a rate of 96.3 percent of the time, but correctly identifies an Unsatisfactory Participant only 10.8 percent.
Empirical Data Review
Based upon the relatively poor predictive power of the selected model, there is
usefulness in reviewing the variables independently to see if there are any that viewed
alone provide insight into Unsatisfactory Participants. All 184,517 data points were
evaluated during the review of the TPU data and not just the sample used in model
selection. First, looking at two dichotomous categories of gender and prior-service status
(yes/no) yielded unremarkable results as males and females were about equally likely to
become Unsatisfactory Participants (6.3 percent and 6.5 percent, respectively) as were
results of prior service status (6.6 percent and 6.9 percent). The second group of variables
reviewed was grade and age because of the correlation between the two–the expectation
that a junior enlisted Soldier is younger than a Sergeant First Class, for instance.
As seen in Figure 10, over 12 percent of the E2 and E3s routinely fail to attend
drill. Also visible in the grades category is the higher rate of Unsatisfactory Participants
Category Predicted Satisfactory Participant
Predicted Unsatisfactory Participant
Total Row
percent Correct
Satisfactory Participant
%
26,860 62.3%
16,280 37.7% 62.3%
Unsatisfactory Participant
%
1,021 34.1%
1,970 65.9% 65.9%
Total % Correct 96.3% 10.8% 62.5%

42
in the junior officer ranks (O1-O3). But, what was not expected was warrant officers at
the grade of Chief Warrant Officer Three (CW3) have a greater percentage of
Unsatisfactory Participants than Warrant Officer (WO1). However, with graphs and
percentages, sometimes further review is necessary as there were only 2,366 warrant
Officers and 13 Unsatisfactory Participants. The anomalies of CW3s having a spike in the
chart stems from a small population; W3s number 358 Soldiers and five Unsatisfactory
Participants.
Figure 11 demonstrates that of Soldiers aged 19-25, or those typically serving in
grades of E1-E4 and O1-O2, over 10 percent were Unsatisfactory Participants. These two
categories alone show what most would expect–younger Soldiers need greater
supervision than those who are older, or are in more advanced grades.
Figure 10. Percent of Unsatisfactory Participants by Grade Source: Created from output from Microsoft Excel. The graph depicts the percent of Unsatisfactory Participants for each grade. E2-E3 have the highest percent of Unsatisfactory Participants.
0.00% 2.00% 4.00% 6.00% 8.00%
10.00% 12.00% 14.00%
E1 E2 E3 E4 E5 E6 E7 E8 E9 O1 O2 O3 O4 O5 O6 O7 O8 W1 W2 W3 W4 W5
Percent of Unsatisfactory Participant by Grade

43
Figure 11. Percent of Unsatisfactory Participants by Age Source: Created from output from Microsoft Excel. The graph depicts the percent of Unsatisfactory Participants for each age. Younger Soldiers typically have the highest percent of Unsatisfactory Participants.
The next factor is the marital status of the Soldier. Of the eight categories, single
and married are the predominant categories. There are over 90,000 single and nearly
79,000 married Soldiers. The other six categories account for just over 15,000, with
14,316 of those being divorced. Of those who are single, eight percent are Unsatisfactory
Participants while of those who are married the figure is 4.6 percent. Single Soldiers,
those who have never been married, seem to have the greatest risk of having activities
that conflict with routine attendance. Even divorced Soldiers have a lower percentage of
Unsatisfactory Participants (5.4 percent). The married category has the most instability as
a Soldier potentially could change his status more than once in a year. Caucasians
constitute 68.9 percent of the USAR force and are 65 percent of the Unsatisfactory
Participants. Of Caucasians, 6 percent routinely miss drills while the percentage of
Blacks who miss drills is over eight percent. However, Blacks have half the number of
0.00%
2.00%
4.00%
6.00%
8.00%
10.00%
12.00%
17 19 21 23 25 27 29 31 33 35 37 39 41 43 45 47 49 51 53 55 57 59 61 63 65 67
Percent of Unsatisfactory Participant by Age

44
Unsatisfactory Participants as Caucasians. American Indian or Alaska Native Soldiers
experienced 131 Unsatisfactory Participants or 10 percent.
The next category examined is PMOS. The top 10 PMOS categories by
population (42A, 88M, 31B, 91B, 68W, 92A, 92Y, 74D, 12B, and 92F) in TPUs account
for 41 percent of the Soldiers; the percent of these being Unsatisfactory Participants is 7.2
percent.
The final categories are location, to include the RSC/MSC as seen in figure 12
and states (figure 13) since they are all linked to UIC. Over 95 percent of TPU Soldiers
belong to the 63rd, 81st, 88th and 99th RSCs (figure 2). The other four RSCs/MSCs
collectively contain less than 4,400 Soldiers, to include the 65th RSC which has only 12
Soldiers. The 63rd and 81st RSCs make up 46 percent of the TPU strength, but have a 7.6
percent rate of Unsatisfactory Participants. As far as states go, Alaska and New Mexico
have the highest percentages of Unsatisfactory Participants, but Texas, which has the
largest number of Soldiers, also has 7.8 percent Unsatisfactory Participants. The
geography demographic further demonstrates that Unsatisfactory Participants are found
throughout the US, regardless of other factors.

45
Figure 12. Percent of Unsatisfactory Participants by RSC Source: Created from output from Microsoft Excel. The graph depicts the percent of Unsatisfactory Participants for each RSC. The 7th MSC and 65th RSC are the two smallest groups.
Figure 13. Percent of Unsatisfactory Participants by State/Territory Source: Created from output from Microsoft Excel. The graph depicts the percent of Unsatisfactory Participants for each State/Territory. New Mexico has the highest percent of Unsatisfactory Participants while Texas has the largest number.
0.00% 1.00% 2.00% 3.00% 4.00% 5.00% 6.00% 7.00% 8.00% 9.00%
1st M
SC
7th
MSC
9th
MSC
63rd
RSC
65th
RSC
81st
RSC
88th
RSC
99th
RSC
Percent of Unsatisfactory Participant by RSC
0.00%
5.00%
10.00%
15.00%
20.00%
AE
AL
AR
AZ
CO
DC
FL
GU
IA
IL
KS
LA
MD MI
MO
M
S N
C NE NJ
NV
OH OR PR
SC
TN
U
T VI
WA
WV
Percent of Unsatisfactory Participant by State/Territory
AK NM
TX

46
Contingency Tables
The use of contingency tables allows for the comparison between expected and
observed values using the Chi-Square Statistic (χ2) to test for significant differences
between the two. The main problem with the use of χ2 is the errors that might result when
expected number of participants in one or more categories is small. This section will
review age and grade, and their respective observed and expected Unsatisfactory
Participant counts as a way to demonstrate the utility of using χ2 test. Figures 14 and 15
are created by graphing the results of contingency tables. Figure 14 shows that the
observed and expected numbers of Unsatisfactory Participants by grade are nearly
identical and offer no insight, except in the case of E3s and E4s. Both of those grades
have a higher proportion than expected. When looking at age alone, those Soldiers in the
early 20s have a much higher than expected number of Unsatisfactory Participants, and
thus indicates a need for greater oversight for Soldiers typically associated with the junior
enlisted and officer grades. Figure 15 shows that the greatest differences occur between
the ages of 21-26. This is consistent with the contingency table associated with figure 15
showing disposition in E2 and E3.

47
Figure 14. Observed vs. Expected Unsatisfactory Participants by Grade Source: Created from output from Microsoft Excel. The graph depicts how using Chi-Square Statistic allows for the comparison between what is observed and what is expected. Most grades produce expected results except for E4 and E3.
Figure 15. Observed vs. Expected Unsatisfactory Participants by Age Source: Created from output from Microsoft Excel. The graph depicts how using Chi-Square Statistic allows for the comparison between what is observed and what is expected. Disparities are visible in ages 21-26.
E1
E2
E3
E4
E5
E6E7 E8 E9 O1 O2 O3 O4 O5 O6 O7 O8 W1 W2 W3 W4 W5, 0
E1 E2
E3
E4
E5
E6
E7E8
E9 O1O2
O3O4 O5
O6 O7 O8 W1 W2 W3 W4 W5, 30
1000
2000
3000
4000
5000
6000
0 5 10 15 20 25
Unsa
tsifa
ctor
y Pa
rtici
pant
s
Grade
Observed vs Expected Unsatisfactory Participants by Grade
Observed
Expected
0
200
400
600
800
1000
1200
17 22 27 32 37 42 47 52 57 62 67
Unsa
tisfa
ctory
Parti
cipan
ts
Age
Observed vs Expected Unsatisfactory Participants by Age
Observed
Expected

48
Summary
This chapter described the output of the best logistic regression model for
explaining Unsatisfactory Participants and demonstrated how the model was selected
from numerous similar candidates. Including interactions between terms produced the
most desirable model, while at the same time showing that not all variables have
predictive power. The errors associated with the model are magnified by the fact that the
data come from a single time slice and cannot account for the increase or decrease in
missed BAs. Since the model does not provide a result with strong explanatory power, a
review of the data along with the representation of contingency tables through graphs
(figures 14 and 15) is completed to allow for interpretation of individual factors. Chapter
5 will provide potential uses of this model, make recommendations on how to improve
the accuracy and predictive power of the model, and indicate the potential for further
study into the factors that contribute to unsatisfactory participation.
1Menard, 17-18.
2Doug Thompson, “Ranking Predictors in Logistic Regression” (Paper D10-2009); Assurant Health (Milwaukee, 2009), 2.

49
CHAPTER 5
CONCLUSIONS AND RECOMMENDATIONS
Conclusions
This purpose of this paper is to provide a method for commanders to identify
those Soldiers likely to become Unsatisfactory Participants to ensure that the Army
Reserve can mitigate losses. Logistic regression analysis was used because of the
categorical nature of the output data for each TPU Soldier. A model was developed to
classify those variables that may help to identify those who fail to attend drill at least nine
times in a running calendar year or miss part of Annual Training. The results provided by
logistic regression indicated that there are multiple characteristics that help explain
Unsatisfactory Participants. These variables appeared to be confirmed by a less
complicated empirical review of the data. These findings are consistent with previous
studies that affirmed that the most likely Unsatisfactory Participant is a unmarried junior
enlisted Soldier aged between 19-25. This reinforced the view that greater supervision
and intervention remains necessary for junior Soldiers.
The focus of commanders typically is on the junior enlisted and this need is
confirmed by the outcome of this study; the majority of Unsatisfactory Participant
Soldiers are junior enlisted. No commissioned grade exceeds 3.3 percent Unsatisfactory
Participants with the total number of Officers missing drills at 422 (table 5). The
differences between the proportions of Unsatisfactory Participant among enlisted,
officers, and warrant officers are discussed as part of recommended future studies in
chapter 5.

50
Table 5. Breakdown of Unsatisfactory Participants
Source: Created by author. Table data from Army Reserve, G1, Manning Division, Ft. Belvoir, Virginia. The counts used in this table are only those with complete information. The total TPU count is 185,995.
Another issue affecting unsatisfactory participation rates is consistency among
commanders in coding members as Unsatisfactory Participants. The commander at each
unit determines the code assigned to each Soldier missing drill including unsatisfactory
participation. The need to get this coding assignment correct and its reasons for doing so
are contained on the Army Reserve website:
Commanders must ensure Battle Assembly attendance codes are correctly documented. Service contracts and incentive agreements contain the conditions for termination and recoupment of incentives; however, Soldiers will be counseled immediately on financial and other consequences when they receive their first unexcused absence.1
To reduce or ultimately remove Unsatisfactory Participants from the ranks of the Army
Reserve requires that the commander be able to identify and correct this behavior.
Statistical modeling methods provide a diagnostic management tool for these
commanders and staffs to help reduce the count of Unsatisfactory Participants regardless
of age, rank, location, etc.
Source Soldier Count Unsat. Part. % Unsat. Part. Enlisted 157001 11340 7.2%t Officer 25347 422 1.7% Warrant Officer 2169 13 0.6% Total 184517 11775 6.4%

51
Recommendations
Commanders may utilize the findings from this study to promote awareness for
Unsatisfactory Participants as long as they understand that there are limitations to the
model. In this thesis ten categorical variables were used for modeling Unsatisfactory
Participants. The data collected and used in this thesis consist of a selection from a single
month (September 2011) and every data point provides just a one-month snapshot. The
model derived from the categorical variables correctly identifies a Solider as an
Unsatisfactory Participant or not 62.5 percent of the time. Thus, there is a need to
improve this accuracy. In an attempt to provide commanders with a useful tool for
determining the likelihood that a Soldier becomes an Unsatisfactory Participant, there are
five recommendations to consider.
The first recommendation is to seek additional demographic variables. Adding
other variables might lead to greater explanatory power. These might include such things
as socio-economic status and test scores on Army entrance exams. The combination of
test scores and PMOS may provide insight into job satisfaction for those Soldiers capable
of serving in multiple MOSs. Another category that may have explanatory power is the
distance a Soldier must travel for Battle Assemblies. However, in order to use distance as
a variable, travel time must also be included in the calculations; fifty miles in a
metropolitan area may take longer to travel than in a rural area. By adding more variables
a better description of the Soldier can be fostered and a more complete picture possibly
could be captured.
The second recommendation for future study, besides adding more categories,
would be to look at monthly reports and track by social security number those Soldiers

52
who become Unsatisfactory Participants and those who were missing drills but begin
attending regularly. This would allow for trend analysis for a better understanding of the
monthly and yearly fluctuations for individual Soldiers–i.e., it might allow one to address
the question of whether the number of missed drills increases during certain months or
during Annual Training. Since unsatisfactory participation occurs based on a running
yearly count, do Soldiers track when they can miss drills without affecting their status?
This could be further examined by tracking data over a longer period than a year.
The third recommendation is to identify all Soldiers who have missed at least one
drill event in a yearly running count and track these Soldiers. There currently are nearly
12,000 Unsatisfactory Participants; while over 7,000 more have missed drill at least once.
Counting the data in this form would allow for the number of Soldiers watched to be
increased by approximately 75 percent. Recoding all Soldiers missing drills, regardless of
repetition, illuminates the larger problem of commanders routinely coping with holes in
their formations. This could address the current situation where a Soldier can monitor
his/her number of missed drills and choose not to attend if they will not become
categorized as an Unsatisfactory Participant.
A fourth recommendation would be to code for any missed drill, regardless of
reason, to further track by rank those who are absent from formations. This review could
help determine if there are a disproportionate number of different reasons accepted by
commanders vice unexcused absences for each rank. This coding should be readily
available to each commander, at all levels, to help track and manage patterns of
attendance at Battle Assemblies.

53
With the Army likely to become a smaller force, Unsatisfactory Participation
should diminish, though it may not disappear altogether. However, before Soldiers are
removed from the ranks all efforts to identify potential Unsatisfactory Participants and
appropriate intervention should be attempted to retain them and better educate them
concerning potential consequences. This thesis did not aim to blindly categorize all
Unsatisfactory Participants the same, as there are a multiple reasons why a Soldier fails to
attend training. Thus, a final recommendation is for continuing research of all TPU
Soldiers to better illuminate difficulties in attending drill, impressions about the unit and
satisfaction with service in the US Army Reserves. There must be an understanding of
why Soldiers miss drills so that USAR formations remain filled with quality, dedicated
and committed Soldiers.
1United States Army Reserve, “No Excuses! Bonuses at stake for Soldiers with
unexcused absences,” http://www.usar.army.mil/ (accessed October 14, 2011).

54
APPENDIX A
Excerpt from DA Form 3540

55
APPENDIX B
Termination of Incentive Payments

56

57
APPENDIX C
Demographic Codes
MPC MPC_code GRADE GRADE_ID MARITAL_STATUS MARITAL_STATUS_ID Enlisted 1 E1 11 ANNULLED 1 Officer 2 E2 12 DIVORCED 2
Warrant 3 E3 13 INTERLOCUTORY DECREE 3
E4 14 LEGALLY SEPARATED 4
PSNPS PSNPS_ID E5 15 MARRIED 5 Non 1 E6 16 SINGLE 6 Prior 2 E7 17 WIDOWED 7
E8 18 UNKNOWN 8
GENDER GENDER_ID E9 19 F 1 O1 21 RSC RSC_CODE M 2 O2 22 1st MSC 1
O3 23 7th MSC 2
O4 24 9th MSC 3
O5 25 63rd RSC 4
O6 26 65th RSC 5
O7 27 81st RSC 6
O8 28 88th RSC 7
W1 31 99th RSC 8
W2 32
W3 33 RACE_POP_GROUP RACE_POP_GROUP_ID
W4 34 C 1
W5 35 M 2
N 3 R 4 S 5 X 6 Z 7
Source: Created by author.
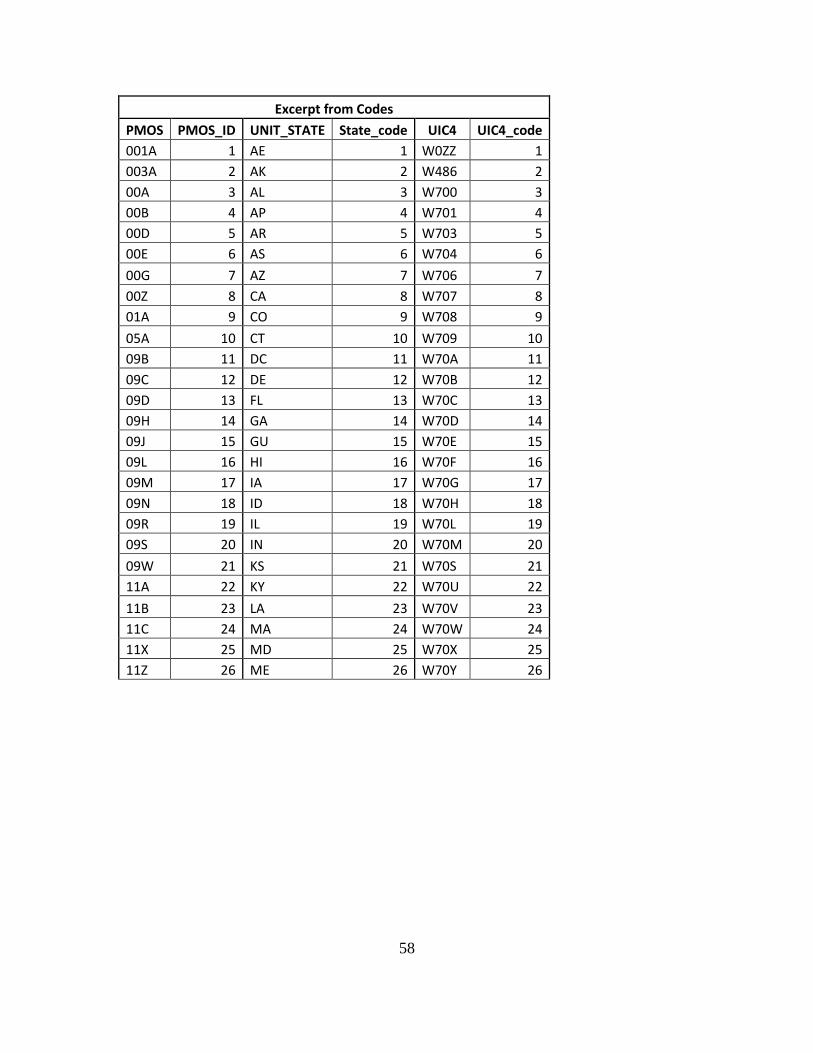
58
Excerpt from Codes PMOS PMOS_ID UNIT_STATE State_code UIC4 UIC4_code 001A 1 AE 1 W0ZZ 1 003A 2 AK 2 W486 2 00A 3 AL 3 W700 3 00B 4 AP 4 W701 4 00D 5 AR 5 W703 5 00E 6 AS 6 W704 6 00G 7 AZ 7 W706 7 00Z 8 CA 8 W707 8 01A 9 CO 9 W708 9 05A 10 CT 10 W709 10 09B 11 DC 11 W70A 11 09C 12 DE 12 W70B 12 09D 13 FL 13 W70C 13 09H 14 GA 14 W70D 14 09J 15 GU 15 W70E 15 09L 16 HI 16 W70F 16 09M 17 IA 17 W70G 17 09N 18 ID 18 W70H 18 09R 19 IL 19 W70L 19 09S 20 IN 20 W70M 20 09W 21 KS 21 W70S 21 11A 22 KY 22 W70U 22 11B 23 LA 23 W70V 23 11C 24 MA 24 W70W 24 11X 25 MD 25 W70X 25 11Z 26 ME 26 W70Y 26

59
BIBLIOGRAPHY
Army Reserve. Operational and Functional Commands. http://www.usar.army.mil/ (accessed October 14, 2011).
———. The Mission of the Army Reserve. http://www.usar.army.mil/ (accessed October 14, 2011).
———. Training Commands. http://www.usar.army.mil/ (accessed October 14, 2011).
———. U.S. Army Reserve Command. http://www.usar.army.mil/ (accessed October 14, 2011).
Barrios-Choplin, Bob, Aimee Kominiak, and George W Thomas. “Reasons for Unsatisfactory Participation in the Army Reserve: A Socialization Perspective.” Master’s Thesis, Naval Postgraduate School, Monterey, CA, 1999.
Brannic, Michael. Logistic Regression. http://luna.cas.usf.edu/~mbrannic/files/regression/ Logistic.html (accessed January 21, 2012).
Currie, James T, and Richard B Crossland. Twice the Citizen. Washington, DC: Government Printing Office, 1995.
Department of the Army. Army Regulation (AR) 140-145, Individual Mobilization Augmentee (IMA) Program. Washington, DC: Government Printing Office, 2007.
Devore, Jay L. Probability and Statistics for Engineering and the Sciences. Belmont, CA: Duxbury, 2008.
Department of Defense. DoDI 1215.13, Reserve Component (RC) Member Participation Policy. Washington, DC: Government Printing Office, 2009.
Griffith, James, Shelley Perry, and Terry White. “Retention of Junior Enlisted Soldiers in the All-Volunteer Army Reserve.” Armed Forces and Society (Fall 1991): 113.
Janowitz, Morris. The Citizen Soldier and National Service. November-December 1979. http://www.airpower.maxwell.af.mil (accessed September 9, 2011).
Kocher, Kathryn M, and George W Thomas. “Profile of Unsatisfactory Participant Losses from the USAR.” Master’s Thesis, Naval Postgraduate School, Monterey, CA, 1999.
Kominiak, Aimee L. “Determinants of Nonparticipation in the United States Army Reserve.” Master’s Thesis, Naval Postgraduate School, Monterey, CA, 1997.
60
Menard, Scott. Applied Logistic Regression Analysis. 2nd ed. Thousand Oaks, CA: Sage University, 2002.
Mirer, Thad. Economic Statistics and Econometrics. New York: Macmillian, 1983.
My Army Reserve. Army Reserve- celebrating 103 Years with Soldiers and Families. http://myarmyreserve.dodlive.mil/ (accessed October 14, 2011).

61
INITIAL DISTRIBUTION LIST
Combined Arms Research Library US Army Command and General Staff College 250 Gibbon Ave. Fort Leavenworth, KS 66027-2314 Defense Technical Information Center/OCA 825 John J. Kingman Rd., Suite 944 Fort Belvoir, VA 22060-6218 Dr. Bill McCollum DCL USACGSC 100 Stimson Avenue Fort Leavenworth, KS 66027-2301 Dr. David Bitters QAO USACGSC 100 Stimson Avenue Fort Leavenworth, KS 66027-2301 Mr. William Maxcy DTAC USACGSC 100 Stimson Avenue Fort Leavenworth, KS 66027-2301