Embed Size (px)
Citation preview
Analyzing Actors and Their Discussion Topics by Semantic Social NetworkAnalysis
Peter A. Gloor, Yan ZhaoMIT Center for Coordination Science & Center for Digital Strategies at Tuck at Dartmouth,
iQuest [email protected], [email protected]
AbstractiQuest is a novel software system to improve
understanding of organizational phenomena with greaterprecision, clarity, and granularity than has previouslybeen possible. It permits to gain new insights intoorganizational behavior, addressing issues such astracking information while respecting privacy,comparing different interaction channels, networkmembership, and correlating organizationalperformance and creativity. It extends automaticvisualization of social networks by miningcommunication archives such as e-mail and blogsthrough including analysis of the contents of thosearchives.
Keywords—semantic social network analysis, SNA,vector space information retrieval, temporal socialsurface, automatic communication analysis
1. Introduction
As we shift from an information-based society toone based on knowledge, it is critical that we have a kindof “grammar” that allows us to understand patterns ofcommunication and, more important, to visualize newpatterns. This paper introduces a novel integratedsoftware system allowing organizations to drill downinto communication processes by different criteria and tovisualize the communication flow and contents, makingit easy to understand and explain its communicationpatterns. The resulting communication “maps” provide abasis for further discussions about how to designorganizations and their spaces in an optimal manner.
iQuest’s goal is to visualize and analyzecommunication activity, content and unstructured text,and interactions in a practical and unobtrusive way whilestill respecting individual privacy.
2. Related Work
Recently visualization and analysis of socialnetworks has become an active topic of research. Thereare many tools, which take as input actors and thestrength of ties between actors to analyze and visualizeall sorts of social network analysis metrics [Was92,Borg92, Bat98]. For example, EmailNet [Van04] hasbeen used to gather data on knowledge-workerproductivity in executive search firms. TeCFlow, apredecessor of iQuest [Glo04] has been used to analyzebehavior of teenage cell phone users, managers of aglobal services firm, and project team members of twosoftware companies. Vizster [Hee05] has been used toidentify communication pockets and gaps in Enron data,by mining the enron e-mail archive and visualizing theirsocial network. Communications Garden [Zhu01] hasbeen used by the Arizona police department to predictlinks in criminal social networks, based on semanticanalysis of communication contents.
3. iQuest Overview
Much can be learned from static and dynamicvisualizations of the communication networks that showthe evolution over time [Glo03]. A vastly extendedversion of predecessor tool TeCFlow [Glo04], iQuesttakes as input any type of communication archives suchas e-mail, phone records, blogs, Weblinks, or chatsessions. An interactive movie shows the evolution ofsocial networks over time, displays active relationshipsin a sliding time window, and calculates and plots theevolution of group betweenness centrality and densityover time to discover interesting events in the lifetime ofa virtual team and different phases in the life cycle ofvirtual communities [Was94].
As its main graph layout algorithm iQuest uses theFruchterman-Rheingold spring-embedder layoutalgorithm [Fru91]. Actors are depicted as nodes, tiesbetween actors as connecting arcs. The stronger the
relationship between two nodes, the shorter is theirconnecting arc.
We use Freeman’s index for quantifying the overalllevel of betweenness in a set of actors BCgroup, whichsummarizes the actor normalized betweenness indices:
)1(
][1
''*
−
−=∑ =
N
BCBCBC
g
i igroup
where BC*’ is the largest realized normalized actorbetweenness index of the set of actors and N is thenumber of nodes in the network. DCgroup is thenormalized group degree centrality, where DC* is thelargest simple actor degree and N is the number of nodesin the network:
)]2)(1[(
][1 *
−−
−=∑ =
NN
DCDCDC
N
i igroup
Group density of a network is defined as theproportion of ties present in relation to all ties possible:
2/)1( −=
NNl
D
l is the number of present edges; N is the number ofnodes in the network.
For our dynamic visualization, we are using asliding time frame algorithm, where we are looking at atime interval consisting of a flexibly chosen number ofdays.
We also look at the frequency with whichindividuals send and receive messages. We have defineda measure, which we call the “contribution index”:
receivedmessagessentmessagesreceivedmessagessentmessages____
+−
The contribution index is +1, if somebody onlysends messages and does not receive any message. Thecontribution index is –1, if somebody only receivesmessages, and never sends any message. Thecontribution index is 0, if somebody has a totallybalanced communication behavior, sending andreceiving the same number of messages [Glo03]. Wethen plot the contribution index against the total numberof messages sent and received of each participant. Anexample of those views is shown in figure 1.
4. Analyzing Social Networks by Contents
In addition to the social network view, in iQuest thesame algorithms are also applied to textual contentanalysis. Free text documents are parsed, and a keywordindex is computed, based on term frequency inversedocument frequency tfidf, where the term frequency tf in
a document is defined as with ni being thefrequency of term i in a document, divided by thenumber of all terms in the document. This is calibratedwith the frequency of term i in the document collection,
where N is the number of all documents, and Di is thenumber of documents where term i occurs. tfidf is thencalculated for each term in each document according tothe classical formula [Sal89]:
tfidf = tf * log (N/ Di).
This means that the more documents two termsshare, the stronger is their link. The attraction betweentwo terms is based on the summation of all weights ofthe common terms.
The main advantage of iQuest is its capability tovisualize concept maps and social networks over time,based on a sliding time frame algorithm [Glo04], wherethe new documents or e-mail messages added on the nextday define what new actors and terms will appear in theconcept and social network view.
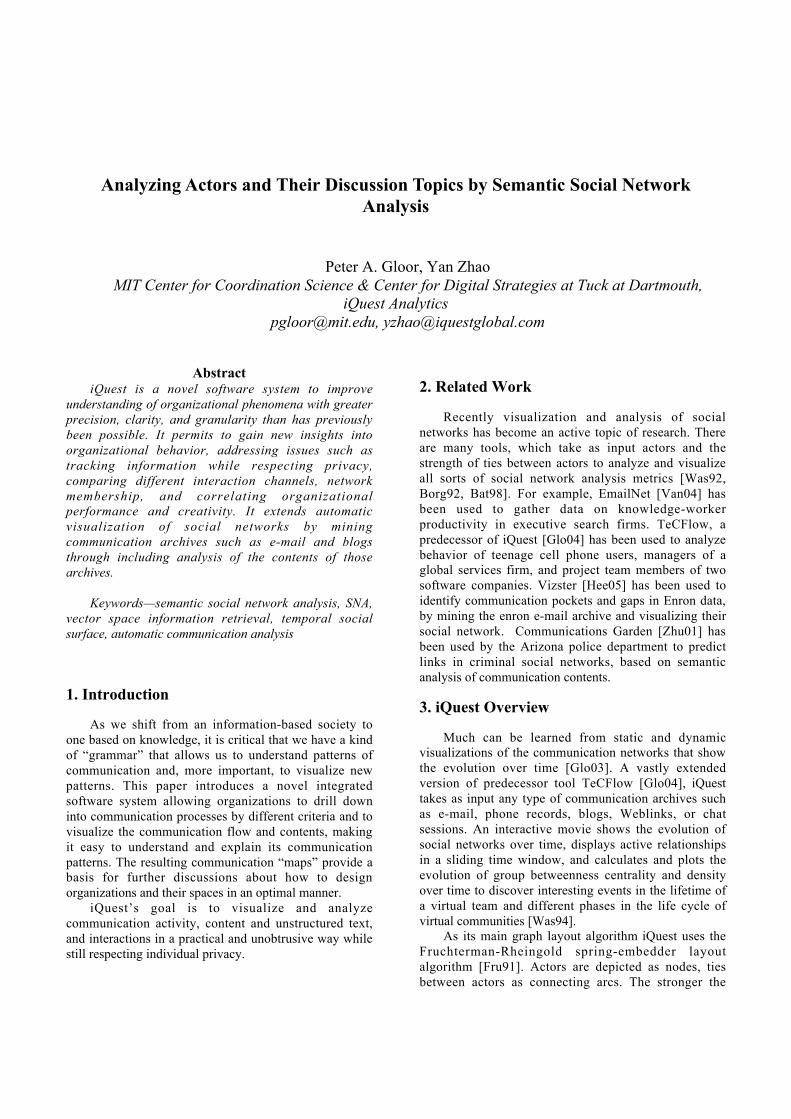
The right side of figure 1 illustrates those temporalelements. The contribution index view positions peoplebased on the number of messages they exchanged, andterms based on the number of new documents in whichthey appear. The centrality view plots a continuous curveof the changes in group betweenness and degreecentrality as well as graph density of both social networkview and concept view.
iQuest fully respects privacy of users. They alwayshave full control about how much information they wantto include into their analysis, e.g. excluding contents, e-mail headings, or anonymizing e-mail addresses. Ifdesired, they can analyze entire communities withoutincluding any individual actor information at all.
Concept maps (semanticnetworks) with the mostrelevant concepts at anygiven time
Social network with themost relevant actors in thecenter at any given time
Contribution indexview with the mostfrequently usedconcepts to the right
Centrality view with thechanges in group lifefrom most “hierarchical”to most “democratic”
Contribution index viewwith the most activecontributors to the topright
most relevant concept
Time slider
Most relevant actors
Figure 1 Different Views of iQuest
4.1 Searching Concept Networks by Similarity
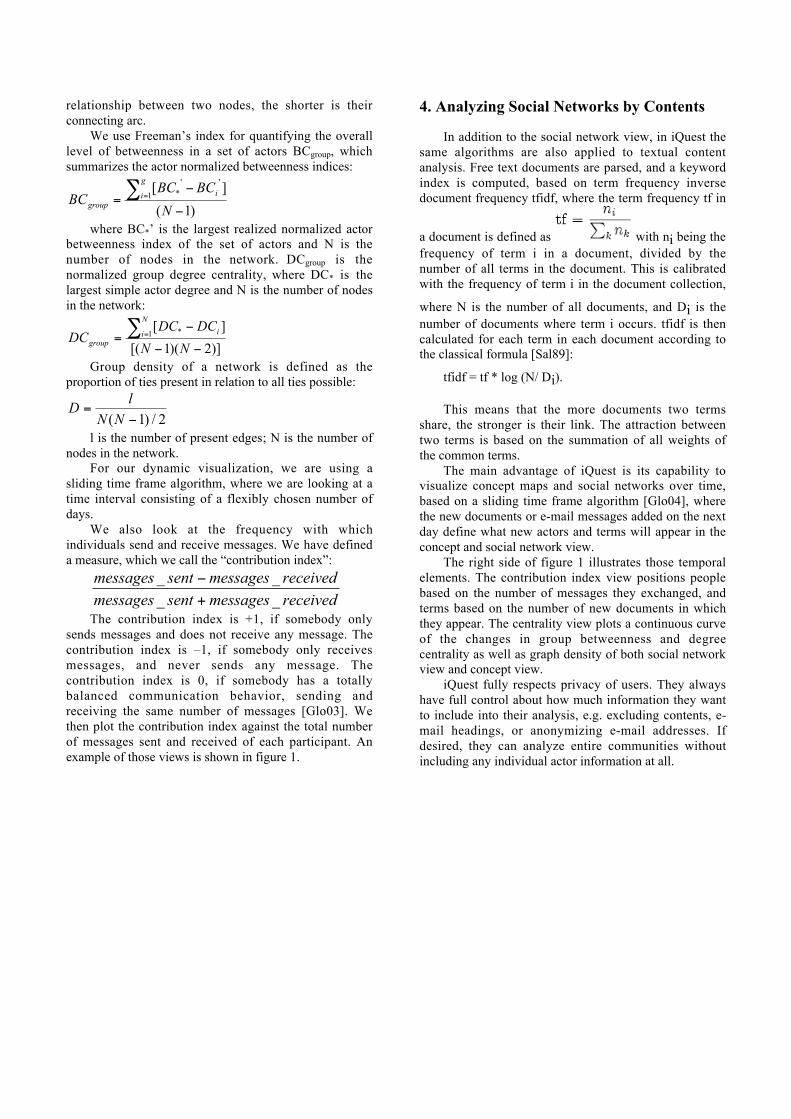
The concept view also permits to do similaritysearches. For example, doing a similarity search in abulletin board on loud speakers for term “wonderful”finds the terms having the strongest association withsearch string “wonderful” by traversing the conceptnetwork graph.
Figure 2. Similarity search for “wonderful’In figure 2, a similarity search for term “wonderful”
shows the terms “rear” and “emma” to be the mostsignificant in the concept map. This means that the terms“rear” and “emma” are the most significant in themessages also containing term “wonderful”. (Themessages are talking about how “wonderful “rear”surround speakers and the “emma” type speakers are).
4.2 Identifying Topics and Main Actors inCommunications
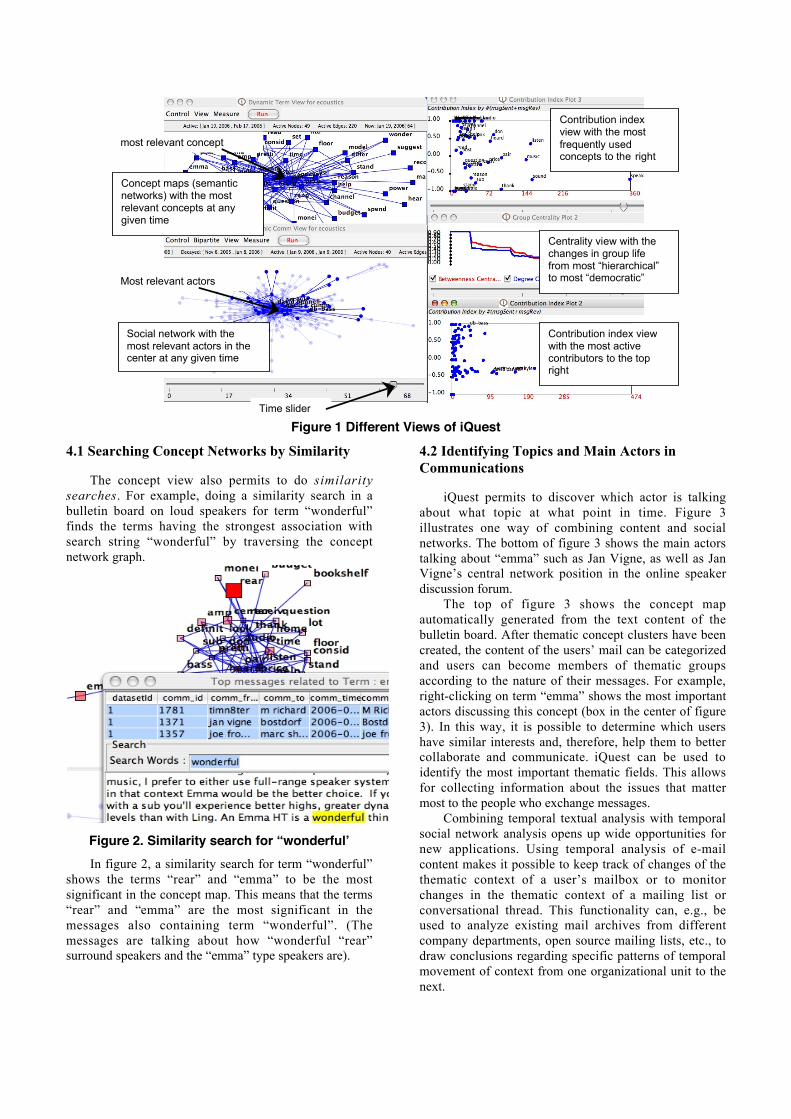
iQuest permits to discover which actor is talkingabout what topic at what point in time. Figure 3illustrates one way of combining content and socialnetworks. The bottom of figure 3 shows the main actorstalking about “emma” such as Jan Vigne, as well as JanVigne’s central network position in the online speakerdiscussion forum.
The top of figure 3 shows the concept mapautomatically generated from the text content of thebulletin board. After thematic concept clusters have beencreated, the content of the users’ mail can be categorizedand users can become members of thematic groupsaccording to the nature of their messages. For example,right-clicking on term “emma” shows the most importantactors discussing this concept (box in the center of figure3). In this way, it is possible to determine which usershave similar interests and, therefore, help them to bettercollaborate and communicate. iQuest can be used toidentify the most important thematic fields. This allowsfor collecting information about the issues that mattermost to the people who exchange messages.
Combining temporal textual analysis with temporalsocial network analysis opens up wide opportunities fornew applications. Using temporal analysis of e-mailcontent makes it possible to keep track of changes of thethematic context of a user’s mailbox or to monitorchanges in the thematic context of a mailing list orconversational thread. This functionality can, e.g., beused to analyze existing mail archives from differentcompany departments, open source mailing lists, etc., todraw conclusions regarding specific patterns of temporalmovement of context from one organizational unit to thenext.
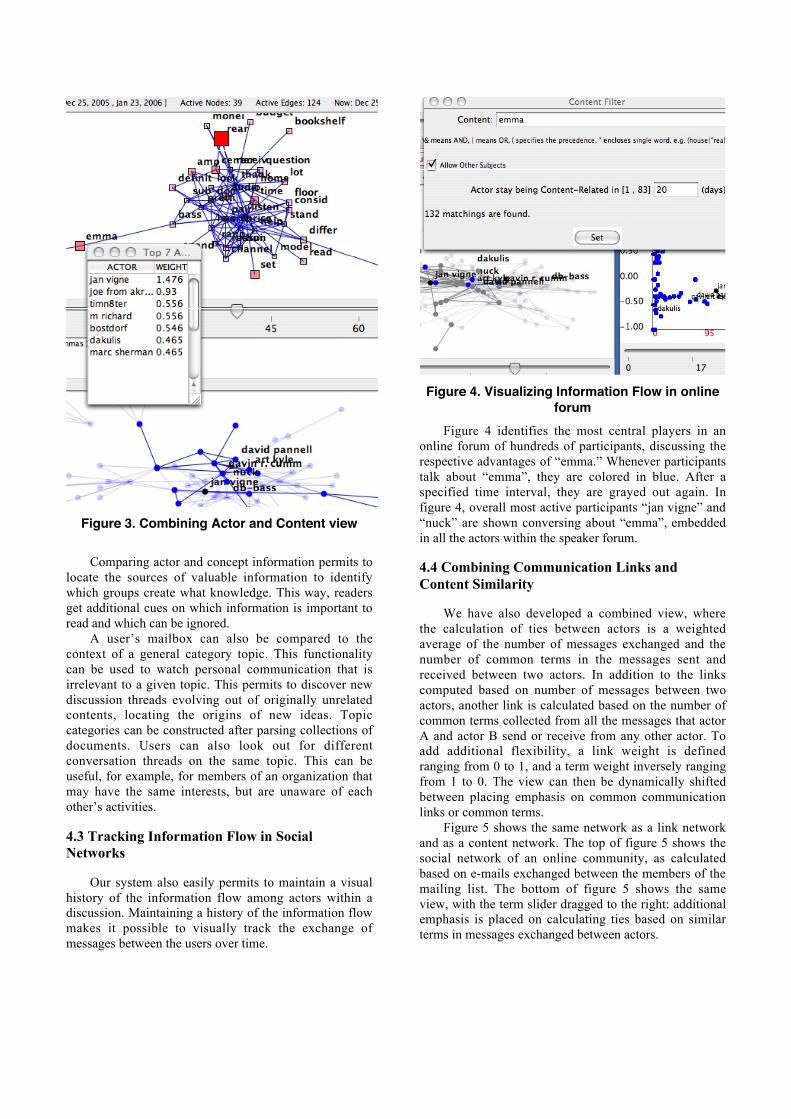
Figure 3. Combining Actor and Content view
Comparing actor and concept information permits tolocate the sources of valuable information to identifywhich groups create what knowledge. This way, readersget additional cues on which information is important toread and which can be ignored.
A user’s mailbox can also be compared to thecontext of a general category topic. This functionalitycan be used to watch personal communication that isirrelevant to a given topic. This permits to discover newdiscussion threads evolving out of originally unrelatedcontents, locating the origins of new ideas. Topiccategories can be constructed after parsing collections ofdocuments. Users can also look out for differentconversation threads on the same topic. This can beuseful, for example, for members of an organization thatmay have the same interests, but are unaware of eachother’s activities.
4.3 Tracking Information Flow in SocialNetworks
Our system also easily permits to maintain a visualhistory of the information flow among actors within adiscussion. Maintaining a history of the information flowmakes it possible to visually track the exchange ofmessages between the users over time.
Figure 4. Visualizing Information Flow in onlineforum
Figure 4 identifies the most central players in anonline forum of hundreds of participants, discussing therespective advantages of “emma.” Whenever participantstalk about “emma”, they are colored in blue. After aspecified time interval, they are grayed out again. Infigure 4, overall most active participants “jan vigne” and“nuck” are shown conversing about “emma”, embeddedin all the actors within the speaker forum.
4.4 Combining Communication Links andContent Similarity
We have also developed a combined view, wherethe calculation of ties between actors is a weightedaverage of the number of messages exchanged and thenumber of common terms in the messages sent andreceived between two actors. In addition to the linkscomputed based on number of messages between twoactors, another link is calculated based on the number ofcommon terms collected from all the messages that actorA and actor B send or receive from any other actor. Toadd additional flexibility, a link weight is definedranging from 0 to 1, and a term weight inversely rangingfrom 1 to 0. The view can then be dynamically shiftedbetween placing emphasis on common communicationlinks or common terms.
Figure 5 shows the same network as a link networkand as a content network. The top of figure 5 shows thesocial network of an online community, as calculatedbased on e-mails exchanged between the members of themailing list. The bottom of figure 5 shows the sameview, with the term slider dragged to the right: additionalemphasis is placed on calculating ties based on similarterms in messages exchanged between actors.
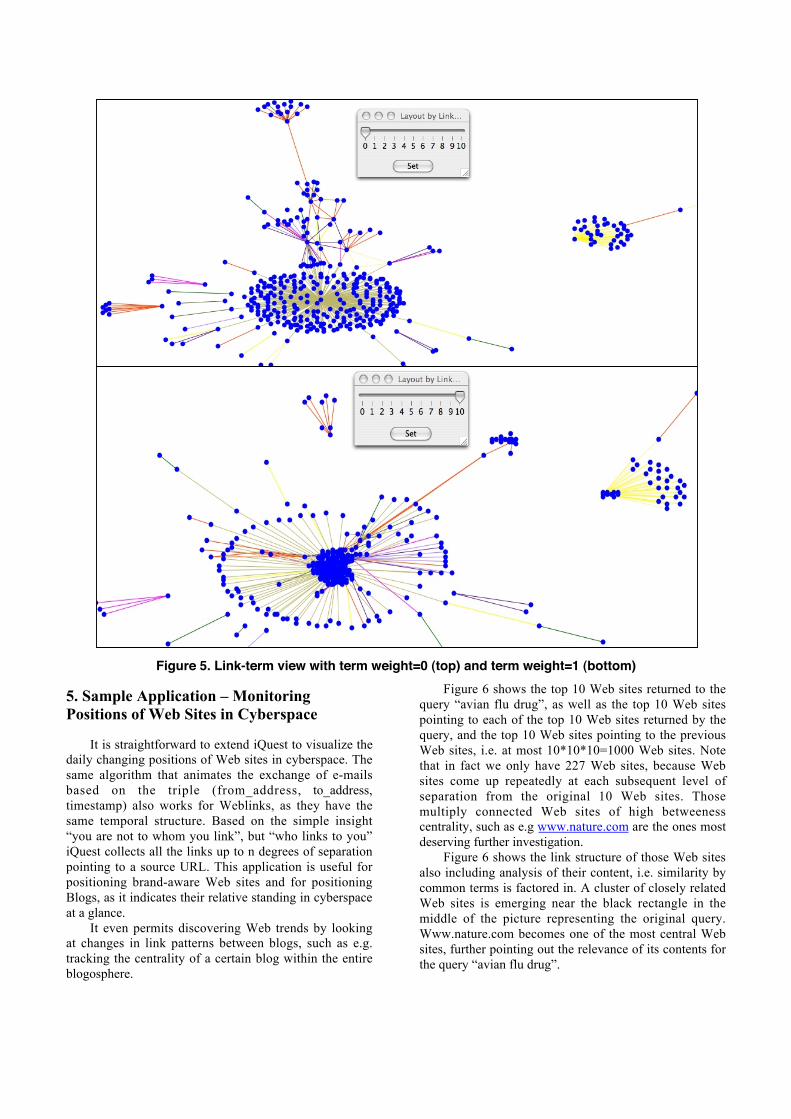
Figure 5. Link-term view with term weight=0 (top) and term weight=1 (bottom)
5. Sample Application – MonitoringPositions of Web Sites in Cyberspace
It is straightforward to extend iQuest to visualize thedaily changing positions of Web sites in cyberspace. Thesame algorithm that animates the exchange of e-mailsbased on the triple (from_address, to_address,timestamp) also works for Weblinks, as they have thesame temporal structure. Based on the simple insight“you are not to whom you link”, but “who links to you”iQuest collects all the links up to n degrees of separationpointing to a source URL. This application is useful forpositioning brand-aware Web sites and for positioningBlogs, as it indicates their relative standing in cyberspaceat a glance.
It even permits discovering Web trends by lookingat changes in link patterns between blogs, such as e.g.tracking the centrality of a certain blog within the entireblogosphere.
Figure 6 shows the top 10 Web sites returned to thequery “avian flu drug”, as well as the top 10 Web sitespointing to each of the top 10 Web sites returned by thequery, and the top 10 Web sites pointing to the previousWeb sites, i.e. at most 10*10*10=1000 Web sites. Notethat in fact we only have 227 Web sites, because Websites come up repeatedly at each subsequent level ofseparation from the original 10 Web sites. Thosemultiply connected Web sites of high betweenesscentrality, such as e.g www.nature.com are the ones mostdeserving further investigation.
Figure 6 shows the link structure of those Web sitesalso including analysis of their content, i.e. similarity bycommon terms is factored in. A cluster of closely relatedWeb sites is emerging near the black rectangle in themiddle of the picture representing the original query.Www.nature.com becomes one of the most central Websites, further pointing out the relevance of its contents forthe query “avian flu drug”.
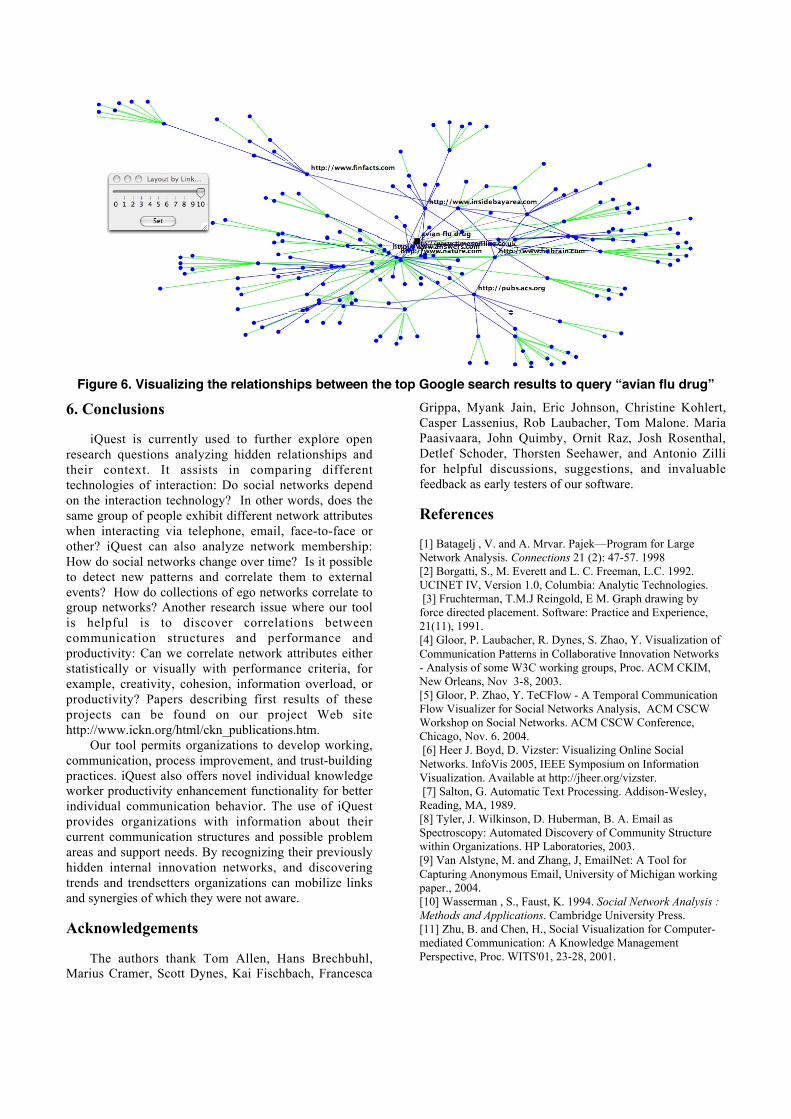
Figure 6. Visualizing the relationships between the top Google search results to query “avian flu drug”
6. Conclusions
iQuest is currently used to further explore openresearch questions analyzing hidden relationships andtheir context. It assists in comparing differenttechnologies of interaction: Do social networks dependon the interaction technology? In other words, does thesame group of people exhibit different network attributeswhen interacting via telephone, email, face-to-face orother? iQuest can also analyze network membership:How do social networks change over time? Is it possibleto detect new patterns and correlate them to externalevents? How do collections of ego networks correlate togroup networks? Another research issue where our toolis helpful is to discover correlations betweencommunication structures and performance andproductivity: Can we correlate network attributes eitherstatistically or visually with performance criteria, forexample, creativity, cohesion, information overload, orproductivity? Papers describing first results of theseprojects can be found on our project Web sitehttp://www.ickn.org/html/ckn_publications.htm.
Our tool permits organizations to develop working,communication, process improvement, and trust-buildingpractices. iQuest also offers novel individual knowledgeworker productivity enhancement functionality for betterindividual communication behavior. The use of iQuestprovides organizations with information about theircurrent communication structures and possible problemareas and support needs. By recognizing their previouslyhidden internal innovation networks, and discoveringtrends and trendsetters organizations can mobilize linksand synergies of which they were not aware.
Acknowledgements
The authors thank Tom Allen, Hans Brechbuhl,Marius Cramer, Scott Dynes, Kai Fischbach, Francesca
Grippa, Myank Jain, Eric Johnson, Christine Kohlert,Casper Lassenius, Rob Laubacher, Tom Malone. MariaPaasivaara, John Quimby, Ornit Raz, Josh Rosenthal,Detlef Schoder, Thorsten Seehawer, and Antonio Zillifor helpful discussions, suggestions, and invaluablefeedback as early testers of our software.
References
[1] Batagelj , V. and A. Mrvar. Pajek—Program for LargeNetwork Analysis. Connections 21 (2): 47-57. 1998[2] Borgatti, S., M. Everett and L. C. Freeman, L.C. 1992.UCINET IV, Version 1.0, Columbia: Analytic Technologies. [3] Fruchterman, T.M.J Reingold, E M. Graph drawing byforce directed placement. Software: Practice and Experience,21(11), 1991.[4] Gloor, P. Laubacher, R. Dynes, S. Zhao, Y. Visualization ofCommunication Patterns in Collaborative Innovation Networks- Analysis of some W3C working groups, Proc. ACM CKIM,New Orleans, Nov 3-8, 2003.[5] Gloor, P. Zhao, Y. TeCFlow - A Temporal CommunicationFlow Visualizer for Social Networks Analysis, ACM CSCWWorkshop on Social Networks. ACM CSCW Conference,Chicago, Nov. 6. 2004. [6] Heer J. Boyd, D. Vizster: Visualizing Online SocialNetworks. InfoVis 2005, IEEE Symposium on InformationVisualization. Available at http://jheer.org/vizster. [7] Salton, G. Automatic Text Processing. Addison-Wesley,Reading, MA, 1989.[8] Tyler, J. Wilkinson, D. Huberman, B. A. Email asSpectroscopy: Automated Discovery of Community Structurewithin Organizations. HP Laboratories, 2003.[9] Van Alstyne, M. and Zhang, J, EmailNet: A Tool forCapturing Anonymous Email, University of Michigan workingpaper., 2004.[10] Wasserman , S., Faust, K. 1994. Social Network Analysis :Methods and Applications. Cambridge University Press.[11] Zhu, B. and Chen, H., Social Visualization for Computer-mediated Communication: A Knowledge ManagementPerspective, Proc. WITS'01, 23-28, 2001.


![Analyzing a Large Corpus of Crowdsourced Plagiarism · q Based on TREC Web Track topics 2009–2011 q 150 topics, 297 essays q Target essay length: 5000 words 8[^] ©Michael Völske](https://img.pdfslide.us/doc/110x75/5f026ee67e708231d4043dea/analyzing-a-large-corpus-of-crowdsourced-plagiarism-q-based-on-trec-web-track-topics.jpg)