Embed Size (px)
Citation preview
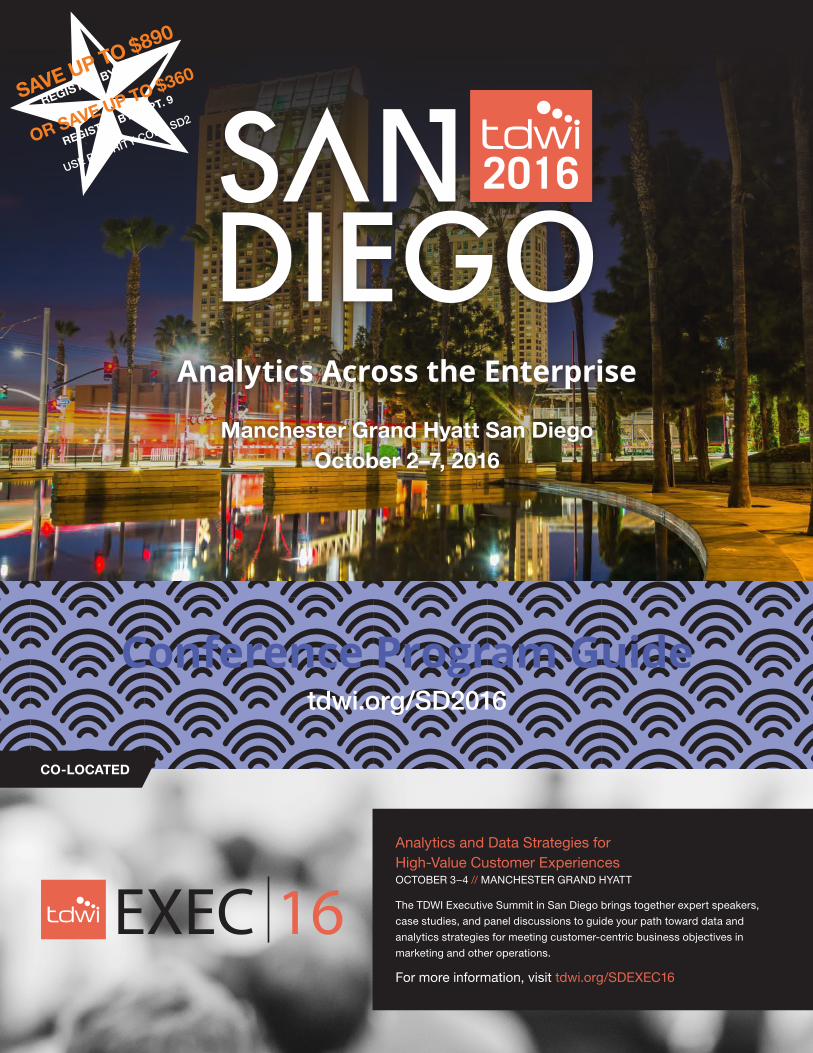
Analytics Across the Enterprise
Manchester Grand Hyatt San DiegoOctober 2–7, 2016
Analytics and Data Strategies for High-Value Customer ExperiencesOCTOBER 3–4 // MANCHESTER GRAND HYATT
The TDWI Executive Summit in San Diego brings together expert speakers,
case studies, and panel discussions to guide your path toward data and
analytics strategies for meeting customer-centric business objectives in
marketing and other operations.
For more information, visit tdwi.org/SDEXEC16
CO-LOCATED
SAVE UP TO $890
REGISTER BY AUG. 12
OR SAVE UP TO $360
REGISTER BY SEPT. 9
USE PRIORITY CODE SD2
tdwi.org/SD2016
Conference Program Guide

TDWI SAN DIEGO // OCTOBER 2–7, 2016
1 REGISTER at tdwi.org/SD2016 // QUESTIONS? 425.277.9181 or [email protected]
UNRIVALED BREADTH AND DEPTH OF BUSINESS INTELLIGENCE & ANALYTICS EDUCATION
From Experience to ActionFor more than 20 years, TDWI has been accelerating the transformation of data into intelligence, insight, and impact through in-depth, practical education. Our events provide a unique end-to-end learning experience designed to bring you from foundational concepts and best practices to hands-on skills that you can put to work immediately back in the office.
New Data Science Bootcamp October 3–4, 2016A TDWI Certificate TrackTDWI’s first-ever Data Science Bootcamp, presented at TDWI San Diego, will lay the groundwork for your journey to becoming a data scientist. This two-day intensive learning experience covers the most important aspects of a data scientist’s role. From sourcing and preparing data to analytics modeling, interpreting results, and delivering insights to the business, the bootcamp provides end-to-end coverage of what it takes to succeed as a data scientist.
Register for our full two-day intensive Bootcamp or pick-and-choose the courses you want to take.
TDWI Learning Tracks from A to Z
Communicate with Data—Use visualization and storytelling to convey the meaningful and impactful insights in your data, driving business decisions and validating direction.
Become a Data Scientist—Data science is one of the fastest-growing job markets; learn the skills you need and the steps to take to become a data scientist in this two-day intensive bootcamp.
Manage Data for Analytics—Set up your data management to support analytics using new storage tools, refined techniques, and proper governance.
Get Started with Analytics—TDWI Foundations provides you with the skills you need to get started with analytics.
Day 1 // Monday, October 3 Day 2 // Tuesday, October 4
Morning Session // 9:00am – 12:15pm DS1 - An Overview of Data Science
Morning Session // 8:00am – 11:15am DS3 - Modeling Your Data: Building and Assessing Models
Afternoon Session // 1:45pm – 5:00pm DS2 - Data Sourcing and Preparation for Data Science
Afternoon Session // 2:15pm – 5:30pm DS4 - Data Science in the Enterprise
Attendees who complete the full two-day bootcamp will receive a certificate of completion.
Experience Analytics in Action—Delve into the hottest trends in analytics, what they mean to analytics practitioners, and how they impact your business.
Drive Your Business with Analytics—Transform your organization into an analytics-driven business to gain competitive advantage and produce valuable insights.

TDWI SAN DIEGO // OCTOBER 2–7, 2016
2 REGISTER at tdwi.org/SD2016 // QUESTIONS? 425.277.9181 or [email protected]
Monday, October 3, 2016, 8:00 – 8:45 a.m.
Engineering in Exploration: Using Big Data to Find Genghis Khan
Albert Yu-Min Lin, Ph.D.Research Scientist / Explorer
The romantic Age of Exploration paints a picture of caravans filled with equipment, treks into the unknown, and an intrepid sense of curiosity. These things have not gone away, but what is new is the huge amount of data created by incredibly sophisticated sensors. Satellites, for example, collect several million square kilometers of ultra-high resolution earth imaging data each day.
The future of exploration lies in our ability to make sense of all this information and extract the insights that allow our curiosity to take us into the unknown with a greater sense of situational awareness. We will follow a multiyear National Geographic-funded expedition into the most remote region of Northern Mongolia to apply geophysics, satellite and aerial remote sensing, and crowdsourced data analytics to find Genghis Khan’s tomb within an avalanche of data.
Thursday, October 6, 8:00 – 8:45 a.m.
20% Blissful, 80% Ignorance: DataOps, Harsh Realities, and Unintentional Lies
Phil HarveyDataShaka
There is no escaping it—data is important. It’s not cool, it’s not fun—it’s mostly boring, horrible grunt work. At some point, though, all of us will need to work with data. Whether you are a full-fledged data scientist, an analyst, or the CEO of a small business trying to make sense of last month’s sales, getting to the point of understanding involves a lot of hard work. The majority of this work is called DataOps, and it is sadly undervalued, misunderstood, and the cause of a lot of stress. We will start this talk with an introduction to DataOps and then we will explore the
harsh realities and unintentional lies that get in the way. We will look past the tools and technologies themselves and explore the reasons data projects fail.
Keynote Presentations
What You Will Find at TDWI San DiegoEach TDWI track delivers an accelerated, multifaceted learning opportunity that’s all about creating immediate value back at the office. It moves from traditional to experiential learning so you are not just listening, you are collaborating and accomplishing.
FULL- AND HALF-DAY SESSIONSChoose from more than 50 full- and half-day courses covering business intelligence and analytics basics, data science, data visualization, data management for analytics, and much more.
IMMEDIATE IMPACTTraining you can use from day one. The focus is on practical education you can use immediately.
HANDS-ON LEARNINGGet hands-on experience with some of the hottest tools and technologies to hone your skills.
IN-DEPTH, VENDOR-NEUTRAL EDUCATIONNo sales pitch—Just state of the art highly applicable training that will apply to any vendor solution and any employer.
PEER NETWORKINGEach TDWI event offers a multitude of structured and unstructured peer networking opportunities so you can learn from others.
QUALITY, VETTED INSTRUCTORSTDWI faculty members possess both real-world experience and theoretical knowledge, and are trained to teach.
TDWI SAN DIEGO // OCTOBER 2–7, 2016
3 REGISTER at tdwi.org/SD2016 // QUESTIONS? 425.277.9181 or [email protected]
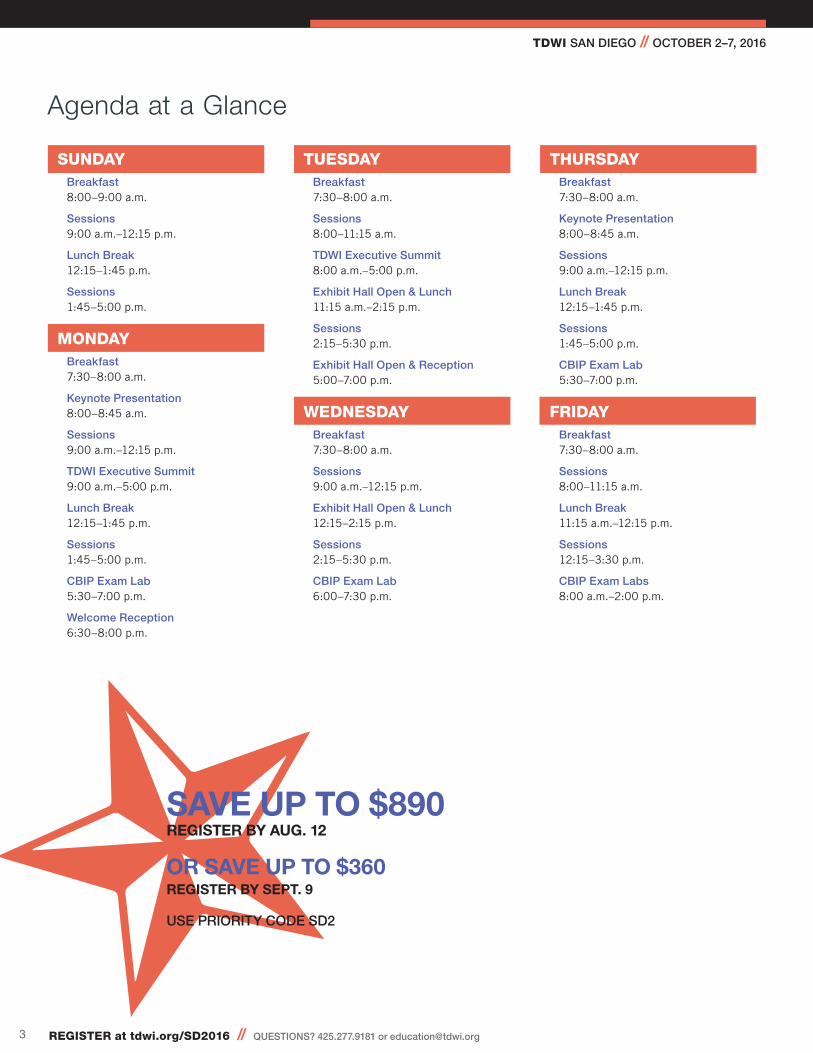
Agenda at a Glance
SUNDAY Breakfast 8:00–9:00 a.m.
Sessions 9:00 a.m.–12:15 p.m.
Lunch Break 12:15–1:45 p.m.
Sessions 1:45–5:00 p.m.
MONDAY Breakfast 7:30–8:00 a.m.
Keynote Presentation 8:00–8:45 a.m.
Sessions 9:00 a.m.–12:15 p.m.
TDWI Executive Summit 9:00 a.m.–5:00 p.m.
Lunch Break 12:15–1:45 p.m.
Sessions 1:45–5:00 p.m.
CBIP Exam Lab 5:30–7:00 p.m.
Welcome Reception 6:30–8:00 p.m.
TUESDAY Breakfast 7:30–8:00 a.m.
Sessions 8:00–11:15 a.m.
TDWI Executive Summit 8:00 a.m.–5:00 p.m.
Exhibit Hall Open & Lunch 11:15 a.m.–2:15 p.m.
Sessions 2:15–5:30 p.m.
Exhibit Hall Open & Reception 5:00–7:00 p.m.
WEDNESDAY Breakfast 7:30–8:00 a.m.
Sessions 9:00 a.m.–12:15 p.m.
Exhibit Hall Open & Lunch 12:15–2:15 p.m.
Sessions 2:15–5:30 p.m.
CBIP Exam Lab 6:00–7:30 p.m.
THURSDAY Breakfast 7:30–8:00 a.m.
Keynote Presentation 8:00–8:45 a.m.
Sessions 9:00 a.m.–12:15 p.m.
Lunch Break 12:15–1:45 p.m.
Sessions 1:45–5:00 p.m.
CBIP Exam Lab 5:30–7:00 p.m.
FRIDAY Breakfast 7:30–8:00 a.m.
Sessions 8:00–11:15 a.m.
Lunch Break 11:15 a.m.–12:15 p.m.
Sessions 12:15–3:30 p.m.
CBIP Exam Labs 8:00 a.m.–2:00 p.m.
SAVE UP TO $890 REGISTER BY AUG. 12
OR SAVE UP TO $360 REGISTER BY SEPT. 9
USE PRIORITY CODE SD2
TDWI SAN DIEGO // OCTOBER 2–7, 2016
4 REGISTER at tdwi.org/SD2016 // QUESTIONS? 425.277.9181 or [email protected]
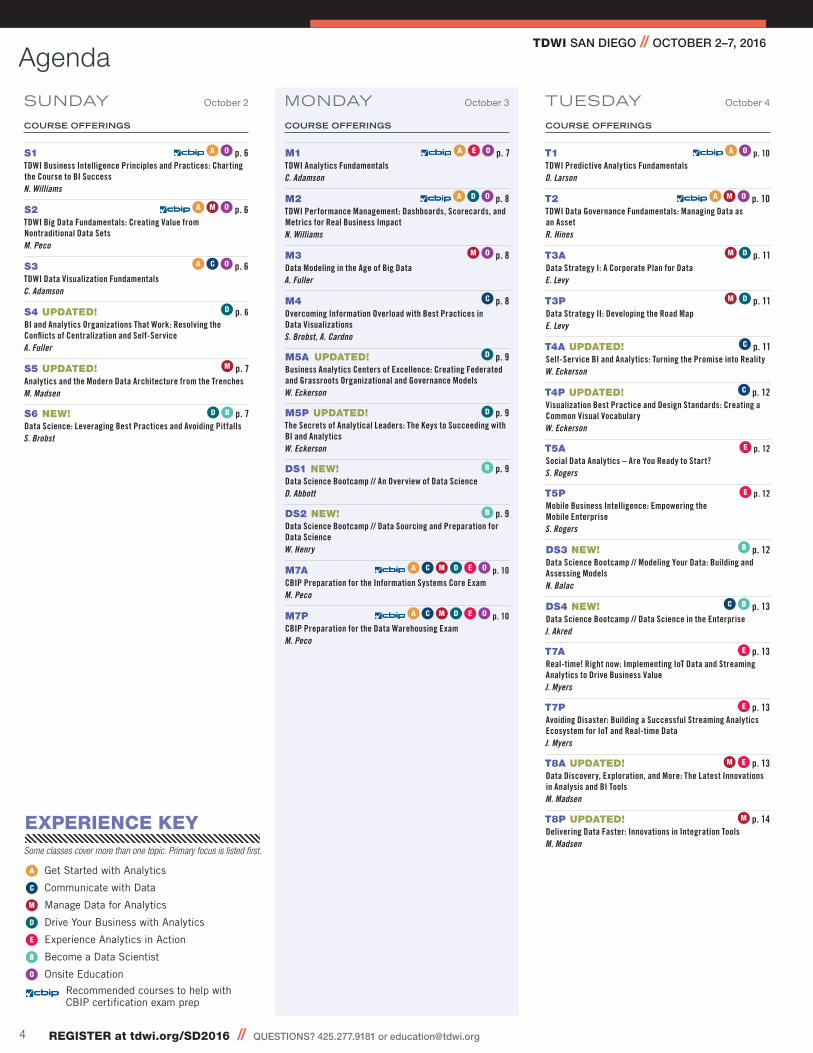
Agenda MONDAY October 3 TUESDAY October 4
COURSE OFFERINGS
S1 A O p. 6TDWI Business Intelligence Principles and Practices: Charting the Course to BI SuccessN. Williams
S2 A M O p. 6TDWI Big Data Fundamentals: Creating Value from Nontraditional Data SetsM. Peco
S3 A C O p. 6TDWI Data Visualization FundamentalsC. Adamson
S4 UPDATED! D p. 6BI and Analytics Organizations That Work: Resolving the Conflicts of Centralization and Self-ServiceA. Fuller
S5 UPDATED! M p. 7Analytics and the Modern Data Architecture from the TrenchesM. Madsen
S6 NEW! D B p. 7Data Science: Leveraging Best Practices and Avoiding PitfallsS. Brobst
COURSE OFFERINGS
M1 A E O p. 7TDWI Analytics FundamentalsC. Adamson
M2 A D O p. 8TDWI Performance Management: Dashboards, Scorecards, and Metrics for Real Business ImpactN. Williams
M3 M O p. 8Data Modeling in the Age of Big DataA. Fuller
M4 C p. 8Overcoming Information Overload with Best Practices in Data VisualizationsS. Brobst, A. Cardno
M5A UPDATED! D p. 9Business Analytics Centers of Excellence: Creating Federated and Grassroots Organizational and Governance ModelsW. Eckerson
M5P UPDATED! D p. 9The Secrets of Analytical Leaders: The Keys to Succeeding with BI and AnalyticsW. Eckerson
DS1 NEW! B p. 9Data Science Bootcamp // An Overview of Data ScienceD. Abbott
DS2 NEW! B p. 9Data Science Bootcamp // Data Sourcing and Preparation for Data ScienceW. Henry
M7A A C M D E O p. 10CBIP Preparation for the Information Systems Core ExamM. Peco
M7P A C M D E O p. 10CBIP Preparation for the Data Warehousing ExamM. Peco
COURSE OFFERINGS
T1 A O p. 10TDWI Predictive Analytics FundamentalsD. Larson
T2 A M O p. 10TDWI Data Governance Fundamentals: Managing Data as an AssetR. Hines
T3A M D p. 11Data Strategy I: A Corporate Plan for DataE. Levy
T3P M D p. 11Data Strategy II: Developing the Road MapE. Levy
T4A UPDATED! C p. 11Self-Service BI and Analytics: Turning the Promise into RealityW. Eckerson
T4P UPDATED! C p. 12Visualization Best Practice and Design Standards: Creating a Common Visual VocabularyW. Eckerson
T5A E p. 12Social Data Analytics – Are You Ready to Start?S. Rogers
T5P E p. 12Mobile Business Intelligence: Empowering the Mobile EnterpriseS. Rogers
DS3 NEW! B p. 12Data Science Bootcamp // Modeling Your Data: Building and Assessing ModelsN. Balac
DS4 NEW! C B p. 13Data Science Bootcamp // Data Science in the EnterpriseJ. Akred
T7A E p. 13Real-time! Right now: Implementing IoT Data and Streaming Analytics to Drive Business ValueJ. Myers
T7P E p. 13Avoiding Disaster: Building a Successful Streaming Analytics Ecosystem for IoT and Real-time DataJ. Myers
T8A UPDATED! M E p. 13Data Discovery, Exploration, and More: The Latest Innovations in Analysis and BI ToolsM. Madsen
T8P UPDATED! M p. 14Delivering Data Faster: Innovations in Integration ToolsM. Madsen
SUNDAY October 2
A Get Started with Analytics
C Communicate with Data
M Manage Data for Analytics
D Drive Your Business with Analytics
E Experience Analytics in Action
B Become a Data Scientist
O Onsite Education
Some classes cover more than one topic. Primary focus is listed first.
EXPERIENCE KEY
Recommended courses to help with CBIP certification exam prep
TDWI SAN DIEGO // OCTOBER 2–7, 2016
5 REGISTER at tdwi.org/SD2016 // QUESTIONS? 425.277.9181 or [email protected]
WEDNESDAY October 5 THURSDAY October 6
COURSE OFFERINGS
W1 A M O p. 14TDWI Data Integration Principles and Practices: Creating Information Unity from Data DisparityR. Hines
W2 D B O p. 14Serious Play for Predictive Analytics: What Works, What Doesn’t, and WhyK. McCormick
W3 C B O p. 14Hands-on Data Mining with RD. Larson
W4 M B O p. 15Understanding HadoopK. Krishnan
W5A NEW! M D p. 15Big Data MBA: Developing an Actionable Big Data Business StrategyB. Schmarzo
W5P D E p. 15Creating an Analytically Driven Enterprise: Implementing an Analytics ProgramC. Imhoff
W6A M p. 16The Logical Data Warehouse as Agile Data Foundation for Analytics and Data ScienceR. Lans
W6P M p. 16New Data Storage Technologies: From Hadoop to Graph Databases, and from NoSQL to NewSQLR. Lans
W7A NEW! C B p. 17Trend Spotting and Pattern Spotting: Seeing What Matters in Data VisualizationsD. Wells
W7P NEW! M p. 17Data Pipelines: Workflow and Dataflow for Today’s Data ArchitecturesD. Wells
FRIDAY October 7
COURSE OFFERINGS
TH1 A M O p. 18TDWI Data Governance Innovations: Adapting for Agile, Big Data, and CloudJ. Geiger
TH2 M E B O p. 18Data Preparation for Predictive AnalyticsK. McCormick
TH3 D p. 18Practical Techniques for Aligning Business and IT: Navigating Politics and CultureL. Silverston
TH4 M p. 19Data Management Tactics for AnalyticsE. Levy
TH5 E B p. 19Advanced Analytics: Gaining Insight Through ApplicationD. Larson
TH6 M B O p. 19Hands-on HadoopK. Krishnan
TH7 C B O p. 20Data Storytelling: The New Horizon in Business AnalyticsT. Cuzzillo, D. Wells
COURSE OFFERINGS
F1 A M O p. 20TDWI Data Quality Management: Techniques for Data Profiling, Assessment, and ImprovementJ. Geiger
F2 A D O p. 20TDWI BI Program Management: A Competency Center Approach to BI ExcellenceW. McKnight
F3 NEW! M B p. 21Curating and Cataloging Data: Building a Data Marketplace for AnalyticsD. Wells
F4A NEW! M p. 21Big Data Juggling Act: Creating a Big Data Capability with Big Business ImpactP. Boal
Agenda
A Get Started with Analytics
C Communicate with Data
M Manage Data for Analytics
D Drive Your Business with Analytics
E Experience Analytics in Action
B Become a Data Scientist
O Onsite Education
Some classes cover more than one topic. Primary focus is listed first.
EXPERIENCE KEY
Recommended courses to help with CBIP certification exam prep
TDWI SAN DIEGO // OCTOBER 2–7, 2016
6 REGISTER at tdwi.org/SD2016 // QUESTIONS? 425.277.9181 or [email protected]
Course Descriptions
S1 Sunday, October 02, 9:00 a.m.– 5:00 p.m.Get Started with Analytics, Onsite, CBIP
TDWI Business Intelligence Principles and Practices: Charting the Course to BI Success Nancy WilliamsThe BI life cycle spans a continuum that begins with large amounts of disparate data and stretches to encompass people, technology, information, analysis, and decision making. The benefits of BI are substantial: new business capabilities for insight, forecasting, planning, agility, and strategy execution.
Realizing benefits is challenging. With many moving parts—infrastructure, technology, data, integration, analytics, applications, metrics, reports, dashboards, scorecards—putting the pieces together in the most effective way is difficult. Learn the basics of BI from end to end, with special attention on two of the most important factors for BI success: planning and collaboration. You are most able to chart a course for BI success when teams and stakeholders share common concepts, use consistent terminology, and contribute collectively to the BI vision.
YOU WILL LEARN• Meaningful and actionable definitions of BI• Effective ways to deliver BI: Web, mobile, desktop, etc.• Common kinds of BI reporting: ad hoc, published, enterprise, operational• Performance management principles: dashboards, scorecards, KPIs• Business analyst principles: OLAP, analytic modeling, data visualization• Advanced analytics concepts for data mining, predictive analytics, and text
analytics• Data management practices: profiling, cleansing, quality management• Data integration practices: consolidation, virtualization, data warehousing
GEARED TOAnyone with a role in BI/DW programs who needs to understand the concepts and the full life cycle of BI; BI/DW managers and leaders seeking to increase the value and business impact of a BI program; business and technical people who need to work together to implement BI; teams that need to develop a common base of concepts and terminology for BI
S2 Sunday, October 02, 9:00 a.m.– 5:00 p.m.Get Started with Analytics, Manage Data for Analytics, Onsite, CBIP
TDWI Big Data Fundamentals: Creating Value from Nontraditional Data Sets Mark PecoBig data is a hot topic in BI and analytics. Yet it is a complex topic that is still in the early stages of evolution. Successful big data projects that deliver real business value are challenged by multiple definitions and rapidly shifting technologies. Achieving good return on your big data investment requires strategy that focuses on purpose, people, and process before exploring data and technologies. Strategy drives planning and architecture to ensure that big data complements and does not disrupt the existing BI and analytics environment. To prepare for success with big data, start by understanding all of the pieces and how they fit together.
YOU WILL LEARN• Common definitions of big data and the implications of each• Key characteristics of big data and why size is not among the top five• The structures that can be found in “unstructured” data• Types of big data sources—streaming data, social data, sensor data, etc.• Value opportunities and common applications for big data• Considerations when adapting architectures, organizations, and cultures to
incorporate big data• The scope of big data processes, tools, and technologies
GEARED TO Business and data analysts; BI and analytics program and project managers; BI and data warehouse architects, designers, and developers; data governance and data quality professionals getting started with big data; anyone seeking to cut through the hype to understand the opportunities, challenges, and realities of the big data phenomenon
S3 Sunday, October 02, 9:00 a.m.– 5:00 p.m.Get Started with Analytics, Communicate with Data, Onsite
TDWI Data Visualization Fundamentals Chris AdamsonData visualization has rapidly become a critical part of business analytics and business communications. Without visualization, the numbers and statistics of analytics are difficult to interpret and incomprehensible to many who need to turn data into knowledge. The advent of big data, with increasing volume and velocity of data, emphasizes visualization as a technique to compress large volumes of data into digestible presentations and observe streaming data in motion.
Elegant and well-designed data visuals often appear to be easy because skilled visual developers are able to hide the complexities and hard work behind the scenes. Business intelligence and business analytics professionals need to communicate as effectively in visual forms as they do with their verbal and written communications skills. Get started by learning the fundamentals of data visualization.
YOU WILL LEARN• Visualization as a communication medium• Preparing data for visualization• Components of visualization• Choosing and using charts and graphs• Visual exploration and analysis• Visual design techniques• Extending visualization with infographics• Visual storytelling• Data visualization tools
GEARED TOBusiness analysts and data analysts; data scientists and analytics modelers; business analytics leaders and managers; BI leaders and managers; anyone who develops charts and graphs to communicate about data
S4 UPDATED! Sunday, October 02, 9:00 a.m.– 5:00 p.m.Drive Your Business with Analytics
BI and Analytics Organizations That Work: Resolving the Conflicts of Centralization and Self-Service Aaron FullerDo your BI and analytics stakeholders experience territorial disputes? Do you work in the business and wonder why IT controls seem like roadblocks to data access and barriers to business analysis? Do you work in IT and have concerns about ungoverned data, non-repeatable processes, and untraceable reporting? What about the vendors who bypass IT and sell their products directly into lines of business—is that a good thing or a bad thing? Questions of this kind challenge virtually every modern BI and analytics organization. There is no one-size-fits-all right answer. But there is a best answer for you and your organization—or maybe even a few great options. We’ll explore the variables that help to determine the right mix of central services, shared services, and self-service to achieve the best fit for your organization’s culture, needs, and data management practices.
TDWI SAN DIEGO // OCTOBER 2–7, 2016
7 REGISTER at tdwi.org/SD2016 // QUESTIONS? 425.277.9181 or [email protected]
YOU WILL LEARN• Definitions of key terms that are commonly used in discussions of BI and
analytics organizational structure• Common challenges for BI/analytics organizations and approaches for
overcoming them• Goals related to having the right team structure and strategies for
achieving them• Alternatives for BI/analytics organization structures and their advantages and
disadvantages• Key capabilities for making your BI/analytics organization successful—data
governance, metadata management, coordinated staff, shared tools and vendors, and enterprise architecture
GEARED TO• Leaders that want to optimize the performance of their teams by better
understanding the organizational challenges commonly experienced in analytics and BI and their alternatives for addressing those challenges
• BI and analytics managers, directors and executives that are considering undergoing reorganizations of their teams
• Architects and other staff that advise leaders on how to organize their teams to achieve the best results
S5 UPDATED! Sunday, October 02, 9:00 a.m.– 5:00 p.m.Manage Data for Analytics
Analytics and the Modern Data Architecture from the Trenches Mark Madsen, Stephen DineOrganizations are seeking new ways to increase the value they derive from data. Many have already mastered standard reporting, OLAP analysis, and dashboards. Business users and business intelligence consumers want more BI capabilities—typically moving into the world of big data and advanced analytics. With this trend come the challenges of uncertain and volatile requirements, managing continuously expanding data volumes, and demand for faster delivery cycles. Advances in hardware and software are reinventing BI and data management, giving us the ability to step up to these challenges.
This course is designed to help you understand the new world of BI and how to deploy changing technologies to meet these new requirements. Come prepared to challenge your organization’s beliefs about best practices for data delivery, design, and management. We’ll seek opportunities to modernize and advance your BI program in these areas:
• Getting more value from existing data• Managing exceptional and accelerating data growth• Achieving faster development cycles without compromising capabilities• Architecting for mixed workloads
YOU WILL LEARN• New technologies and emerging organizational practices to address new
challenges and requirements• Aspects of new analytics databases and how they can be deployed• Advanced analytics tools and techniques and how to support them• Options to address growth, lower latency requirements, and performance
problems• Alternatives for managing changing requirements, including data virtualization,
NoSQL, and the cloud
GEARED TOBI leaders, architects, and developers who want to discover and understand options to improve the responsiveness of their BI group and deliver new analytics capabilities
S6 NEW! Sunday, October 02, 9:00 a.m.– 5:00 p.m.Drive Your Business with Analytics, Become a Data Scientist
Data Science: Leveraging Best Practices and Avoiding Pitfalls Stephen BrobstData science is the key to business success in the information economy. This workshop will teach you about best practices in deploying a data science capability for your organization. Technology is the easy part—the hard part is creating the right organizational and delivery framework in which data science can succeed.
We will discuss the necessary skill sets for successful data scientists and the environment that will allow them to thrive. We will draw a strong distinction between data R&D and data product capabilities within an enterprise and speak to the different skill sets, governance, and technologies needed across these areas. We will also explore the use of open data sets and open source software tools to enable best results from data science in large organizations, as well as the many pitfalls and how to avoid them.
YOU WILL LEARN• How to innovate using data science in the age of big data• The most common mistakes made with big data analytics• How to deploy a data lake and data product capabilities within your organization
MK Monday, October 03, 8:00 a.m.– 8:45 a.m. Keynote
Keynote // Engineering in Exploration: Using Big Data to Find Genghis Khan Albert Yu-Min Lin, Ph.D.The romantic Age of Exploration paints a picture of caravans filled with equipment, treks into the unknown, and an intrepid sense of curiosity. These things have not gone away, but what is new is the huge amount of data created by incredibly sophisticated sensors. Satellites, for example, collect several million square kilometers of ultra-high resolution earth imaging data each day.
The future of exploration lies in our ability to make sense of all this information and extract the insights that allow our curiosity to take us into the unknown with a greater sense of situational awareness. We will follow a multiyear National Geographic-funded expedition into the most remote region of Northern Mongolia to apply geophysics, satellite and aerial remote sensing, and crowdsourced data analytics to find Genghis Khan’s tomb within an avalanche of data.
M1 Monday, October 03, 9:00 a.m.– 5:00 p.m.Get Started with Analytics, Experience Analytics in Action, Onsite, CBIP
TDWI Analytics Fundamentals Chris AdamsonAnalytics is a hot topic, but also a complex topic. This continuously growing field now includes descriptive, diagnostic, predictive, and prescriptive analytics. Applied analytics including optimization, simulation, and automation expand the scope. Data growth also fuels the complexity—unstructured data, big data, social data, data streams, and more. Advanced analytics continues to expand with complex event processing, machine learning, cognitive computing, etc.
In the growing and evolving world of analytics we’re also experiencing a shift of roles and responsibilities. The “data things” that were once seen as IT responsibilities have become critical business skills. Analytics spans a continuum that encompasses IT departments, data scientists, data analysts, business analysts, business managers, and business leadership. It seems that everyone has a stake in analytics.
TDWI SAN DIEGO // OCTOBER 2–7, 2016
8 REGISTER at tdwi.org/SD2016 // QUESTIONS? 425.277.9181 or [email protected]
Coordination, cross-functional analysis, data sharing, and governance all become important skills.
YOU WILL LEARN • The concepts and practices of analytics modeling• An analytics topology to make sense of the variety of analytics types and
techniques• The data side of analytics including data sourcing, data discovery, data
cleansing, and data preparation• Analytics techniques for exploration, experimentation, and discovery • The human side of analytics: communication, conversation, and collaboration• The organizational side of analytics: self-service, central services,
governance, etc.• A bit about emerging techniques and technologies shaping the future
of analytics
GEARED TO• Business leaders and managers seeking to understand business dynamics
through analytics• IT leaders and managers who deliver and support analytics initiatives• BI and analytics architects guiding the design, development, and deployment
of analytics• BI and analytics designers and developers• Business analysts, data analysts, data scientists and those who aspire to
these roles
M2 Monday, October 03, 9:00 a.m.– 5:00 p.m.Get Started with Analytics, Drive Your Business with Analytics, Onsite, CBIP
TDWI Performance Management: Dashboards, Scorecards, and Metrics for Real Business Impact Nancy WilliamsPerformance management is a core practice in business management today, and it ranks high among the value opportunities of business intelligence. Using data to set goals and measure performance is a proven key to business success. Performance management strengthens the connection of tactics with strategy, and of operations with tactics—enabling feedback, monitoring, and accountability across all levels of business activity.
Dashboards and scorecards are the most effective ways to deliver business intelligence that drives performance management. A top-quality dashboard or scorecard looks deceptively simple, but creating simple and effective interfaces is surprisingly difficult. A powerful dashboard or scorecard involves the right indicators and metrics, the right visual elements, attention to relationships among visual elements, and the right kinds of click-through and user interaction. Further complexity arises when you work with groups of related scorecards and dashboards that must fit together to form an integrated performance management system.
YOU WILL LEARN• Techniques to identify high-impact performance indicators and
business metrics• How measurement and feedback are applied to increase business effectiveness
and improve business efficiency• How to define and design performance management architecture• How to foster a performance management culture• When to use scorecards and when to use dashboards• Design techniques for dashboards and scorecards• How to integrate dashboards and scorecards including cascading and drill-in• How to choose the right indicators, metrics, and visual elements for dashboards
and scorecards• Data management techniques for scorecards and dashboards
GEARED TOBI program and project managers; BI and performance management architects, designers, and developers; business executives and managers seeking performance improvements; dashboard and scorecard designers and developers; anyone with a role in defining, creating, or applying business metrics
M3 Monday, October 03, 9:00 a.m.– 5:00 p.m.Manage Data for Analytics, Onsite
Data Modeling in the Age of Big Data Aaron FullerThe big data phenomenon expands the purpose and changes the role of data modeling. The level of uncertainty about data modeling in today’s data ecosystems is high. Most practitioners have more questions than answers. Has data modeling become obsolete? Does unstructured data make modeling impractical? Does NoSQL imply no data modeling? What are the implications of schema-on-read versus schema-on-write for data modelers? Do entity-relationship and star-schema data models still matter?
Data modeling is still an important process—perhaps more important than ever before. But data modeling purpose and processes must change to keep pace with the rapidly evolving world of data. This course examines the principles, practices, and techniques that are needed for effective modeling in the age of big data.
YOU WILL LEARN• To distinguish between data store modeling (schema on write) and data access
modeling (schema on read) and when each is useful• The elemental characteristics of data that provide a common denominator for
data modeling for all types of data• How the common denominator is used to map various kinds of databases
including relational, dimensional, NoSQL, NewSQL, graph, and document• When traditional logical-to-physical modeling works and when it makes sense
to reverse the process as physical-to-logical• Trade-offs between methodological rigor and discovery-driven exploration in
data modeling
GEARED TOData architects; data modelers; database developers; data integrators; data analysts; report developers; anyone else challenged with the need to make structured enterprise data and non-traditional data sources work together
M4 Monday, October 03, 9:00 a.m.– 5:00 p.m.Communicate with Data
Overcoming Information Overload with Best Practices in Data Visualizations Stephen Brobst, Andrew CardnoIt is well known that human understanding is much more effective with pictures than with rows and columns of numbers. However, much of the output from business intelligence environments remains trapped in traditional reporting formats. In this workshop, we explore best practices in deriving insight from vast amounts of data using visualization techniques. Examples from traditional data as well as an in-depth look at the underlying technologies for visualization in support of geospatial analytics will be undertaken. We will examine visualization for both strategic and operational BI. A key theme is exposing actionable decisions through use of visualization techniques. Examples from a variety of industries will be employed.
TDWI SAN DIEGO // OCTOBER 2–7, 2016
9 REGISTER at tdwi.org/SD2016 // QUESTIONS? 425.277.9181 or [email protected]
YOU WILL LEARN• How to overcome information overload with visualization• Best and worst practices in deploying visualization tools• Next-generation visualization tools using mash-ups, geospatial data, and
animation
GEARED TOBusiness and IT leaders; managers; analysts; end users; BI application developers
M5A UPDATED! Monday, October 03, 9:00 a.m.– 12:15 p.m.Drive Your Business with Analytics
Business Analytics Centers of Excellence: Creating Federated and Grassroots Organizational and Governance Models Wayne EckersonThe key to business analytics success is having the right people in the right roles reporting to the right managers, and supporting those managers with strong sponsorship and governance oversight. This applies not only to corporate BI and data warehousing teams, but also to the extended BI organization of business analysts, data scientists, project managers, and divisional CIOs and IT teams. Yet in most companies, the organizational architecture supporting business analytics is far less than ideal.
This session will discuss how to build a center of excellence for business analytics that enables you to optimize data for decision making. It will discuss how to create a federated BI team, blend corporate and divisional resources, create matrixed reporting environments, and implement appropriate governance and oversight. It will also show how the shift to big data is changing traditional BI roles.
YOU WILL LEARN• How to create a center of excellence for BI and Analytics• How to create a federated BI organization• Ways to blend corporate and divisional resources• Methods for creating matrixed reporting structures• Processes to implement a BI council that provides governance and oversight
GEARED TOCxOs who want to create data-driven organizations with a strong analytical culture; business unit heads and data analysts who want to drive insights and create more business-savvy IT people; CIOs and VPs of IT who want to design business-centric data and analytical architectures and form robust BI or analytical centers of excellence; directors of BI, advanced analytics, and data warehousing who want to align more closely with business unit leaders; data architects, requirements analysts, and BI/ETL tool developers who want to maximize their effectiveness and improve their career opportunities.
M5P UPDATED! Monday, October 03, 1:45 p.m.– 5:00 p.m.Drive Your Business with Analytics
The Secrets of Analytical Leaders: The Keys to Succeeding with BI and Analytics Wayne EckersonHow do you bridge the worlds of business and technology? How do you harness big data for business gain? How do you deliver value from analytical initiatives? Based on Wayne’s book, Secrets of Analytical Leaders: Insights from Information Insiders, this session will unveil the success secrets of top information leaders from companies such as Zynga, Netflix, US Xpress, Nokia, Capital One, Kelley Blue Book, and Blue KC, among others. The session will cover both the “soft stuff” of people, processes, and
projects and the “hard stuff” of architecture, tools, and data required to create and sustain a successful analytics program.
YOU WILL LEARN• How to deliver value quickly• How to span business and technology• How to manage change• How to translate insights into business impact• How to create an agile data warehouse
GEARED TOCxOs who want to create data-driven organizations with a strong analytical culture; business unit heads and data analysts who want better data and tools to drive insights and more business-savvy IT people; CIOs and VPs of IT who want to design business-centric data and analytical architectures and form robust BI or analytical centers of excellence; directors of BI, advanced analytics, and data warehousing who want to align more closely with business unit leaders, managers, and analysts; data architects, requirements analysts, and BI/ETL tools developers who want to maximize their effectiveness and improve their career opportunities
DS1 NEW! Monday, October 03, 9:00 a.m.– 12:15 p.m.Become a Data Scientist
Data Science Bootcamp // An Overview of Data Science Dean AbbottData science has been called “the sexiest job of the 21st century” and with good reason—the size and breadth of our data is growing exponentially, making our ability to understand that data more and more challenging. This session defines data science, describes how it is similar and different from related analytics disciplines, and the key concepts every data scientist needs to know.
In this overview, data science will be described in a project-oriented framework. Each project must define objectives, collect and integrate data, prepare it for analysis, perform the analysis, and deploy the results. Whether the end-goal of the project is reporting, visualization, descriptive modeling, or predictive modeling, the same principles apply. For each stage, key principles will be described and real-world examples will illustrate the meaning of these principles.
DS2 NEW! Monday, October 03, 1:45 p.m.– 5:00 p.m.Become a Data Scientist
Data Sourcing and Preparation for Data Science William HenryYou may have heard that data scientists spend 80 percent of their time sourcing, cleaning, and preparing data. While this may be an exaggeration (or not!)—data preparation is certainly a large and important part of data science and predictive analytics. The reason for this is that data often does not start out in the ideal format; it may contain bad values, it may not be easily accessible, or it may need to be transformed before we can really start exploring the data and building models. In this session, we will provide an overview of sourcing and preparing data for data science and predictive analytics projects. We will use a motivating example from the speaker’s work and also touch on how Python, SQL, and Hadoop can be used in the data preparation workflow.
TDWI SAN DIEGO // OCTOBER 2–7, 2016
10 REGISTER at tdwi.org/SD2016 // QUESTIONS? 425.277.9181 or [email protected]
GEARED TO Anyone who is getting started in data science and is interested in learning more about data preparation. This includes BI and analytics professionals and managers that are exploring the broader world of data science. Nontechnical professionals are welcome as well. Intermediate to advanced professional data scientists will find this session to be a review for them.
M7A Monday, October 03, 9:00 a.m.– 12:15 p.m.Get Started with Analytics, Drive Your Business with Analytics, Communicate with
Data, Experience Analytics in Action, Manage Data for Analytics, Onsite, CBIP
CBIP Preparation for the Information Systems Core Exam This course assumes a working knowledge of information systems.
Mark PecoThis course is designed for those who already have knowledge and experience in the field of information systems but would benefit from an interactive and informative review prior to testing. You’ll get ready to test through discussion, review of concepts and terminology, and sample exam questions. A CBIP-certified instructor who has experienced the examination process and can share tips and techniques to improve your performance on the exam will lead this class.
YOU WILL LEARN• Concepts and terms used in the exam: technology and business, application
system, data management, and systems development• What constitutes the complete body of knowledge for the exam• How to assess your knowledge and skill related to the body of knowledge• What to expect during the examination process• Techniques to improve your performance when taking the exam
GEARED TOEveryone seeking CBIP certification (the information systems core exam is required for all CBIP specialties)
Enrollment is limited to 60 attendees.
M7P Monday, October 03, 1:45 p.m.– 5:00 p.m.Get Started with Analytics, Drive Your Business with Analytics, Communicate with
Data, Experience Analytics in Action, Manage Data for Analytics, Onsite, CBIP
CBIP Preparation for the Data Warehousing Exam This course assumes a working knowledge of data warehousing.
Mark PecoThis course is designed for those who already have data warehousing knowledge and experience but would benefit from an interactive and informative review prior to testing. You’ll get ready to test through discussion, review of concepts and terminology, and sample exam questions. A CBIP-certified instructor who has experienced the examination process and can share tips and techniques to improve your performance on the exam will lead this class.
YOU WILL LEARN• Concepts and terms used in the exam: organization and methodology,
architecture and technology, data modeling concepts, data integration, and implementation and operation
• What constitutes the complete body of knowledge for the exam• How to assess your knowledge and skill related to the body of knowledge• What to expect during the examination process• Techniques to improve your performance when taking the exam
GEARED TOEveryone seeking CBIP certification (the data warehousing exam is required for all CBIP specialties)
Enrollment is limited to 60 attendees.
T1 Tuesday, October 04, 8:00 a.m.– 5:30 p.m.Get Started with Analytics, Onsite, CBIP
TDWI Predictive Analytics Fundamentals Deanne LarsonPredictive analytics is a set of techniques used to gain new knowledge from large amounts of raw data by combining data mining, statistics, and modeling. Predictive analytics goes beyond insight (knowing why things happen) to foresight (knowing what is likely to happen in the future). Predictive models use patterns in historical data to identify and quantify probabilities of future opportunities and risks. Virtually every industry—insurance, telecommunications, financial services, retail, healthcare, pharmaceuticals, and many more—uses predictive analytics for applications such as marketing, customer relationship management, fraud detection, collections, cross-sell and up-sell, and risk management.
This course introduces predictive analytics skills, which encompass a variety of statistical modeling techniques, including linear and logistic regression, time-series analysis, classification and decision trees, and machine-learning techniques. Beyond statistics skills, predictive analytics requires knowledge of problem framing, data profiling, data preparation, and model evaluation.
YOU WILL LEARN• Definitions, concepts, and terminology of predictive analytics• Common applications of predictive analytics • How and where predictive analytics fits into a BI program and the relationships
with business metrics, performance management, and data mining• To distinguish among various predictive model types and understand the
purpose and statistical foundations of each• Organizational considerations for predictive analytics, including roles,
responsibilities, and the need for business, technical, and management skills
GEARED TOBI program managers, architects, and project managers; business analysts who want to extend from gaining insight to providing foresight; business managers who need new tools to help them shape the future of the business; anyone interested in the basics of predictive analytics
T2 Tuesday, October 04, 8:00 a.m.– 5:30 p.m.Get Started with Analytics, Manage Data for Analytics, Onsite, CBIP
TDWI Data Governance Fundamentals: Managing Data as an Asset Richard HinesData is a critical resource for every organization. We depend on data every day to keep records, produce reports, deliver information, monitor performance, make decisions, and much more. The data resource is on par with financial and human resources as a core component of doing business, yet data management practices are often quite casual. Data governance brings the same level of discipline to data management as is typical when managing financial and human resources.
Building a data governance program is a complex process that focuses people, processes, policies, rules, and regulations to achieve specific goals for a managed data resource. Successful and effective data governance depends on clear goals and well-executed activities that match governance practices to your organization’s needs, capabilities, and culture. A continuously evolving program is necessary to
TDWI SAN DIEGO // OCTOBER 2–7, 2016
11 REGISTER at tdwi.org/SD2016 // QUESTIONS? 425.277.9181 or [email protected]
keep pace with trends such as cloud services, big data, and agile development. This course provides fundamental understanding of data governance concepts and techniques that is essential to start a new governance program or evolve an existing program.
YOU WILL LEARN• Definitions and dimensions of data governance• Key considerations and challenges in building a data governance program• The practices, roles, skills, and disciplines essential to data governance• The qualities that make good data stewards and stewardship organizations• The processes of developing, executing, and sustaining data governance• Activities, issues, and options when building a data governance program• How maturity models are applied for data governance• The importance of adapting data governance for trends such as big data, cloud
services, and agile development methods
GEARED TOData quality and data governance professionals; BI/DW managers, architects, designers, and developers; data stewards, data architects, and data administrators; anyone with a role in data governance or data quality management
T3A Tuesday, October 04, 8:00 a.m.– 11:15 a.m.Drive Your Business with Analytics, Manage Data for Analytics
Data Strategy I: A Corporate Plan for Data Evan LevyCompanies are dealing with exploding amounts of data, and a common belief is that volumes are doubling every two years. While most people agree that data is a corporate asset, there’s little discussion about how companies can ensure that data is being managed and used effectively. With the continued growth of IT budgets, it has become commonplace to challenge the value (and ongoing cost) of retaining data assets. Although most IT organizations are prepared to discuss their strategy with technology platforms, tools, and methodologies, few are equipped to discuss their goals and strategy for corporate data.
A successful data strategy isn’t just about data management, naming standards, or governance methods. It must support the goals and the execution details for ensuring the effective adoption and use of data assets. In this new class, Evan Levy discusses the details and reviews the activities that go into building a comprehensive data strategy.
YOU WILL LEARN• The key components of an enterprise data strategy• To align the strategy with your company’s goals and priorities• The key tactical enablers that can elevate the visibility of a data strategy
initiative• To understand the alternatives and determine the best fit for your company• The analysis and construction activities involved in building your company’s
data strategy• To identify the stakeholders and determine their roles in supporting the strategy • Suggested approaches and techniques for conducting stakeholder interviews,
along with sample questions • To build sample strategy artifacts based on real-world scenarios
GEARED TOCIOs and chief data officers; IT program managers; business sponsors and end users; BI program management; data management staff
T3P Tuesday, October 04, 2:15 p.m.– 5:30 p.m.Drive Your Business with Analytics, Manage Data for Analytics
Data Strategy II: Developing the Road Map Evan LevyThe idea that data is the critical ingredient to running our companies by the numbers is nothing new. We’ve developed methods to move data between our application systems and data warehouses in a fast and scalable manner. We’ve delivered business intelligence (BI) solutions to enable users to become knowledge workers. And it’s still not enough. It’s not enough because the sources of data and the needs of users continue to grow.
Many corporate data ecosystems are based on a vision that is 20 years out of date. Our methods and tactics for managing and processing data must expand to support data outside the company’s four walls. Business decisions require access to data outside the traditional IT infrastructure: cloud application platforms, social media feeds, third-party data providers, and business partner systems. We need to be able to support adding and managing new data sources and content more quickly and efficiently. If data is truly a corporate asset, it needs to be accessible and usable by anyone in the company.
In this session, Evan Levy will discuss the challenges within our corporate data ecosystems and the issues associated with supporting the enormous growth of new and diverse data content and sources. He will review various approaches and methods to tackling these challenges and how leading companies are succeeding in addressing their companies’ data objectives.
YOU WILL LEARN• The business data ecosystem and the changes in data usage and sharing inside
today’s companies • The most common data challenges in the era of big data and cloud computing • The methods and infrastructure changes required to support the enormous
growth in new data sources and alternative data content• Tactics for managing data movement within (and outside of) your company;
for reviewing tooling to simplify and automate data access and usage; for positioning users as stakeholders in data improvement processes (quality, correction, monitoring, etc.); for delivering (or deferring) data self-sufficiency; and for managing data content at the enterprise, organization, and user levels
• To align your company’s data needs with their tactical business priorities
GEARED TOCIOs and chief data officers; IT program managers; business sponsors and end users; BI program management; data management staff
T4A UPDATED! Tuesday, October 04, 8:00 a.m.– 11:15 p.m.Communicate with Data
Self-Service BI and Analytics: Turning the Promise into Reality Wayne EckersonSelf-service BI and analytics have been the Holy Grail of BI managers worldwide for the past two decades. Although BI tools have improved significantly, it is still notoriously difficult to achieve the promise of self-service BI—business users getting what they want, when they want it, without adding to the corporate BI team’s custom report backlog. So why is self-service BI so difficult? Why is it so hard to get users to adopt BI tools?
TDWI SAN DIEGO // OCTOBER 2–7, 2016
12 REGISTER at tdwi.org/SD2016 // QUESTIONS? 425.277.9181 or [email protected]
This session will provide tips and techniques for creating an analytical architecture that gives the right tools to the right people for the right tasks and will show how self-service BI experiences vary based on user expertise and requirements. It will also show how to build a self-sustaining analytical culture where business users, analysts, and BI professionals work collaboratively to support data-driven decision making.
YOU WILL LEARN• How to create an inventory of business users• Ways to map users to technology requirements• Criteria for segmenting BI tools by function and type• How to design training and support programs that work• Methods to increase user adoption
GEARED TO• Business and technical managers who need to accelerate the delivery of
analytics in a governed environment, as well as business analysts, data analysts, data architects, and BI analysts who need a closer alignment between business and IT.
T4P UPDATED! Tuesday, October 04, 2:15 p.m.– 5:30 p.m.Communicate with Data
Visualization Best Practice and Design Standards: Creating a Common Visual Vocabulary Wayne EckersonThe purpose of data visualization is not to hide the truth but to expose it, so business users quickly see what’s important and take action. Visual design standards create a common visual vocabulary throughout an organization, speeding business cognition and accelerating application development. The best visual standards embrace visualization best practices and ensure all applications conform to the same look, feel, and functional expressiveness.
YOU WILL LEARN• Apply best practices in visual display of quantitative information• Create visual design standards that accelerate development and maximize
user adoption• Create a visual vocabulary for your organization• Develop visual standards that enable deeper, more rapid analytical insight
and decisions• Leverage industry standards for visual design• Overcome limitations of your analytical tools in supporting a visual standard
GEARED TO• Business and technical managers who want to standardize the delivery and
display of dashboards and visualizations throughout their department or organization, ensuring higher levels of uptake, adoption, and impact, as well as BI developers and business analysts who create dashboards and want to know best practices in the visual design of quantitative information.
T5A Tuesday, October 04, 8:00 a.m.– 11:15 a.m.Experience Analytics in Action
Social Data Analytics – Are You Ready to Start? Shawn RogersBig data comes in all shapes and sizes. Social data is at the forefront of big data innovation for companies who need to power deeper and richer analytics. Social data analytics enables better understanding of customer sentiment, brand awareness, purchasing habits, and more. Integrating, sharing, and leveraging this data across your analytics environment opens the door to a new world of business insight.
This class explores the various social data sources, data structures, integration strategies, and benefits of social analytics in your enterprise.
YOU WILL LEARN• Why you can’t afford to ignore this growing trend and innovative data source• How leading companies achieve a competitive edge using social analytics• To understand the five social media data types and how to leverage them• Mistakes to avoid in your social analytics strategy• Essential tools for social analytics• How to integrate and utilize social data within your enterprise
GEARED TOThose with experience on prior BI projects; those who are tasked with adding value to existing BI implementations with new data sources; anyone getting started with big data and/or social media strategy; anyone who is curious about social analytics opportunities and value
T5P Tuesday, October 04, 2:15 p.m.– 5:30 p.m.Experience Analytics in Action
Mobile Business Intelligence: Empowering the Mobile Enterprise Shawn RogersDriving innovation with data is the mantra for today’s smart enterprise. In the age of big data, IoT, and the cloud, IT is already working hard to enable innovation and stay current with new technologies. As our data environments become more complex and data more distributed and diverse, we are facing increasing needs to stay flexible and agile to accommodate change and innovation. Delivering data to a mobile work force is a critical strategy for most companies, but it goes beyond simple reporting and dashboards. Sophisticated strategies and coordinated best practices will take your company to the next level of BI and power your team with mobile data and insights.
YOU WILL LEARN• How your peers are deploying mobile BI and analytics• About innovative use cases and applications to drive value from mobile• Tactics to ensure your mobile BI and analytics program succeeds• About industry research on mobile and best practices
GEARED TOIT and business professionals who need an overview and understanding of mobile BI opportunities and strategies.
DS3 NEW! Tuesday, October 04, 8:00 a.m.– 11:15 a.m.Become a Data Scientist
Data Science Bootcamp // Modeling Your Data: Building and Assessing Models Natasha BalacThis half-day Data Science Bootcamp is designed for participants seeking data science skills, who are eager to expand their knowledge through building and evaluating predictive models. During this session, participants will explore practical strategies associated with the growing discipline of data science and will cover data science processes using a variety of data analysis tools to discover patterns and relationships in data.
Participants will also learn the critical data science techniques and tools that enable discovery of accurate and actionable insights. This practical session emphasizes key predictive modeling techniques, such as classification, regression, and clustering.
TDWI SAN DIEGO // OCTOBER 2–7, 2016
13 REGISTER at tdwi.org/SD2016 // QUESTIONS? 425.277.9181 or [email protected]
YOU WILL LEARN• Essential skills to design, build, test, and evaluate predictive models• How to conquer technical data science obstacles• Ways to match appropriate predictive modeling methods to particular project
types• Methods for applying data science algorithms to real data and interpreting the
results• Resources, skills, and plans that you can take with you to apply to your next
data science project
GEARED TOAnalytics practitioners; data scientists; IT professionals; business analysts; analytics project leaders, technical managers, scientists, and engineers
DS4 NEW! Tuesday, October 04, 2:15 p.m.– 5:30 p.m.Communicate with Data, Become a Data Scientist
Data Science Boot Camp // Data Science in the Enterprise John AkredAs a data scientist, you quickly realize that organizing around data is a concern for the whole business. In this class, we will share our methods and observations from three years of effectively deploying data science in enterprise organizations.
Attendees will learn how to be an effective member or manager of a data science team and how to work with, and plan for, the needs of the business.
YOU WILL LEARN • How to build a data-driven culture • Organizational concerns for data science • To understand and meet business needs • Where data science meets engineering • Methods for running data science projects • How to deploy data science from the lab to the factory
T7A Tuesday, October 04, 8:00 a.m.– 11:15 a.m.Experience Analytics in Action
Real-time! Right now: Implementing IoT Data and Streaming Analytics to Drive Business Value John MyersInformation is coming faster and faster. Whether it is from real-time customer analytics or sensor information from the Internet of Things, organizations must determine how to meet the demands of streaming analytics use cases. Will they use toolsets to collect, integrate, and analyze information? Will they use standardized software products to meet these challenges?
Streaming analytics presents unique challenges for organizations that have built their business intelligence best practices on more traditional analytics use cases and infrastructures. These organizations need to understand how streaming analytics differs from their existing procedures and to get an overview of the landscape of options available to them.
YOU WILL LEARN• Significant differences between streaming analytics and traditional
BI use cases• Key attributes of data collection, integration, analysis, and storage for
streaming analytics implementations• Programming toolsets and software packages available to meet these
challenges• How to apply your existing knowledge base and skills to this new domain
GEARED TOBusiness management; IT management; BI/analytics architects; data architects and modelers; business analysts; data analysts
T7P Tuesday, October 04, 2:15 p.m.– 5:30 p.m.Experience Analytics in Action
Avoiding Disaster: Building a Successful Streaming Analytics Ecosystem for IoT and Real-time Data John MyersYou have decided to jump into the world of streaming analytics—or perhaps you were pushed by competitors, management, or circumstance. Either way, now you need to build your plan to implement your streaming analytics project. Do you take advantage of the certainty of established software products to tackle your streaming project? Do you apply one of the many flexible toolsets to meet your challenges?
With streaming analytics, it is particularly important that you make correct choices in both technology and best practices. You need to understand which of the various available tools will best meet your requirements and suit your organization’s characteristics. And you must understand how the changing conditions of real-time analytics and sensor data collection and integration will impact your organization.
YOU WILL LEARN• How to evaluate your organization’s readiness for streaming analytics• How to decide if software packages or programming toolsets are best for your
organization• Which technology options are best suited for both situations • How to understand when your organization is ready to make a change in
implementation
GEARED TOBusiness management; IT management; BI/analytics architects; data architects and modelers; business analysts; data analysts
T8A UPDATED! Tuesday, October 04, 8:00 a.m.– 11:15 a.m.Experience Analytics in Action, Manage Data for Analytics
Data Discovery, Exploration, and More: The Latest Innovations in Analysis and BI Tools Mark MadsenThe BI market has changed. The era of “one size fits all” BI tools and complex enterprise BI stacks is ending, shaken up by new technologies that give analysts and end users new capabilities. The goal of “information for everyone” is more achievable than it was in the past, but it comes with trade-offs like complexity, changes to data architecture, and different operational environments.
This course will provide a framework for data and analysis tools to help identify gaps and choose new tools. The session will review some of the latest innovations and tools that offer new capabilities and new ways of using data. Topics include data discovery and exploration; the role of search in both the BI front end and as an engine behind tools; collaboration in BI environments; streaming data and real-time monitoring; cloud and SaaS deployment; graph and network analysis; and text analytics. The course will also include various live demos.
YOU WILL LEARN• The latest innovations for delivering and analyzing data• How these new technologies fit into your current environment• What the market adoption of these capabilities is today• How to determine what technologies to evaluate and what to look for when
evaluating them
TDWI SAN DIEGO // OCTOBER 2–7, 2016
14 REGISTER at tdwi.org/SD2016 // QUESTIONS? 425.277.9181 or [email protected]
GEARED TOBI directors; business analysts; architects; BI application owners
T8P UPDATED! Tuesday, October 04, 2:15 p.m.– 5:30 p.m.Manage Data for Analytics
Delivering Data Faster: Innovations in Integration Tools Mark MadsenData integration is usually the slowest and most complex part of any data environment, whether it’s a one-off analytics project done by end users or a data warehouse built by IT. However, new technologies for data integration are challenging assumptions about how integration should be done and who can do the work. It’s now possible for analysts to access, clean, and analyze data without IT involvement.
This course focuses on some of the tools and technologies that speed up the process of delivering data to users. Some of these are analyst focused, such as self-service data preparation and analysis tools. Others are focused on challenges in the technology architecture and enable IT to make data available more quickly.
Topics in this session include self-service data integration, data preparation, exploratory profiling, data virtualization, automation, testing and test data management, making streaming data available to nonprogrammers, and rethinking assumptions about data integration and architecture. The course will also include demos of some of the tools discussed.
YOU WILL LEARN• The latest innovations for integrating and preparing data• How these new technologies fit into your current environment• What to look for when evaluating these new technologies
GEARED TOArchitects, analysts, and BI managers who want to understand the new integration technologies
W1 Wednesday, October 05, 9:00 a.m.– 5:30 p.m.Get Started with Analytics, Manage Data for Analytics, Onsite, CBIP
TDWI Data Integration Principles and Practices: Creating Information Unity from Data Disparity Richard HinesToday’s business managers depend heavily on data analysis and decision-speed information, raising the stakes for data integration. At the same time, the work of integrating data has become increasingly complex. The simple processes of extract, transform, and load (ETL) integration for structured enterprise data no longer meet the need. Unstructured data, big data, departmental data, end-user data, and external data all challenge the old models for data integration. Meeting modern data integration challenges calls for data integration strategy and architecture.
Get ready to build reliable and adaptable data integration systems and make the most of recent advances in data integration technologies by following the path of strategy first, architecture next, and then integration systems and technology.
YOU WILL LEARN• The role, purpose, and issues of data integration strategy• Frameworks and patterns for data integration architecture• How to fit unstructured data into integration strategy, architecture,
and systems• How to use integration architecture and patterns to handle large-volume data
challenges• How to apply architecture and patterns for enterprise, departmental, and
local data
• How to select, mix and match, and apply several data integration methods, including ETL, federated, service oriented, and virtualized
• Techniques to collect and manage data integration requirements• Tips and techniques for success throughout the data integration life cycle—
strategy, architecture, systems development, and operations
GEARED TOBI, MDM, and data warehousing program and project managers; data integration architects, designers, and developers; data and technology architects
W2 Wednesday, October 05, 9:00 a.m.– 5:30 p.m. Drive Your Business with Analytics, Become a Data Scientist, Onsite
Serious Play for Predictive Analytics: What Works, What Doesn’t, and Why Keith McCormickThis one-day vendor-neutral session will prepare analytics practitioners and functional managers to make sense of predictive modeling and take control of the analytics process. We’ll introduce the foundation for data-intensive analytics projects that deliver insight, clarity, confidence, and actionable decision support.
Live demonstrations will illustrate how organizational practitioners can effectively navigate the natural messiness of advanced analytics. Attendees will realize that true impact with predictive analytics has far more to do with the overall management of a project team and strategic processes than with the tactical skills of a data scientist.
If you are a business or public sector practitioner or leader seeking to propel your organization’s analytics maturity and put predictive analytics to work for measurable gain, then this session is designed for you.
YOU WILL LEARN• How to develop a business-aligned strategy for applying high-value data-driven
decisions• Ways to identify, qualify and prioritize viable and actionable analytics
opportunities• Methods for implementing a standardized process development model across
your team• Tools to acquire both the tactical and strategic skills required to stand out in
the analytics practice• The reasons most analytics projects fail and the main pitfalls to avoid• A standardized process methodology for predictive analytics• Resources, contacts, and plans you can take away to reduce your project
preparation time, costs, and risks
GEARED TOIT executives and big data directors; line-of-business directors and functional managers; data scientists; technology planners; consultants
W3 Wednesday, October 05, 9:00 a.m.– 5:30 p.m. Communicate with Data, Become a Data Scientist, Onsite
Hands-on Data Mining with R Prerequisite: Attendees should have some coding experience, basic statistics, and will need to bring a laptop computer with RStudio installed prior to the session. When you register for the class you will receive detailed instructions for download and installation of RStudio.
Deanne LarsonWith the advent of big data, there is an increased focus on data mining and the value that can be derived from large data sets. Data mining is the process of selecting, exploring, and modeling large amounts of data to uncover previously unknown information for business benefit.
TDWI SAN DIEGO // OCTOBER 2–7, 2016
15 REGISTER at tdwi.org/SD2016 // QUESTIONS? 425.277.9181 or [email protected]
R is an open source software environment for statistical computing and graphics and is very popular with data scientists. R is being used for data analysis, extracting and transforming data, fitting models, drawing inferences, making predictions, plotting, and reporting results. Learn how to use R basics, working with data frames, data reshaping, basic statistics, graphing, linear models, non-linear models, clustering, and model diagnostics.
YOU WILL LEARN• How to configure the RStudio environment and load R packages• How to use R basics such as basic math, data types, vectors, and
calling functions• How to use advanced data structures such as data frames, lists, and matrices• How to use R base graphics• How to use R basic statistics, correlation, and covariance• How to use linear models such as simple linear regression, logistic regression• How to use non-linear models such as decision trees and Random Forests• How to apply clustering using K-means• How to complete model diagnostics
GEARED TOAnyone interested in learning to use data mining techniques to find insights in data and who has at least some statistical and programming experience
Enrollment is limited to 40 attendees.
W4 Wednesday, October 05, 9:00 a.m.– 5:00 p.m.Manage Data for Analytics, Become a Data Scientist, Onsite
Understanding Hadoop Krish KrishnanThe advent of big data has changed the world of analytics forever. Big data challenges scalability and big data platforms reshape BI and analytics infrastructure. Hadoop has taken center stage in the big data revolution, and we’ll all need to understand the platform, its ecosystem, and how to work with it. The enterprise adoption of Hadoop is met with mixed responses. Join us to learn Hadoop basics, understand the realities, sort out the conflicts, and find out where and how Hadoop fits into your BI and analytics future. We will discuss the ecosystem and its intricacies, look at where it will help, and discuss how companies have embraced its usage.
YOU WILL LEARN• The “what” and “why” of Hadoop• Hadoop components• Technical architecture• Core components (MapReduce, HDFS, YARN)• Hadoop tools (Hbase, Hive, Pig, Mahout, Impala)• Hadoop setup and configuration• Hadoop administration and management• Using Hadoop: applications and examples
GEARED TOArchitects, developers, anyone interested in Hadoop
W5A NEW! Wednesday, October 05, 9:00 a.m.– 12:15 p.m.Drive Your Business with Analytics, Manage Data for Analytics
Big Data MBA: Developing an Actionable Big Data Business Strategy Bill SchmarzoOrganizations do not need a big data strategy—they need a business strategy that incorporates big data. Most organizations lack a road map for using big data to optimize key business processes, deliver a differentiated customer experience, or uncover new business opportunities. They do not understand what’s possible with respect to integrating big data into the business model.
In this session we will discuss the transformative potential of big data and introduce the Big Data Business Model Maturity Index as a guide for helping organizations understand where and how they can leverage data and analytics to power their business models. We will share worksheets for assessing the business value and implementation feasibility with respect to the organization’s big data use cases.
YOU WILL LEARN• Techniques to identify data sources that will yield better predictors or enablers
of business performance• Methodologies for breaking down your organization’s key business initiatives
into its supporting data, analytics, and technology strategy• A process for developing an actionable big data business strategy that goes
from “what the organization wants to do” to “how we do it”• How to use a “Thinking Like a Data Scientist” process, with an accompanying
worksheet• How to understand the roles of data science and the data lake in supporting
your big data business strategy
GEARED TOBusiness executives and business management who need to identify where and how data and analytics can power the business
W5P Wednesday, October 05, 2:15 p.m.– 5:30 p.m.Drive Your Business with Analytics, Experience Analytics in Action
Creating an Analytically Driven Enterprise: Implementing an Analytics Program Claudia ImhoffAnalytics has become the darling of vendors, consultants, and the press. In addition, data scientists are now highly sought after. Yet, the adoption rate for analytics and BI is still hovering between 20 and 30 percent in most enterprises. What is the problem? How can we improve the adoption of these critical decision support functions? What is needed to implement a successful analytics program?
These are some of the questions to be answered in this timely presentation by Dr. Claudia Imhoff. Getting an analytics program up and running requires several considerations.
YOU WILL LEARN • The need for analytics and enterprise strategy for acceptance• Education—not just training• The new way we work• The data scientist, data priest, data interpreter, data engineer—who wins?• Ultimate goal—comprehension by the executives on how analytics can impact
them and the company
TDWI SAN DIEGO // OCTOBER 2–7, 2016
16 REGISTER at tdwi.org/SD2016 // QUESTIONS? 425.277.9181 or [email protected]
W6A Wednesday, October 05, 9:00 a.m.– 12:15 p.m.Manage Data for Analytics
The Logical Data Warehouse as Agile Data Foundation for Analytics and Data Science Rick van der LansData analysts and data scientists don’t know the concept of data overload. The more data they can lay their hands on, the better it is. They want to analyze data coming from internal transaction systems, from external open data sources, from clickstream data sources, from social media, from big data sources, and so on. And they want it fast and flexible, and they want to do it themselves. Most classic data warehouse architectures have been designed and developed to support standard forms of reporting and analytics, but they are not ready for these new forms of data usage: data science and complex analytics. The logical data warehouse, on the other hand, is shown to be a more agile foundation for delivering and transforming data. It makes it easy to plug in new data sources fast. Mature technology in the form of data virtualization servers exist to develop a logical data warehouse. Products from Cisco, Denodo, Informatica, RedHat, and StoneBond have proven that they can support self-service analytics, data science, and advanced analytics. The logical data warehouse is truly an agile data foundation for analytics and data science.
YOU WILL LEARN• What the practical benefits of the logical data warehouse architecture are and
what the differences are with the classical architecture• How easy it is to make new data sources available for analytics and
data science• How self-service analytics can be supported by a logical data warehouse, and
how it helps to share specifications across different analytical tools• How organizations can successfully migrate to this flexible logical data
warehouse architecture in a step-by-step fashion• About the possibilities and limitations of the available products • How data virtualization products work• How access to big data stored in Hadoop and NoSQL systems can be made
available to analysts easily and transparently• How the logical data warehouse helps to integrate self-service analytics with
the classic forms of BI• What the real-life experiences are of organizations that have already
implemented a logical data warehouse
GEARED TO• Business intelligence specialists and data warehouse designers who want to
know what the pros and cons of the logical data warehouse architecture are• Data scientists, data analysts, and business analysts who use and work with
data every day and who want to know how the logical data warehouse can help them get access to data faster
• Technology planners, technical architects, and enterprise architects who need to know what the impact on the overall architecture is of this new approach
• Database developers and database administrators who need to know what the impact is of a logical data warehouse architecture on database aspects
• IT Managers who need to be informed about what the logical data warehouse architecture has as business benefits
W6P Wednesday, October 05, 2:15 p.m.– 5:30 p.m.Manage Data for Analytics
New Data Storage Technologies: From Hadoop to Graph Databases, and from NoSQL to NewSQL Rick van der LansBig data, Hadoop, in-memory analytics, Spark, analytical database servers, graph databases, NewSQL, and NoSQL are just a few of the many new data storage technologies and techniques that have become available for developing business intelligence and big data systems. Most of them are very powerful and allow for development of flexible and scalable systems. But which ones do you pick? Due to this waterfall of new developments, it’s becoming harder and harder for organizations to select the right tools. Which technologies are relevant? Are they mature? What are their use cases? These are all valid questions, but are all difficult to answer. An aspect that is clearly complicating is that many of these new systems are specialized database servers. They are very good at just one task. For example, graph databases are great for doing graph analytics, whereas most of the NoSQL products are designed for running a massive transactional workload, however, with a narrow data model. This session gives a clear and extensive overview of all the new data storage developments. Technologies and products are explained, market overviews are presented, strengths and weaknesses are discussed, the pros and cons of each solution are discussed, and guidelines and best practices are given. The attendees are given a full and critical update of all the new products and technologies and shows.
YOU WILL LEARN• How new and existing technologies, such as Hadoop, NoSQL and NewSQL, can
help to develop BI and big data systems• How to embed Hadoop technologies in existing BI systems• How Spark can boost the performance for analytics• Why graph databases are very different from all the other systems• When to use NewSQL or NoSQL for developing transactional systems• How to simplify data access through SQL-On-Hadoop engines• When to use which new storage technology• The pros and cons of each data storage technology• Which products and technologies are winners and which ones are losers
GEARED TO• Business intelligence specialists who need to know which new technology to
deploy for complex forms of analytics on big data sources• Data warehouse designers who want to know how to incorporate all these new
technologies, such as NoSQL, Hadoop, and Spark, in their data warehouse environments
• Big data specialists who want to know what the advantages and disadvantages are of the different new database technologies
• Data scientists who are interested in the new forms of analytics, such as graph analytics, offered by the big data world
• Technology planners, technical architects, and enterprise architects who must stay up to date with the latest technology for data processing
• Database administrators and database developers who want to know when to choose which new technology
TDWI SAN DIEGO // OCTOBER 2–7, 2016
17 REGISTER at tdwi.org/SD2016 // QUESTIONS? 425.277.9181 or [email protected]
W7A NEW! Wednesday, October 05, 9:00 a.m.– 12:15 p.m.Communicate with Data, Become a Data Scientist
Trend Spotting and Pattern Spotting: Seeing What Matters in Data Visualizations Dave WellsAnalytics effectiveness and impact depends on two kinds of visualization skills—the ability to create visuals and the ability to understand visuals. However, the real value of visualization does not come from creating visuals, but from understanding what they can tell you. With written language, we learn reading and writing as separate-but-related skills. Similarly, with visual language we need to learn understanding (reading) and creating (writing) as distinct-but-related skills.
There are many books, courses, and other resources that teach you how to develop data visualizations but few that teach you how to read and understand them. This course aims to fill that gap by teaching the core capabilities of understanding and interpreting data visualizations.
YOU WILL LEARN• Ten key concepts of data visualization• The most important things to look for when reading visualizations• How to do a quick read of data visualizations• How to do a critical read of data visualizations• Approaches for seeing trends, patterns, and outliers in visual presentation
of data• Ways to identify ambiguity, distortion, and bias in visual presentation of data
GEARED TOBusiness managers, decision makers, analysts and other analytics consumers seeking to refine their skills for understanding data visualizations; data scientists, data analysts, and other analytics providers seeking to enhance their data visualization skills by understanding visualization from the perspective of the readers
W7P NEW! Wednesday, October 05, 2:15 p.m.– 5:30 p.m.Manage Data for Analytics
Data Pipelines: Workflow and Dataflow for Today’s Data Architectures Dave WellsData-driven is the modern mantra of business management, but enabling a data-driven organization is complex and challenging. Abundant data sources and multiple use cases result in many data pipelines—maybe as many as one for each use case. Capabilities to find the right data, manage data flow and workflow, and deliver the right data in the right forms for analysis are essential for all organizations that seek to become data driven.
Multiple and complex data pipelines can quickly become chaotic under pressure from agile development, democratization, self-service, and organizational pockets of analytics. The resulting difficulty in governance and uncertainty of data usage are only the beginning of the troubles. Therefore, data pipeline management must ensure that data analysis results are traceable, reproducible, and of production strength, whether enterprise-level or self-service. Robust pipeline management works across a variety of platforms from relational to Hadoop, and recognizes today’s bidirectional data flows where any data store may function in both source and target roles.
YOU WILL LEARN• The challenges and complexities of modern data pipelines• Why data flow and workflow are critical parts of—and how they fit into—your
analytics architecture • How to define and design data pipelines• The roles and functions of metadata in pipeline management • The important relationships between pipeline management and data
governance• The state of tools and technologies to support pipeline management
GEARED TOAnalytics architects, BI architects, data warehouse architects, data architects, and anyone in an architect role that intersects with data; data engineers who define, design, and develop data warehouses, data lakes, operational data stores, data sandboxes, master data hubs, or other enterprise data stores; data integration and preparation professionals who define, design, and develop the processes that move data through pathways from sources to consumers
THK Thursday, October 06, 8:00 a.m.– 8:45 a.m. Keynote
Keynote // 20% Blissful, 80% Ignorance: DataOps, Harsh Realities, and Unintentional Lies Phil HarveyThere is no escaping it—data is important. It’s not cool, it’s not fun—it’s mostly boring, horrible grunt work. At some point, though, all of us will need to work with data. Whether you are a full-fledged data scientist, an analyst, or the CEO of a small business trying to make sense of last month’s sales, getting to the point of understanding involves a lot of hard work. The majority of this work is called DataOps, and it is sadly undervalued, misunderstood, and the cause of a lot of stress. We will start this talk with an introduction to DataOps and then we will explore the harsh realities and unintentional lies that get in the way. We will look past the tools and technologies themselves and explore the reasons data projects fail.
TDWI SAN DIEGO // OCTOBER 2–7, 2016
18 REGISTER at tdwi.org/SD2016 // QUESTIONS? 425.277.9181 or [email protected]
TH1 Thursday, October 06, 9:00 a.m.– 5:00 p.m.Get Started with Analytics, Manage Data for Analytics, Onsite, CBIP
TDWI Data Governance Innovations: Adapting for Agile, Big Data, and Cloud Jonathan GeigerRapid increases in data variety and data management practices challenge the old model of policy- and enforcement-based data governance. Cloud services bring new issues that go well beyond the obvious concerns of security and privacy. Big data implementation brings substantial changes to the scope and complexity of governance. Many ask if governance and agile can coexist. The answer must be yes, but making them work together is especially challenging.
Cloud services, big data, and agile BI are here to stay. Data governance programs must modernize and adapt to these realities. A fundamental culture change from control-oriented governance to collaboration is at the core of modern data governance—shifting from enforcement to prevention and intervention as the means to assure data security, privacy, compliance, quality, and value. Beyond cultural change, every data governance participant needs to understand the new issues and the new opportunities that arise from current trends in data management.
YOU WILL LEARN• The data governance challenges and opportunities that arise from
cloud services• Risks, challenges, and opportunities of big data governance• How to overcome apparent conflicts between data governance and agile• Roles, relationships, and complexities of metadata management for
data governance• Data governance challenges that arise from mobile devices and social media• The importance of ethics as a data governance imperative• New models, practices, and processes for modern data governance
GEARED TOData quality and data governance professionals; CIOs, business leaders, and IT executives facing the realities of agile, big data, or cloud services; managers, architects, designers, and developers of BI, MDM, and data warehousing systems; data stewards, data architects, and data administrators; anyone with a role in data governance or data quality management; anyone needing to modernize a data governance program for agile BI, big data, or cloud services
TH2 Thursday, October 06, 9:00 a.m.– 5:00 p.m.Experience Analytics in Action, Manage Data for Analytics,
Become a Data Scientist, Onsite
Data Preparation for Predictive Analytics Keith McCormickThis one-day vendor-neutral session will expose analytics practitioners, data scientists, and those looking to get started in predictive analytics to the critical importance of selecting, transforming, and properly preparing data in advance of model building. The instructor will present the characteristics of varying data types, how to address data quality issues, and identifying data representations that are suited to various project types.
Participants will learn that data outliers are often not errors in the data, but the data points of most interest. Live demonstrations will reinforce why problem context is required to understand how to deal with outliers and why undertreating extreme values can introduce model bias. This session will also cover a wide range of data preparation exercises ranging from data sandbox construction to the creation of training, test, and validation data sets for model development.
YOU WILL LEARN• How to prepare a data sandbox for predictive analytics• Ways to detect and treat missing data and address data quality issues• Methods to match data representations to suitable project types• Construction methods for various data transformations• How to handle data outliers without biasing model performance• How to build “train–test–validate” data sets for model development• Resources, skills, and plans that you can take with you to confidently process
raw data for analytics
GEARED TOAnalytics practitioners; data scientists; IT professionals; technology planners; consultants; business analysts; analytics project leaders
TH3 Thursday, October 06, 9:00 a.m.– 5:00 p.m.Drive Your Business with Analytics
Practical Techniques for Aligning Business and IT: Navigating Politics and Culture Len SilverstonWhen many organizations are asked why a BI or analytics effort failed, the most common answer is “politics.” And when these same organizations are asked why efforts were successful, human factors are most often mentioned as the key to success.
The way to get the most out of business intelligence and analytics is to put the most into it—and people are the most valuable resources we have in this data-driven world. To be successful, we must invest in and understand leading-edge techniques, tools, and practices that help develop strong personal relationships, effect positive cultural changes, and promote effective human dynamics.
This course provides case studies from a variety of BI efforts and shares critical aspects of why some organizations are successful while others are not. The course shares practical and powerful techniques that focus on human dynamics and personal relationships, two of the most important factors in BI and analytics success. Based upon decades of experience and research from a variety of sources, Len shares principles and specific techniques in BI and analytics environments regarding how to develop trust, how to understand and “model” motivations, how to develop sponsorship, how to move ahead the vision, and how to effectively resolve conflict.
Interactive exercises will allow participants to practice handling difficult issues that commonly arise in BI and analytics efforts, and we will apply the principles and techniques that leading organizations have used to create world-class solutions.
YOU WILL LEARN• Key factors in developing strong personal relationships, effecting culture
change, and attaining critical BI and analytics success• Tools and principles to enable BI and analytics, such as keys to move the
program forward, developing trust, understanding motivation, developing sponsorship, and managing conflict
• Case studies demonstrating how these principles and techniques lead to BI and analytics success and examples where these techniques were missing
• Exercises allowing participants to practice overcoming challenges that BI and analytics professionals inevitably face
GEARED TOAnyone involved in BI and analytics efforts in any capacity, including program and project managers, business sponsors and stakeholders, CIOs and chief data officers, management/executives involved in BI and analytics, and all project team members such as architects, designers, and developers
TDWI SAN DIEGO // OCTOBER 2–7, 2016
19 REGISTER at tdwi.org/SD2016 // QUESTIONS? 425.277.9181 or [email protected]
TH4 Thursday, October 06, 9:00 a.m.– 5:00 p.m.Manage Data for Analytics
Data Management Tactics for Analytics Evan LevyAnalytics has become a commonplace activity that most businesses require to support day-to-day operations. Unfortunately, most companies’ data management methods and capabilities haven’t evolved from the legacy mainframe days to support today’s sophisticated data consumers. In addition, modern data needs aren’t limited to the systems within the company’s four walls—users require content from cloud applications, social media, third-party providers, and business partners. Supporting corporate data as an asset and managing today’s diverse sources, large volumes, and demanding users requires a new and different approach.
A modern data environment should enable a business person to identify, distribute, process, and analyze data without requiring technologists to support each individual need. IT data specialists must be elevated to focus on expanding the corporate data catalog and simplify data delivery and usage to strengthen users’ data capabilities. In this session, Evan Levy will discuss new and innovative approaches to address the explosive growth of data content, data sharing, and data usage.
YOU WILL LEARN• The business data ecosystem and the changes in data usage and sharing inside
today’s companies • The five basic dimensions of data usage • An approach to aligning your data architecture to support your company’s
unique data requirements • A new data architecture template to support the massive growth in data source
needs and analytics diversity• Tactics for managing data movement within (and outside of) your company • Methods to review tooling to simplify and automate data access and usage • Processes for positioning users as stakeholders in data improvement processes
(quality, correction, monitoring, etc.) • Ways to manage data content at the enterprise, organization, and user levels
GEARED TOCIOs and chief data officers; IT program managers; business sponsors and end users; BI program management; data management staff
TH5 Thursday, October 06, 9:00 a.m.– 5:00 p.m.Experience Analytics in Action, Become a Data Scientist
Advanced Analytics: Gaining Insight through Application Deanne LarsonAnalytics encompasses many skills and disciplines. Identifying the problem, choosing the modeling approach, selecting the correct features to model, and evaluating the result are at the heart of analytics. The tendency, however, is to focus primarily on the technology rather than the process. Join us for a problem-focused, applied experience where you learn to apply the analytics process to produce meaningful and valuable insights.
YOU WILL LEARN• To understand and classify different types of data science problems• How to discern the characteristics of common data science scenarios• Ways to outline which analytical problems are suited to which analytics models• To match data science problems to the best-fit models to solve them• Examples that walk through how to apply different aspects of the analytics
process
GEARED TOBusiness analysts, data analysts, and data scientists who need to frame analytics problems and choose the most effective ways to solve those problems; business and technical managers who need to understand the nature of analytics and data science work; BI and analytics developers who work with data scientists; anyone who aspires to become a data analyst, business analyst, or data scientist
TH6 Thursday, October 06, 9:00 a.m.– 5:00 p.m.Manage Data for Analytics, Become a Data Scientist, Onsite
Hands-on Hadoop Krish KrishnanHadoop has created a lot of buzz. From data warehousing to advanced analytics, our enterprise data and processing infrastructure is being reshaped by Hadoop technology. The question is no longer if you’ll have Hadoop, but how best to approach it for both business and technical value.
This class offers a hands-on learning experience working with the Hadoop ecosystem. Using a series of examples and exercises for each topic, you’ll experience the Hadoop tools firsthand and strengthen your learning with discussion about how to implement them.
YOU WILL LEARN• Hadoop components and architecture• Configuration of Hadoop• Configuration of core components (MapReduce, HDFS, Yarn)• Usage of Hadoop tools (HBase, Hive, Pig, Mahout, Impala)• ZooKeeper setup and configuration• Hadoop administration and management
GEARED TO Anyone with an interest in Hadoop, ranging from “Hadoop curious” to those who are actively involved in implementation
Attendance is limited to 40.
TDWI SAN DIEGO // OCTOBER 2–7, 2016
20 REGISTER at tdwi.org/SD2016 // QUESTIONS? 425.277.9181 or [email protected]
TH7 Thursday, October 06, 9:00 a.m.– 5:00 p.m.Communicate with Data, Become a Data Scientist, Onsite
Data Storytelling: The New Horizon in Business Analytics Ted Cuzzillo, Dave WellsStories are powerful. We’ve used them throughout history to capture attention, convey ideas, fire the imagination, and stir the soul. Data can be persuasive, but stories are compelling. Blending data and stories—data storytelling—is a particularly powerful combination.
Storytellers are the next generation of business and data analysts. Data storytelling is a recent and important contribution to analytics, going beyond quantification and visualization to complement data with narrative. A well-told story that is interesting and convincing may appear quite easy on the surface, but crafting a good data story is challenging.
In this highly interactive session, you will gain experience blending the science of statistics, the art of data visualization, and the talent of verbal narrative to develop and deliver compelling data stories.
A laptop computer is recommended but not required for this course.
YOU WILL LEARN• Four reasons to pursue the art of storytelling• Several story types and when to use them• How to compose captivating and compelling stories• To find the story line in a collection of data• To craft a story that combines data visuals with verbal narrative• To choose the best visuals for your story • To filter information and visuals that add noise to a story• To understand and connect with the audience when telling a data story
GEARED TOBI and analytics designers and developers; anyone interested in learning new and highly effective ways to communicate and share information
F1 Friday, October 07, 8:00 a.m.– 3:30 p.m.Get Started with Analytics, Manage Data for Analytics, Onsite, CBIP
TDWI Data Quality Management: Techniques for Data Profiling, Assessment, and Improvement Jonathan GeigerData quality is one of the most difficult challenges for nearly every business, IT organization, and BI program. The most common approach to data quality problems is reactive—a process of fixing problems when they are discovered and reported. But reactive data quality methods are not quality management; they are simply quality maintenance—a never-ending cycle of continuously fixing defects but rarely removing the causes. The only proven path to sustainable data quality is through a comprehensive quality management program that includes data profiling, data quality assessment, root cause analysis, data cleansing, and process improvement.
YOU WILL LEARN• Techniques for column, table, and cross-table data profiling• How to analyze data profiles and find the stories within them• Subjective and objective methods to assess and measure data quality• How to apply OLAP and performance scorecards for data quality management• How to get beyond symptoms and understand the real causes of data quality
defects• Data cleansing techniques to effectively remediate existing data quality
deficiencies• Process improvement methods to eliminate root causes and prevent future
defects
GEARED TOBI, MDM, and data governance program and project managers and practitioners; data stewards; data warehouse designers and developers; data quality professionals
F2 Friday, October 07, 8:00 a.m.– 3:30 p.m.Get Started with Analytics, Drive Your Business with Analytics, Onsite, CBIP
TDWI BI Program Management: A Competency Center Approach to BI Excellence William McKnightA BI program is a large and complex undertaking with competing interests, conflicting priorities, and simultaneous projects that must be managed from a “big picture” point of view. Program management encompasses the organization, disciplines, and activities necessary to coordinate interdependent projects. It extends beyond project activities to ensure quality and availability of business-critical information services and continuous support of vital business decision-making processes.
The very broad scope of BI program management encompasses business alignment, value management, quality management, change management, and risk management. Find out how a BI competency center (BICC) approach to program management will substantially increase the impact of your BI program.
YOU WILL LEARN• The definition and purpose of a BICC• The business case for a BICC: value realization, risk mitigation, standardization,
prioritization, alignment, agility, etc.• Roles and responsibilities of a BICC: assessment, coordination,
communication, etc.• Organizational structures for a BICC and relationships with other shared-
services groups such as data governance councils and project management organizations
• Steps to creating a BICC: issues, challenges, and mistakes to avoid
TDWI SAN DIEGO // OCTOBER 2–7, 2016
21 REGISTER at tdwi.org/SD2016 // QUESTIONS? 425.277.9181 or [email protected]
• Day-to-day activities of BICC operations: end-user support, training, stakeholder communications, collaboration, user group management, change control, etc.
• Techniques to sustain, evolve, and mature the BICC
GEARED TOBI program managers, directors, and sponsors; leaders and managers in BI and business analytics; leaders and managers for enterprise data and information management
F3 NEW! Friday, October 07, 8:00 a.m.– 3:30 p.m.Manage Data for Analytics, Become a Data Scientist
Curating and Cataloging Data: Building a Data Marketplace for Analytics Dave WellsAs the world of data management grows and changes, participants in data ecosystems must adapt. With the convergence of several influences—big data, self-service analytics, self-service data preparation tools, data science practices, and so on—we’re moving rapidly into an age of data curators and data shoppers.
Data shopper describes anyone who is seeking data to meet analytics needs. The data curator is responsible for a collection of data assets, and making it available to data shoppers. Cataloging is an essential curation activity to create and maintain a vital, valuable, and valued data marketplace. Curating and cataloging work together to meet the data needs of business and data analysts, to provide self-service data to complement self-service analytics, and to realize the promise of democratizing data analytics.
YOU WILL LEARN• The concepts, responsibilities, and skills of data curation• The role of the data curator in data governance and the differences between a
data curator and a data steward• The needs and wants of data shoppers and the characteristics of a vital and
valuable data marketplace• The purpose, content, and uses of a data catalog• The state of data cataloging tools and technology• Guidelines for getting started with data curating and cataloging
GEARED TOBusiness and IT leaders struggling with the paradoxes of modern data management; analytics and BI designers and developers; data management professionals at all levels from architects to engineers; data governance professionals (especially data stewards needing to adapt to the world of modern data management)
F4A NEW! Friday, October 07, 8:00 a.m.– 11:15 a.m.Manage Data for Analytics
Big Data Juggling Act: Creating a Big Data Capability with Big Business Impact Paul BoalFor organizations with decades of data warehousing and business intelligence experience, the prospect of bringing big data into the mix can be like going from playing catch to juggling flaming torches. Creating a big data capability that will have big business impact requires a strategic vision, organizational change management skills, retooling of development teams, and integrating old and new ideas together.
However, though understanding big data and the impact it can have alongside existing capabilities requires considerable effort, the resulting new capability will get you ever closer to achieving the original purpose of business intelligence—transforming raw data into analyses that inform decision makers and drive your organization to achieve its goals.
YOU WILL LEARN• Strategies you can use to identify specific ways big data can have an impact on
your organization• Techniques for learning what big data technologies are (and are not) capable of
doing for your business• How to change the way you manage systems and solution development to make
the best use of big data• Where to look for internal supporters and partners who can help you drive your
new big data capability forward• How to identify and achieve quick wins with your new big data capability• How to integrate traditional data warehousing and business intelligence with
big data into a single comprehensive strategy
GEARED TOBusiness analytics, data warehousing, and business intelligence leaders and consultants; big data professionals; solution architects; champions for big data in their organization; and anyone looking to shift their business strategy through big data, analytics, and new ways to support decision making.
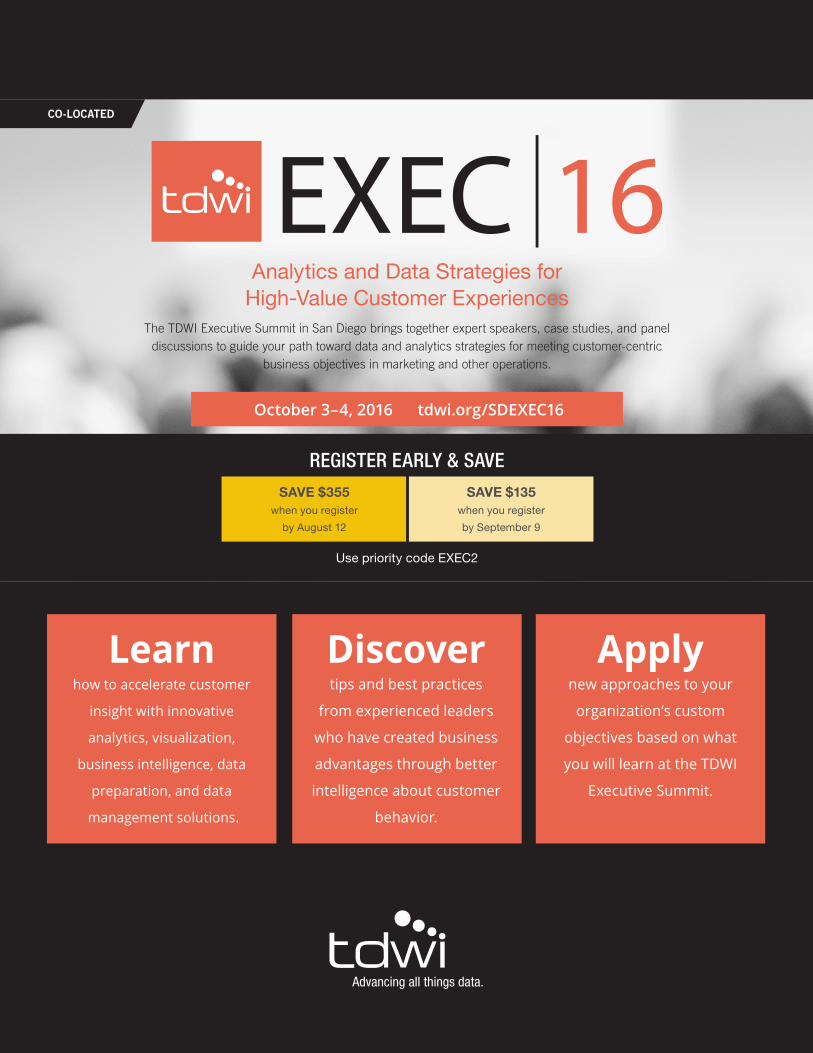
October 3–4, 2016 tdwi.org/SDEXEC16
Apply
new approaches to your
organization’s custom
objectives based on what
you will learn at the TDWI
Executive Summit.
REGISTER EARLY & SAVE
Use priority code EXEC2
Analytics and Data Strategies for High-Value Customer Experiences
The TDWI Executive Summit in San Diego brings together expert speakers, case studies, and panel discussions to guide your path toward data and analytics strategies for meeting customer-centric
business objectives in marketing and other operations.
Discover
tips and best practices
from experienced leaders
who have created business
advantages through better
intelligence about customer
behavior.
SAVE $355 when you register
by August 12
SAVE $135 when you register
by September 9
Learn
how to accelerate customer
insight with innovative
analytics, visualization,
business intelligence, data
preparation, and data
management solutions.
CO-LOCATED
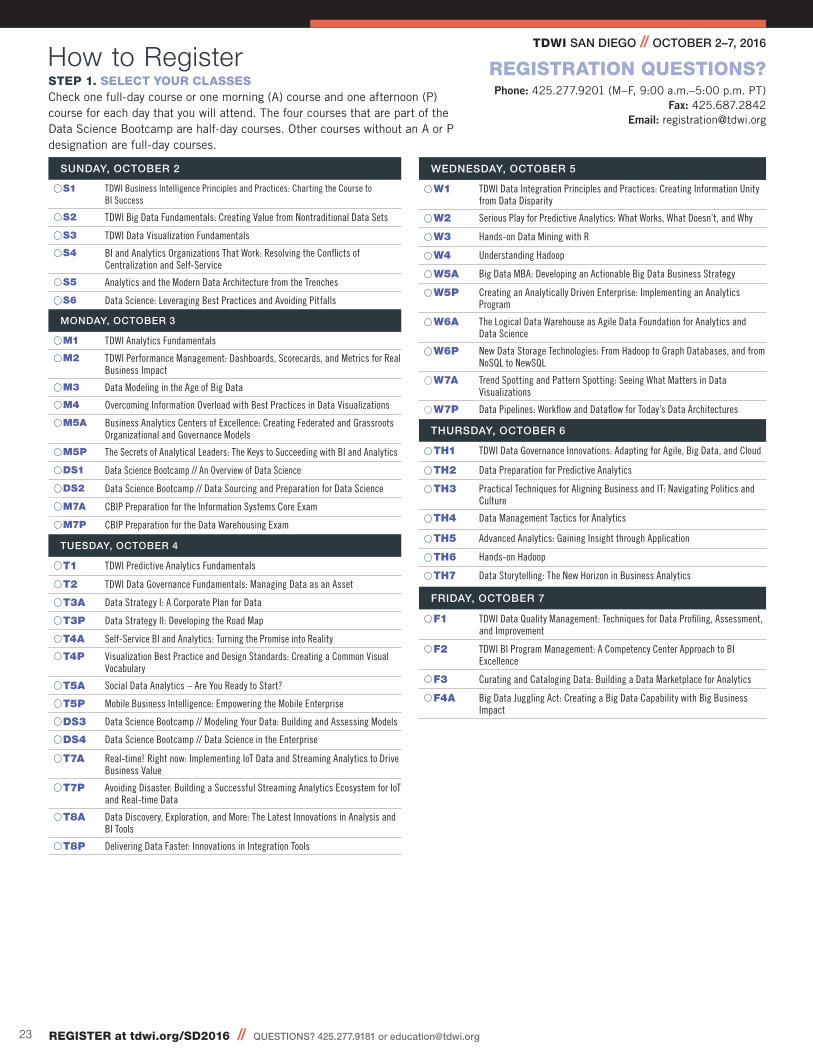
TDWI SAN DIEGO // OCTOBER 2–7, 2016
23 REGISTER at tdwi.org/SD2016 // QUESTIONS? 425.277.9181 or [email protected]
REGISTRATION QUESTIONS? Phone: 425.277.9201 (M–F, 9:00 a.m.–5:00 p.m. PT)
Fax: 425.687.2842Email: [email protected]
STEP 1. SELECT YOUR CLASSESCheck one full-day course or one morning (A) course and one afternoon (P) course for each day that you will attend. The four courses that are part of the Data Science Bootcamp are half-day courses. Other courses without an A or P designation are full-day courses.
How to Register
SUNDAY, OCTOBER 2
S1 TDWI Business Intelligence Principles and Practices: Charting the Course to BI Success
S2 TDWI Big Data Fundamentals: Creating Value from Nontraditional Data Sets
S3 TDWI Data Visualization Fundamentals
S4 BI and Analytics Organizations That Work: Resolving the Conflicts of Centralization and Self-Service
S5 Analytics and the Modern Data Architecture from the Trenches
S6 Data Science: Leveraging Best Practices and Avoiding Pitfalls
MONDAY, OCTOBER 3
M1 TDWI Analytics Fundamentals
M2 TDWI Performance Management: Dashboards, Scorecards, and Metrics for Real Business Impact
M3 Data Modeling in the Age of Big Data
M4 Overcoming Information Overload with Best Practices in Data Visualizations
M5A Business Analytics Centers of Excellence: Creating Federated and Grassroots Organizational and Governance Models
M5P The Secrets of Analytical Leaders: The Keys to Succeeding with BI and Analytics
DS1 Data Science Bootcamp // An Overview of Data Science
DS2 Data Science Bootcamp // Data Sourcing and Preparation for Data Science
M7A CBIP Preparation for the Information Systems Core Exam
M7P CBIP Preparation for the Data Warehousing Exam
TUESDAY, OCTOBER 4
T1 TDWI Predictive Analytics Fundamentals
T2 TDWI Data Governance Fundamentals: Managing Data as an Asset
T3A Data Strategy I: A Corporate Plan for Data
T3P Data Strategy II: Developing the Road Map
T4A Self-Service BI and Analytics: Turning the Promise into Reality
T4P Visualization Best Practice and Design Standards: Creating a Common Visual Vocabulary
T5A Social Data Analytics – Are You Ready to Start?
T5P Mobile Business Intelligence: Empowering the Mobile Enterprise
DS3 Data Science Bootcamp // Modeling Your Data: Building and Assessing Models
DS4 Data Science Bootcamp // Data Science in the Enterprise
T7A Real-time! Right now: Implementing IoT Data and Streaming Analytics to Drive Business Value
T7P Avoiding Disaster: Building a Successful Streaming Analytics Ecosystem for IoT and Real-time Data
T8A Data Discovery, Exploration, and More: The Latest Innovations in Analysis and BI Tools
T8P Delivering Data Faster: Innovations in Integration Tools
WEDNESDAY, OCTOBER 5
W1 TDWI Data Integration Principles and Practices: Creating Information Unity from Data Disparity
W2 Serious Play for Predictive Analytics: What Works, What Doesn’t, and Why
W3 Hands-on Data Mining with R
W4 Understanding Hadoop
W5A Big Data MBA: Developing an Actionable Big Data Business Strategy
W5P Creating an Analytically Driven Enterprise: Implementing an Analytics Program
W6A The Logical Data Warehouse as Agile Data Foundation for Analytics and Data Science
W6P New Data Storage Technologies: From Hadoop to Graph Databases, and from NoSQL to NewSQL
W7A Trend Spotting and Pattern Spotting: Seeing What Matters in Data Visualizations
W7P Data Pipelines: Workflow and Dataflow for Today’s Data Architectures
THURSDAY, OCTOBER 6
TH1 TDWI Data Governance Innovations: Adapting for Agile, Big Data, and Cloud
TH2 Data Preparation for Predictive Analytics
TH3 Practical Techniques for Aligning Business and IT: Navigating Politics and Culture
TH4 Data Management Tactics for Analytics
TH5 Advanced Analytics: Gaining Insight through Application
TH6 Hands-on Hadoop
TH7 Data Storytelling: The New Horizon in Business Analytics
FRIDAY, OCTOBER 7
F1 TDWI Data Quality Management: Techniques for Data Profiling, Assessment, and Improvement
F2 TDWI BI Program Management: A Competency Center Approach to BI Excellence
F3 Curating and Cataloging Data: Building a Data Marketplace for Analytics
F4A Big Data Juggling Act: Creating a Big Data Capability with Big Business Impact
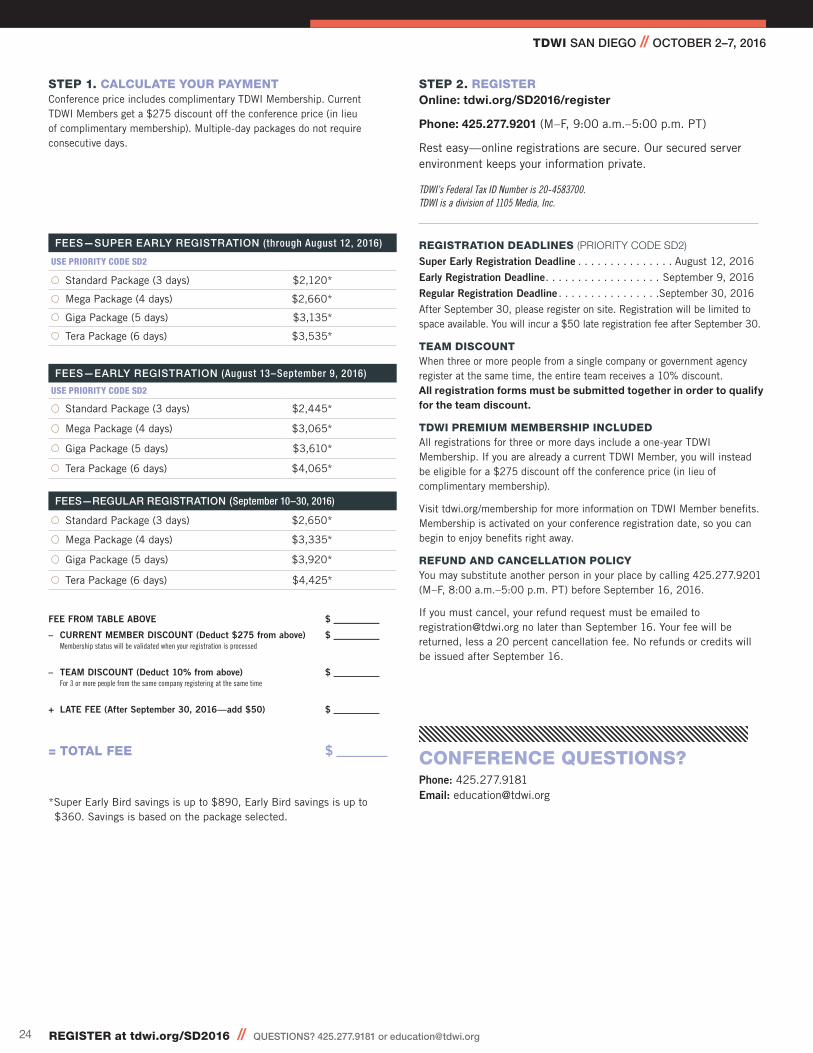
TDWI SAN DIEGO // OCTOBER 2–7, 2016
24 REGISTER at tdwi.org/SD2016 // QUESTIONS? 425.277.9181 or [email protected]
FEE FROM TABLE ABOVE $ __________
– CURRENT MEMBER DISCOUNT (Deduct $275 from above) $ __________ Membership status will be validated when your registration is processed
– TEAM DISCOUNT (Deduct 10% from above) $ __________ For 3 or more people from the same company registering at the same time
+ LATE FEE (After September 30, 2016—add $50) $ __________
= TOTAL FEE $ ___________
*Super Early Bird savings is up to $890, Early Bird savings is up to $360. Savings is based on the package selected.
STEP 1. CALCULATE YOUR PAYMENTConference price includes complimentary TDWI Membership. Current TDWI Members get a $275 discount off the conference price (in lieu of complimentary membership). Multiple-day packages do not require consecutive days.
FEES—SUPER EARLY REGISTRATION (through August 12, 2016)
USE PRIORITY CODE SD2
Standard Package (3 days) $2,120*
Mega Package (4 days) $2,660*
Giga Package (5 days) $3,135*
Tera Package (6 days) $3,535*
FEES—EARLY REGISTRATION (August 13–September 9, 2016)
USE PRIORITY CODE SD2
Standard Package (3 days) $2,445*
Mega Package (4 days) $3,065*
Giga Package (5 days) $3,610*
Tera Package (6 days) $4,065*
FEES—REGULAR REGISTRATION (September 10–30, 2016)
Standard Package (3 days) $2,650*
Mega Package (4 days) $3,335*
Giga Package (5 days) $3,920*
Tera Package (6 days) $4,425*
STEP 2. REGISTER Online: tdwi.org/SD2016/register
Phone: 425.277.9201 (M–F, 9:00 a.m.–5:00 p.m. PT)
Rest easy—online registrations are secure. Our secured server environment keeps your information private.
TDWI’s Federal Tax ID Number is 20-4583700. TDWI is a division of 1105 Media, Inc.
REGISTRATION DEADLINES (PRIORITY CODE SD2)
Super Early Registration Deadline . . . . . . . . . . . . . . . August 12, 2016
Early Registration Deadline. . . . . . . . . . . . . . . . . . September 9, 2016
Regular Registration Deadline . . . . . . . . . . . . . . . .September 30, 2016
After September 30, please register on site. Registration will be limited to space available. You will incur a $50 late registration fee after September 30.
TEAM DISCOUNT When three or more people from a single company or government agency register at the same time, the entire team receives a 10% discount. All registration forms must be submitted together in order to qualify for the team discount.
TDWI PREMIUM MEMBERSHIP INCLUDED All registrations for three or more days include a one-year TDWI Membership. If you are already a current TDWI Member, you will instead be eligible for a $275 discount off the conference price (in lieu of complimentary membership).
Visit tdwi.org/membership for more information on TDWI Member benefits. Membership is activated on your conference registration date, so you can begin to enjoy benefits right away.
REFUND AND CANCELLATION POLICY You may substitute another person in your place by calling 425.277.9201 (M–F, 8:00 a.m.–5:00 p.m. PT) before September 16, 2016.
If you must cancel, your refund request must be emailed to [email protected] no later than September 16. Your fee will be returned, less a 20 percent cancellation fee. No refunds or credits will be issued after September 16.
CONFERENCE QUESTIONS?Phone: 425.277.9181Email: [email protected]