Embed Size (px)
Citation preview
Analytical Uncertainties andDilution Techniques©2006
By Bill Hahn
© 2006 Spex CertiPrep, Inc, All Rights Reserved
Protocol/SPEX/CaledonWe manufacture organic and inorganic certified reference materials (CRM’s)Distributed in Canada by Caledon Laboratories.We have an ISO 9001-2000 quality systemWe were among the first NVLAP approved PT manufacturers.We are the first (and only so far) to be A2LA accredited for both Organic and Inorganic Reference materials via ISO-17025 and Guide 34. We were the first in the world to make, market and sell elemental calibration standards for OES……
© 2006 Spex CertiPrep, Inc, All Rights Reserved
Why talk about Uncertainties in Calibrations and Dilutions at all?
Evaluators of data have always been concerned with the uncertainty of a resultRequirements for analyzing uncertainties emerged with ISO 17025A point was put on it for us when we entered the NIST/NVLAP PT manufacturer programINELA and other standard setting bodies are requiring an estimate of uncertainty
© 2006 Spex CertiPrep, Inc, All Rights Reserved
Some of our observations relating to uncertainties and techniques
Chemists use a variety of techniques to dilute solutions and calibrate instruments.Many techniques in common practice contain an unacceptable amount of error and uncertainty.We wish to promote good laboratory practices and reduce the errors at the bench.The goal is to show how to derive uncertainties and illustrate some lab practices that will help chemists make better measurements.
© 2006 Spex CertiPrep, Inc, All Rights Reserved
What is uncertainty?
Uncertainty is a parameter, associated with the result of a measurement that defines the range of the values that could reasonably be attributed to the measured quantity.For the purposes of this talk, the expected variance around a calibration or testWhen uncertainty is evaluated and reported in a specified way it indicates the level of confidence that the value actually lies within the range defined by the uncertainty interval

© 2006 Spex CertiPrep, Inc, All Rights Reserved
What contributes to uncertainty
Any measurement is subject to imperfectionsRandom effects, such as short-term fluctuations in temperature, humidity, electricity, static and air-pressureVariability in the performance of the measurerUncertainty of the value of a reference standardSampling…..

© 2006 Spex CertiPrep, Inc, All Rights Reserved
Other contributors to uncertainty
Other imperfections are due to the practical limits to which correction can be made for systematic effects, such as offset of a measuring instrument, drift in its characteristics between calibrations or personal bias in reading an analog scale
© 2006 Spex CertiPrep, Inc, All Rights Reserved
Four Steps for Determining the Uncertainty of A Measurement
Step 1
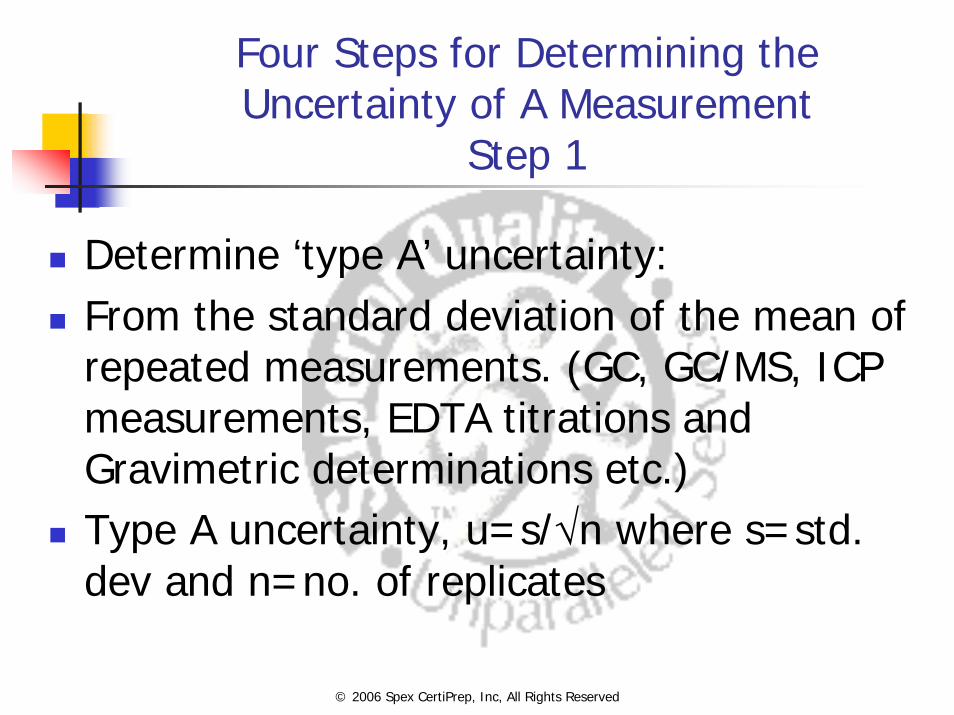
Determine ‘type A’ uncertainty:From the standard deviation of the mean of repeated measurements. (GC, GC/MS, ICP measurements, EDTA titrations and Gravimetric determinations etc.)Type A uncertainty, u=s/√n where s=std. dev and n=no. of replicates
© 2006 Spex CertiPrep, Inc, All Rights Reserved
Type B UncertaintyStep 2
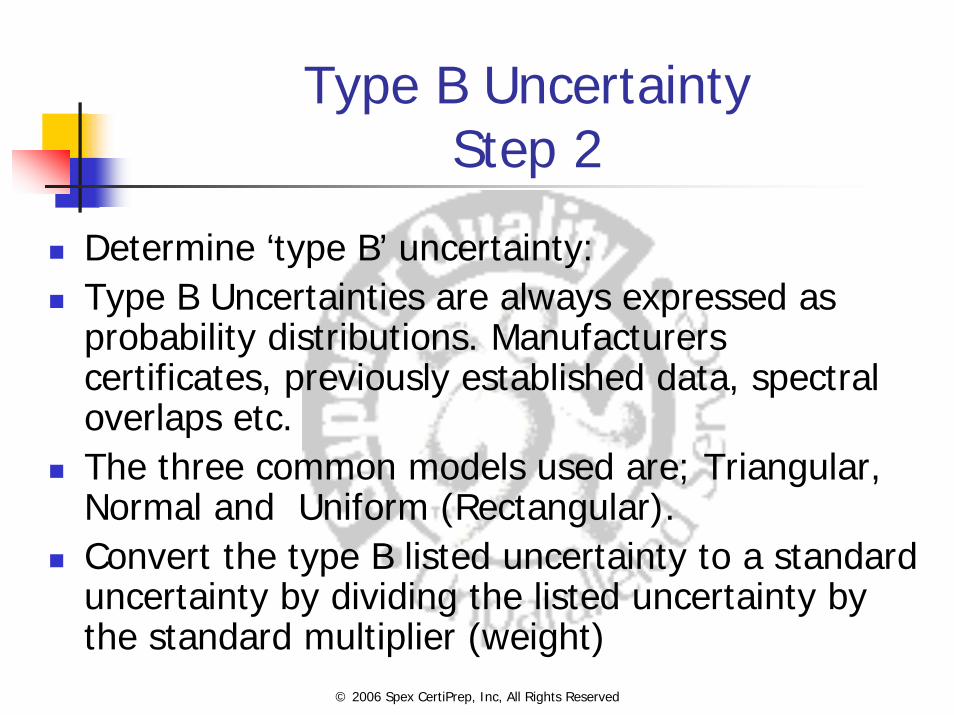
Determine ‘type B’ uncertainty:Type B Uncertainties are always expressed as probability distributions. Manufacturers certificates, previously established data, spectral overlaps etc.The three common models used are; Triangular, Normal and Uniform (Rectangular).Convert the type B listed uncertainty to a standard uncertainty by dividing the listed uncertainty by the standard multiplier (weight)

© 2006 Spex CertiPrep, Inc, All Rights Reserved
Type B (Triangular Distribution)
Use when the distribution is symmetric (values are closer to target) Ex: Uncertainties in volumetric lab wareStandard u= listed/√6
© 2006 Spex CertiPrep, Inc, All Rights Reserved
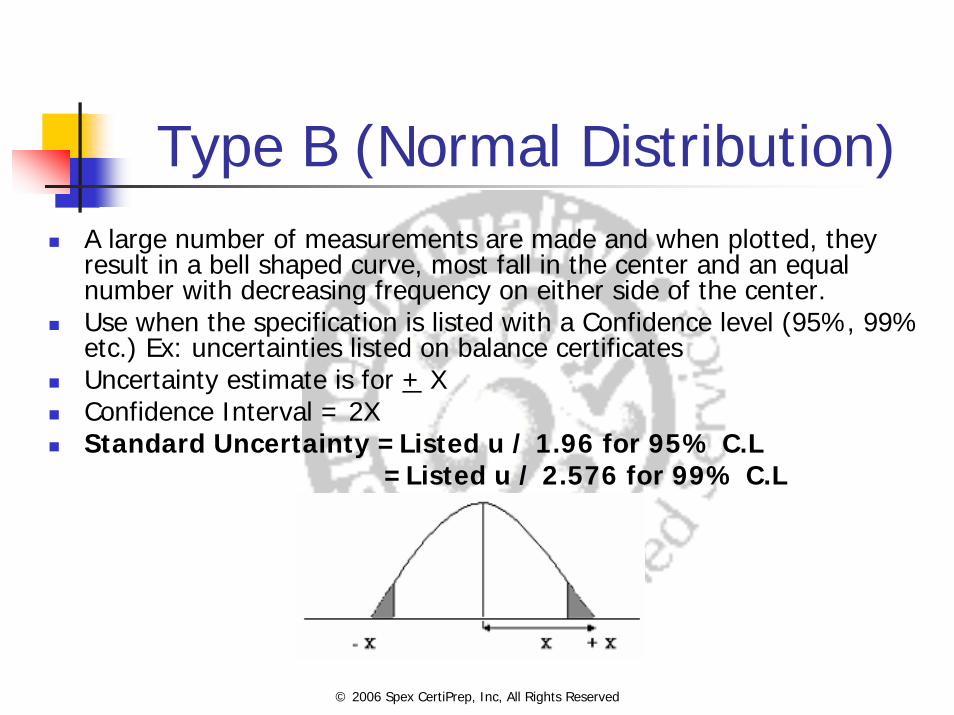
Type B (Normal Distribution)A large number of measurements are made and when plotted, they result in a bell shaped curve, most fall in the center and an equal number with decreasing frequency on either side of the center.Use when the specification is listed with a Confidence level (95%, 99% etc.) Ex: uncertainties listed on balance certificatesUncertainty estimate is for + XConfidence Interval = 2XStandard Uncertainty =Listed u / 1.96 for 95% C.L
=Listed u / 2.576 for 99% C.L

© 2006 Spex CertiPrep, Inc, All Rights Reserved
Type B (Uniform or Rectangular Distribution)
The rectangular distribution is a reasonable default model in the absence of any other information, with no knowledge of the shape of the distribution.Use when the specification is listed with no confidence limits Ex: Uncertainties listed on the certificates for SRM, CRM’sStandard u= listed/√3

© 2006 Spex CertiPrep, Inc, All Rights Reserved
Estimation of Combined UncertaintyStep 3
Combine Type A and Type B uncertainties using rules for calculating the propagation of errors. There are two types of statistical models:For models involving only sum or difference of quantities of the type x=(p+q+r+…), the combined standard uncertainty is the Square Root of the Sum of the Squares (RSS).
uC = [u(p)2 + u(q)2 + u(r)2 ]1/2
© 2006 Spex CertiPrep, Inc, All Rights Reserved
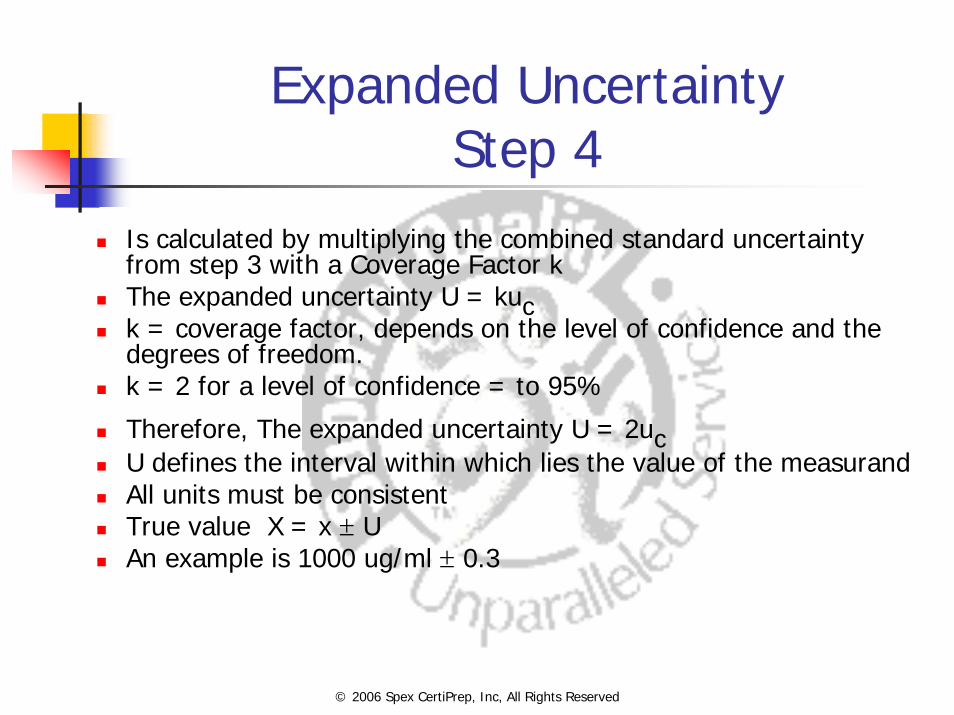
Expanded UncertaintyStep 4
Is calculated by multiplying the combined standard uncertainty from step 3 with a Coverage Factor kThe expanded uncertainty U = kuck = coverage factor, depends on the level of confidence and the degrees of freedom.k = 2 for a level of confidence = to 95%
Therefore, The expanded uncertainty U = 2ucU defines the interval within which lies the value of the measurandAll units must be consistentTrue value X = x ± UAn example is 1000 ug/ml ± 0.3
© 2006 Spex CertiPrep, Inc, All Rights Reserved
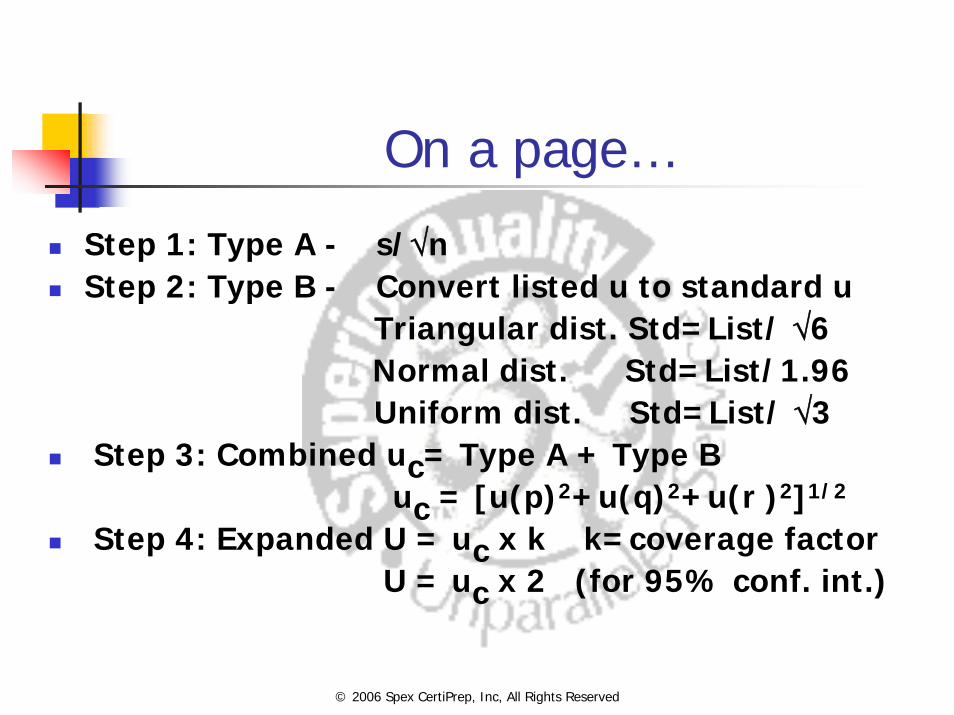
On a page…
Step 1: Type A - s/√nStep 2: Type B - Convert listed u to standard u
Triangular dist. Std=List/ √6Normal dist. Std=List/1.96Uniform dist. Std=List/ √3
Step 3: Combined uc= Type A + Type Buc = [u(p)2+u(q)2+u(r )2]1/2
Step 4: Expanded U = uc x k k=coverage factorU = uc x 2 (for 95% conf. int.)
© 2006 Spex CertiPrep, Inc, All Rights Reserved
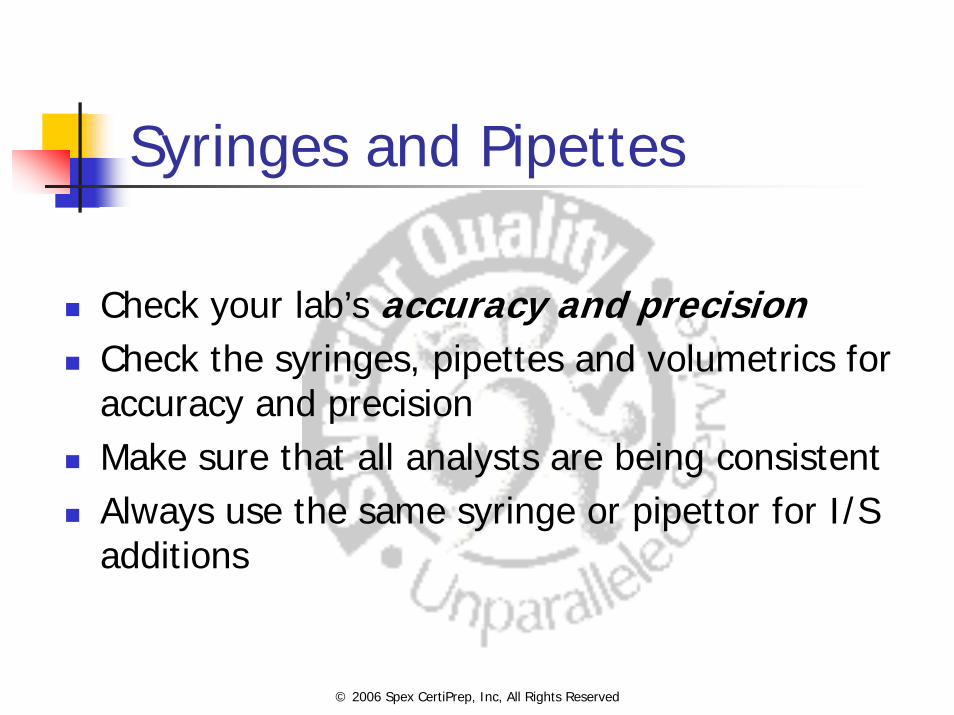
Syringes and Pipettes
Check your lab’s accuracy and precisionCheck the syringes, pipettes and volumetrics for accuracy and precisionMake sure that all analysts are being consistentAlways use the same syringe or pipettor for I/S additions
© 2006 Spex CertiPrep, Inc, All Rights Reserved
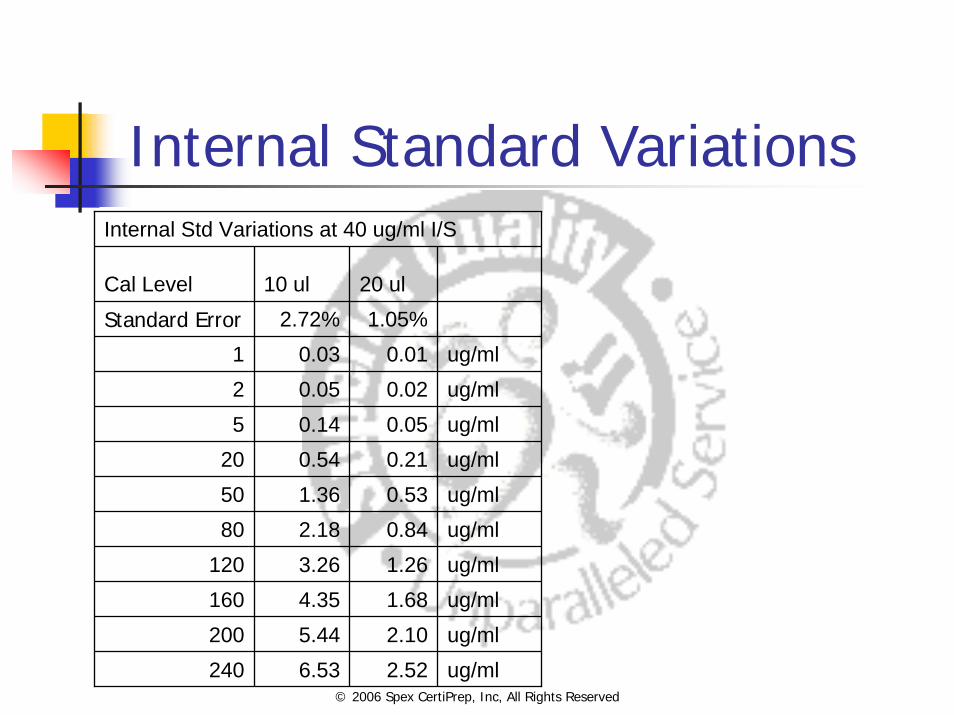
Internal Standard VariationsInternal Std Variations at 40 ug/ml I/S
Cal Level 10 ul 20 ul
Standard Error 2.72% 1.05%1 0.03 0.01 ug/ml2 0.05 0.02 ug/ml5 0.14 0.05 ug/ml
20 0.54 0.21 ug/ml50 1.36 0.53 ug/ml80 2.18 0.84 ug/ml
120 3.26 1.26 ug/ml160 4.35 1.68 ug/ml200 5.44 2.10 ug/ml240 6.53 2.52 ug/ml
© 2006 Spex CertiPrep, Inc, All Rights Reserved
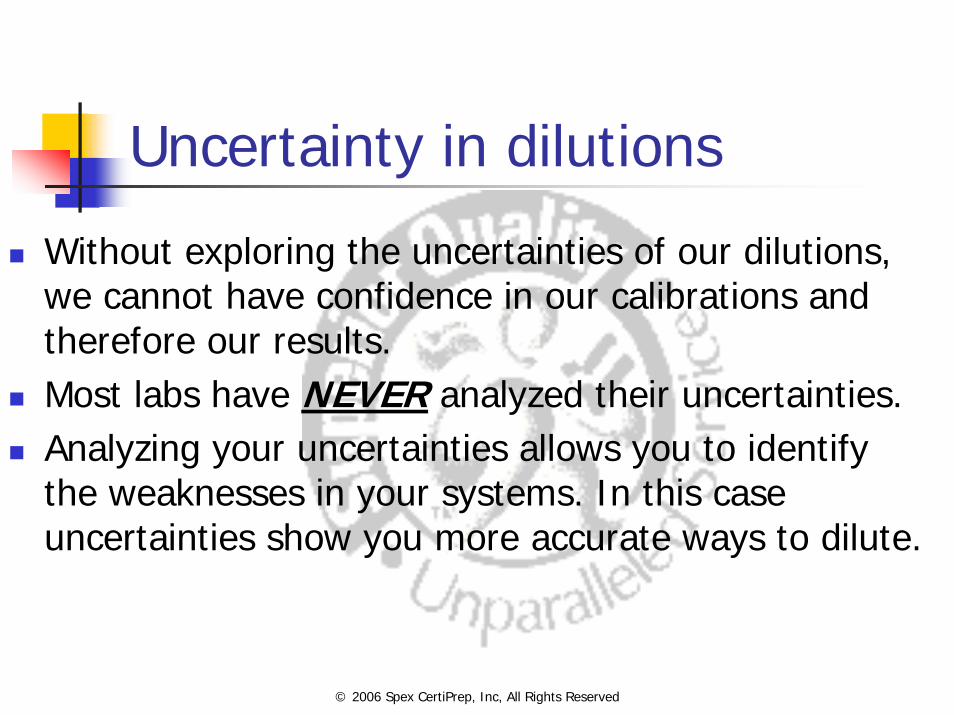
Uncertainty in dilutions
Without exploring the uncertainties of our dilutions, we cannot have confidence in our calibrations and therefore our results.Most labs have NEVER analyzed their uncertainties.Analyzing your uncertainties allows you to identify the weaknesses in your systems. In this case uncertainties show you more accurate ways to dilute.
© 2006 Spex CertiPrep, Inc, All Rights Reserved
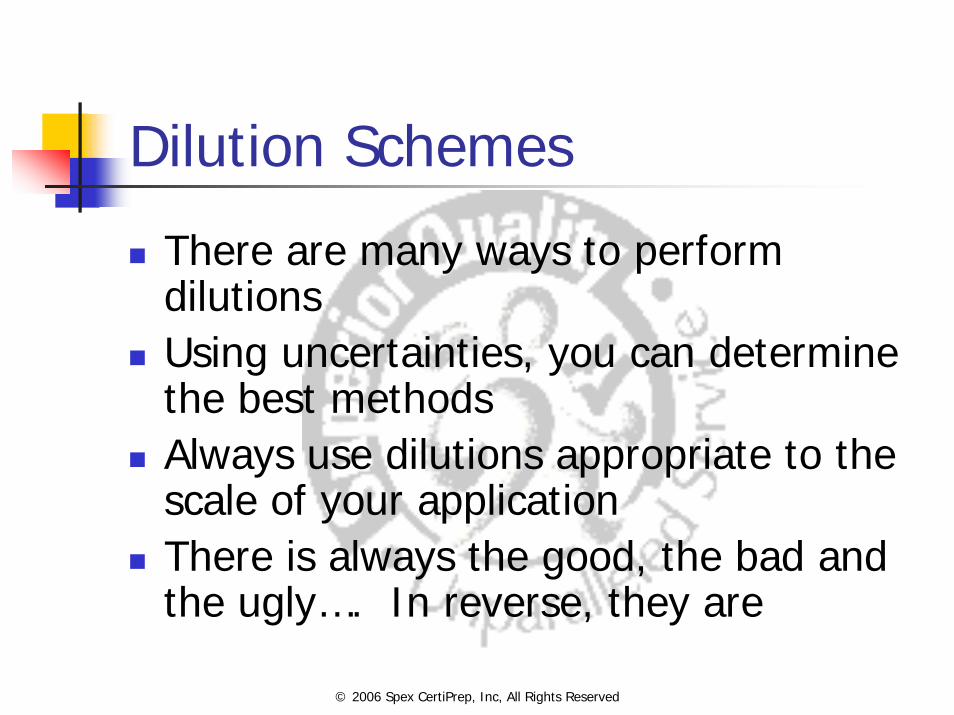
Dilution Schemes
There are many ways to perform dilutionsUsing uncertainties, you can determine the best methodsAlways use dilutions appropriate to the scale of your applicationThere is always the good, the bad and the ugly…. In reverse, they are
© 2006 Spex CertiPrep, Inc, All Rights Reserved
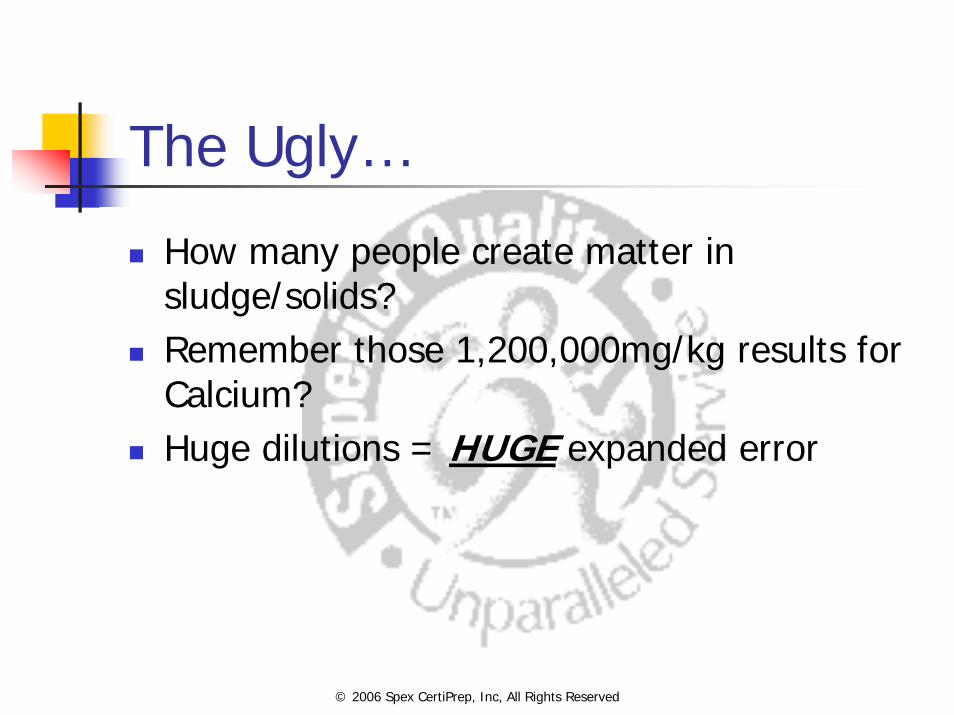
The Ugly…
How many people create matter in sludge/solids?Remember those 1,200,000mg/kg results for Calcium?Huge dilutions = HUGE expanded error
© 2006 Spex CertiPrep, Inc, All Rights Reserved
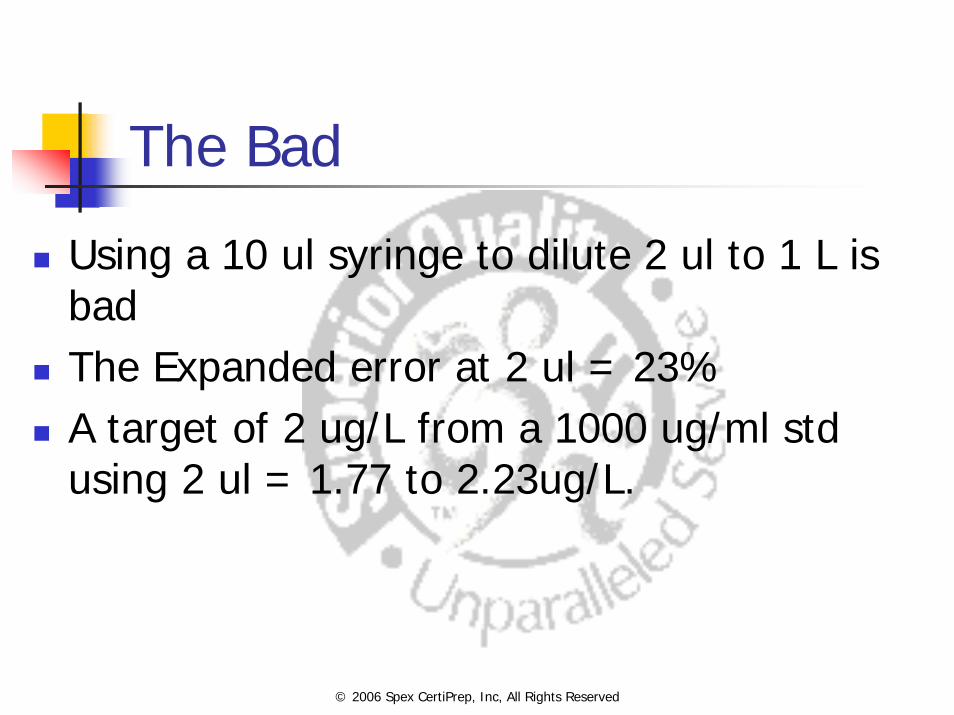
The Bad
Using a 10 ul syringe to dilute 2 ul to 1 L is badThe Expanded error at 2 ul = 23%A target of 2 ug/L from a 1000 ug/ml std using 2 ul = 1.77 to 2.23ug/L.

© 2006 Spex CertiPrep, Inc, All Rights Reserved
The Good
Use dilutions that are within the 100x level of your working volumes, when using syringes and 1000x when using pipettesUse at least 50% of your syringe volumesUse calibrated pipettes and glassware
© 2006 Spex CertiPrep, Inc, All Rights Reserved
An experiment in syringe use and uncertainty
We had 7 people weigh various volumes with various size syringes.There were 7 observations at each volume.We took a type A uncertainty and converted it to a type B uncertainty

© 2006 Spex CertiPrep, Inc, All Rights Reserved
Measure of liquid from syringes(1 of seven)
Chemist 1 H2O
1 2 3 4 5 6 7
2 ul from a 10 ul syringe 0.00205 0.00185 0.00182 0.00174 0.0019 0.00183 0.00191
5 ul from a 10 ul syringe 0.00508 0.00481 0.00465 0.00479 0.00494 0.00483 0.00463
10 ul from a 10 ul syringe 0.00967 0.00971 0.00969 0.0096 0.00989 0.00975 0.00969
5 ul from a 25 ul syringe 0.00489 0.00475 0.00485 0.00469 0.00459 0.0047 0.00461
10 ul from a 25 ul syringe 0.0096 0.00948 0.00959 0.00964 0.00963 0.00955 0.00958
25 ul from a 25 ul syringe 0.02427 0.02432 0.02415 0.02436 0.0246 0.02434 0.02431
10 ul from a 100 ul syringe 0.00984 0.00995 0.00971 0.00988 0.00992 0.01016 0.00973
25 ul from a 100 ul syringe 0.02447 0.02473 0.02469 0.02464 0.02461 0.02483 0.02481
50 ul from a 100 ul syringe 0.05008 0.04967 0.04964 0.05017 0.05002 0.0503 0.04975
250 ul from a 1000 ul syringe 0.25132 0.24409 0.2456 0.24615 0.24696 0.24694 0.24667
500 ul from a 1000 ul syringe 0.4991 0.49732 0.49673 0.49867 0.49795 0.497 0.4968
1000 ul from a 1000 ul syringe 0.99901 0.99883 0.99833 0.99801 0.99923 0.995 0.9974

Mean syringe observations (H2O)and Uncertainties
avg mean uC U (Expanded) Exp Err as a %
2 ul from a 10 ul syringe 2.15 0.2493 0.4986 23.15%5 ul from a 10 ul syringe 5.04 0.2058 0.4116 8.16%10 ul from a 10 ul syringe 9.9 0.1346 0.2692 2.72%2 ul from a 25 ul syringe 2.19 0.0967 0.1934 8.82%5 ul from a 25 ul syringe 5.06 0.1383 0.2766 5.47%10 ul from a 25 ul syringe 9.94 0.1179 0.2358 2.37%20 ul from a 25 ul syringe 20 0.1054 0.2108 1.05%25 ul from a 25 ul syringe 24.7 0.1538 0.3077 1.25%10 ul from a 100 ul syringe 10.18 0.3102 0.6205 6.09%25 ul from a 100 ul syringe 25.06 0.209 0.4181 1.67%50 ul from a 100 ul syringe 50.19 0.1612 0.3224 0.64%100 ul from a 100 ul syringe 100.43 0.3042 0.6083 0.61%250 ul from a 1000 ul syringe 250.82 1.3204 2.6409 1.05%500 ul from a 1000 ul syringe 501.93 2.8685 5.737 1.14%1000 ul from a 1000 ul syringe 996.95 2.3662 4.7325 0.47%
© 2006 Spex CertiPrep, Inc, All Rights Reserved
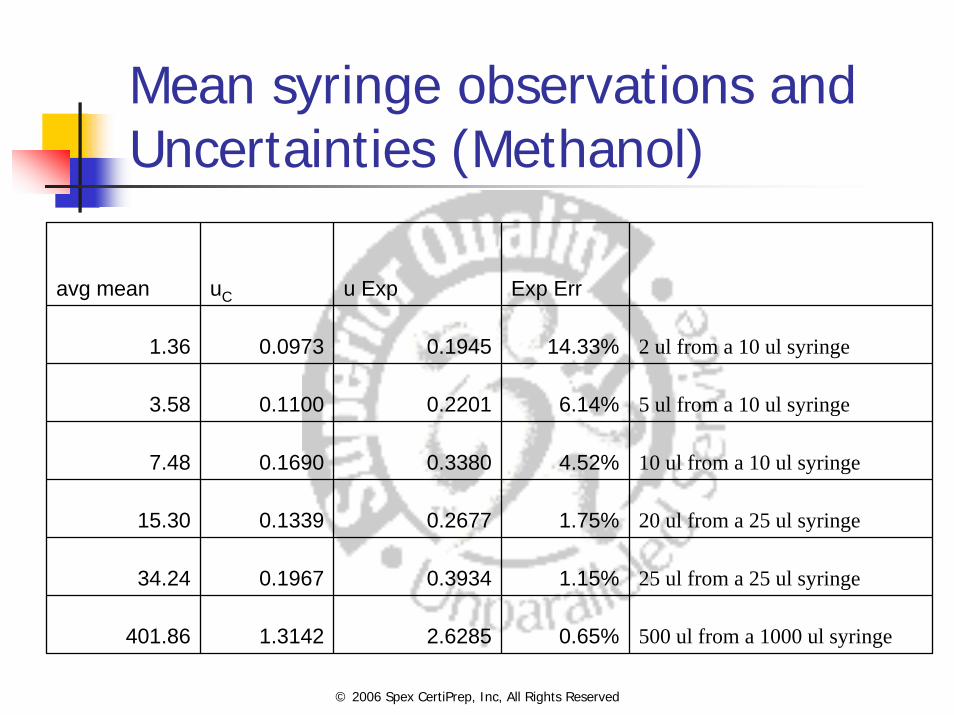
Mean syringe observations and Uncertainties (Methanol)
avg mean uC u Exp Exp Err
1.36 0.0973 0.1945 14.33% 2 ul from a 10 ul syringe
3.58 0.1100 0.2201 6.14% 5 ul from a 10 ul syringe
7.48 0.1690 0.3380 4.52% 10 ul from a 10 ul syringe
15.30 0.1339 0.2677 1.75% 20 ul from a 25 ul syringe
34.24 0.1967 0.3934 1.15% 25 ul from a 25 ul syringe
401.86 1.3142 2.6285 0.65% 500 ul from a 1000 ul syringe
© 2006 Spex CertiPrep, Inc, All Rights Reserved
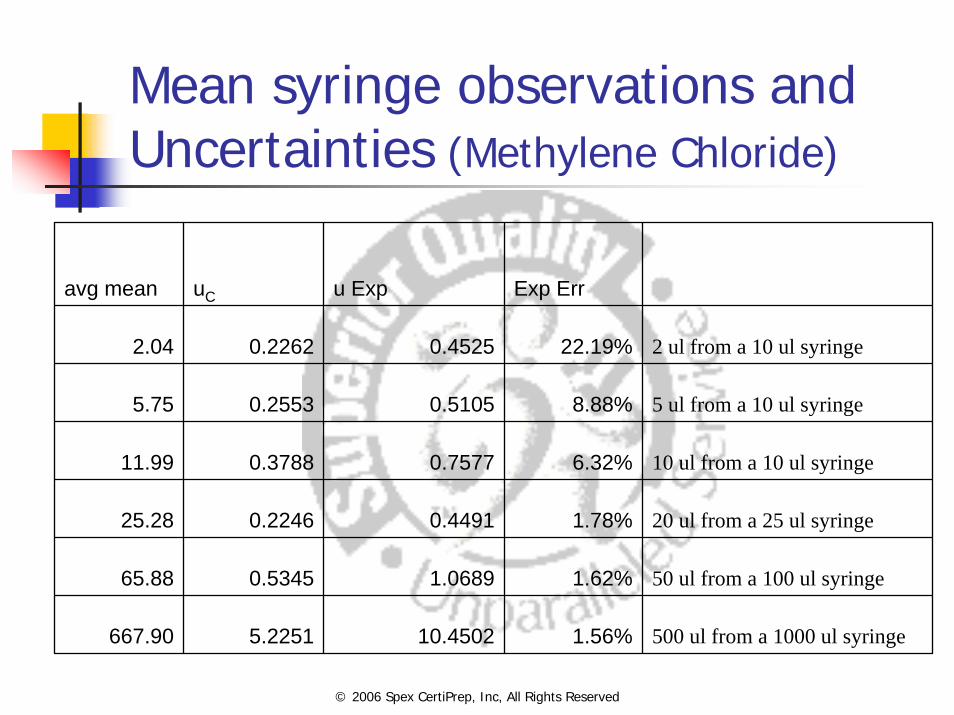
Mean syringe observations and Uncertainties (Methylene Chloride)
avg mean uC u Exp Exp Err
2.04 0.2262 0.4525 22.19% 2 ul from a 10 ul syringe
5.75 0.2553 0.5105 8.88% 5 ul from a 10 ul syringe
11.99 0.3788 0.7577 6.32% 10 ul from a 10 ul syringe
25.28 0.2246 0.4491 1.78% 20 ul from a 25 ul syringe
65.88 0.5345 1.0689 1.62% 50 ul from a 100 ul syringe
667.90 5.2251 10.4502 1.56% 500 ul from a 1000 ul syringe
© 2006 Spex CertiPrep, Inc, All Rights Reserved
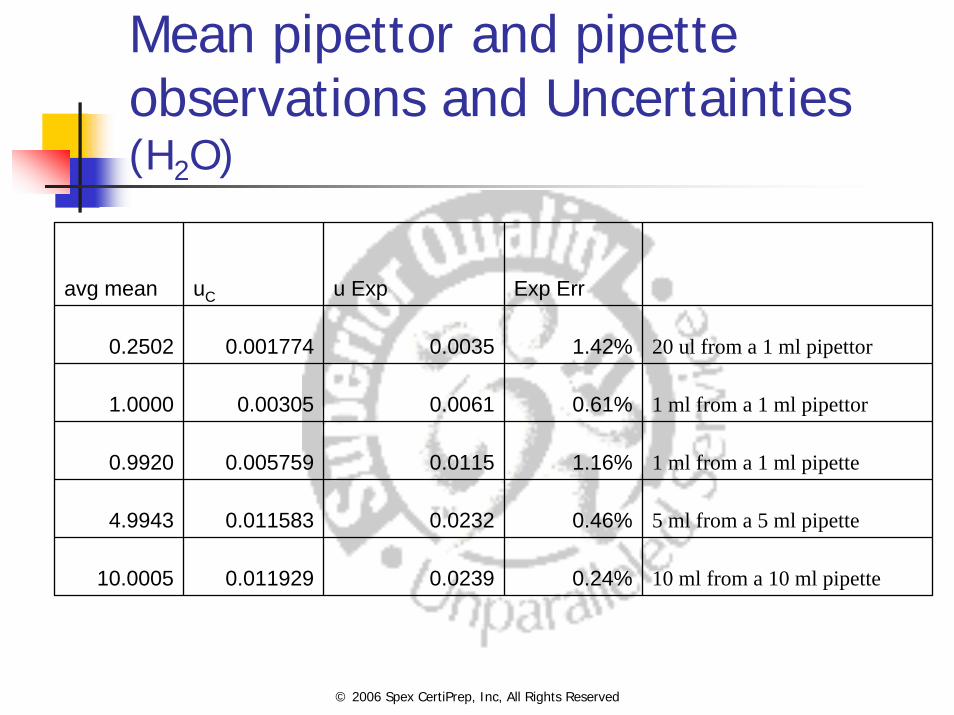
Mean pipettor and pipette observations and Uncertainties(H2O)
avg mean uC u Exp Exp Err
0.2502 0.001774 0.0035 1.42% 20 ul from a 1 ml pipettor
1.0000 0.00305 0.0061 0.61% 1 ml from a 1 ml pipettor
0.9920 0.005759 0.0115 1.16% 1 ml from a 1 ml pipette
4.9943 0.011583 0.0232 0.46% 5 ml from a 5 ml pipette
10.0005 0.011929 0.0239 0.24% 10 ml from a 10 ml pipette
© 2006 Spex CertiPrep, Inc, All Rights Reserved
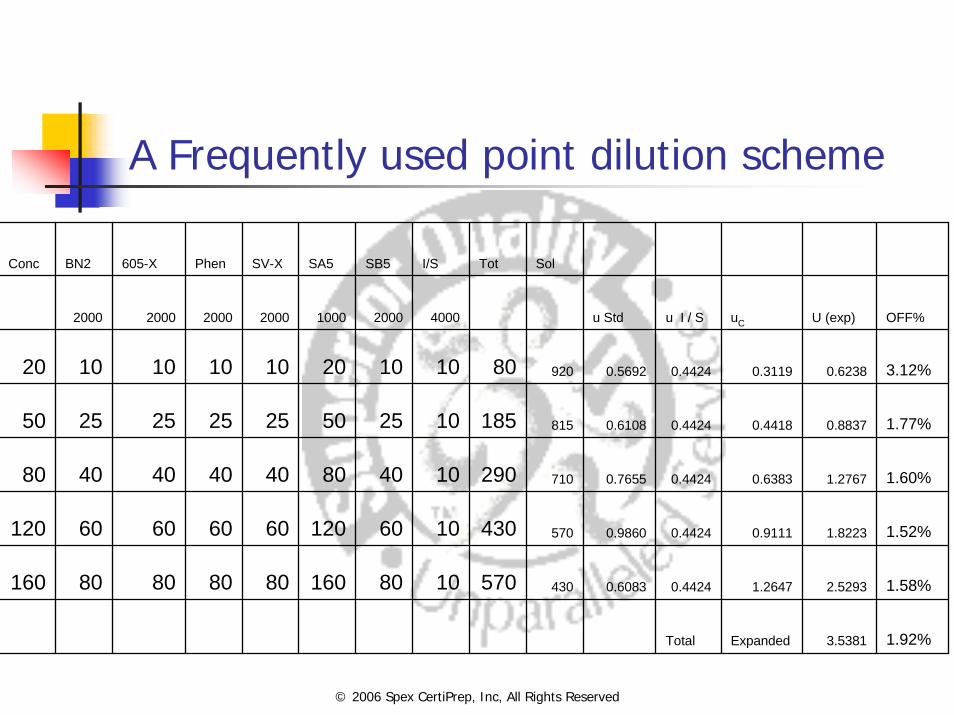
A Frequently used point dilution scheme
Conc BN2 605-X Phen SV-X SA5 SB5 I/S Tot Sol
2000 2000 2000 2000 1000 2000 4000 u Std u I / S uC U (exp) OFF%
20 10 10 10 10 20 10 10 80 920 0.5692 0.4424 0.3119 0.6238 3.12%
50 25 25 25 25 50 25 10 185 815 0.6108 0.4424 0.4418 0.8837 1.77%
80 40 40 40 40 80 40 10 290 710 0.7655 0.4424 0.6383 1.2767 1.60%
120 60 60 60 60 120 60 10 430 570 0.9860 0.4424 0.9111 1.8223 1.52%
160 80 80 80 80 160 80 10 570 430 0.6083 0.4424 1.2647 2.5293 1.58%
Total Expanded 3.5381 1.92%

© 2006 Spex CertiPrep, Inc, All Rights Reserved
Cumbersome……
Without total isolation while performing these dilutions, errors are almost guaranteedThere are many uncertainties that are not captured by mathCombining all of the uncertainties illustrates a 3.03% curve uncertainty

© 2006 Spex CertiPrep, Inc, All Rights Reserved
Serial Dilutions
Conc uL Expected error160 800 0.76%120 0.75 1.14%
80 0.5 1.34%50 0.3125 1.18%20 0.125 1.97%
Average Error 1.28%

© 2006 Spex CertiPrep, Inc, All Rights Reserved
Serial Dilutions (continued)
Combining all of the uncertainties illustrates a 1.28% curve variabilityOffers more accuracy (21% less uncertainty)This will cause less failures (~5% in PT’s) and more accurate results
© 2006 Spex CertiPrep, Inc, All Rights Reserved
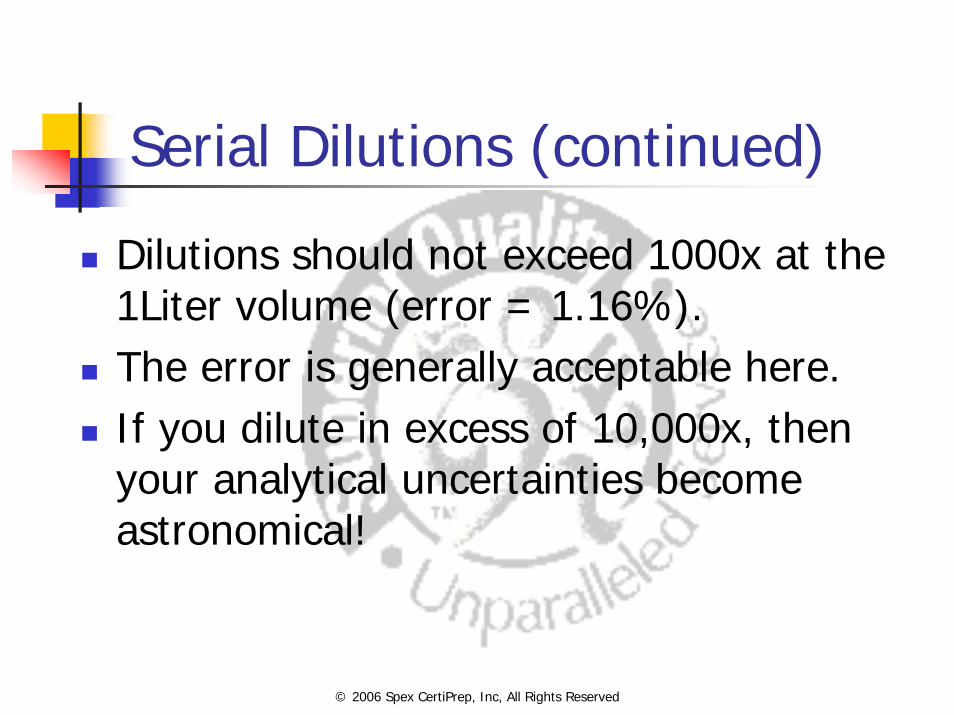
Serial Dilutions (continued)
Dilutions should not exceed 1000x at the 1Liter volume (error = 1.16%).The error is generally acceptable here.If you dilute in excess of 10,000x, then your analytical uncertainties become astronomical!
© 2006 Spex CertiPrep, Inc, All Rights Reserved
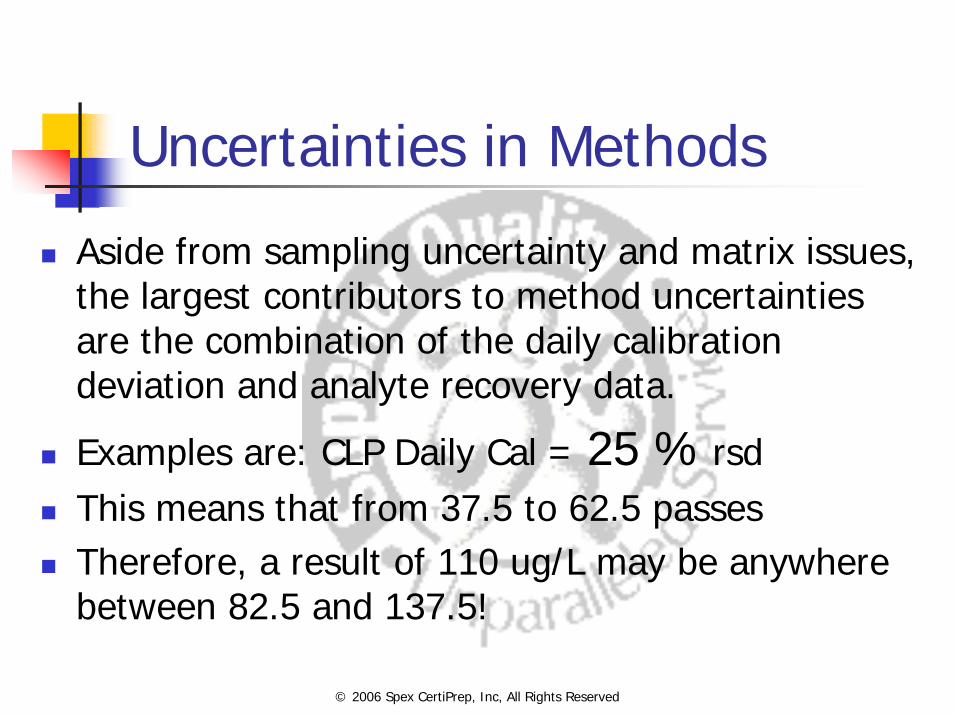
Uncertainties in Methods
Aside from sampling uncertainty and matrix issues, the largest contributors to method uncertainties are the combination of the daily calibration deviation and analyte recovery data.
Examples are: CLP Daily Cal = 25 % rsdThis means that from 37.5 to 62.5 passesTherefore, a result of 110 ug/L may be anywhere between 82.5 and 137.5!
© 2006 Spex CertiPrep, Inc, All Rights Reserved
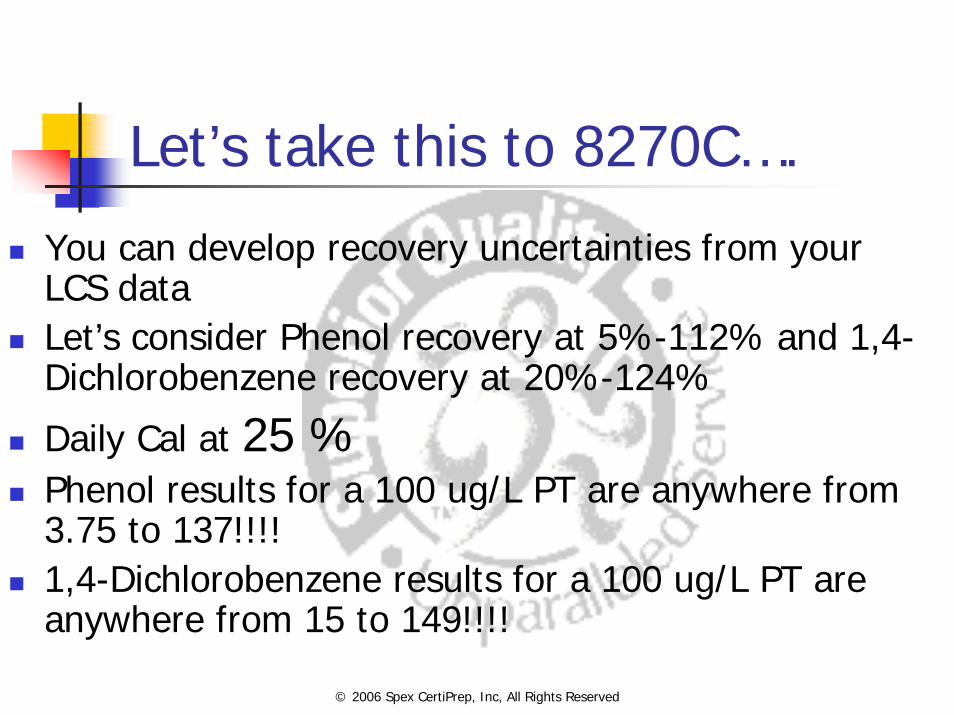
Let’s take this to 8270C….
You can develop recovery uncertainties from your LCS dataLet’s consider Phenol recovery at 5%-112% and 1,4-Dichlorobenzene recovery at 20%-124%
Daily Cal at 25 %Phenol results for a 100 ug/L PT are anywhere from 3.75 to 137!!!!1,4-Dichlorobenzene results for a 100 ug/L PT are anywhere from 15 to 149!!!!

© 2006 Spex CertiPrep, Inc, All Rights Reserved
8270 (continued)
This is real data published in 8270CWith INELA and other new standards calling for uncertainties, expect legal issues to ariseFor an end user of data, seeing a 9ppb result for 1,4-Dichlorobenzene and knowing the uncertainties, he has to wonder if the real concentration is 7 or 60ppb!!
© 2006 Spex CertiPrep, Inc, All Rights Reserved
Uncertainty requirements are a whisper away…
Many labs are not yet affected by the requirements for estimates of uncertainty…but the may be soon.We have seen approaches such as using amassed LCS data to calculate analytical uncertainty, calibration drift over time using RRF’s, PT data, QC data, etc.Taking ALL uncertainties can cause more confusion concerning the evaluation of data than is truly warranted. Eg You cannot always control sampling
© 2006 Spex CertiPrep, Inc, All Rights Reserved
Whatever your methods
ValidateValidateValidateValidate
© 2006 Spex CertiPrep, Inc, All Rights Reserved
ReferencesReferencesISO Guide 17025: Certification of Reference Materials, general and statistical principlesASTM Guide D6362-98ILAC-G21-2000ISO/REMCO N280EURACHEM/CITAC Guide, Second Edition ISO Guidelines for Uncertainty Calculations for Chemical Analysis: NCSL, Robert Watters and Mark Levenson-NISTMethod Validation and Measurement Uncertainty: Advanced Concepts in Analytical Quality Assurance: WolfhardWegscheider-Symposium at NIST NIST Technical Note 1297 Guide to the Expression of Uncertainty in Measurement (1995)

Thank You!We Want You to Be Successful
Call us for technical assistance!Caledon 1-877-Caledon (225-3366)or 905-877-0101
SPEX 1-800-LAB-SPEX or (732) 549-7144 Email to [email protected] Bill Hahn at 732-752-3479


![Imperfections in Solids [Autosaved]](https://img.pdfslide.us/doc/110x75/56d6bcc11a28ab30168b54f1/imperfections-in-solids-autosaved.jpg)