Embed Size (px)
Citation preview
CONFIDENTIAL
vrije Universiteit amsterdam © 2009 Vrije Universiteit, Amsterdam
Analytical Techniques for the determination of sulphur components in flue gas, fuel gas and natural gas
Tim Lenior
Literature thesis Chemistry, Analytical Sciences
Page 2
vrije Universiteit amsterdam rev1
Analytical Techniques for the determination of sulphur components in flue gas, fuel gas and natural gas
Tim Lenior
Literature thesis chemistry, Analytical Sciences
VU University
Faculty of Exact Sciences Department of Analytical Chemistry & Applied Spectroscopy
De Boelelaan 1083 1081HV Amsterdam
August 2009
Page 3
vrije Universiteit amsterdam rev1
Contents:
1 Introduction ............................................................................................................. 5
2 Discussion of studied literature ............................................................................. 6
2.1 SOx emission trends (1): .............................................................................................. 7
2.2 The Industries .............................................................................................................. 10 2.2.1 Power plants: ......................................................................................................................... 10 2.2.2 Refineries: .............................................................................................................................. 11 2.2.3 Natural gas: ........................................................................................................................... 13
2.3 The analyses of H2S and other sulphur containing components in gasses .......... 13 2.3.1 Emission levels ...................................................................................................................... 14 2.3.2 Analytical techniques ............................................................................................................. 14 2.3.3 The dynamic ranges & detection limits (LOD) ....................................................................... 15 2.3.4 Repeatability .......................................................................................................................... 16 2.3.5 Analytical speed ..................................................................................................................... 17 2.3.6 Gas Chromatography (GC) ................................................................................................... 17 2.3.7 Lead acetate tape technology ............................................................................................... 20 2.3.8 UV Spectrometry ................................................................................................................... 21 2.3.9 Diode array spectroscopy ...................................................................................................... 23 2.3.10 Tunable Diode Laser Absorption Spectroscopy (TDLAS) ..................................................... 24 2.3.11 X-Ray spectroscopy ............................................................................................................... 26 2.3.12 Cavity Ring-Down Spectroscopy (CRDS) ............................................................................. 27 2.3.13 Photo-ionisation, Titrimetric, and Conductimetric .................................................................. 27
3 Personal critical opinion ....................................................................................... 28
4 Conclusions ........................................................................................................... 30
5 Literature list .......................................................................................................... 32
6 Appendix ................................................................................................................ 34
6.1 Appendix 1: ASTM (American Standard Test Methods) (20) ................................... 34
Page 4
vrije Universiteit amsterdam rev1
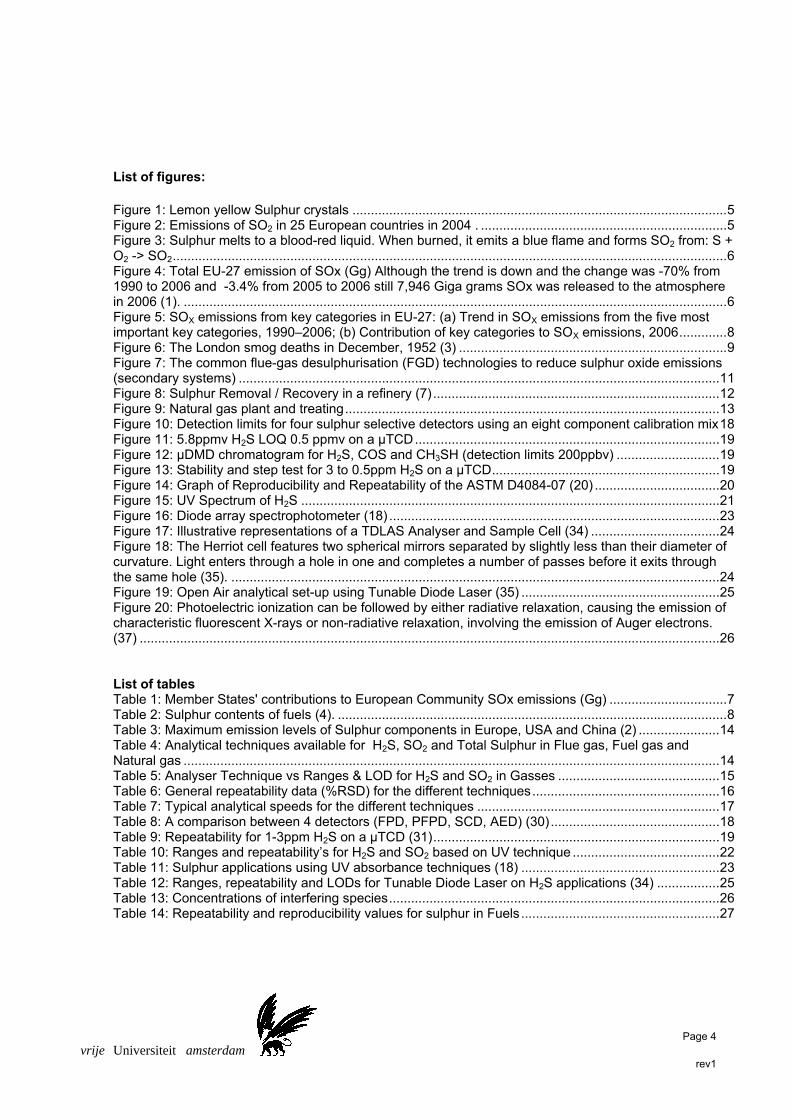
List of figures: Figure 1: Lemon yellow Sulphur crystals ...................................................................................................... 5 Figure 2: Emissions of SO2 in 25 European countries in 2004 . ................................................................... 5 Figure 3: Sulphur melts to a blood-red liquid. When burned, it emits a blue flame and forms SO2 from: S + O2 -> SO2 ....................................................................................................................................................... 6 Figure 4: Total EU-27 emission of SOx (Gg) Although the trend is down and the change was -70% from 1990 to 2006 and -3.4% from 2005 to 2006 still 7,946 Giga grams SOx was released to the atmosphere in 2006 (1). .................................................................................................................................................... 6 Figure 5: SOX emissions from key categories in EU-27: (a) Trend in SOX emissions from the five most important key categories, 1990–2006; (b) Contribution of key categories to SOX emissions, 2006 ............. 8 Figure 6: The London smog deaths in December, 1952 (3) ......................................................................... 9 Figure 7: The common flue-gas desulphurisation (FGD) technologies to reduce sulphur oxide emissions (secondary systems) ................................................................................................................................... 11 Figure 8: Sulphur Removal / Recovery in a refinery (7) .............................................................................. 12 Figure 9: Natural gas plant and treating ...................................................................................................... 13 Figure 10: Detection limits for four sulphur selective detectors using an eight component calibration mix 18 Figure 11: 5.8ppmv H2S LOQ 0.5 ppmv on a µTCD ................................................................................... 19 Figure 12: μDMD chromatogram for H2S, COS and CH3SH (detection limits 200ppbv) ............................ 19 Figure 13: Stability and step test for 3 to 0.5ppm H2S on a µTCD .............................................................. 19 Figure 14: Graph of Reproducibility and Repeatability of the ASTM D4084-07 (20) .................................. 20 Figure 15: UV Spectrum of H2S .................................................................................................................. 21 Figure 16: Diode array spectrophotometer (18) .......................................................................................... 23 Figure 17: Illustrative representations of a TDLAS Analyser and Sample Cell (34) ................................... 24 Figure 18: The Herriot cell features two spherical mirrors separated by slightly less than their diameter of curvature. Light enters through a hole in one and completes a number of passes before it exits through the same hole (35). ..................................................................................................................................... 24 Figure 19: Open Air analytical set-up using Tunable Diode Laser (35) ...................................................... 25 Figure 20: Photoelectric ionization can be followed by either radiative relaxation, causing the emission of characteristic fluorescent X-rays or non-radiative relaxation, involving the emission of Auger electrons. (37) .............................................................................................................................................................. 26 List of tables Table 1: Member States' contributions to European Community SOx emissions (Gg) ................................ 7 Table 2: Sulphur contents of fuels (4). .......................................................................................................... 8 Table 3: Maximum emission levels of Sulphur components in Europe, USA and China (2) ...................... 14 Table 4: Analytical techniques available for H2S, SO2 and Total Sulphur in Flue gas, Fuel gas and Natural gas .................................................................................................................................................. 14 Table 5: Analyser Technique vs Ranges & LOD for H2S and SO2 in Gasses ............................................ 15 Table 6: General repeatability data (%RSD) for the different techniques ................................................... 16 Table 7: Typical analytical speeds for the different techniques .................................................................. 17 Table 8: A comparison between 4 detectors (FPD, PFPD, SCD, AED) (30) .............................................. 18 Table 9: Repeatability for 1-3ppm H2S on a µTCD (31) .............................................................................. 19 Table 10: Ranges and repeatability’s for H2S and SO2 based on UV technique ........................................ 22 Table 11: Sulphur applications using UV absorbance techniques (18) ...................................................... 23 Table 12: Ranges, repeatability and LODs for Tunable Diode Laser on H2S applications (34) ................. 25 Table 13: Concentrations of interfering species .......................................................................................... 26 Table 14: Repeatability and reproducibility values for sulphur in Fuels ...................................................... 27
Page 5
vrije Universiteit amsterdam rev1
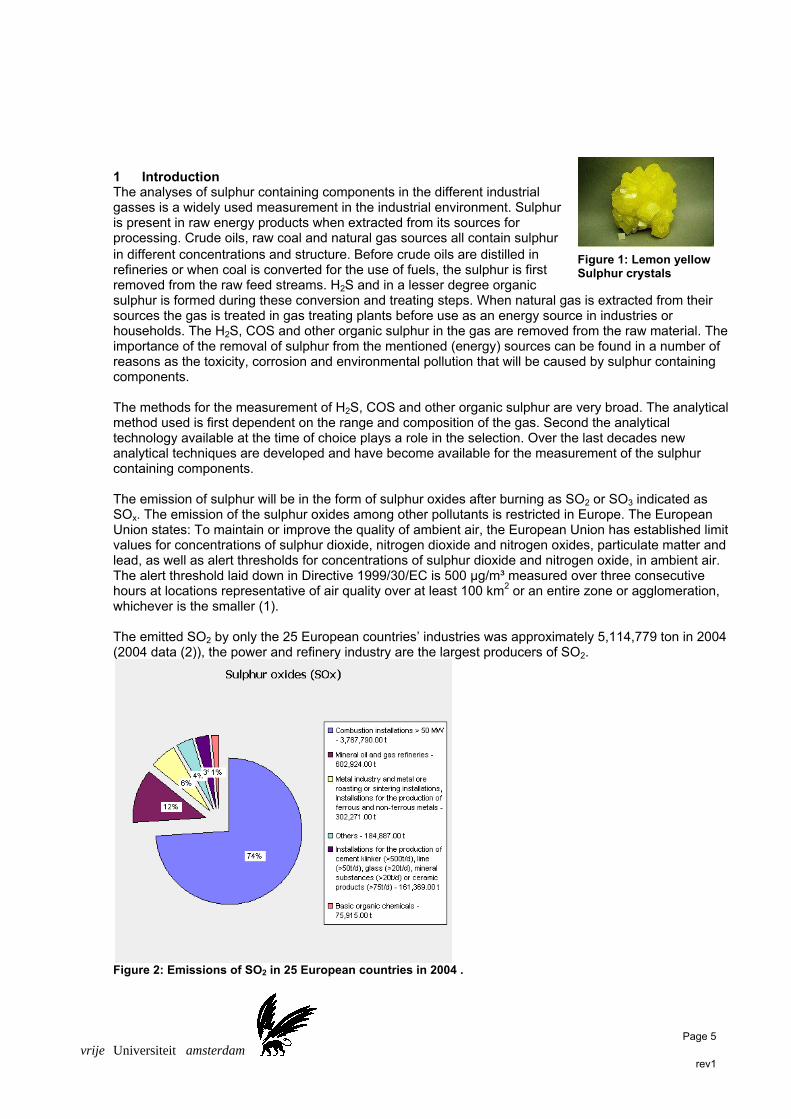
1 Introduction The analyses of sulphur containing components in the different industrial gasses is a widely used measurement in the industrial environment. Sulphur is present in raw energy products when extracted from its sources for processing. Crude oils, raw coal and natural gas sources all contain sulphur in different concentrations and structure. Before crude oils are distilled in refineries or when coal is converted for the use of fuels, the sulphur is first removed from the raw feed streams. H2S and in a lesser degree organic sulphur is formed during these conversion and treating steps. When natural gas is extracted from their sources the gas is treated in gas treating plants before use as an energy source in industries or households. The H2S, COS and other organic sulphur in the gas are removed from the raw material. The importance of the removal of sulphur from the mentioned (energy) sources can be found in a number of reasons as the toxicity, corrosion and environmental pollution that will be caused by sulphur containing components. The methods for the measurement of H2S, COS and other organic sulphur are very broad. The analytical method used is first dependent on the range and composition of the gas. Second the analytical technology available at the time of choice plays a role in the selection. Over the last decades new analytical techniques are developed and have become available for the measurement of the sulphur containing components. The emission of sulphur will be in the form of sulphur oxides after burning as SO2 or SO3 indicated as SOx. The emission of the sulphur oxides among other pollutants is restricted in Europe. The European Union states: To maintain or improve the quality of ambient air, the European Union has established limit values for concentrations of sulphur dioxide, nitrogen dioxide and nitrogen oxides, particulate matter and lead, as well as alert thresholds for concentrations of sulphur dioxide and nitrogen oxide, in ambient air. The alert threshold laid down in Directive 1999/30/EC is 500 µg/m³ measured over three consecutive hours at locations representative of air quality over at least 100 km2 or an entire zone or agglomeration, whichever is the smaller (1). The emitted SO2 by only the 25 European countries’ industries was approximately 5,114,779 ton in 2004 (2004 data (2)), the power and refinery industry are the largest producers of SO2.
Figure 2: Emissions of SO2 in 25 European countries in 2004 .
Figure 1: Lemon yellow Sulphur crystals
Page 6
vrije Universiteit amsterdam rev1
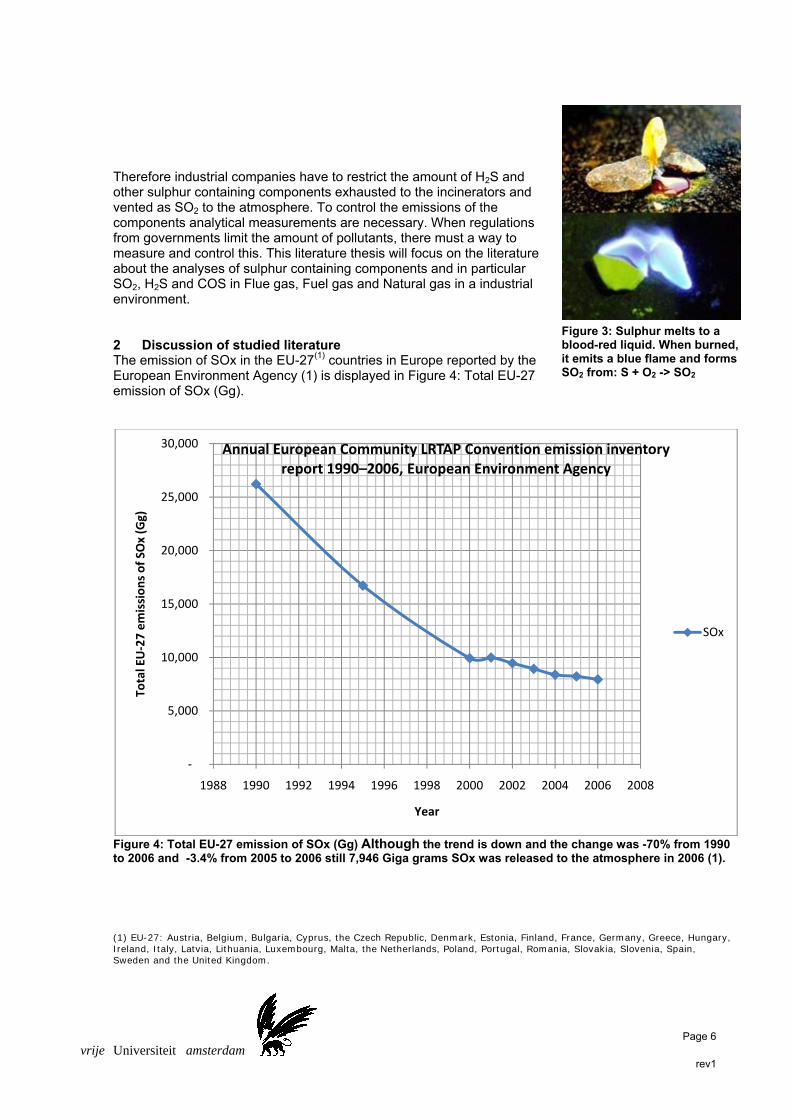
Therefore industrial companies have to restrict the amount of H2S and other sulphur containing components exhausted to the incinerators and vented as SO2 to the atmosphere. To control the emissions of the components analytical measurements are necessary. When regulations from governments limit the amount of pollutants, there must a way to measure and control this. This literature thesis will focus on the literature about the analyses of sulphur containing components and in particular SO2, H2S and COS in Flue gas, Fuel gas and Natural gas in a industrial environment. 2 Discussion of studied literature The emission of SOx in the EU-27(1) countries in Europe reported by the European Environment Agency (1) is displayed in Figure 4: Total EU-27 emission of SOx (Gg).
Figure 4: Total EU-27 emission of SOx (Gg) Although the trend is down and the change was -70% from 1990 to 2006 and -3.4% from 2005 to 2006 still 7,946 Giga grams SOx was released to the atmosphere in 2006 (1).
(1) EU-27: Austria, Belgium, Bulgaria, Cyprus, the Czech Republic, Denmark, Estonia, Finland, France, Germany, Greece, Hungary, Ireland, Italy, Latvia, Lithuania, Luxembourg, Malta, the Netherlands, Poland, Portugal, Romania, Slovakia, Slovenia, Spain, Sweden and the United Kingdom.
‐
5,000
10,000
15,000
20,000
25,000
30,000
1988 1990 1992 1994 1996 1998 2000 2002 2004 2006 2008
Total EU‐27 emissions of SO
x (Gg)
Year
Annual European Community LRTAP Convention emission inventory report 1990–2006, European Environment Agency
SOx
Figure 3: Sulphur melts to a blood-red liquid. When burned, it emits a blue flame and forms SO2 from: S + O2 -> SO2
Page 7
vrije Universiteit amsterdam rev1
2.1 SOx emission trends (1):
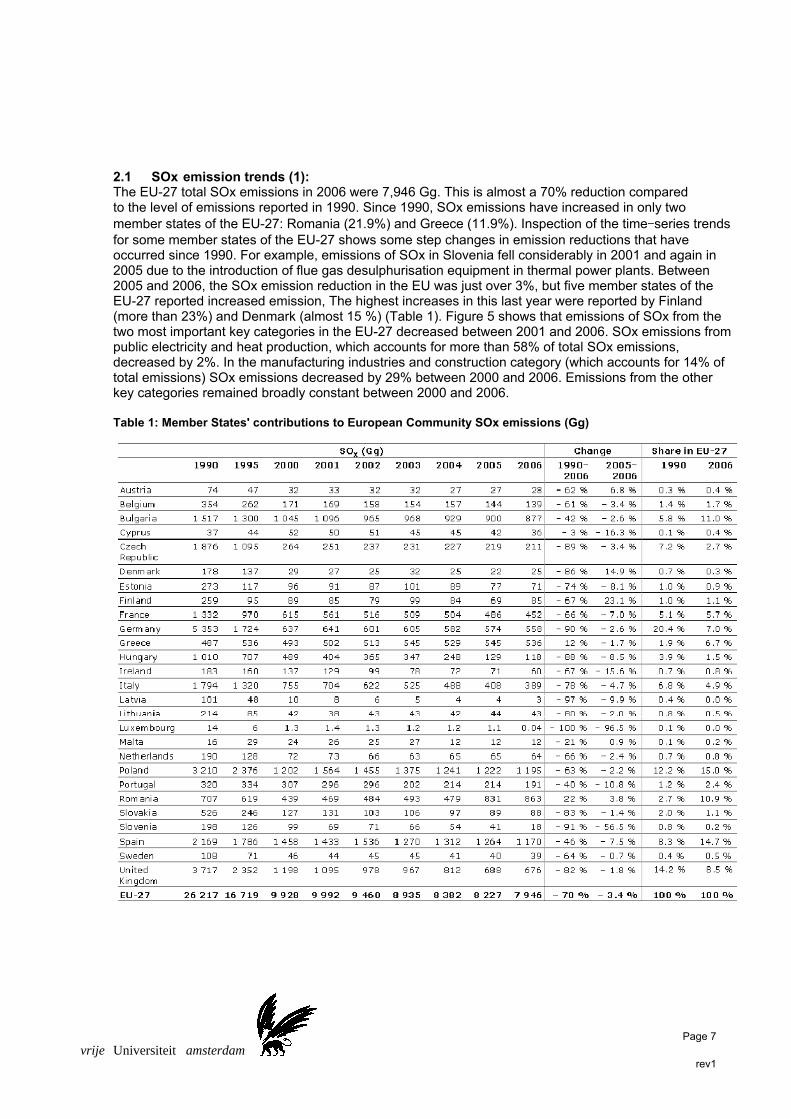
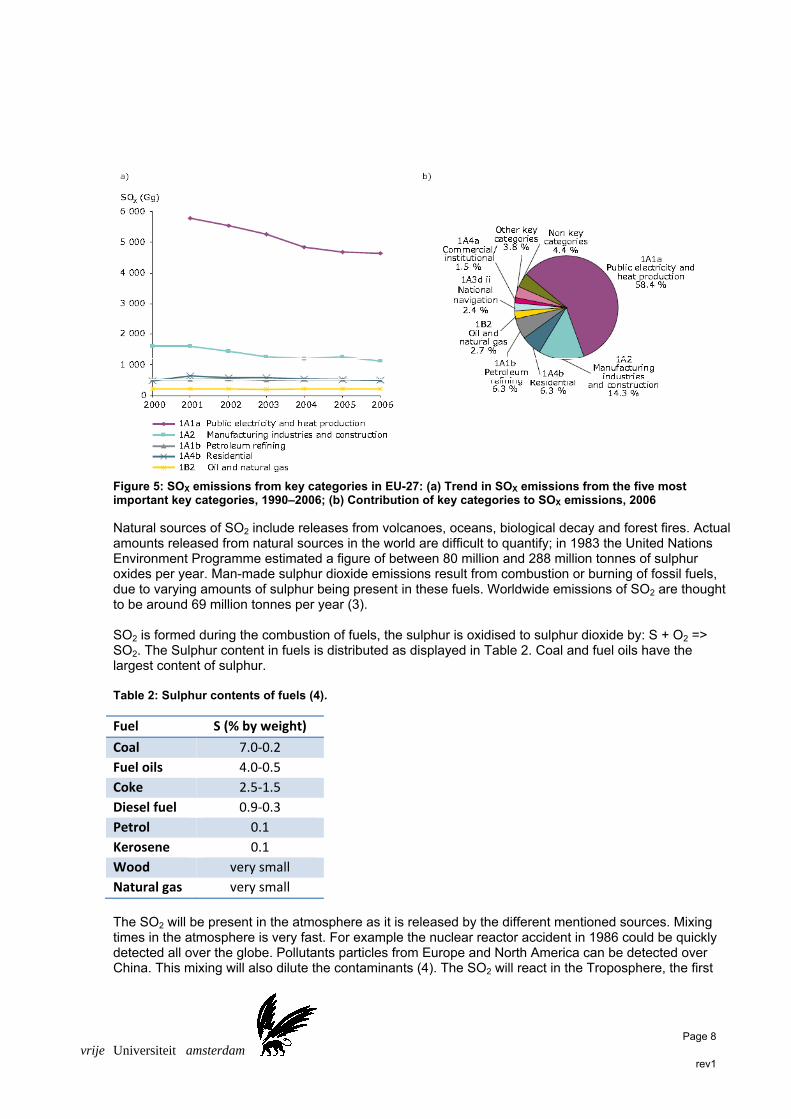
The EU-27 total SOx emissions in 2006 were 7,946 Gg. This is almost a 70% reduction compared to the level of emissions reported in 1990. Since 1990, SOx emissions have increased in only two member states of the EU-27: Romania (21.9%) and Greece (11.9%). Inspection of the time-series trends for some member states of the EU-27 shows some step changes in emission reductions that have occurred since 1990. For example, emissions of SOx in Slovenia fell considerably in 2001 and again in 2005 due to the introduction of flue gas desulphurisation equipment in thermal power plants. Between 2005 and 2006, the SOx emission reduction in the EU was just over 3%, but five member states of the EU-27 reported increased emission, The highest increases in this last year were reported by Finland (more than 23%) and Denmark (almost 15 %) (Table 1). Figure 5 shows that emissions of SOx from the two most important key categories in the EU-27 decreased between 2001 and 2006. SOx emissions from public electricity and heat production, which accounts for more than 58% of total SOx emissions, decreased by 2%. In the manufacturing industries and construction category (which accounts for 14% of total emissions) SOx emissions decreased by 29% between 2000 and 2006. Emissions from the other key categories remained broadly constant between 2000 and 2006. Table 1: Member States' contributions to European Community SOx emissions (Gg)
Page 8
vrije Universiteit amsterdam rev1
Figure 5: SOX emissions from key categories in EU-27: (a) Trend in SOX emissions from the five most important key categories, 1990–2006; (b) Contribution of key categories to SOX emissions, 2006
Natural sources of SO2 include releases from volcanoes, oceans, biological decay and forest fires. Actual amounts released from natural sources in the world are difficult to quantify; in 1983 the United Nations Environment Programme estimated a figure of between 80 million and 288 million tonnes of sulphur oxides per year. Man-made sulphur dioxide emissions result from combustion or burning of fossil fuels, due to varying amounts of sulphur being present in these fuels. Worldwide emissions of SO2 are thought to be around 69 million tonnes per year (3). SO2 is formed during the combustion of fuels, the sulphur is oxidised to sulphur dioxide by: S + O2 => SO2. The Sulphur content in fuels is distributed as displayed in Table 2. Coal and fuel oils have the largest content of sulphur. Table 2: Sulphur contents of fuels (4).
Fuel S (% by weight)
Coal 7.0‐0.2
Fuel oils 4.0‐0.5
Coke 2.5‐1.5
Diesel fuel 0.9‐0.3
Petrol 0.1
Kerosene 0.1
Wood very small
Natural gas very small
The SO2 will be present in the atmosphere as it is released by the different mentioned sources. Mixing times in the atmosphere is very fast. For example the nuclear reactor accident in 1986 could be quickly detected all over the globe. Pollutants particles from Europe and North America can be detected over China. This mixing will also dilute the contaminants (4). The SO2 will react in the Troposphere, the first
Page 9
vrije Universiteit amsterdam rev1
20km of atmosphere. The most important reactive entity in that atmosphere is the hydroxyl (OH·) radical. It is formed in the atmosphere by the photo chemically initiated reaction sequence of O3 (ozone) with a photon hʋ. Water in the atmosphere will react with the atomic oxygen to form a hydroxyl radical.
h
H O 2
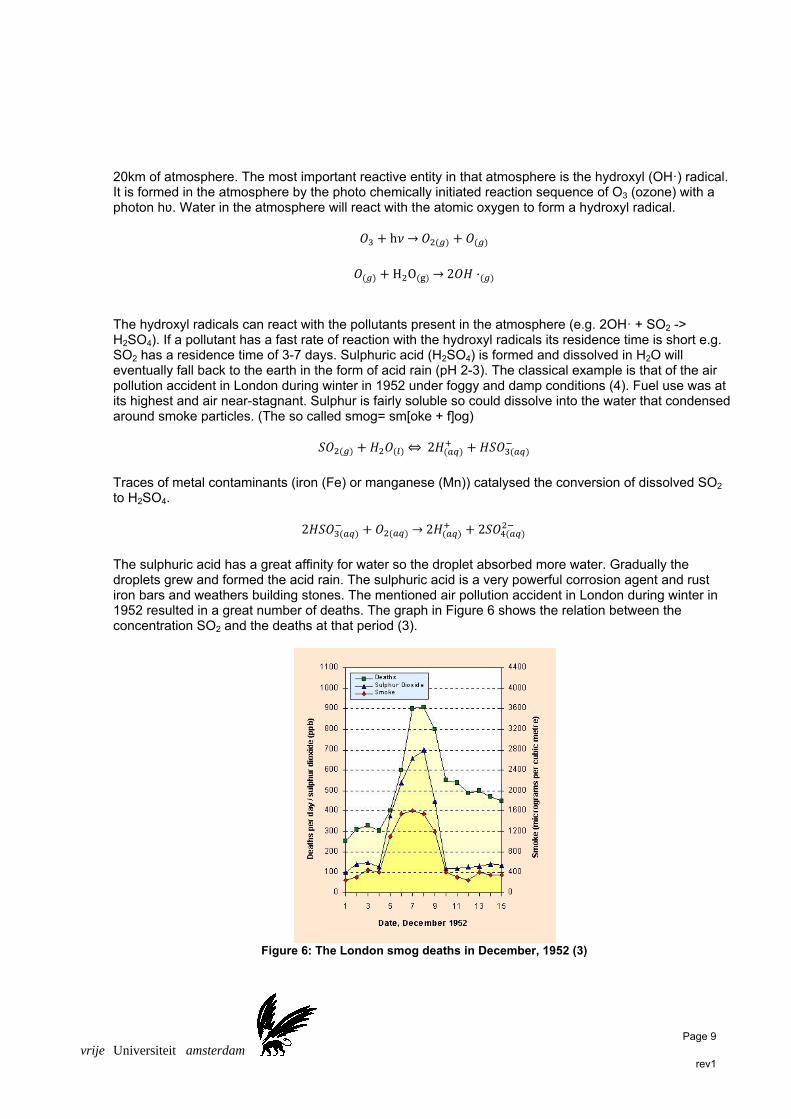
The hydroxyl radicals can react with the pollutants present in the atmosphere (e.g. 2OH· + SO2 -> H2SO4). If a pollutant has a fast rate of reaction with the hydroxyl radicals its residence time is short e.g. SO2 has a residence time of 3-7 days. Sulphuric acid (H2SO4) is formed and dissolved in H2O will eventually fall back to the earth in the form of acid rain (pH 2-3). The classical example is that of the air pollution accident in London during winter in 1952 under foggy and damp conditions (4). Fuel use was at its highest and air near-stagnant. Sulphur is fairly soluble so could dissolve into the water that condensed around smoke particles. (The so called smog= sm[oke + f]og)
2
Traces of metal contaminants (iron (Fe) or manganese (Mn)) catalysed the conversion of dissolved SO2 to H2SO4.
2 2 2
The sulphuric acid has a great affinity for water so the droplet absorbed more water. Gradually the droplets grew and formed the acid rain. The sulphuric acid is a very powerful corrosion agent and rust iron bars and weathers building stones. The mentioned air pollution accident in London during winter in 1952 resulted in a great number of deaths. The graph in Figure 6 shows the relation between the concentration SO2 and the deaths at that period (3).
Figure 6: The London smog deaths in December, 1952 (3)

Page 10
vrije Universiteit amsterdam rev1
Since that time a lot of effort has been put in the reduction of emission of sulphur to the atmosphere. Dictated by the governments several programmes have been released. E.g. for the reduction of pollutions the United Nations Economic Commission for Europe (UNECE), of which the European countries, the European Commission, the United States and Canada are members, have signed the 1999 Gothenburg Protocol. For SO2 this protocol dictates an emission limit per country. For The Netherlands this limit is set to a maximum of 50ktons in 2010 (5). Another aspect of sulphur species and particular H2S is its toxicity. First the toxicity toward live. H2S for example is toxic to human beings. H2S is classed as a chemical asphyxiant, similar to carbon monoxide and cyanide gases. It inhibits cellular respiration and uptake of oxygen, causing biochemical suffocation. Typical exposure symptoms include:
0 - 10 ppm Irritation of the eyes, nose and throat, 10 - 50 ppm Headache, dizziness, nausea and vomiting, coughing and breathing difficulty 50 - 200 ppm Severe respiratory tract irritation, eye irritation / acute conjunctivitis, shock,
convulsions coma, death in severe cases Prolonged exposures at lower levels can lead to bronchitis, pneumonia, migraine headaches, pulmonary oedema, and loss of motor coordination. H2S will anaesthetize the smell sense organs at levels of 10ppm and higher. H2S and COS has a negative effect on catalyst, while it degrades its functionality and activity or corrosion of steel material. 2.2 The Industries The two industries responsible for the largest emission of SO2 are the Power plants and Refinery industries, since they make use of coal and fuel oils. Coal has a content of between 7.0-0.2% sulphur and oil between 4.0-0.5% sulphur (ref Table 2). During the burning at the high temperatures with oxygen concentrations typical of combustion, sulphur combines with carbon, hydrogen and oxygen to form SO2, SO3, SO, CS, CH, COS, H2S, S and S2 (6). 2.2.1 Power plants: In the EU-15 (15 European countries) approximately 1361 large power plants sites exists. For those processes using coal and fuel oils as fuel for combustion as in power plants a number of sulphur removal processes are available and are used to remove the sulphur from the flue gas. First these are primary measures to reduce sulphur oxide emissions by low sulphur fuels or the use of absorbents in fluidised bed combustion systems (the adsorbent used is usually CaO, Ca(OH)2 or CaCO3). Then secondary measures to reduce sulphur oxide emissions are available (6).
Page 11
vrije Universiteit amsterdam rev1
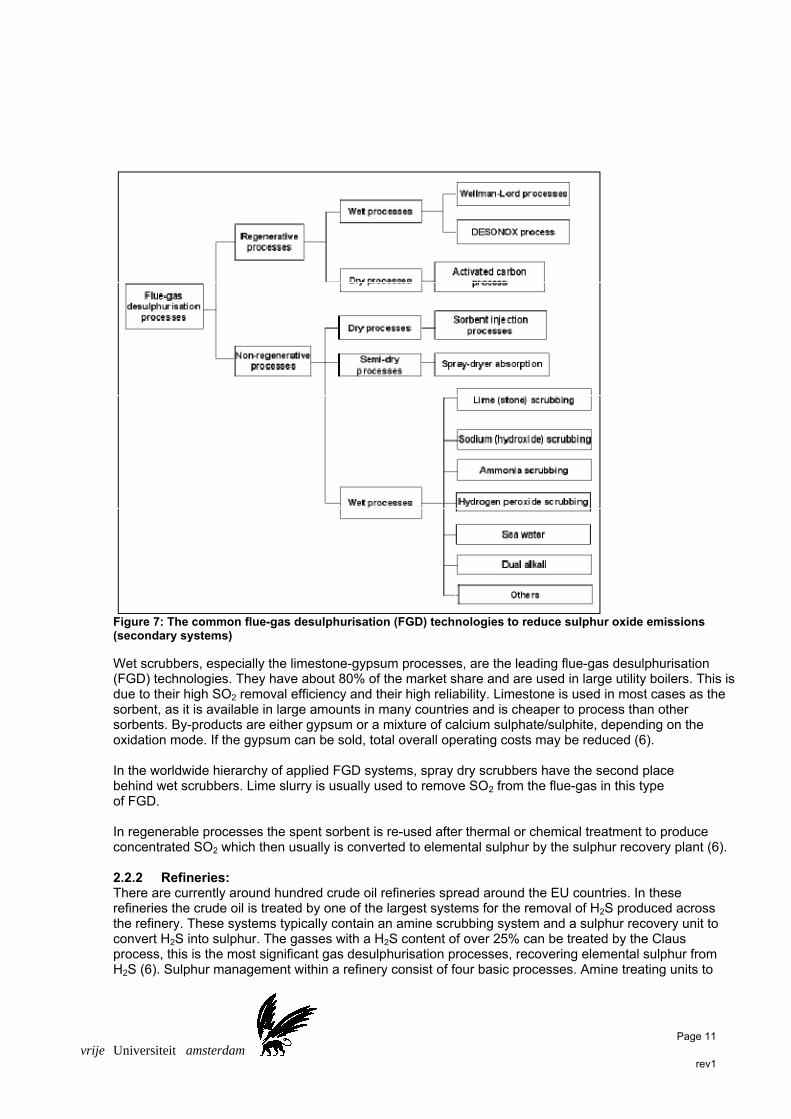
Figure 7: The common flue-gas desulphurisation (FGD) technologies to reduce sulphur oxide emissions (secondary systems)
Wet scrubbers, especially the limestone-gypsum processes, are the leading flue-gas desulphurisation (FGD) technologies. They have about 80% of the market share and are used in large utility boilers. This is due to their high SO2 removal efficiency and their high reliability. Limestone is used in most cases as the sorbent, as it is available in large amounts in many countries and is cheaper to process than other sorbents. By-products are either gypsum or a mixture of calcium sulphate/sulphite, depending on the oxidation mode. If the gypsum can be sold, total overall operating costs may be reduced (6). In the worldwide hierarchy of applied FGD systems, spray dry scrubbers have the second place behind wet scrubbers. Lime slurry is usually used to remove SO2 from the flue-gas in this type of FGD. In regenerable processes the spent sorbent is re-used after thermal or chemical treatment to produce concentrated SO2 which then usually is converted to elemental sulphur by the sulphur recovery plant (6). 2.2.2 Refineries: There are currently around hundred crude oil refineries spread around the EU countries. In these refineries the crude oil is treated by one of the largest systems for the removal of H2S produced across the refinery. These systems typically contain an amine scrubbing system and a sulphur recovery unit to convert H2S into sulphur. The gasses with a H2S content of over 25% can be treated by the Claus process, this is the most significant gas desulphurisation processes, recovering elemental sulphur from H2S (6). Sulphur management within a refinery consist of four basic processes. Amine treating units to
Page 12
vrije Universiteit amsterdam rev1
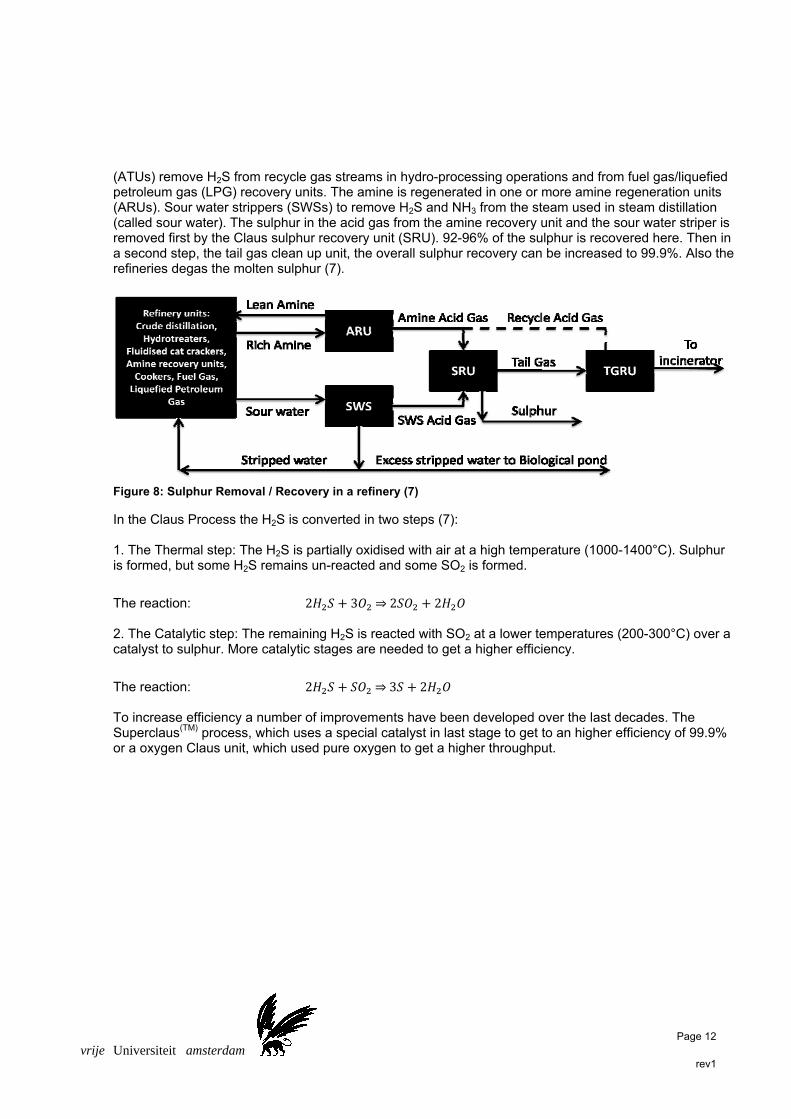
(ATUs) remove H2S from recycle gas streams in hydro-processing operations and from fuel gas/liquefied petroleum gas (LPG) recovery units. The amine is regenerated in one or more amine regeneration units (ARUs). Sour water strippers (SWSs) to remove H2S and NH3 from the steam used in steam distillation (called sour water). The sulphur in the acid gas from the amine recovery unit and the sour water striper is removed first by the Claus sulphur recovery unit (SRU). 92-96% of the sulphur is recovered here. Then in a second step, the tail gas clean up unit, the overall sulphur recovery can be increased to 99.9%. Also the refineries degas the molten sulphur (7).
Figure 8: Sulphur Removal / Recovery in a refinery (7)
In the Claus Process the H2S is converted in two steps (7): 1. The Thermal step: The H2S is partially oxidised with air at a high temperature (1000-1400°C). Sulphur is formed, but some H2S remains un-reacted and some SO2 is formed.
The reaction: 2 3 2 2 2. The Catalytic step: The remaining H2S is reacted with SO2 at a lower temperatures (200-300°C) over a catalyst to sulphur. More catalytic stages are needed to get a higher efficiency.
The reaction: 2 3 2 To increase efficiency a number of improvements have been developed over the last decades. The Superclaus(TM) process, which uses a special catalyst in last stage to get to an higher efficiency of 99.9% or a oxygen Claus unit, which used pure oxygen to get a higher throughput.
Page 13
vrije Universiteit amsterdam rev1
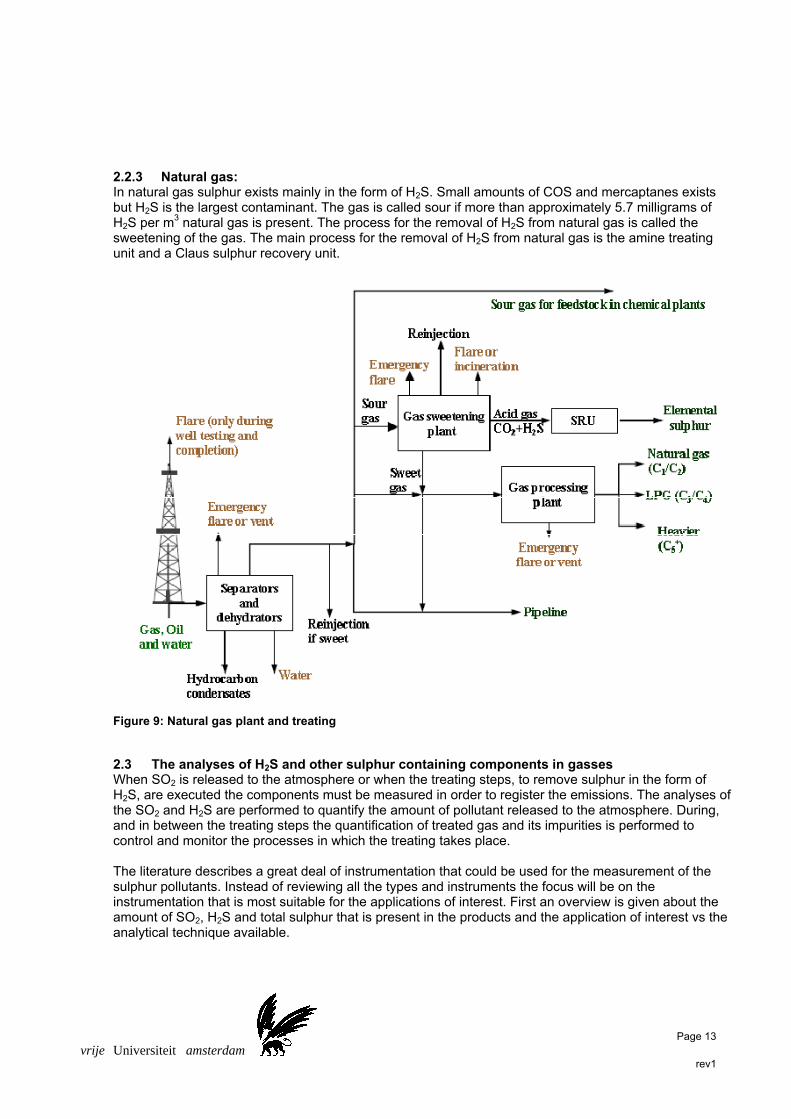
2.2.3 Natural gas: In natural gas sulphur exists mainly in the form of H2S. Small amounts of COS and mercaptanes exists but H2S is the largest contaminant. The gas is called sour if more than approximately 5.7 milligrams of H2S per m3 natural gas is present. The process for the removal of H2S from natural gas is called the sweetening of the gas. The main process for the removal of H2S from natural gas is the amine treating unit and a Claus sulphur recovery unit.
Figure 9: Natural gas plant and treating
2.3 The analyses of H2S and other sulphur containing components in gasses When SO2 is released to the atmosphere or when the treating steps, to remove sulphur in the form of H2S, are executed the components must be measured in order to register the emissions. The analyses of the SO2 and H2S are performed to quantify the amount of pollutant released to the atmosphere. During, and in between the treating steps the quantification of treated gas and its impurities is performed to control and monitor the processes in which the treating takes place. The literature describes a great deal of instrumentation that could be used for the measurement of the sulphur pollutants. Instead of reviewing all the types and instruments the focus will be on the instrumentation that is most suitable for the applications of interest. First an overview is given about the amount of SO2, H2S and total sulphur that is present in the products and the application of interest vs the analytical technique available.
Page 14
vrije Universiteit amsterdam rev1
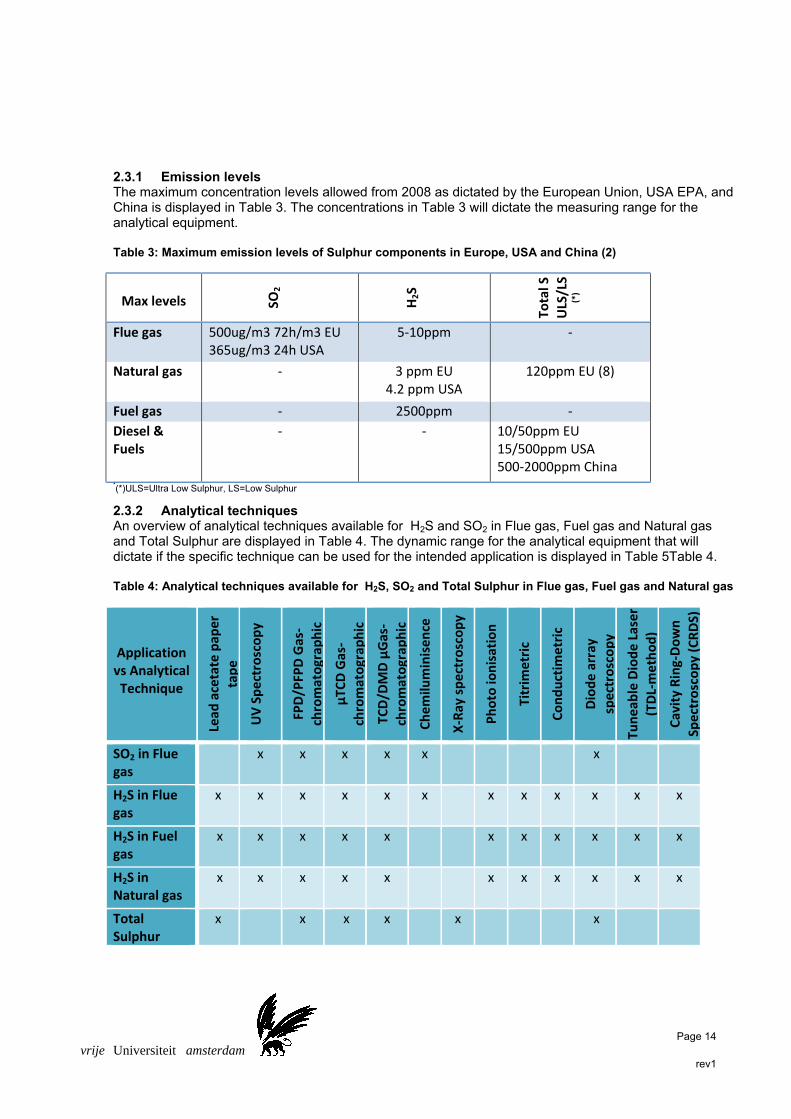
2.3.1 Emission levels The maximum concentration levels allowed from 2008 as dictated by the European Union, USA EPA, and China is displayed in Table 3. The concentrations in Table 3 will dictate the measuring range for the analytical equipment. Table 3: Maximum emission levels of Sulphur components in Europe, USA and China (2)
Max levels
SO2
H2S
Total S
ULS/LS
(*)
Flue gas 500ug/m3 72h/m3 EU 365ug/m3 24h USA
5‐10ppm ‐
Natural gas ‐ 3 ppm EU 4.2 ppm USA
120ppm EU (8)
Fuel gas ‐ 2500ppm ‐
Diesel & Fuels
‐ ‐ 10/50ppm EU 15/500ppm USA 500‐2000ppm China
*(*)ULS=Ultra Low Sulphur, LS=Low Sulphur
2.3.2 Analytical techniques An overview of analytical techniques available for H2S and SO2 in Flue gas, Fuel gas and Natural gas and Total Sulphur are displayed in Table 4. The dynamic range for the analytical equipment that will dictate if the specific technique can be used for the intended application is displayed in Table 5Table 4. Table 4: Analytical techniques available for H2S, SO2 and Total Sulphur in Flue gas, Fuel gas and Natural gas
Application vs Analytical Technique
Lead
acetate pap
er
tape
UV Spectroscopy
FPD/PFPD Gas‐
chromatograp
hic
µTC
D Gas‐
chromatograp
hic
TCD/D
MD µGas‐
chromatograp
hic
Chemilu
minisence
X‐Ray spectroscopy
Photo ionisation
Titrim
etric
Conductim
etric
Diode array
spectroscopy
Tuneab
le Diode Laser
(TDL‐method)
Cavity Ring‐Down
Spectroscopy (CRDS)
SO2 in Flue gas
x x x x x x
H2S in Flue gas
x x x x x x x x x x x x
H2S in Fuel gas
x x x x x x x x x x x
H2S in Natural gas
x x x x x x x x x x x
Total Sulphur
x x x x x x

Page 15
vrije Universiteit amsterdam rev1
2.3.3 The dynamic ranges & detection limits (LOD) Table 5: Analyser Technique vs Ranges & LOD for H2S and SO2 in Gasses
Application vs
Analytical Technique (Range/ Detection limit)
Lead
acetate pap
er
tape (9) (10)
UV Spectro ‐
photometry (11)
FPD/PFPD Gas‐
chromatograp
hic
(12)
µTC
D Gas‐
chromatograp
hic
(13)
DMD Gas‐
chromatograp
hic
(14) (15)
Chemilu
minisence/
AED
(12)
X‐Ray spectroscopy
(1
6)
SO2 in Flue gas
0‐25ppm 0‐250ppm 100ppb LOD
50ppb‐100ppm10ppb‐100ppm10ppb LOD
0.5ppm‐%0.5ppm LOD
200ppb‐10ppm
200ppb LOD
5ppb‐1% 5ppb LOD
H2S in Flue gas
0.010ppm‐% 10ppb LOD
0‐5ppm 100ppb LOD
50ppb‐100ppm10ppb‐100ppm10ppb LOD
0.5ppm‐%0.5ppm LOD
200ppb‐10ppm
200ppb LOD
5ppb‐1% 5ppb LOD
H2S in Fuel gas
0.010ppm‐% 10ppb LOD
0‐5ppm 100ppb LOD
50ppb‐100ppm10ppb‐100ppm10ppb LOD
0.5ppm‐%0.5ppm LOD
200ppb‐10ppm
200ppb LOD
H2S in Natural gas
0.010ppm‐% 10ppb LOD
0‐5ppm 100ppb LOD
50ppb‐100ppm10ppb‐100ppm10ppb LOD
0.5ppm‐%0.5ppm LOD
200ppb‐10ppm
200ppb LOD
Total Sulphur
0.010ppm‐% 10ppb LOD
200ppb‐500ppm
40ppb‐500ppm40ppb LOD
0.5ppm‐%0.5ppm LOD
200ppb‐40ppm
200ppb LOD
1ppm‐%1ppm LOD
Application vs
Analytical Technique (Range/ Detection limit)
Photo ionisation
(17)
Titrim
etric (17)
Conductim
etric (17)
Diode array
spectroscopy (18)
Tuneab
le Diode
Laser (TDL‐method)
(11)
Cavity Ring‐Down
Spectroscopy
(CRDS) (19)
SO2 in Flue gas
0‐500ppm
H2S in Flue gas
0.1‐1500ppm 100ppb LOD
0‐1ppm 0‐1000ppm
0‐2ppm 0‐750ppm
0‐10ppmppm‐%
0‐20ppm 500ppb
0‐1000ppm200ppb
H2S in Fuel gas
0.1‐1500ppm 100ppb LOD
0‐1ppm 0‐1000ppm
0‐2ppm 0‐750ppm
0‐10ppmppm‐%
0‐20ppm 500ppb
0‐1000ppm200ppb
H2S in Natural gas
0.1‐1500ppm 100ppb LOD
0‐1ppm 0‐1000ppm
0‐2ppm 0‐750ppm
0‐10ppmppm‐%
0‐20ppm 500ppb
0‐1000ppm200ppb
Total Sulphur
0‐10ppm
Page 16
vrije Universiteit amsterdam rev1
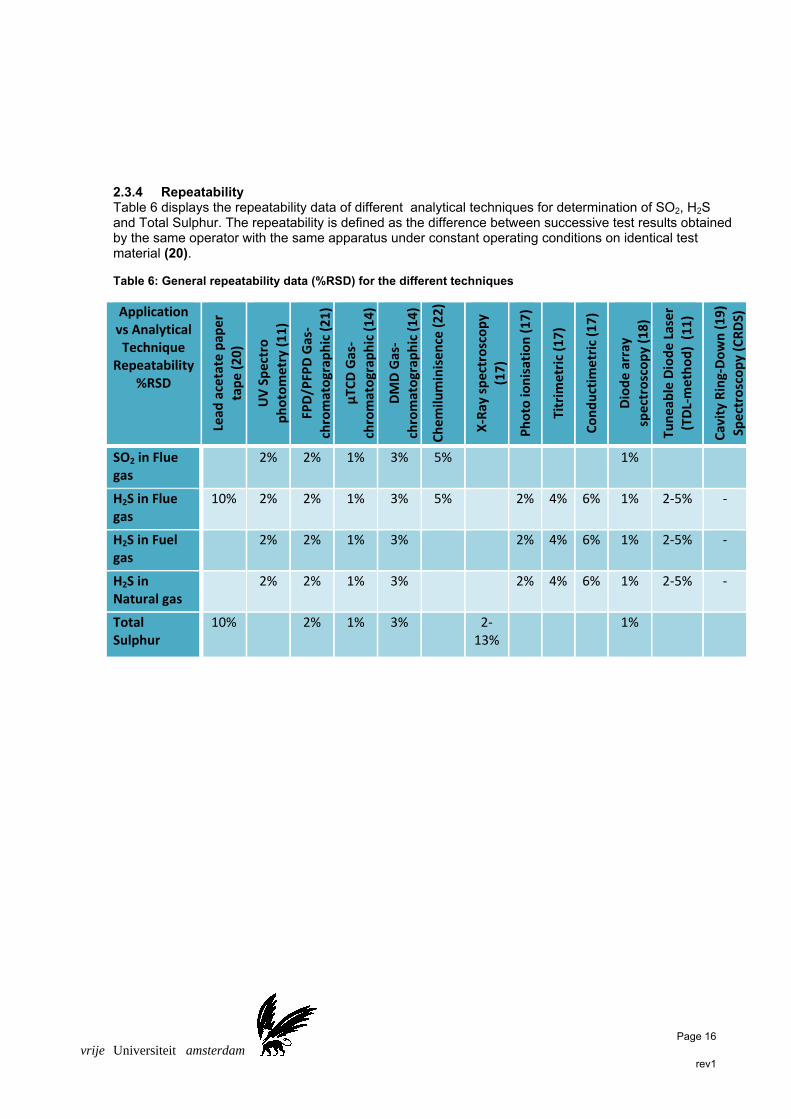
2.3.4 Repeatability Table 6 displays the repeatability data of different analytical techniques for determination of SO2, H2S and Total Sulphur. The repeatability is defined as the difference between successive test results obtained by the same operator with the same apparatus under constant operating conditions on identical test material (20).
Table 6: General repeatability data (%RSD) for the different techniques
Application vs Analytical Technique
Repeatability %RSD
Lead
acetate pap
er
tape (20)
UV Spectro
photometry (11)
FPD/PFPD Gas‐
chromatograp
hic (21)
µTC
D Gas‐
chromatograp
hic (14)
DMD Gas‐
chromatograp
hic (14)
Chemilu
minisence (22)
X‐Ray spectroscopy
(17)
Photo ionisation (17)
Titrim
etric (17)
Conductim
etric (17)
Diode array
spectroscopy (18)
Tuneab
le Diode Laser
(TDL‐method) (11)
Cavity Ring‐Down (19)
Spectroscopy (CRDS)
SO2 in Flue gas
2%
2% 1% 3% 5% 1%
H2S in Flue gas
10% 2%
2% 1% 3% 5% 2% 4% 6% 1% 2‐5% ‐
H2S in Fuel gas
2%
2% 1% 3% 2% 4% 6% 1% 2‐5% ‐
H2S in Natural gas
2%
2% 1% 3% 2% 4% 6% 1% 2‐5% ‐
Total Sulphur
10% 2% 1% 3% 2‐13%
1%
Page 17
vrije Universiteit amsterdam rev1
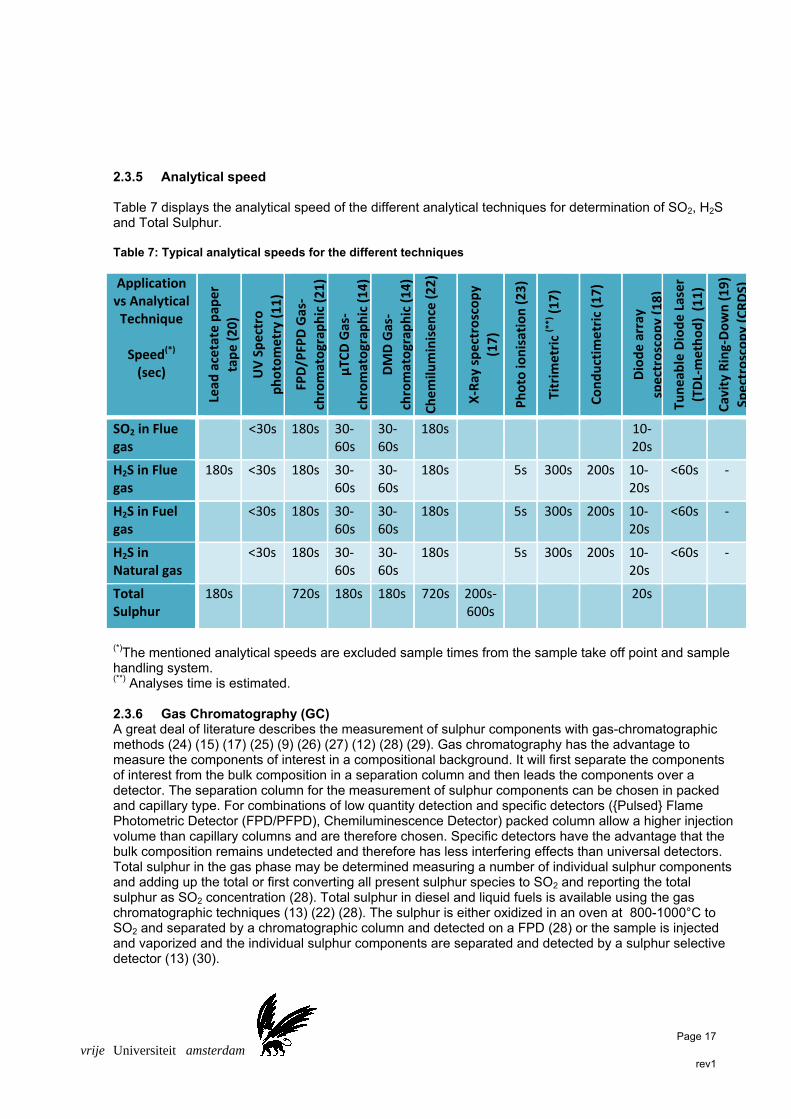
2.3.5 Analytical speed Table 7 displays the analytical speed of the different analytical techniques for determination of SO2, H2S and Total Sulphur. Table 7: Typical analytical speeds for the different techniques
Application vs Analytical Technique
Speed(*) (sec)
Lead
acetate pap
er
tape (20)
UV Spectro
photometry (11)
FPD/PFPD Gas‐
chromatograp
hic (21)
µTC
D Gas‐
chromatograp
hic (14)
DMD Gas‐
chromatograp
hic (14)
Chemilu
minisence (22)
X‐Ray spectroscopy
(17)
Photo ionisation (23)
Titrim
etric (*
*) (17)
Conductim
etric (17)
Diode array
spectroscopy (18)
Tuneab
le Diode Laser
(TDL‐method) (11)
Cavity Ring‐Down (19)
Spectroscopy(CRDS)
SO2 in Flue gas
<30s
180s 30‐60s
30‐60s
180s 10‐20s
H2S in Flue gas
180s <30s 180s 30‐60s
30‐60s
180s 5s 300s 200s 10‐20s
<60s ‐
H2S in Fuel gas
<30s 180s 30‐60s
30‐60s
180s 5s 300s 200s 10‐20s
<60s ‐
H2S in Natural gas
<30s 180s 30‐60s
30‐60s
180s 5s 300s 200s 10‐20s
<60s ‐
Total Sulphur
180s 720s 180s 180s 720s 200s‐600s
20s
(*)The mentioned analytical speeds are excluded sample times from the sample take off point and sample handling system. (**) Analyses time is estimated. 2.3.6 Gas Chromatography (GC) A great deal of literature describes the measurement of sulphur components with gas-chromatographic methods (24) (15) (17) (25) (9) (26) (27) (12) (28) (29). Gas chromatography has the advantage to measure the components of interest in a compositional background. It will first separate the components of interest from the bulk composition in a separation column and then leads the components over a detector. The separation column for the measurement of sulphur components can be chosen in packed and capillary type. For combinations of low quantity detection and specific detectors ({Pulsed} Flame Photometric Detector (FPD/PFPD), Chemiluminescence Detector) packed column allow a higher injection volume than capillary columns and are therefore chosen. Specific detectors have the advantage that the bulk composition remains undetected and therefore has less interfering effects than universal detectors. Total sulphur in the gas phase may be determined measuring a number of individual sulphur components and adding up the total or first converting all present sulphur species to SO2 and reporting the total sulphur as SO2 concentration (28). Total sulphur in diesel and liquid fuels is available using the gas chromatographic techniques (13) (22) (28). The sulphur is either oxidized in an oven at 800-1000°C to SO2 and separated by a chromatographic column and detected on a FPD (28) or the sample is injected and vaporized and the individual sulphur components are separated and detected by a sulphur selective detector (13) (30).
Page 18
vrije Universiteit amsterdam rev1
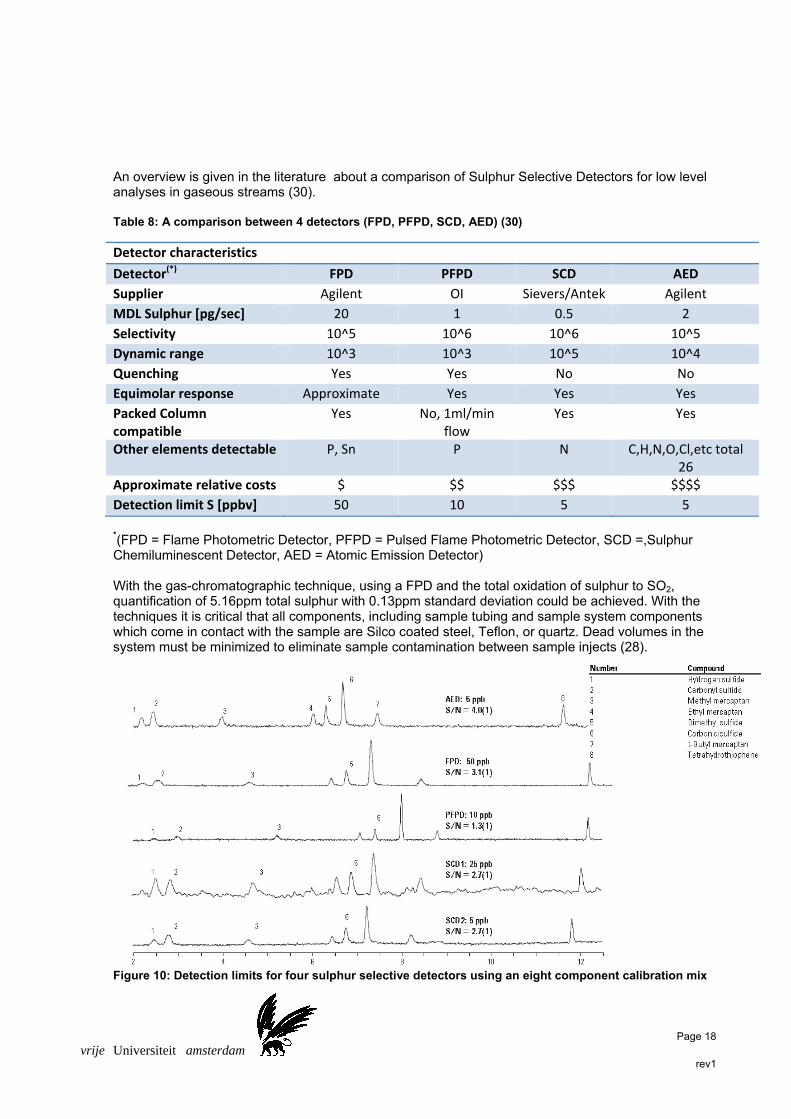
An overview is given in the literature about a comparison of Sulphur Selective Detectors for low level analyses in gaseous streams (30). Table 8: A comparison between 4 detectors (FPD, PFPD, SCD, AED) (30)
Detector characteristics
Detector(*) FPD PFPD SCD AED
Supplier Agilent OI Sievers/Antek Agilent
MDL Sulphur [pg/sec] 20 1 0.5 2
Selectivity 10^5 10^6 10^6 10^5
Dynamic range 10^3 10^3 10^5 10^4
Quenching Yes Yes No No
Equimolar response Approximate Yes Yes Yes
Packed Column compatible
Yes No, 1ml/min flow
Yes Yes
Other elements detectable P, Sn P N C,H,N,O,Cl,etc total 26
Approximate relative costs $ $$ $$$ $$$$
Detection limit S [ppbv] 50 10 5 5
*(FPD = Flame Photometric Detector, PFPD = Pulsed Flame Photometric Detector, SCD =,Sulphur Chemiluminescent Detector, AED = Atomic Emission Detector) With the gas-chromatographic technique, using a FPD and the total oxidation of sulphur to SO2, quantification of 5.16ppm total sulphur with 0.13ppm standard deviation could be achieved. With the techniques it is critical that all components, including sample tubing and sample system components which come in contact with the sample are Silco coated steel, Teflon, or quartz. Dead volumes in the system must be minimized to eliminate sample contamination between sample injects (28).
Figure 10: Detection limits for four sulphur selective detectors using an eight component calibration mix
Page 19
vrije Universiteit amsterdam rev1
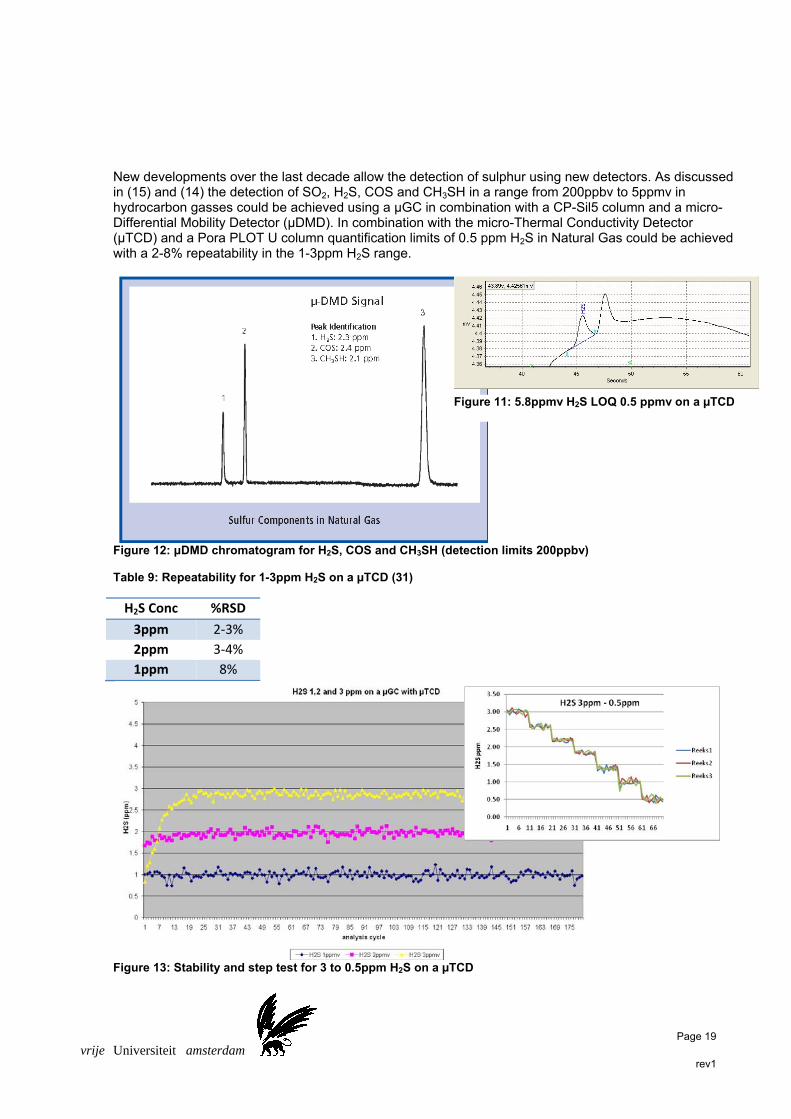
New developments over the last decade allow the detection of sulphur using new detectors. As discussed in (15) and (14) the detection of SO2, H2S, COS and CH3SH in a range from 200ppbv to 5ppmv in hydrocarbon gasses could be achieved using a µGC in combination with a CP-Sil5 column and a micro-Differential Mobility Detector (µDMD). In combination with the micro-Thermal Conductivity Detector (µTCD) and a Pora PLOT U column quantification limits of 0.5 ppm H2S in Natural Gas could be achieved with a 2-8% repeatability in the 1-3ppm H2S range.
Figure 12: μDMD chromatogram for H2S, COS and CH3SH (detection limits 200ppbv)
Table 9: Repeatability for 1-3ppm H2S on a µTCD (31)
H2S Conc %RSD
3ppm 2‐3%
2ppm 3‐4%
1ppm 8%
Figure 13: Stability and step test for 3 to 0.5ppm H2S on a µTCD
Figure 11: 5.8ppmv H2S LOQ 0.5 ppmv on a µTCD
Page 20
vrije Universiteit amsterdam rev1
2.3.7 Lead acetate tape technology Lead acetate tape technology is a technique using a paper or cloth tape (white in colour) that is saturated with a lead acetate solution, dried, then spooled similar to a tape recorder. The gas sample is moistened as it flows through a humidifier, then passes over or through the tape in a small, confined area, typically 1/8" in diameter. The portion of the tape exposed to the sample gas stream will darken proportionally to the amount of H2S present, due to the formation of lead sulphide.
2
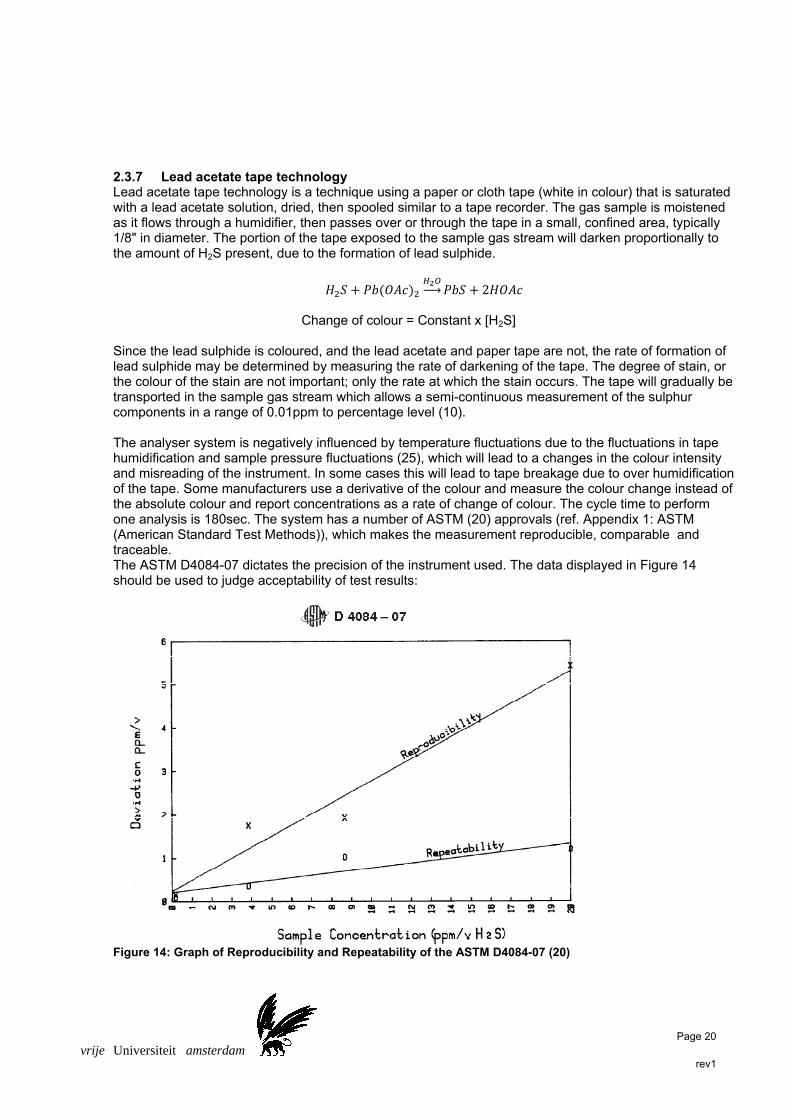
Change of colour = Constant x [H2S] Since the lead sulphide is coloured, and the lead acetate and paper tape are not, the rate of formation of lead sulphide may be determined by measuring the rate of darkening of the tape. The degree of stain, or the colour of the stain are not important; only the rate at which the stain occurs. The tape will gradually be transported in the sample gas stream which allows a semi-continuous measurement of the sulphur components in a range of 0.01ppm to percentage level (10). The analyser system is negatively influenced by temperature fluctuations due to the fluctuations in tape humidification and sample pressure fluctuations (25), which will lead to a changes in the colour intensity and misreading of the instrument. In some cases this will lead to tape breakage due to over humidification of the tape. Some manufacturers use a derivative of the colour and measure the colour change instead of the absolute colour and report concentrations as a rate of change of colour. The cycle time to perform one analysis is 180sec. The system has a number of ASTM (20) approvals (ref. Appendix 1: ASTM (American Standard Test Methods)), which makes the measurement reproducible, comparable and traceable. The ASTM D4084-07 dictates the precision of the instrument used. The data displayed in Figure 14 should be used to judge acceptability of test results:
Figure 14: Graph of Reproducibility and Repeatability of the ASTM D4084-07 (20)
Page 21
vrije Universiteit amsterdam rev1
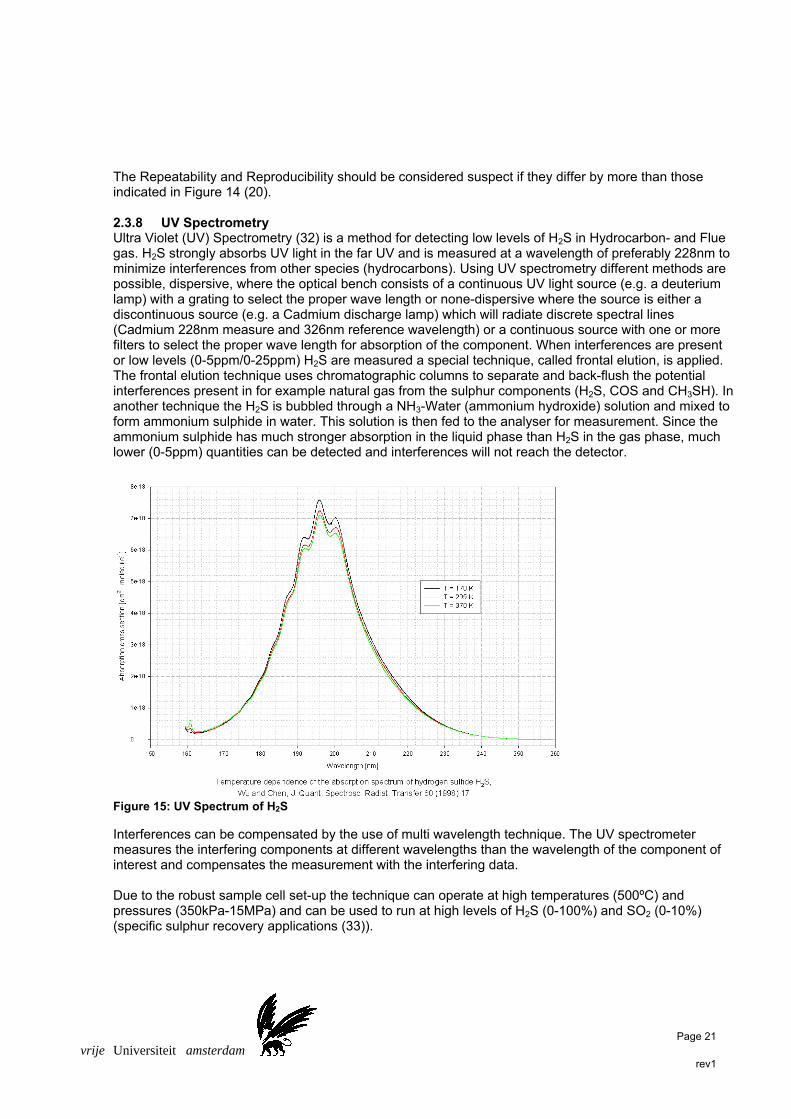
The Repeatability and Reproducibility should be considered suspect if they differ by more than those indicated in Figure 14 (20). 2.3.8 UV Spectrometry Ultra Violet (UV) Spectrometry (32) is a method for detecting low levels of H2S in Hydrocarbon- and Flue gas. H2S strongly absorbs UV light in the far UV and is measured at a wavelength of preferably 228nm to minimize interferences from other species (hydrocarbons). Using UV spectrometry different methods are possible, dispersive, where the optical bench consists of a continuous UV light source (e.g. a deuterium lamp) with a grating to select the proper wave length or none-dispersive where the source is either a discontinuous source (e.g. a Cadmium discharge lamp) which will radiate discrete spectral lines (Cadmium 228nm measure and 326nm reference wavelength) or a continuous source with one or more filters to select the proper wave length for absorption of the component. When interferences are present or low levels (0-5ppm/0-25ppm) H2S are measured a special technique, called frontal elution, is applied. The frontal elution technique uses chromatographic columns to separate and back-flush the potential interferences present in for example natural gas from the sulphur components (H2S, COS and CH3SH). In another technique the H2S is bubbled through a NH3-Water (ammonium hydroxide) solution and mixed to form ammonium sulphide in water. This solution is then fed to the analyser for measurement. Since the ammonium sulphide has much stronger absorption in the liquid phase than H2S in the gas phase, much lower (0-5ppm) quantities can be detected and interferences will not reach the detector.
Figure 15: UV Spectrum of H2S
Interferences can be compensated by the use of multi wavelength technique. The UV spectrometer measures the interfering components at different wavelengths than the wavelength of the component of interest and compensates the measurement with the interfering data. Due to the robust sample cell set-up the technique can operate at high temperatures (500ºC) and pressures (350kPa-15MPa) and can be used to run at high levels of H2S (0-100%) and SO2 (0-10%) (specific sulphur recovery applications (33)).
Page 22
vrije Universiteit amsterdam rev1
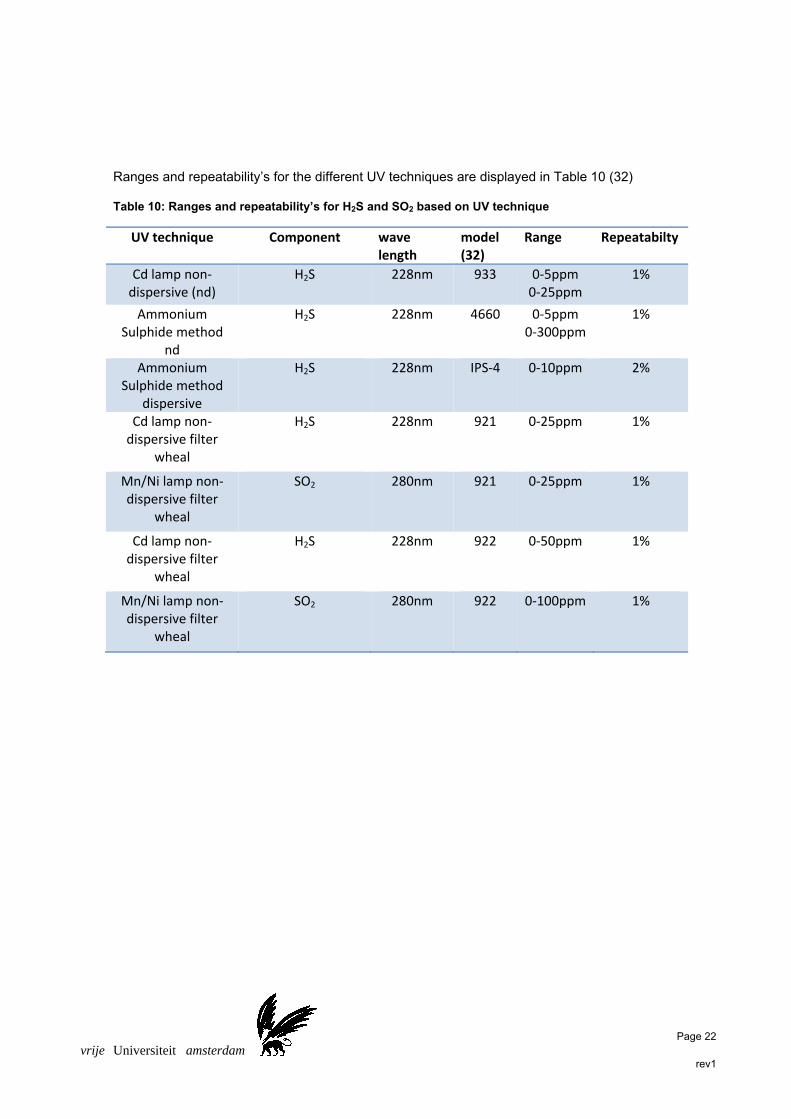
Ranges and repeatability’s for the different UV techniques are displayed in Table 10 (32) Table 10: Ranges and repeatability’s for H2S and SO2 based on UV technique
UV technique Component wave length
model (32)
Range Repeatabilty
Cd lamp non‐ dispersive (nd)
H2S 228nm 933 0‐5ppm 0‐25ppm
1%
Ammonium Sulphide method
nd
H2S 228nm 4660 0‐5ppm 0‐300ppm
1%
Ammonium Sulphide method
dispersive
H2S 228nm IPS‐4 0‐10ppm 2%
Cd lamp non‐ dispersive filter
wheal
H2S 228nm 921 0‐25ppm 1%
Mn/Ni lamp non‐ dispersive filter
wheal
SO2 280nm 921 0‐25ppm 1%
Cd lamp non‐ dispersive filter
wheal
H2S 228nm 922 0‐50ppm 1%
Mn/Ni lamp non‐ dispersive filter
wheal
SO2 280nm 922 0‐100ppm 1%
Page 23
vrije Universiteit amsterdam rev1
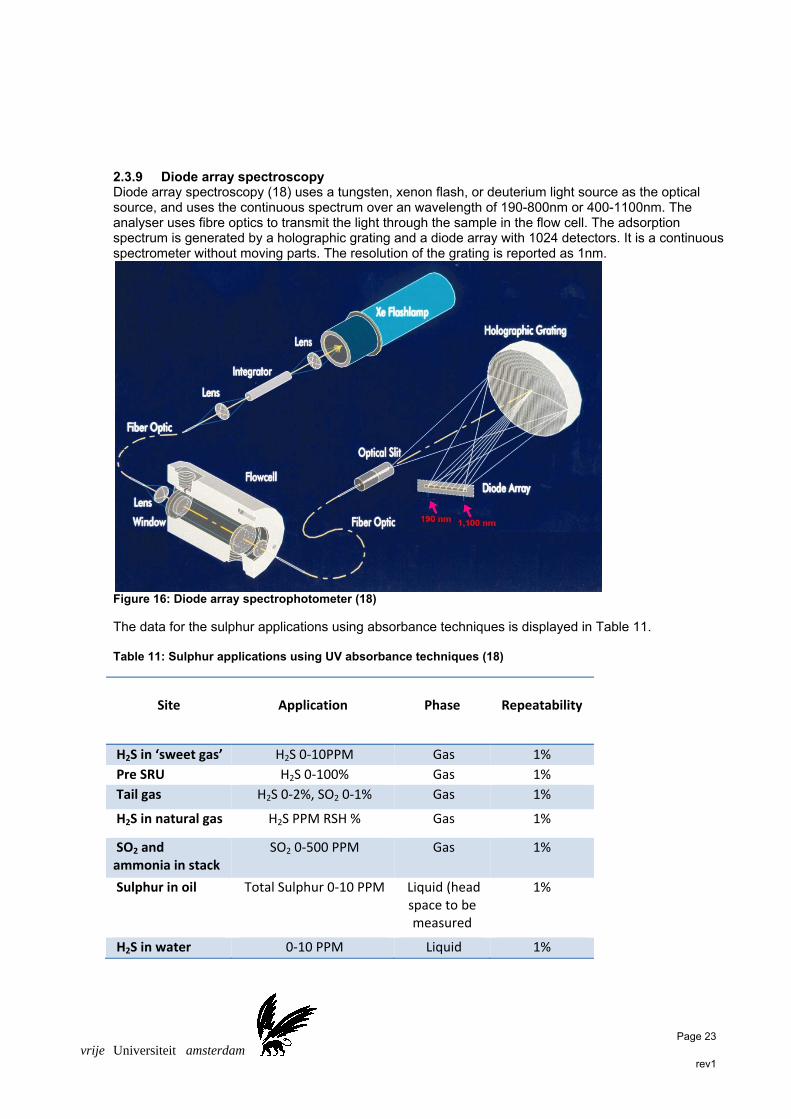
2.3.9 Diode array spectroscopy Diode array spectroscopy (18) uses a tungsten, xenon flash, or deuterium light source as the optical source, and uses the continuous spectrum over an wavelength of 190-800nm or 400-1100nm. The analyser uses fibre optics to transmit the light through the sample in the flow cell. The adsorption spectrum is generated by a holographic grating and a diode array with 1024 detectors. It is a continuous spectrometer without moving parts. The resolution of the grating is reported as 1nm.
Figure 16: Diode array spectrophotometer (18)
The data for the sulphur applications using absorbance techniques is displayed in Table 11. Table 11: Sulphur applications using UV absorbance techniques (18)
Site
Application
Phase
Repeatability
H2S in ‘sweet gas’ H2S 0‐10PPM Gas 1%
Pre SRU H2S 0‐100% Gas 1%
Tail gas H2S 0‐2%, SO2 0‐1% Gas 1%
H2S in natural gas H2S PPM RSH % Gas 1%
SO2 and ammonia in stack
SO2 0‐500 PPM Gas 1%
Sulphur in oil Total Sulphur 0‐10 PPM Liquid (head space to be measured
1%
H2S in water 0‐10 PPM Liquid 1%
Page 24
vrije Universiteit amsterdam rev1
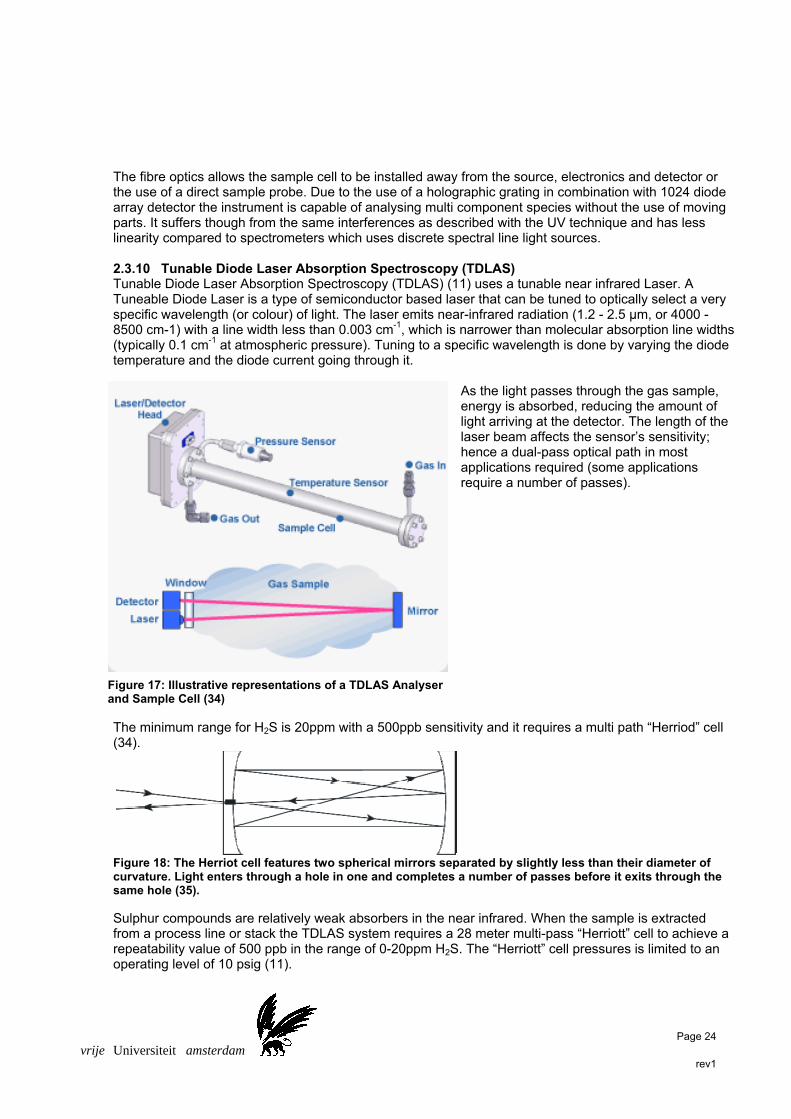
The fibre optics allows the sample cell to be installed away from the source, electronics and detector or the use of a direct sample probe. Due to the use of a holographic grating in combination with 1024 diode array detector the instrument is capable of analysing multi component species without the use of moving parts. It suffers though from the same interferences as described with the UV technique and has less linearity compared to spectrometers which uses discrete spectral line light sources. 2.3.10 Tunable Diode Laser Absorption Spectroscopy (TDLAS) Tunable Diode Laser Absorption Spectroscopy (TDLAS) (11) uses a tunable near infrared Laser. A Tuneable Diode Laser is a type of semiconductor based laser that can be tuned to optically select a very specific wavelength (or colour) of light. The laser emits near-infrared radiation (1.2 - 2.5 µm, or 4000 - 8500 cm-1) with a line width less than 0.003 cm-1, which is narrower than molecular absorption line widths (typically 0.1 cm-1 at atmospheric pressure). Tuning to a specific wavelength is done by varying the diode temperature and the diode current going through it.
As the light passes through the gas sample, energy is absorbed, reducing the amount of light arriving at the detector. The length of the laser beam affects the sensor’s sensitivity; hence a dual-pass optical path in most applications required (some applications require a number of passes).
The minimum range for H2S is 20ppm with a 500ppb sensitivity and it requires a multi path “Herriod” cell (34).
Figure 18: The Herriot cell features two spherical mirrors separated by slightly less than their diameter of curvature. Light enters through a hole in one and completes a number of passes before it exits through the same hole (35).
Sulphur compounds are relatively weak absorbers in the near infrared. When the sample is extracted from a process line or stack the TDLAS system requires a 28 meter multi-pass “Herriott” cell to achieve a repeatability value of 500 ppb in the range of 0-20ppm H2S. The “Herriott” cell pressures is limited to an operating level of 10 psig (11).
Figure 17: Illustrative representations of a TDLAS Analyser and Sample Cell (34)
Page 25
vrije Universiteit amsterdam rev1
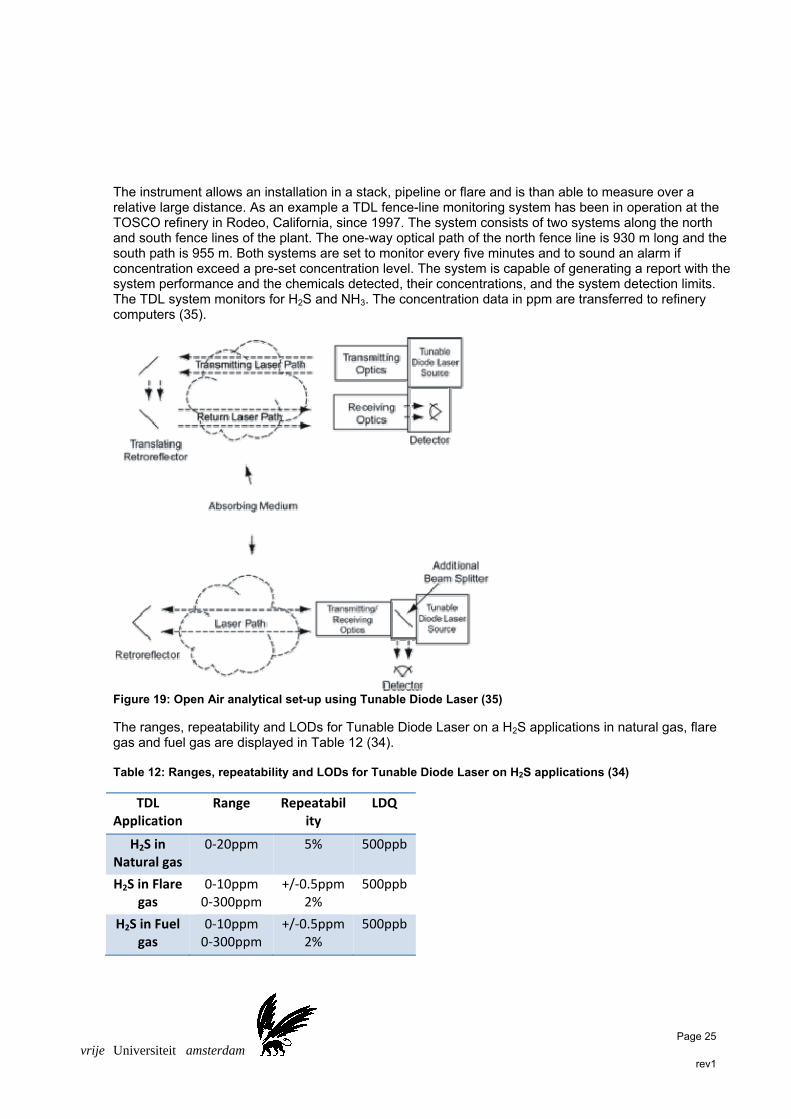
The instrument allows an installation in a stack, pipeline or flare and is than able to measure over a relative large distance. As an example a TDL fence-line monitoring system has been in operation at the TOSCO refinery in Rodeo, California, since 1997. The system consists of two systems along the north and south fence lines of the plant. The one-way optical path of the north fence line is 930 m long and the south path is 955 m. Both systems are set to monitor every five minutes and to sound an alarm if concentration exceed a pre-set concentration level. The system is capable of generating a report with the system performance and the chemicals detected, their concentrations, and the system detection limits. The TDL system monitors for H2S and NH3. The concentration data in ppm are transferred to refinery computers (35).
Figure 19: Open Air analytical set-up using Tunable Diode Laser (35)
The ranges, repeatability and LODs for Tunable Diode Laser on a H2S applications in natural gas, flare gas and fuel gas are displayed in Table 12 (34). Table 12: Ranges, repeatability and LODs for Tunable Diode Laser on H2S applications (34)
TDL Application
Range Repeatability
LDQ
H2S in Natural gas
0‐20ppm 5% 500ppb
H2S in Flare gas
0‐10ppm 0‐300ppm
+/‐0.5ppm2%
500ppb
H2S in Fuel gas
0‐10ppm 0‐300ppm
+/‐0.5ppm2%
500ppb
Page 26
vrije Universiteit amsterdam rev1
Literature (36) about the TDLAS states that UV spectroscopy suffers from misreading due to interfering components in the background gas and Gas Chromatography is to be highly complex, next to a high cost of service and consumables in respect to a TDLAS. 2.3.11 X-Ray spectroscopy X-Ray spectroscopy (20) for determination of elemental sulphur in liquid products in the 0.025nm – 1nm spectrum (röntgen). The D2622 method describes a sulphur absorption at 0.5373nm and a reference at 0.5190nm or 0.5437nm. The method dictates a Wavelength Dispersive X-Ray Fluorescence Spectrometer (WDXRF), equipped for X-ray detection in the wavelength range from 0.52 – 0.55nm. The analysing crystal must be suitable for the dispersion of sulphur Kα and background X-rays. The X-ray tube, should be capable of exciting sulphur Kα radiation, anode types of rhodium, chromium, and scandium are most used. The detector, for detecting the X-rays, should be capable of measuring in the wavelength range of interest (0.52 – 0.55nm). Interferences that are to be expected in fuels may not exceed the values as displayed in Table 13:
Table 13: Concentrations of interfering species
Species Mass %
Phosphorus 0.3
Zinc 0.6
Barium 0.8
Lead 0.9
Calcium 1
Chlorine 3
Oxygen 2.8
FAME 25
Ethanol 8.6
Methanol 6
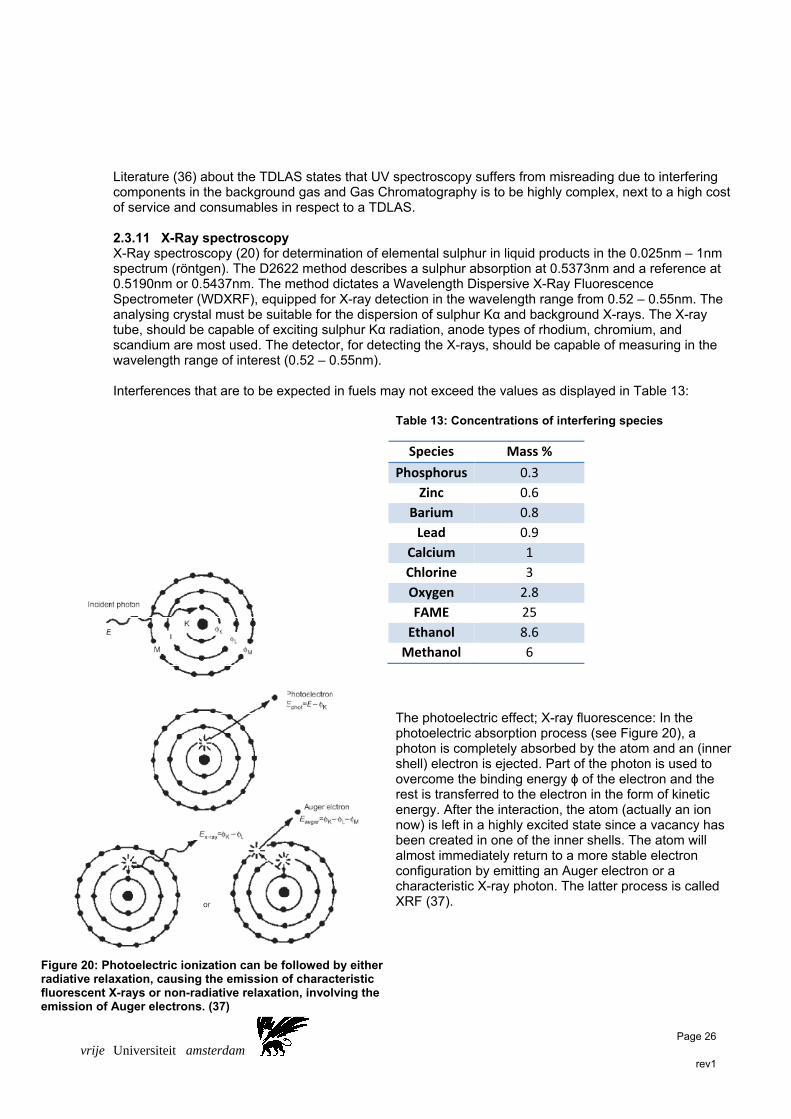
The photoelectric effect; X-ray fluorescence: In the photoelectric absorption process (see Figure 20), a photon is completely absorbed by the atom and an (inner shell) electron is ejected. Part of the photon is used to overcome the binding energy ϕ of the electron and the rest is transferred to the electron in the form of kinetic energy. After the interaction, the atom (actually an ion now) is left in a highly excited state since a vacancy has been created in one of the inner shells. The atom will almost immediately return to a more stable electron configuration by emitting an Auger electron or a characteristic X-ray photon. The latter process is called XRF (37).
Figure 20: Photoelectric ionization can be followed by either radiative relaxation, causing the emission of characteristic fluorescent X-rays or non-radiative relaxation, involving the emission of Auger electrons. (37)
Page 27
vrije Universiteit amsterdam rev1
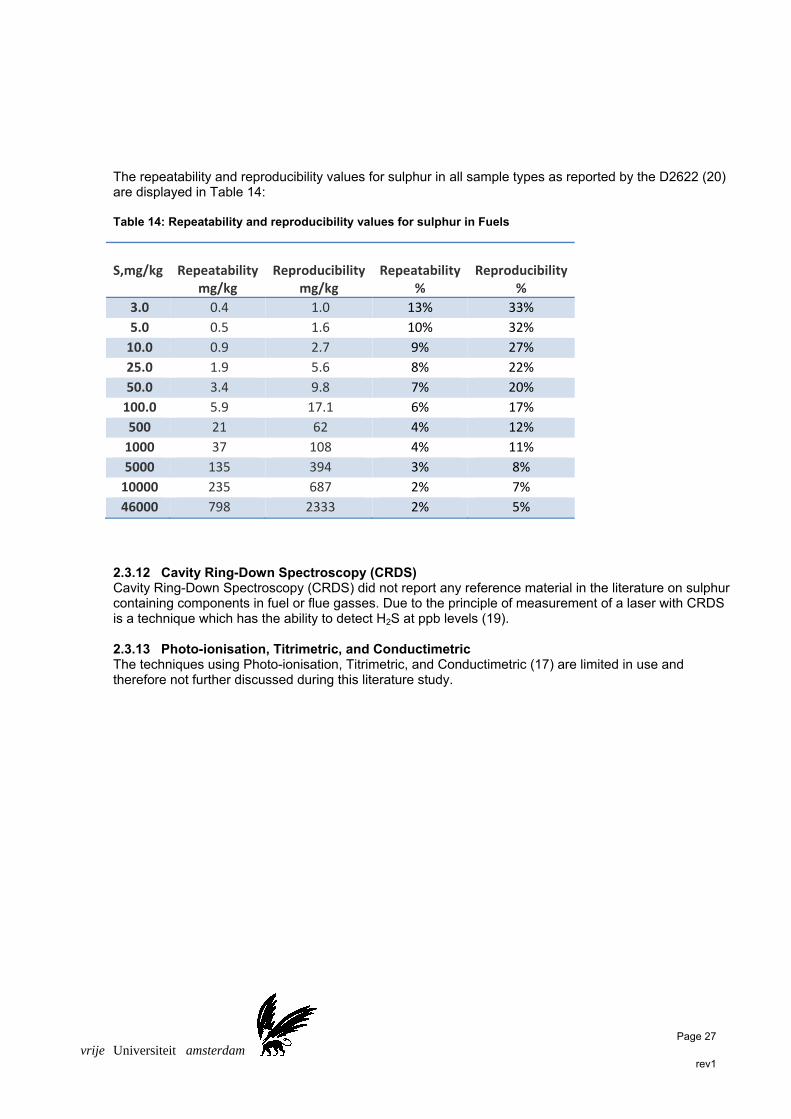
The repeatability and reproducibility values for sulphur in all sample types as reported by the D2622 (20) are displayed in Table 14: Table 14: Repeatability and reproducibility values for sulphur in Fuels
S,mg/kg
Repeatability
mg/kg
Reproducibility
mg/kg
Repeatability
%
Reproducibility
%
3.0 0.4 1.0 13% 33%
5.0 0.5 1.6 10% 32%
10.0 0.9 2.7 9% 27%
25.0 1.9 5.6 8% 22%
50.0 3.4 9.8 7% 20%
100.0 5.9 17.1 6% 17%
500 21 62 4% 12%
1000 37 108 4% 11%
5000 135 394 3% 8%
10000 235 687 2% 7%
46000 798 2333 2% 5%
2.3.12 Cavity Ring-Down Spectroscopy (CRDS) Cavity Ring-Down Spectroscopy (CRDS) did not report any reference material in the literature on sulphur containing components in fuel or flue gasses. Due to the principle of measurement of a laser with CRDS is a technique which has the ability to detect H2S at ppb levels (19). 2.3.13 Photo-ionisation, Titrimetric, and Conductimetric The techniques using Photo-ionisation, Titrimetric, and Conductimetric (17) are limited in use and therefore not further discussed during this literature study.
Page 28
vrije Universiteit amsterdam rev1
3 Personal critical opinion Regulation for the control of emissions state a graduate decreasing limit of emission. Analysers measuring and controlling the amount of pollutant emitted must be able to measure at such low levels. The restriction and consequent techniques to recover sulphur species is mainly a health protection issue and in 2nd place a corrosive problem of buildings, monuments and industrial installations. Sulphur is less present in the higher atmospheric layers due to the relative short residence time (4-7 days) in the troposphere (the 1st 20km of the atmosphere). Therefore it cannot easily penetrate to the stratosphere where greenhouse gasses have their largest negative effect. Sulphur will precipitate back to earth in the form of acid rain and it will have strong negative effects on the human health during smog conditions and it has corrosive effects on buildings, monuments and industrial installations. The emission of sulphur can directly be related to diseases and deaths (3) and it is therefore strongly recommended to reduce the amount of sulphur emissions much further than that dictated today. New industrial countries are often reluctant to join the emission reduction programs (e.g. the Kyoto-protocol) but the contradiction in this is that the economic growth is initiated to enhance the human live conditions which can only be reached when extra emissions are avoided. Gas Chromatographic methods for determination of (low) sulphur containing components is versatility and can be achieved using different detectors resulting in a wide dynamic range. (AED and SCD best for laboratory method of low sulphur containing component determination, FPD and PFPD best for laboratory and industrial (ASTM) method low sulphur containing component determination. µTCD in combination with µDMD would be good industrial method to cover low and high levels of sulphur containing components but no ASTM method is available yet for this application. Total sulphur methods are available using the sum of the individual components or total oxidation of sulphur to SO2. the summation method will allow reporting of individual components and provide information about specific (harmful) components. GC methods in general do not suffer from interferences as with optical methods due to the use of chromatographic separation columns. A wide variety of these columns are available. Disadvantages are the utilities necessary as the carrier, drift gas and cycle times. µGc overcomes this problem as it uses fast columns, which results in much shorter cycle times (30-60sec). Sulphur containing components have the tendency to adsorp to the sample lines. Therefore the materials used for the sample wetted part are critical for the success of the determination of low sulphur containing components. Calibration and validation of the sulphur analyses are recommended on a calibration standard at ppm level with a dilution system or using a permeation system set-up. Low (ppb) levels of sulphur in a calibration standard using bottles is not recommended for the same adsorption problems. Low dead volume sample handling is required to minimize cross interference between analysis cycles. Literature (12) describes the unrealistic use of a TCD detector for low determination of sulphur components. The µTCD with the use of µGC technology in combination with capillary columns will allow for low ppm level determination of sulphur components in different backgrounds. The µGC in combination with standard GC technology is available and can be used to detect the sulphur containing components in different backgrounds. ASTM Norms are a good way to test the equipment according a reference but the norm may be out dated as newer techniques become gradually available (38). Therefore a critical choice must be made weather to chose old referenced techniques or newer not tested/proven technology. Lead acetate sulphur analyses has a number of ASTM approvals and is therefore widely used for H2S and total sulphur determination, the technique is relatively strong influenced by temperature, sample pressure fluctuations and tape breakage. The initial costs of a lead acetate sulphur analyser are relative low but the operational costs are relative high. The lead acetate tape is a relative expensive and toxic
Page 29
vrije Universiteit amsterdam rev1
consumable, leakage in the tape cartridge leads to damage of the entire tape. Cycle times of 3 minutes and repeatability of 10% RSD is relative poor compared to other techniques (optical and µGC). It is therefore an outdated technique candidate for replacement by more modern techniques as UV spectroscopy, XRF, Laser and (fast) chromatography. UV technique for sulphur measurement is a continuous and fast optical technique for determination of sulphur containing components. Low levels (0-5ppm) of H2S and SO2 can be measured in the different matrixes. The technique suffers from interferences from hydrocarbons but different compensating features are available to account for the interferences. The sample which is fed to a optical sample cell can be maintained at high pressure and temperature if necessary, which, will exclude complex sample handling steps as with other techniques (i.e. paper tape, GC). Single beam photometers with a beam splitter have the advantage of no moving parts which makes the instrument very robust in comparison with filter wheal techniques or instruments with a moving grating. Light sources with discrete spectral lines suffer less from spectral shift and linearity problems compared to continuous light sources with filter wheals or gratings. Diode array spectroscopy is a optical technique as with the described UV technique for the continuous and fast determination of sulphur containing components. Low levels of H2S (0-10ppm) and SO2 (0-500ppm) can be measured in the different matrixes. The fibre optics allows the sample cell to be installed away from the source, electronics and detector or the use of a direct sample probe. Due to the use of a holographic grating in combination with 1024 diode array detector the instrument is capable of analysing multi component species without the use of moving parts. It suffers though from the same interferences as described with the UV technique and has less linearity compared to spectrometers which uses discrete spectral line light sources. Tuneable Diode Laser Absorption Spectroscopy (TDLAS) is a fast analytical technique that can be used for single component (H2S) measurement in moderate ranges (0-20ppm). An advantage is the ability to place the analytical device direct on a stack or use an open path track in a plant to monitor H2S in ambient air. Direct pipeline installation will avoid the release of analyser sample waste gas. The sample will not be in direct contact with the source and detector, which will minimize contamination of the analytical device. To reach the intended detection limits the device requires a multi pass sample cell system. Literature (36) about the TDLAS states that UV spectroscopy suffers from misreading due to interfering components in the background gas and Gas Chromatography is to be highly complex, next to a high cost of service and consumables in respect to a TDLAS. Current UV techniques (11) uses high reliable compensation techniques for interfering components eliminating misreading. As stated in (39) new micro-GC developments allow for low detection of H2S using a micro-TCD. TDLAS is sensitive to spectral shifting due to temperature fluctuations, a way to overcome this problem is the use of a reference cell filled with the measured component as mentioned by (40) for the measurement of moisture in natural gas. An automatic routine will correct for the spectral shifting of the peak by locking the laser to the components absorption line (40). This reference cell can also be used for verification of component concentration. X-Ray Fluorescence spectroscopy (XRF) is one of the few techniques for the determination of total sulphur in liquid fuels (e.g. naphtha, gasoline, diesel), other techniques (28) using the gas chromatographic method in conjunction with a pyrolizer to convert the sulphur species to SO2 are only feasible for total sulphur in relative light liquid fuels (e.g. naphtha and gasoline). In the lower ranges (0-5ppm, 0-10ppm) the gas chromatographic method is more precise (RSD=3%) than the XRF method (RSD=10%) and this is the range that is of most interest for environmental issues. XRF is faster (200-600sec) than GC (720sec). Cavity Ring-Down Spectroscopy (CRDS) did not report any reference material in the literature on sulphur containing components in fuel or flue gasses. Due to the principle of measurement of a laser with CRDS is a technique which has the ability to detect H2S at ppb levels (19).
Page 30
vrije Universiteit amsterdam rev1
The techniques using Photo-ionisation, Titrimetric, and Conductimetric (17) are limited in use and therefore not further discussed during this literature study. 4 Conclusions A wide variety of analytical techniques are available for the determination of sulphur components in Flue gas, Fuel gas and Natural gas in different ranges. The literature research focuses on the determination of H2S in Natural gas (0-5/120ppm), Fuel gas (0-2500ppm) and Flue gas (0-5/10ppm), the determination of SO2 in Flue gas (0-1ppm) and the determination of Total Sulphur in Natural gas (0-5ppm) and Liquid fuels (0-10ppm) (e.g. Naphtha, Diesel). The measurement of sulphur components is important for health, environmental and industrial (corrosion) protection. Environmental regulation require a gradually further decreasing emission of pollutants. The analytical techniques that are developed and enhanced over time are gradually able to detect these pollutants at the required (lower) quantities. New techniques developed for the mentioned measurements are; Laser spectroscopy for the measurement of H2S at moderate ranges (0-20ppm) are feasible with Tuneable Diode Laser Absorption Spectroscopy (TDLAS). Low levels of H2S (0-10ppm) and SO2 (0-500ppm) are feasible with Diode array spectroscopy. TDLAS suffers from spectral shifting which can be compensated for using a new peak locking technique using a reference cell filled with the measured component. The reference cell can also be used for verification purposes. Both techniques are fast (30-60sec) and have the advantage to have no sample contact and direct in-line measurement. The Micro-Gas Chromatography with micro-Thermal Conductivity and Different Mobility Detection (DMD) can be used for the fast (30-60sec) measurement of H2S and SO2 (0.01-2500ppm) and can be extended with the measurement of other sulphur species. The micro-GC requires (small) amounts of Helium carrier gas and when the DMD is used Air is needed as a transport gas. In the range of 0.5-5ppm H2S the µTCD is sufficient for the analyses. Other Chromatographic detectors (FPD/PFPD/SCD and AED) allow for low determination (5-50ppb LODs) of (total) sulphur components and a combination with a pyrolizer and FPD can be used for low determination (0-5ppm) in liquid fuels (naphtha and diesel). Existing and proven techniques are UV spectroscopy, Lead acetate and X-Ray Fluorescence spectroscopy. Lead acetate suffers from temperature and pressure fluctuations and has therefore a moderate repeatability (10%) is a relative slow technique (180sec) with a high consumable toxic waste. The measurement is in the range of 0.01ppm to percentage level (H2S and Total Sulphur in gases) and has a number of ASTM approvals. The unit is therefore widely in use. UV spectroscopy is robust technique as the analyser has minimum sample contact, the sample cell can be operated at high temperatures (500ºC) and pressures (350kPa-15MPa). The technique suffers from interference from matrix components but has advanced algorithms/techniques for interference compensation/prevention (multi wavelength/frontal elution). The technique is fast (<30sec) and can operate in a minimum range of 0.1-5ppm up to high percentage levels H2S and SO2 and has lower detection limits in comparison to TDLAS. X-Ray Fluorescence spectroscopy is one of the few techniques for the direct determination of total sulphur in liquid fuels (e.g. naphtha, gasoline, diesel) in the range of 1ppm to percentage levels within 200-600 seconds. As compared to the gas chromatographic method, which uses a pyrolizer to convert the sulphur species to SO2, are only feasible for total sulphur in relative light liquid fuels (e.g. naphtha and gasoline). In the lower ranges (0-5ppm, 0-10ppm) the gas chromatographic method is more precise (RSD=3%) than the XRF method (RSD=10%). Overall can be concluded that best analytical technique for sulphur containing components based on their ranges, repeatability’s and speed can be addressed as follows:

Page 31
vrije Universiteit amsterdam rev1
For total sulphur in liquids, XRF is the best technique for total sulphur in diesel and GC with FPD and pyrolizer for low quantities in naphtha and gasoline. XRF is faster (200-600sec) than GC (720sec). For the gas phase matrixes TDLAS & UV technique are best for high and moderate levels (>20ppm) of H2S and SO2. For direct in stack or open path measurement TDLAS is best. UV and UV Diode array spectrometry are best for low H2S (0-5/10ppm) and SO2 (0-1ppm) determination. Both have the advantage of speed (<30sec) and minimum sample contact. GC and µGC (DMD) are best for ultra low detection (5/200ppb), µGC in combination with µTCD is an interesting alternative for low determination of H2S (0.5-5ppm) as well as higher (2500ppm) concentrations.
Page 32
vrije Universiteit amsterdam rev1
5 Literature list 1. Agency, European Environment. Annual European Community LRTAP Convention emission inventory report 1990–2006. Copenhagen : European Environment Agency, 2008. ISBN 978-92-9167-366-7. 2. Register, EPER: the European Pollutant Emission. EPER Review Report 2004. Copenhagen K, Denmark : European Commission, 2007. 3. Atmosphere, Climate & Environment Information Programme. Encyclopedia of the Atmospheric Environment. London : Atmospheric Research & Information Centre, 2004. 4. J.E. Andrews, P. Brimblecombe, T.D. Jickells, P.S. Liss, B. Reid. An Introduction to Environmental Chemistry. United Kingdom : Blackwell Publishing, 2006. ISBN-13:978-0-632-05905-8. 5. VROM, Ministerie van. Ministerie van VROM. [Online] 2008. [Cited: 28 07 2008.] http://international.vrom.nl/pagina.html?id=21535. 6. Integrated Pollution Prevention and Control, Joint Research Centre. BREF (Best Available Techniques reference document) for Mineral Oil and Gas Refineries and Large Combustion Plants. Seville : Integrated Pollution Prevention and Control, Joint Research Centre, 2003, 2006. 7. Meyers, Robert A. HANDBOOK OF PETROLEUM REFINING PROCESSES Third edition. s.l. : McGraw-Hill, 2004. 8. Rossum, G.J. van. Gas Quality. Gas Quality, Proceedings of the congress of Gas quality specification and measurement of physical and chemical properties of natural gas Groningen The Netherlands. Groningen : Elsevier, 1986. 9. Inc., Galvanic Applied Sciences. Sulphur Measurement Handbook. Sulphur Measurement Handbook. Houston : Galvanic Applied Sciences Inc. 10. Schreve, Marshall T. Determination of H2S and Total sulphur in Natural gas. Texas USA : Del Mar Scientific, Inc. EQ 5090. 11. Instruments, Ametek Process. Measurement of Pipeline H2S with a Photometric-Based Analyser, Comparison of NDUV and Laser IR Techniques. Calgary : Ametek Inc., 2007. NDUVTDLAS(030508). 12. Farmer, Bob. Options in Gas Chromatographic techniques for measurement of H2S in Fuel Gas. Bartesville, OK, USA : Instrumentation, Systems and Automation Society (ISA), 2009. 13. Inc., Varian. Scanview. Varian Inc. Scanview. [Online] 10 06 2009. [Cited: 01 06 2009.] http://www.varianinc.com/cgi-bin/scanweb/scanview. 14. —. Sulphur in Gas Analyzer using a DMD. Middelburg : Varian Inc., 2004. CP501681. 15. Gas Chromatography with State-of-the-Art Micromachined Differential Mobility Detection: Operation and Industrial Applications. Jim Luong, Ronda Gras, Rony Van Meulebroeck, Frances Sutherland, Hernan Cortes. Vol. 44, Canada : Journal of Chromatographic Science, 2006, Vols. , May/June. 16. Instruments, Hobre. Sulphur analysis with XRF method. Purmerend : Hobre Instruments, 2009. 17. Clevett, Kenneth J. Process Analyser Technology. Process Analyser Technology. New Jersey : John Wiley & Sons, 1986. 18. Rollo, Aaron J. Diode Array Process Analyzer - For Sulphur Recovery Applications. s.l. : Instrument, Systems, and Automation Society, 2007. 19. Dr. Yu Chen and Lisa Bergson, Tiger Optics. Analyzing Gas Samples with Laser-Based Spectroscopy. Sensors. [Online] [Cited: 04 03 2009.] http://www.sensorsmag.com/sensors/Feature+Articles/Analyzing-Gas-Samples-with-Laser-Based-Spectroscop/ArticleStandard/Article/detail/505580. 20. Method, American Standard Test. D4045-99, D2420-96, D2622-08, D4323-97, D4468-95, D4810-94, D4084-94, D5453-93, D5504-98, D5623-99(1999). West Conshohocken : ASTM International, 2009. D4045-99, D2420-96, D2622-08, D4323-97, D4468-95, D4810-94, D4084-94, D5453-93, D5504-98, D5623-99(1999). 21. Coen Duvekot, Edwin Hollebrandse. The analysis of Sulphur Components in Various LPGs. Middelburg : Varian Inc., 2009. Application Note SI-01589. 22. Technologies, Agilent. Excellent Choices for Global Hydrocarbon Processing Applications. Walnut Creek, CA USA : Agilent Technologies, Inc., 2003. 23. PID Analysers, LCC. HNU Portable Analyser Technology & Specifications. Pembroke : PID Analysers,LCC.
Page 33
vrije Universiteit amsterdam rev1
24. Schoenmakers, Peter, et al. Chromedia. Chromedia. [Online] 01 02 2008. [Cited: 01 02 2009.] http://www.chromedia.org. 25. R.E. Sherman, L.Rhodes. Analytical instrumentation. [book auth.] R.E. Sherman. Analytical instrumentation. New York : Instrument Society of America, 1996. 26. Al-Shalchi, Wisam. Determination of Traces in Natural gas. Baghdad : s.n., 2005. 27. United States Environmental Protection Agency (EPA), Emission Measurement Center (EMC). CFR Promulgated Test Methods (TM) GC methods for H2S, Total Sulphur; Methods 15, 16& 16B. Washington, DC : EPA, 2000. 28. Jerry Clemons, Bill Johnson. Trace total Sulphur measurement with a flame photometric detector. Lewisburg : ABB Process Analytics, 1993. 29. Robert L. Grob, Eugene F. Barry. MODERN PRACTICE OF GAS CHROMATOGRAPHY, Fourth edition. Hoboken, New Jersey : John Wiley & Sons, Inc, 2004. ISBN 0-471-22983-0. 30. Roger L. Firor, Bruce D. Quimby. A comparison of Sulphur Selective Detectors for low level analyses in gaseous streams. Wanut Creak, CA USA : Agilent Technologies Inc., 2001. 5988-2426EN. 31. Adrichem, Arno van. H2S Testdata. Rotterdam : Exxon Mobil, 2009. 32. Inc., Ametek. Instrumentation for Natural Gas Applications . [CD-Rom] Newark : AMETEK, 2001. 33. COMBUSTIBLES MEASUREMENT IN SULPHUR RECOVERY UNIT ACID GAS WITH A COMBINED NDUV/NDIR ANALYZER. Randy Hauer, Kevin Harris, Dan Potter. Calgary : The Instrument and Automation Society ISA, 2008. 34. Inc., Spectra Sensors. H2S Applications. Spectra Sensors. [Online] Spectra Sensors, 05 08 2009. [Cited: 05 08 2009.] http://www.spectrasensors.com/h2s/. 35. Measurement and Monitoring Technologies for 21st century. The Hazardous Waste Clean-Up Information (CLU-IN) Web Site . [Online] U.S. Environmental Protection Agency (EPA) , 27 02 2008. [Cited: 06 08 2009.] http://clu-in.org/programs/21m2/openpath/tdl/#refs. 36. PinPoint Precision. Miller, Sam. 1, Houston : Hydrocarbonengineering, 2008, Vol. 02/08. 37. K. Janssens. X-ray based methods of analysis. [book auth.] Janssens and Van Grieken (Eds.). Comprehensive Analytical Chemistry XLII. Antwerp : Elsevier B.V., 2004. 38. The Analytical Chemist in Industry. Janssen, J.G.M. Schoenmakers, P.J. Wal, S. van der. Amsterdam : UVA, 2007. 39. Lenior, Tim. Accelerated Process Analyses by means of micro Process Gas Chromatograph (uPGC) systems . Amsterdam : VU University, 2009. 40. Inc., Ametek. Model 5100 NCM Moisture Verification. Pittsburg : Ametek Inc., 2007. 5100 tech note (11/16/07). Appendix 1: ASTM (American Standard Test Methods) Note: all mentioned ppm concentrations in the literature thesis are volume based, unless otherwise stated.
Page 34
vrije Universiteit amsterdam rev1
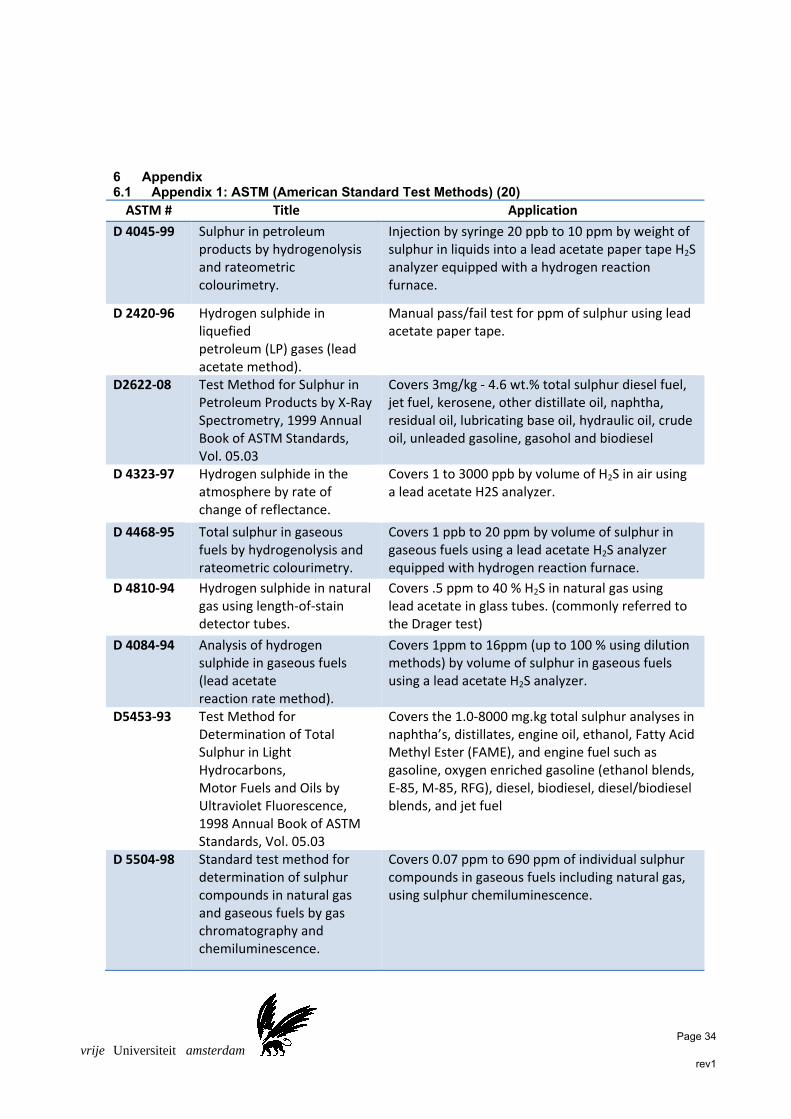
6 Appendix 6.1 Appendix 1: ASTM (American Standard Test Methods) (20) ASTM # Title Application
D 4045‐99 Sulphur in petroleum products by hydrogenolysis and rateometric colourimetry.
Injection by syringe 20 ppb to 10 ppm by weight of sulphur in liquids into a lead acetate paper tape H2Sanalyzer equipped with a hydrogen reaction furnace.
D 2420‐96 Hydrogen sulphide in liquefied petroleum (LP) gases (lead acetate method).
Manual pass/fail test for ppm of sulphur using lead acetate paper tape.
D2622‐08 Test Method for Sulphur in Petroleum Products by X‐Ray Spectrometry, 1999 Annual Book of ASTM Standards, Vol. 05.03
Covers 3mg/kg ‐ 4.6 wt.% total sulphur diesel fuel, jet fuel, kerosene, other distillate oil, naphtha, residual oil, lubricating base oil, hydraulic oil, crudeoil, unleaded gasoline, gasohol and biodiesel
D 4323‐97 Hydrogen sulphide in the atmosphere by rate of change of reflectance.
Covers 1 to 3000 ppb by volume of H2S in air using a lead acetate H2S analyzer.
D 4468‐95 Total sulphur in gaseous fuels by hydrogenolysis and rateometric colourimetry.
Covers 1 ppb to 20 ppm by volume of sulphur in gaseous fuels using a lead acetate H2S analyzer equipped with hydrogen reaction furnace.
D 4810‐94 Hydrogen sulphide in natural gas using length‐of‐stain detector tubes.
Covers .5 ppm to 40 % H2S in natural gas using lead acetate in glass tubes. (commonly referred to the Drager test)
D 4084‐94 Analysis of hydrogen sulphide in gaseous fuels (lead acetate reaction rate method).
Covers 1ppm to 16ppm (up to 100 % using dilution methods) by volume of sulphur in gaseous fuels using a lead acetate H2S analyzer.
D5453‐93 Test Method for Determination of Total Sulphur in Light Hydrocarbons, Motor Fuels and Oils by Ultraviolet Fluorescence, 1998 Annual Book of ASTM Standards, Vol. 05.03
Covers the 1.0‐8000 mg.kg total sulphur analyses in naphtha’s, distillates, engine oil, ethanol, Fatty Acid Methyl Ester (FAME), and engine fuel such as gasoline, oxygen enriched gasoline (ethanol blends, E‐85, M‐85, RFG), diesel, biodiesel, diesel/biodiesel blends, and jet fuel
D 5504‐98 Standard test method for determination of sulphur compounds in natural gas and gaseous fuels by gas chromatography and chemiluminescence.
Covers 0.07 ppm to 690 ppm of individual sulphur compounds in gaseous fuels including natural gas, using sulphur chemiluminescence.

Page 35
vrije Universiteit amsterdam rev1
D 5623‐99 (1999)
Standard test method for sulphur compounds in light petrolum liquids by gas chromatography and sulphur selective detection.
Covers 0.07 to 690 ppm of individual sulphur compounds in light petroleum gases using sulphur chemiluminescence.