Embed Size (px)
Citation preview
Guest Editor: Timothy R. Baker
ANALYTICAL STRATEGIES FOR IDENTIFYINGDRUG METABOLITES
Chandra Prakash,1* Christopher L. Shaffer,1 and Angus Nedderman2
1Pfizer Global Research and Development, Eastern Point Road, Groton,Connecticut 063402Pfizer Global Research and Development, Ramsgate Road, Sandwich, KentCT13 9NJ, UK
Received 9 March 2006; received (revised) 16 September 2006; accepted 17 September 2006
Published online 2 April 2007 in Wiley InterScience (www.interscience.wiley.com) DOI 10.1002/mas.20128
With the dramatic increase in the number of new chemicalentities (NCEs) arising from combinatorial chemistry andmodern high-throughput bioassays, novel bioanalytical techni-ques are required for the rapid determination of the metabolicstability and metabolites of these NCEs. Knowledge of themetabolic site(s) of the NCEs in early drug discovery isessential for selecting compounds with favorable pharmacoki-netic credentials and aiding medicinal chemists in modifyingmetabolic ‘‘soft spots’’. In development, elucidation ofbiotransformation pathways of a drug candidate by identifyingits circulatory and excretory metabolites is vitally important tounderstand its physiological effects. Mass spectrometry (MS)and nuclear magnetic resonance (NMR) have played aninvaluable role in the structural characterization and quanti-fication of drug metabolites. Indeed, liquid chromatography(LC) coupled with atmospheric pressure ionization (API) MShas now become the most powerful tool for the rapid detection,structure elucidation, and quantification of drug-derivedmaterial within various biological fluids. Often, however, MSalone is insufficient to identify the exact position of oxidation,to differentiate isomers, or to provide the precise structure ofunusual and/or unstable metabolites. In addition, an excess ofendogenous material in biological samples often suppress theionization of drug-related material complicating metaboliteidentification by MS. In these cases, multiple analytical and wetchemistry techniques, such as LC–NMR, enzymatic hydrolysis,chemical derivatization, and hydrogen/deuterium-exchange(H/D-exchange) combined with MS are used to characterizethe novel and isomeric metabolites of drug candidates. Thisreview describes sample preparation and introduction strate-gies to minimize ion suppression by biological matrices formetabolite identification studies, the application of variousLC–tandem MS (LC–MS/MS) techniques for the rapidquantification and identification of drug metabolites, and futuretrends in this field. # 2007 Wiley Periodicals, Inc., Mass SpecRev 26:340–369, 2007
Keywords: biotransformation; LC–MS/MS; metabolites;structural characterization; derivatization; H/D-exchange;LC–NMR
I. INTRODUCTION
The drug development process is scientifically complex andfinancially risky, hence very time consuming and expensive(Grabowski, Vernon, & DiMasi, 2002; DiMasi, Hansen, &Grabowski, 2003). It has been estimated that for every 5,000 newchemical entities (NCEs) evaluated in a discovery program, onlyone is approved for market (Caldwell, 1996). Accordingly,efforts are being made to reduce attrition of drug candidatesduring the various stages of their development while bringingsafer compounds to market. Among the major reasons for NCEfailure, other than poor clinical efficacy, are serious undesiredside effects, adverse drug reactions, and unfavorable drugmetabolism and pharmacokinetics (DMPK) (Eddershaw &Dickins, 1999; White, 2000; Riley, Martin, & Cooper, 2002;Smith, Schmid,& Jones, 2002; Alavijeh&Palmer, 2004; Nassar,Kamel,&Clarimont, 2004a,b). Given the inherent inefficiency ofdrug development, it is essential to identify such factors early inthe drug discovery process, which has compelled the pharma-ceutical industry to integrate more greatly DMPK functions intothe early stages of drug discovery. Among DMPK properties,determining the metabolic stability and metabolite profile of anNCE play a key role in the drug discovery and developmentprocess (Clarke et al., 2001; Korfmacher et al., 2001; Kostiainenet al., 2003; Watt et al., 2003). Such DMPK integration shouldallow the selection of a drug candidate that has favorableclearance, good oral bioavailability, and optimum half-life,as well as acceptable metabolic and toxicological profiles inpreclinical species and humans.
Metabolism is a biochemical process by which endogenouscompounds and xenobiotics are converted to more hydrophilic(water soluble) entities, which enhance their elimination from thebody (Parkinson, 2001). In general, metabolites are pharmaco-logically less active and less toxic than their corresponding parentcompound. However, it is not uncommon that biotransformationreactions also lead to undesirable consequences, such as too
Mass Spectrometry Reviews, 2007, 26, 340– 369# 2007 by Wiley Periodicals, Inc.
————*Correspondence to: Chandra Prakash, Pfizer Global Research and
Development, Eastern Point Road, Groton, CT 06340.
E-mail: [email protected]

rapid drug clearance, formation of pharmacologically activemetabolites (Fura et al., 2004), drug–drug interactions via inhi-bition or induction of drug metabolizing enzymes (Rodrigues,2002; Obach, 2003), and/or formation of toxic metabolites (Blair& Tilve, 2002; Baillie, 2003; Evans et al., 2004; Kalgutkaret al., 2005). Therefore, determination of an NCE’s metabolicrate, biotransformation pathways in animals and humans,and pharmacological and toxicological consequences of itsmetabolites are very critical to pharmaceutical research andcompound progression (Kostiainen et al., 2003; Watt et al.,2003).
Xenobiotics, such as drugs, aremetabolized by two differentreactions: Phases I and II. Phase I, or functionalization, reactionsinclude: hydroxylation (aliphatic, aromatic, or nitrogen),epoxidation (aliphatic, aromatic), dealkylation (O-, N-, or S-),deamination, oxidation (N-, or S-), reduction (nitro, azo,disulfide, keto, aldehyde, olefin), and hydrolysis (amide, ester,carbamate, epoxide). These reactions introduce or unmask afunctional group (e.g., –OH, –CO2H, –NH2, or –SH) within amolecule to enhance its hydrophilicity. These Phase I reactionsare mediated primarily by liver enzymes, such as cytochromeP450 (CYPs), FAD-containing mono-oxygenases (FMOs),monoamine oxidases (MAOs), aldehyde oxidase/xanthine oxi-dase (AO/XO), alcohol dehydrogenase (ADH), aldo-ketoreduc-tase (AKR), esterases, dehydropeptidase, and epoxide hydrolase(EH). Phase II, or conjugation, biotransformations includeglucuronidation, sulfation, methylation, acetylation, and aminoacid (glycine, glutamic acid, and taurine) and glutathione (GSH)conjugation. Phase II reactions are catalyzed by conjugativeenzymes, such as UDP-glucuronyltransferase (UGT), sulfotrans-ferase (SULT), glutathione S-transferase (GST), N-acetyltransferase (NAT), and methyl transferase (N-methyl-, thio-methyl-, and thiopurinemethyl-). Glutathione conjugates arefurther metabolized to cysteine and N-acetyl cysteine adducts(i.e., mercapturic acid synthesis). Most Phase II reactions resultin a compound’s concomitant increase in hydrophilicity anddecrease in volume of distribution (VDss), which together greatlyfacilitate its excretion from the body.
In early discovery, simple in vitro systems, such assubcellular liver fractions or hepatocytes, are used to determinethe metabolic fates of NCEs. The information from these studiescan assist medicinal chemists to synthesize rationally metabo-lically stable analogs by blocking the site of metabolism, whichcould result in the discovery of NCEs with superior pharmacol-ogy and safety. In the development phase, the metabolic profilesof an NCE are determined definitively in preclinical species andhumans following its radiolabel administration. Metabolicpathways of drug candidates elucidated in laboratory animalsprovide guidance for the selection of animal species used forsafety evaluation studies to ensure that the selected animalspecies are exposed to all major metabolites formed in humans(Baillie et al., 2002). Subsequently,major circulatorymetabolitesin humans can be synthesized for the evaluation of theirpharmacological activity.
Gas chromatography coupled with MS (GC–MS) has beenused extensively for quantifying and identifying trace compo-nents in complex sample mixtures for a wide variety ofcompounds. However, because of the often burdensome processof analyte derivatization prior toGC-MSanalysis, the high speed,
enhanced resolution, and greater sensitivity and specificity ofLC–tandem MS (LC–MS/MS) has made it the preferred choicefor the rapid identification of metabolites (Jamel et al., 2003;Anari & Baillie, 2005; Cox, 2005; Hop & Prakash, 2005; Kamel& Prakash, 2006). Commonly used tandem mass spectrometersinclude triple-stage quadrupole (TSQ), three-dimensional iontrap, and quadrupole time-of-flight (Q-TOF), although newlyintroduced hybrid mass spectrometers have also been used foranalysis of drug metabolites (Hager, 2002b; Hu et al., 2005;Thevis et al., 2005). While the majority of analytical character-ization of metabolites can be performed solely with a TSQ(Prakash & Soliman, 1997; Hop & Prakash, 2005; Johnson &Prakash, 2005), other MS instruments (e.g., ion trap and Fouriertransform (FT)-MS) can provide additional and valuableinformation for metabolite identification. The ability of ion trapsto perform multiple stage MS (MSn) and the powerfulimplementation of data-dependent operation in the instrumentcontrol software are advantageous in structural elucidation. TheQ-TOF has also been very useful because of its enhanced full-scan sensitivity, scan speed, improved resolution, and ability tomeasure the accurate masses of protonated molecules and theirfragment ions (Hop, 2004). However, MS data alone do notalways provide sufficient structural information for completecharacterization of metabolites. In such cases, other analyticaland wet chemistry techniques enable unambiguous structuraldetermination of metabolites (Prakash & Cui, 1997; Cui et al.,2004; Miao, Kamel, & Prakash, 2005).
II. METHODOLOGY
A. Mass Spectrometry (MS)
Over the past decades, MS has revolutionized analyticalchemistry. Instead of characterizing compounds by extremelytedious and often low sensitivity methods (e.g., LC–UV,derivatization, chemical treatments, IR, etc.), MS allowed theanalysis of a complex mixture for trace amounts of a particularcompound. Not only did mass spectrometric analysis report theprecise mass of compounds to confirm their presence, it waseventually used to generate a fragment ion spectrum of acompound. This fragmentation pattern, often a unique molecularsignature of organic compounds, can be deconvoluted using theprinciples of physical organic chemistry to help determine thestructure of an unknown molecule.
To use MS, the analyte must be converted to the gas phaseand imparted a charge for a mass-to-charge (m/z) determinationby the mass analyzer. Thus, early MS applications analyzedsamples of highly volatile, readily ionizable organic substanceswithin low boiling organic solvents. For the analysis ofcomponents within aqueous matrices (wet-chemistry andbiological solutions being of greatest interest), the analyte hadto first be extracted into high-volatile organic solvents, but eventhis did not directly translate into acceptable analyte vaporizationand/or ionization. To circumvent this requirement for polarmolecules resistant to organic extraction and/or favorableionization, aqueous solutions were treated with derivatizationagents to convert the polar analyte to a chemically modified formamenable to organic extraction. Not only did derivatization
IDENTIFICATION OF DRUG METABOLITES &
Mass Spectrometry Reviews DOI 10.1002/mas 341
enhance extractability, it also often resulted in a more volatilemolecule enhancing MS sensitivity. The ability to detectmolecular masses within solutions was extremely useful, butsoon the desire to simplify complex mixture analysis resulted inthe coupling of separation techniques with MS.
Instinctively, because of the requirements ofmolecules to bein the gas phase for MS analysis, GC was first placed in-line(‘‘hyphenated’’) with MS. The desire to analyze polarcompounds in aqueous biological solutions directly withoutthe limitations imposed by derivatization and/or extraction forGC–MS analysis culminated in the interfacing of liquidchromatography (LC) with MS and the development of the softionization techniques fast atom bombardment (FAB), matrixassisted laser desorption-ionization (MALDI), and atmosphericpressure ionization (API) for the vaporization of analyte-containing aqueous solutions. A combination of the coupling ofLC with MS and the advancements in MS technology to producetandem-quadrupole and ion-trap instrumentation has propelledLC–MS to the dominant analytical instrumentation used in thebiopharmaceutical industry for the detection, quantification, andstructure elucidation of drug-related material within variousbiological matrices (Jamel et al., 2003; Anari & Baillie, 2005;Cox, 2005; Hop & Prakash, 2005; Kamel & Prakash, 2006). Thehigh speed, selectivity, and sensitivity of LC–MS has mostrecently been applied further to themonitoring of physiologicallyrelevant endogenous compounds and macromolecules in thefields of biomarkers and metabonomics (Wilson et al., 2005).
B. Gas Chromatography–MassSpectrometry (GC–MS)
Because of the requirement of analyte being in the gas phase forMS analysis, MS was first coupled with the high efficiencyseparation of capillary gas chromatography (GC) during the1960s. Modern GC–MS instruments employ electron impact(EI) MS because of its high sensitivity. EI is a ‘‘kineticallycontrolled’’ ionization process, hence spectra of the samemolecule are nearly identical over time and between instruments(Norwood&Qiu, 2004), which bodes well for the compilation ofa spectral library for the identification of known compounds.Dictated by its own principles, GC–MS is most useful for theanalysis of trace amounts of organically extractable, non-polar,volatile compounds, and highly volatile compounds with lowvapor pressures that may undergo headspace analysis (DeBrabander et al., 2001). Because of this requirement, the GC–MS analysis of polar compounds of biopharmaceutical interestfrom biological matrices requires analyte extraction into avolatile organic solvent either directly or after chemicalderivatization, which typically enhances the volatility of apreviously non-volatile organic compound (Christie, 1998;Rufer, Glatt, & Kulling, 2006). Accordingly, from a quantitativeperspective, the use of GC–MS for such analyses requires at aminimum extraction efficiency, and often a derivatizationefficiency, when conducting back-calculations to determineanalyte concentrations within the original sample. However,the major drawback with GC–MS for the identification ofaqueous metabolites, which are usually more polar than theparent compound, is the time required for fairly intricate samplepreparation and extraction prior to analytical analysis. This
drawback in throughput necessitated the evolution of GC–MS toLC–MS.
C. Liquid Chromatography-MassSpectrometry (LC–MS)
The coupling of high performance LC (HPLC) with MS provedmuchmore challenging than the coupling of GC andMS becauseof the need to convert aqueous HPLC effluent containing polaranalytes to gas-phasemolecules. However, with the developmentof API techniques to overcome this physical hurdle, LC–MSanalysis has been routinely used within the biopharmaceuticalindustry since the mid-1980s for the rapid analysis ofpharmaceutical compounds (and their metabolites, degradants,and/or impurities) directly from biological matrices. Inherentadvantages of HPLC versus GC for MS applications are thatcompounds are not exposed to excessive heat, less sample clean-up is required, and derivatization is usually unnecessary (Coveyet al., 1986). Hence, sample throughput is generally greater thanthat using GC–MS. For metabolite identification studies usingradiolabeled compounds, LC–MS has been coupled with in-lineradioactivity flow detectors for the simultaneous acquisition ofradiochromatograph andMS data; the generated radiochromato-gram identifies the specific retention time regions containingrelevant MS data for structure elucidation (Dalvie, 2000;Prakash, Kamel, & Miao, 2004).
The ability to introduce liquid directly into the MS bytransforming solution molecules from the liquid phase to the gasphase is of paramount importance for LC–MS and is dictated bythe source where HPLC effluent is vaporized and ionized prior toentering the MS for analysis. Ideally, an effective ion sourceshould afford both excellent sensitivity and high quality, highlyreproducible spectra. The conventional MS interfaces for thisprocess are API sources (Horning et al., 1973), the mostubiquitous being electrospray ionization (ESI), and atmosphericpressure chemical ionization (APCI) (Bruins, 1991). An APIsource contains a probe, an inert gas for solvent flow, evaporationand desolvation, a sampling cone, and transfer optics to the massanalyzer. For APCI or atmospheric pressure photoionization(APPI) interfaces, the source also contains as an ionizingcomponent either a corona discharge needle or a vacuum-ultraviolet lamp, respectively. API is just that: ionization occursat atmospheric pressure therefore characterizing this as a ‘‘soft’’ionization technique since the predominant ion detected by theMS is the molecular ion and not those resulting fromfragmentation of the molecule within the source. However,unlike EI, API is under ‘‘thermodynamic control’’ making theappearance of its spectra dependent on instrumental conditions,such as ion source temperature, source design, and HPLCmobilephase compositions (Norwood&Qiu, 2004). A brief explorationof these three forms of API is discussed below.
1. Electrospray Ionization (ESI)
One of the API techniques most employed today is ESI (Kebarle& Tang, 1993). When first described in the mid-1980s(Yamashita & Fenn, 1984a,b), ESI, unlike its pre-existingsolution-to-gas ion transferring brethren FAB and MALDI,
& PRAKASH, SHAFFER, AND NEDDERMAN
342 Mass Spectrometry Reviews DOI 10.1002/mas

directly vaporized aqueous solutions without significant samplework-up and/or the use of unusual liquid matrices required foranalyte gas-phase ion generation, making it a logical interfacetechnology for LC with MS. Within an ESI source, aqueoussample solution, either as an infusion or HPLC effluent, passesthrough a metallic capillary probe engulfed in N2(g). A sprayof charged solution ion droplets is generated uponvoltage (ca. 2–8 kV) application to the capillary probe. A heating device,contained within the source, concentrates the spray dropletsincreasing their charge density. This increase in droplet charge-to-surface area over a series of droplet disintegrations results in acharge repulsive ‘‘Coulombic explosion’’ to afford vaporizedanalyte ions that then enter the mass analyzer. For ESI, it is arequirement for the analyte to be ionized within solution prior toits introduction into the source; solution ion separation caused bythe electric field at the capillary tip is the mechanism responsiblefor droplet charging (Ikonomou, Blades, & Kebarle, 1991). Thedroplet charge may be positive or negative governed by thevoltage polarity of the capillary probe. Depending on thechemical structure of an analyte, multiply charged molecularions can be formed,which is optimal for the analysis of biologicalmacromolecules (e.g., proteins).
2. Atmospheric Pressure Chemical Ionization (APCI)
The other conventional API technique most used is APCI.Aqueous matrix enters the APCI source via a glass capillarysurrounded by carrier gas and encased within a heater block. Acombination of high temperature (450–5508C) and carrier gasnebulizes both solvent and analyte molecules within the source.The newly formed molecular vapor envelops a corona dischargeneedle, an electrode whose discharge causes the electricalbreakdown of its adjacent atmosphere (i.e., ‘‘corona effect’’),which ionizes the solution mist. The ionized droplets reactchemically with analyte molecules to afford their ionized forms,which subsequently enter the mass analyzer. Like other APItechniques, specific conditions are required for effective APCI.Specifically, the analyte must be volatile and thermally inert, andthe employed HPLC mobile phase (or infusion solvent) must benot only volatile, but also amenable to gas-phase acid–basereactions (Schaefer & Dixon, 1996). Unlike ESI, APCI may beused at higher flow rates when coupled with HPLC.
3. Atmospheric Pressure Photoionization (APPI)
The most recently introduced (Robb, Covey, & Bruins, 2000)form of API for MS application is APPI, which is proving to beuseful in allowing (or optimizing) the ionization of compoundspreviously unionizable (or poorly ionizable) by ESI or APCI.Mechanically, APPI is similar to APCI in that it employs amodified APCI source containing a heated nebulizer for HPLCeffluent vaporization. However, instead of ionizing solution via acorona discharge as in APCI, APPI uses a krypton vacuum-ultraviolet lamp as a source of 10 eV photons to ionize analyteeither directly or indirectly via an ionizable dopant. Usingphotons with energies below the ionization potential (IP) of themost commonly used HPLC solvents yet within the IP rangeof the majority of organic compounds affords APPI its highsensitivity. Direct photoionization of analytes suggests that APPI
is not limited by acid–base chemistry in the gas phase, and its lowionization energy minimizes unwanted in-source fragmentation.Although APPI is reported to be more sensitive than currentcommercially available corona discharge-APCI sources, thisnascent technique still needs to be evaluated further before itsbroader implementation.
D. Nuclear Magnetic Resonance (NMR)
Nuclear magnetic resonance (NMR) has been used for thecharacterization of synthetic compounds since the 1950s. NMRallows the unambiguous determination of a compound’s structureby generating its unique 1H and/or 13C (and in some cases 19Fand 31P) resonances characteristic of various functional groupsand intramolecular environments. A combination of 1D and 2Dhomo- and heteronuclear techniques further deciphers (or confirms)the C–H and C–C backbone of an organic entity. For structureelucidation, supplementing MS data with NMR spectra permitsdetermination of the precise location(s) of compound modifica-tion and (if applicable) the stereochemistry at that metabolic site,which cannot be definitively achieved with MS alone in theabsence of an authentic standard. Because of the inability ofNMR to separate compound-dependent atomic resonances fromthose of samplematrices aswell as its low sensitivity compared toMS requiring large amounts of material (typically �1 mg forhigh-quality 1H and 13C spectra), stand-aloneNMRwas first usedfor metabolite identification only after laborious metaboliteisolation (often via HPLC of its biological matrix), purification(e.g., solid-phase extraction (SPE)), concentration, and recon-stitution in deuterated solvent. (NMR requires deuteratedsolvents so that only 1H resonances of the analyte, and not thesolvent, are observed in the NMR spectrum.) As NMR magnetshave become stronger (today ca. 600–800 MHz is standard),absolute amounts of sample required for analysis have becomesmaller (ca. 100 mM in biofluids or tissue extracts (Griffin &Shockcor, 2004)), but the isolation-purification rigmarole remains.
Since its initial drug metabolism application (Spraul et al.,1993), LC–NMR has become another hyphenated analyticalsystem, which specifically mitigates the significant pre-analysissample isolation and preparation required when using NMRalone since the compound of interest may be purified by the LCcolumn prior to NMR entrance. The NMR analysis may beconducted by continuous analysis or stop-flow, which oftengenerates cleaner spectra, and since analyses are conducted undermild chemical and temperature conditions, LC–NMR affordsgreater sample stability than LC–MS. However, certain limita-tions are encountered with this technique, most notably muchlower sensitivity than MS and the requirement of relativelyexpensive deuterated buffers and mobile phases. Nonetheless,recent advances in both hardware (e.g., flow-probe design forhigh sensitivity, and high field shielded magnets with reducedfringe fields) and software (advanced solvent suppressiontechniques) for the direct coupling of LC with NMR have madeNMR analysis routine for metabolite identification.
Most recently, LC–NMR has been coupled with MS andreadily applied to metabolite structure elucidation (Shockcoret al., 1996; Dear et al., 2000; Sidelmann et al., 2001; Corcoran&Spraul, 2003; Spraul et al., 2003; Godejohann et al., 2004). ForLC–NMR-MS, HPLC effluent is split post-column so that only a
IDENTIFICATION OF DRUG METABOLITES &
Mass Spectrometry Reviews DOI 10.1002/mas 343

small portion enters the MS, whereas the majority enters theNMR flow-probe; the MS acts as a confirmatory monitor for thepresence of the desired analyte within the NMR probe.
E. In Silico
The simultaneous increase in both the drug metabolism knowl-edge base and general computing power over the past 40 yearshas inevitably led to the development, evaluation, and imple-mentation of in silico models for not only metabolite dataprocessing and interpretation, but predicting the metabolicallysusceptible sites within a molecule.
Software has been developed in an attempt to aid in correctlyandmore quickly deconvoluting the plethora of data generated bythe various analytical technologies used for metabolite elucida-tion (see Section IV.A). One specific example is MetaboLynx(Waters Corp., Milford, MA), a software program containingadvanced tools formining complexLC/MSdata sets to acceleratedrug metabolite identification. MetaboLynx utilizes algorithmsfor filtering compound-related ions from endogenousmatrix ionsto identify only those with an exact mass relatable to that of theparent compound. To aid in metabolite identification, database-dependent applications are also available. The best example isMETEOR (Lhasa Ltd., Leeds, UK), a software program applying‘‘expert knowledge rules’’ inmetabolism, derived fromhistoricaldrug metabolism literature, to predict the metabolic fate of acompound. METEOR predicts both Phase I (P450- and non-P450-mediated) and Phase II biotransformations.
Most recently, an intellectually intriguing and potentiallypromising approach for in silico drug metabolism applicationshas been the development of MetaSite (Molecular DiscoveryLtd., London, UK). MetaSite is a computational method thatpredicts (with probabilities) the site(s) within a xenobioticsusceptible to metabolism by the major human cytochromeP450s for which crystal structures are available (i.e., CYP1A2,CYP2C9, CYP2C19, CYP2D6, CYP3A4); MetaSite alsosuggests the specific isozyme(s) responsible for the predictedbiotransformation (Cruciani et al., 2005). MetaSite reaches itsconclusions by applying the 3D structure and specific physico-chemical properties of the test compound to the 3D active site ofthe cited human P450s. AlthoughMetaSite does have potential asa very early, high-throughput screening tool for medicinalchemists, it is currently limited by its sole application to humanCYPs.
With these in silico techniques in mind, it is stronglybelieved by the authors that these aremerely toolswithin the drugmetabolism toolbox that should not be used in a ‘‘black box’’manner. Instead, a most prudent, and probably most efficient,approach to drugmetabolite elucidation should be a combinationof in silico and rationally designed empirical approaches coupledwith one’s own intellectual knowledge and experience.
III. INSTRUMENTATION
A. Single-Stage Quadrupole (SSQ)
Single-stage quadrupole (SSQ) is amass spectrometer composedof a single quadrupole, best known as an LC–MS when in-linewith a HPLC. The SSQ contains in linear fashion an ion source, a
‘‘Q0’’, which is not a mass analyzer itself, but a lens, whichtransports ions to the mass analyzer, and a single-quadrupoleknown as ‘‘Q1.’’ The Q1 is a mass analyzer, which filters (i.e.,‘‘scans’’) for the detector those ions with a user-definedm/z. TheQ1 may filter only ions of a specific m/z, known as selective ionmonitoring (SIM), or ionswithin anm/z range, referred to as a fullscan or Q1 scan. Although these are the most common scans ofLC–MS, there is the possibility of using SSQ to generate acollision-induced dissociation (CID) fragmentation spectrum ofa specific m/z ion, which is most typically conducted by a TSQ(see below). Depending on the physicochemical properties ofthe particular compound of interest, a CID may be generatedby adjusting the electrical potential difference between theion source orifice and Q0 for adequate fragmentation of thecompound-specific ion as it enters Q0. Although this may indeedafford a CID for the compound, this SSQ process is completelynon-selective since both analyte and matrix ions generated in thesource undergo fragmentation potentially resulting in incrediblycomplicated and ambiguous spectral data. However, this problemof CID non-selectivity in SSQ is overcome by TSQ.
B. Triple-Stage Quadrupole (TSQ)
TSQ is a mass spectrometer composed of two quadrupoles,commonly called MS2 or LC–MS/MS when hyphenated withHPLC. Like a SSQ, a TSQ contains an ion source, Q0 and Q1mass analyzer, but tandem to Q1 is a collision chamber (‘‘Q2’’)and secondmass analyzer (‘‘Q3’’). In TSQ, the Q1mass analyzerfilters ions for which mass spectra are desired so that these ionsare fragmented by inert gasmolecules (typically Ar or N2) withinQ2, and their fragment ions are scanned by Q3 before reachingthe mass detector. Like SSQ, TSQ may acquire full scan whenonly Q1 is operational. However, because of its tandem massanalyzers allowing ion selectivity by mass separation at twostages, TSQacquiresmuch richer, higher value datasets than SSQvia multiple-reaction monitoring (MRM; discussed in SectionIV.A.5), precursor ion (PI), and constant neutral loss (CNL)scans. A PI scan allows the extraction of ions from the Q1 datasetthat contain a specific fragment, which aids in MS selection ofdrug-related ions. For such a scan, Q1 scans a range ofm/z values,whereas Q3 filters for the specified product ion. Hence, only Q1ions that generate the designated product ion screened byQ3willbe recorded for data analysis. For a CNL scan, both Q1 and Q3scan a range ofm/z valueswith amass offset equal to themass of adesignated uncharged fragment lost upon Q2 ion fragmentation.Accordingly, only Q1 ions that produce this neutral loss aredetected. Based on this brief description, it is readily apparentthat TSQ affords much greater experimental flexibility andprecision than SSQ providing a more complete dataset formetabolite structure elucidation.
C. Ion Traps (LCQ and LTQ)
Ion trap mass spectrometers are composed of an ion source,quadrupole ion trap (‘‘Q’’) and mass analyzer; hyphenation withHPLC allows the LCQ moniker although LTQ is also typicallyin-line with an HPLC. Relative to continuous mode linearquadrupole mass spectrometers (i.e., SSQ and TSQ), ion trapshave improved sensitivity, specificity, and scan speed, but unlike
& PRAKASH, SHAFFER, AND NEDDERMAN
344 Mass Spectrometry Reviews DOI 10.1002/mas

TSQ, they are incapable of PI or neutral loss scanning. Theincreased sensitivity and specificity of an ion trap is because of itsability to confine gaseous ions during a pulsed mode via changesin amplitudes of radiofrequency potential allowing ion accumu-lationwithin the trapwithout ion filtering. Conventional ion traps(LCQ) are known as 3D traps because of the hyperboloidalgeometry of their three-electrode ion trap (March, 1997). Morerecently, however, to address 3D trap shortcomings of insufficiention storage efficiency, capacity, and deterioration of the massspectrum and dynamic response range, linear 2D-ion traps (LIT)have been developed, which omit one of the three quadrupole-trapping fields within the 3D-ion trap. The 2D traps aresubdivided into those that mass-selectively eject stored ions tothe mass detector either radially (e.g., the LTQ by ThermoElec-tronCorp.,Waltham,MA)or axially to the central axis of the trap,which allows the system to store more ions before observingspace charge. The high utility of LIT has led to further novel MSinstruments that combine axial-ejecting ion traps with TSQ, suchas the MDS Sciex/Applied Biosystems 4000 Qtrap (Hager,2002a). The QTrap instruments combine sensitive TSQ technol-ogy with a high capacity linear ion trap incorporating highinjection and trapping efficiencies. The QTrap operates the thirdquadrupole as a mass resolving quadrupole or a linear ion trap(Hager, 2002a; Hopfgartner & Zell, 2005; King & Fernandez-Metzer, 2006). Thus, these instruments offer an excellent flexibleplatform for a range of bioanalytical applications, enabling PI,CNL, orMRM togetherwith enhanced sensitivity of full scan andMS/MS data acquisition for metabolite identification studies(Hagger & YvesLe Blanc, 2003; Hopfgartner, Husser, & Zell,2003; Hopfgartner et al., 2004; Xia et al., 2003), MRM scanningof the same sensitivity as the equivalent TSQ instrument forquantitative analysis (Li et al., 2005a) and enhanced multiplycharged ion scanning for proteomics and related areas (Hopf-gartner et al., 2004).
Hence, an ion trap full scan is at least 10-fold more sensitivethan that by a SSQ or TSQ, and LTQ and hybrid technologies areextending this sensitivity further. The unique ability of an ion trapto isolate and accumulate ions is also responsible for its greaterspecificity, in that reiterations of ion trapping and scanning allowthe generation of CID spectra of parent ion fragment ions (andtheir fragment ions) resulting in hypothetically infinite fragmen-tation patterns (i.e.,MSn). Such scansmaybe conducted in a data-dependentmanner so thatmolecular weight information andMSn
spectra are acquired simultaneously. In general, dependent uponthe molecular properties of the analyte and the optimization ofinstrumental parameters, somewhere betweenMS3 andMS5maybe achieved by current ion traps with high confidence forstructure elucidation. However, it is to be readily noted that iontrap MS technology lends itself to the generation of exorbitantamounts of data that must not only be stored, but also interpretedefficiently and correctly for structure determination.
D. Quadrupole Time-of-Flight (Q-TOF)
With high sensitivity and high-resolution exact mass measure-ment, Q-TOF further progresses the capabilities of TSQ. Highersensitivity lowers sample concentration requirements, whereashigh-resolution mass measurement (�5–10 ppm) provides exactmasses affordingmolecular formulae helpful in the identification
of unknown compounds. As with ion traps, Q-TOF instrumentscan conduct fast data-dependent scanning for MS and MS2, butnot MSn, experiments resulting in high sample throughputwithout sacrificing sensitivity or scan ranges. AQ-TOF containsan ion source, a quadrupole MS comprised of a resolvingquadrupole in-line with a hexapole collision cell, followed bythe TOF MS, whose key components include an ion pusher,reflectron, and detector (Shevchenko et al., 1997). The complexinteraction of the cited TOF components results in its ability toseparate analytes of similar mass and reduce matrix interference,leading to very high mass resolution (R¼ 2� 104) readilyresolving masses differing by 0.1 amu (Hopfgartner et al.,1999). To resolve isomers for exactmass analysis, Q-TOFmaybepreceded by conventional HPLC columns. Although havinglower sensitivity and lower mass accuracy than FT-MS (seebelow), Q-TOF parameters are still excellent and accordinglymay currently be more cost effective than FT-MS (Wilson et al.,2005).
E. Fourier Transform-Mass Spectrometry (FT-MS)
Fourier transform-MS (FT-MS), also known as FT-ion cyclotronresonance (ICR)-MS, is one of the most sensitive ion detectionmethods with resolution typically ranging from 105–106 andmass accuracy of <1 ppm (Brown, Kruppa, & Dasseux, 2005).FT-MS consists of an ion source, ion trap, and a FT for theconversion of the ion-generated frequency spectrum to a massspectrum (Marshall, 1996). Source-generated ions enter an ion-trapping cell, which is maintained at an incredibly low pressureand temperature, contained within a high-field superconductingmagnet. When in the cell, ions are circularly rotated (thefrequency of which is dictated by their m/z) perpendicular to themagnetic field produced by the cell excitation plates. Varyingradiofrequency pulses from the excitation plates form analternating current between detector plates, and the frequencyand intensity of the generated current is equal to the number ofions for a particularm/z. This process of stepped, radiofrequencysweeps simultaneously quantifies all detected ions to afford afrequency versus time spectrum, which is deconvoluted by FT togenerate a mass spectrum. As with standard ion traps, MSn
structure elucidation experiments may be conducted on parti-cular ions using FT-MS. Because of its exquisitely highsensitivity andmass accuracy, FT-MS analysismay be conductedon complex solutions without chromatography.
IV. STRATEGIES FOR METABOLITEIDENTIFICATION
The combination of commonly low concentrations of drugmetabolites and the high abundance of endogenous materialin biological samples represents a considerable challenge formetabolite identification studies. A key consequence is thatmetabolite detection, as well asmetabolite structural elucidation,becomes an important consideration and although these twochallenges have many common approaches, it is often useful toconsider them separately. Mass spectrometric methodologies(Section II) using appropriate instrumentation (Section III) areclearly critical to both detection and structural elucidation,
IDENTIFICATION OF DRUG METABOLITES &
Mass Spectrometry Reviews DOI 10.1002/mas 345
although alternative approaches are also important in both cases.As described previously, techniques, such as chemical derivati-zation, H/D-exchange, and NMR, can be applied to providespecific structural information in cases when MS data alone arenot sufficient to determine metabolite structure (Section V).Similarly, metabolite detection can be greatly facilitated by non-MS approaches, such as the appropriate use of sample pre-paration and sample introduction methodologies, both of whichcan be used to improve mass spectrometric signal-to-noise inmetabolism studies. This section describes MS and non-MSstrategies to facilitate metabolite detection and achieve metabo-lite structural determination. Examples are given to illustratesome of the specific principles described, whereas full casestudies, demonstrating the use of a full range of characterizationapproaches, are depicted in Section VII.
A. MS Acquisition Strategies
1. Q1 Scanning and Data Interrogation
A common procedure for metabolite detection involves analysisof test and control samples over the full mass range (Sinz &Podoll, 2002;Mutlib&Shockor, 2003). The non-selective natureof full-scan mass spectrometric data acquisition has theadvantage of ensuring that most ionizable metabolites willgenerate a mass spectrometric response. However, the approachhas the significant disadvantage of yielding a multitude ofinterfering data from non-drug-related components, especiallywhen complex biological samples are involved. While subtrac-tion of control sample data can be effective for in vitroincubations, the approach is less useful when in vivo samples,such as urine and plasma, are under analysis. When using full-scan acquisition, therefore, additional data interrogationbecomes critical, and a number of software packages (Metabo-lynx from Waters; Analyst/MetaboliteID from Applied Biosys-tems; andXcalibur/MetaboliteID fromThermoFinnigan) exist toenable targeted detection of potential drug-related componentsfrom complex data. Such packages contain a list of commonbiotransformation pathways and search extracted ion chromato-grams for expected metabolites based on predicted molecularmass changes relative to the parent compoundmolecular weight.While this approach is likely to be reliable for commonbiotransformation pathways, more unusual metabolic reactionsmay well be overlooked. The use of standard biotransformationlists can be augmented by software packages that are designed toaccurately predict the metabolic pathways of individual struc-tures (Anari & Baillie, 2005). Such knowledge-based packagesare described in more detail in Section II.E. Although predictivesoftware may improve the coverage of metabolite detection,the approach nevertheless is not guaranteed to detect all thesignificant metabolites in biological samples.
2. Precursor Ion and Constant Neutral Loss Scanning
A common approach to augment metabolite detection involvesTSQ acquisition (Section III.B) of PI or CNL data (Jackson et al.,1995; Clarke et al., 2001). By targeting specific fragment ions,based on knowledge of the fragmentation of the parentcompound, the selectivity of mass spectrometric data can be
improved, thus facilitating metabolite detection. Furthermore,certain common biotransformation pathways will result inpredictable MS/MS fragmentation patterns, notably the CNL of176mass units for glucuronide conjugates and the loss of 80massunits for sulfates, which can therefore be used to detect suchPhase IImetabolites regardless of the parent compound structure.
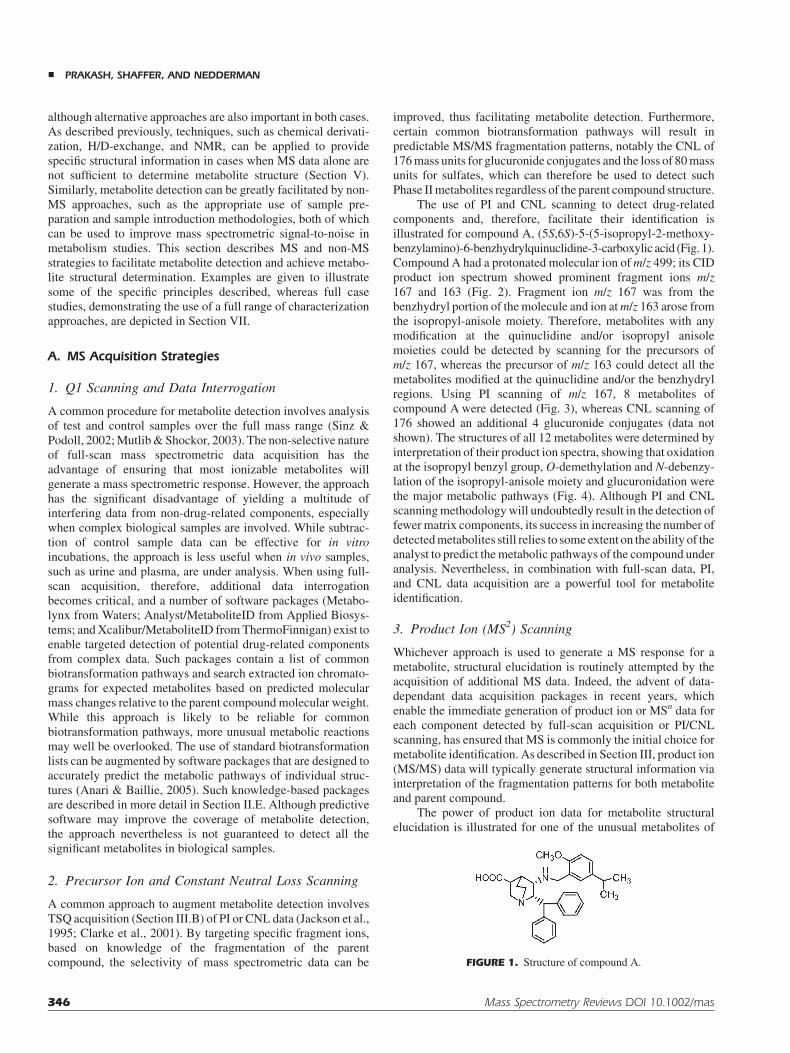
The use of PI and CNL scanning to detect drug-relatedcomponents and, therefore, facilitate their identification isillustrated for compound A, (5S,6S)-5-(5-isopropyl-2-methoxy-benzylamino)-6-benzhydrylquinuclidine-3-carboxylic acid (Fig. 1).Compound A had a protonated molecular ion ofm/z 499; its CIDproduct ion spectrum showed prominent fragment ions m/z167 and 163 (Fig. 2). Fragment ion m/z 167 was from thebenzhydryl portion of themolecule and ion atm/z 163 arose fromthe isopropyl-anisole moiety. Therefore, metabolites with anymodification at the quinuclidine and/or isopropyl anisolemoieties could be detected by scanning for the precursors ofm/z 167, whereas the precursor of m/z 163 could detect all themetabolites modified at the quinuclidine and/or the benzhydrylregions. Using PI scanning of m/z 167, 8 metabolites ofcompound A were detected (Fig. 3), whereas CNL scanning of176 showed an additional 4 glucuronide conjugates (data notshown). The structures of all 12 metabolites were determined byinterpretation of their product ion spectra, showing that oxidationat the isopropyl benzyl group, O-demethylation and N-debenzy-lation of the isopropyl-anisole moiety and glucuronidation werethe major metabolic pathways (Fig. 4). Although PI and CNLscanningmethodologywill undoubtedly result in the detection offewermatrix components, its success in increasing the number ofdetectedmetabolites still relies to some extent on the ability of theanalyst to predict themetabolic pathways of the compound underanalysis. Nevertheless, in combination with full-scan data, PI,and CNL data acquisition are a powerful tool for metaboliteidentification.
3. Product Ion (MS2) Scanning
Whichever approach is used to generate a MS response for ametabolite, structural elucidation is routinely attempted by theacquisition of additional MS data. Indeed, the advent of data-dependant data acquisition packages in recent years, whichenable the immediate generation of product ion or MSn data foreach component detected by full-scan acquisition or PI/CNLscanning, has ensured that MS is commonly the initial choice formetabolite identification. As described in Section III, product ion(MS/MS) data will typically generate structural information viainterpretation of the fragmentation patterns for both metaboliteand parent compound.
The power of product ion data for metabolite structuralelucidation is illustrated for one of the unusual metabolites of
FIGURE 1. Structure of compound A.
& PRAKASH, SHAFFER, AND NEDDERMAN
346 Mass Spectrometry Reviews DOI 10.1002/mas

compound B, 3-(2-(1-benzylpiperidin-4-yl)ethyl)-5H-isoxa-zolo[4,5-f]indol-6(7H)-one (Fig. 5). Themetabolite (B1) showeda protonated molecular ion at m/z 379, 3 Da greater than that ofthe parent compound (m/z 376). Based on the ‘‘nitrogen rule,’’ theodd protonated molecular ion of B1 suggested a loss of onenitrogen atom fromcompoundB.The product ion spectrumofB1had prominent fragment ions at m/z 287, 176, and 91 (Fig. 6).Fragment ionm/z 91, also observed in the spectrum of compoundB, suggested the benzyl moiety within B1 remained unchanged.The other fragment ions atm/z 287 and 176 suggested scission ofthe benzisoxazole moiety. Based on these data, B1 was identifiedas 5-(3-(1-benzylpiperidin-4-yl)propanoyl)-6-hydroxyindolin-2-one (Fig. 6). Metabolite B1 is formed by cleavage of theN–O bond within compound B to form an imine intermediate,which is rapidly hydrolyzed in aqueous media to B1.
Product ion (MS/MS) data can also sometimes differentiatestructurally regioisomeric metabolites as illustrated for com-pound C, (E)-5-chloro-3-((4-chlorothiophen-2-yl)(hydroxy)-methylene)-2-oxoindoline-1-carboxamide (Fig. 7). Two of itshydroxylatedmetabolites C1 and C2 both displayed a protonated
molecular ion of m/z 369, 16 Da more than that of compound C,suggesting that C1 and C2 were mono-oxygenated regioisomers.The product ion spectrum of C1 contained diagnostic fragmentions at m/z 208 and 117 (Fig. 8). Fragment ion at m/z 117indicated that the chlorothiophene ring was unaltered, whereasthe fragment ion at m/z 208 suggested oxygenation on theoxindole substructure. In contrast, the C2 product ion spectrumhad diagnostic fragment ions at m/z 192 and 133 (Fig. 8). Theprominent fragment ion at m/z 192 suggested that the oxindolemoiety was unaltered, whereas fragment ion atm/z 133 indicatedthe presence of one oxygen atom at the chlorothiophene ring(Fig. 8). However, MS/MS could not provide the exact site ofhydroxylation.
4. Multistage (MSn) Scanning
Asdescribed in Section III, theMSn data, typically acquired on anion trap instrument, can supplement product ion scanning datavia elucidation of additional fragmentation pathways. The
FIGURE 2. MS/MS spectrum of compound A.
FIGURE 3. Total ion chromatogram from PI scanning (m/z 167) of metabolites of compound A in
human urine.
IDENTIFICATION OF DRUG METABOLITES &
Mass Spectrometry Reviews DOI 10.1002/mas 347

benefit of using MSn data to augment product ion spectralinformation to facilitate metabolite identification is demonstrat-ed for two metabolites of compound D, {cis-2-(2-pyrimidinyl)-2,3,4,6,7,8,9,9a-octa-hydro-1H-pyrido[1,2-a]pyrazin-7-ylmethyl)-pyrrolidine-2,5-dione}(Fig. 9). The product ion mass spectrumof compoundD suggested that fragmentation occurred across thepiperazine ring, with fragment ions at m/z 235, 209, and 195resulting from charge retention on the succinimidyl part of themolecule and ions at m/z 136 and 122 from charge retention onthe pyrimidine (Prakash & Soliman, 1997). Two metabolites D1and D2, detected using Q1 and CNL scanning techniques, bothdisplayed a protonated molecular ion of m/z 522, 192 Da higherthan protonated D (m/z 330), suggesting that D1 and D2 wereconjugates of mono-oxygenated regioisomers. The product ionspectra of D1 and D2 contained the same fragment ion m/z 346(loss of glucuronic acid) and therefore could not be used todetermine the site of hydroxylation (Fig. 10). However,interpretation of MS3 spectra of m/z 346 from both D1 and D2
provided the sites of oxygenation for both metabolites. The MS3
spectrum of m/z 346 (generated from D1) had fragment ions atm/z 209, 195, 152, and 138 (Fig. 11), with ions atm/z 138 and 152suggesting the presence of a hydroxyl group on the pyrimidine.In contrast, the MS3 spectrum of m/z 346 generated from D2showed fragment ions at m/z 251, 225, 211, 136, and 122(Fig. 11), all indicating that the pyrimidine was unchanged andoxygenation had occurred at the succinimide portion.
5. Multiple-Reaction Monitoring (MRM)
Although the use of PI and CNL data acquisition improves theselectivity of metabolite detection when compared to full-scanacquisition, the approach is disadvantaged by the reduceddetection sensitivity of these scan modes. For this reason,researchers have investigated the use of specificMRM screeningas an alternative approach for metabolite detection prior to theacquisition of additional MS data for structural elucidation(Mauriala et al., 2005).
As described above, 12 metabolites of compound A wereidentified in human urine by interpretation of their product ionspectra. The use of MRM scanning facilitated the identificationof compound Ametabolites in human plasma (Fig. 12). Utilizingmetabolism prediction and knowledge of theMS/MS fragmenta-tion of the parent compound, the approach gives a significant
FIGURE 4. Proposed Phase I metabolic pathways of compound A in humans.
FIGURE 5. Structure of compound B.
& PRAKASH, SHAFFER, AND NEDDERMAN
348 Mass Spectrometry Reviews DOI 10.1002/mas

increase in sensitivity over conventional triple quadrupolescreening techniques and enables a wide range of potentialtransitions to be targeted as a result of the rapid cycle times.Although the potential to overlook metabolites remains, the
approach is a powerful alternative for metabolite detection whensensitivity is an issue. In a recent study, Soglia et al. (2004) wereable to improve the detection of glutathione conjugates comparedto the conventional approach of monitoring neutral loss of 129(Chen et al., 2001) using a targeted MRM approach, therebyfacilitating the identification of compounds with the potential toform harmful reactive metabolites.
6. High-Resolution Mass Spectrometry
Further improvements in selectivity can be gained by the use ofhigh-resolution mass spectrometric data acquired by either TOF(Sin, Lee, & Lee, 1991) or FT instrumentation (Section III),although the former has found greater utility because of ease-of-use and cost. The ability to resolve drug-related components fromendogenous material by virtue of accurate mass determination,coupled with excellent sensitivity, has made the high-resolutionTOF approach a popular option for metabolite detection in recentyears (Zhang et al., 2000; Mortishire-Smith et al., 2005; Wronaet al., 2005). Furthermore, mass defect filters (Zhang, Zhang, &Ray, 2003), newly incorporated into the Metabolynx softwarefromWaters (see Section II), are able to differentiate drug-relatedmaterial from endogenous components by analysis of thedecimal portion of accurate mass data alone, without the needfor biotransformation lists. In this way, the ability to detect
FIGURE 6. MS/MS spectra of compound B (top) and its metabolite B1 (bottom).
FIGURE 7. Structures of compound C and its postulated isomeric
mono-oxygenated metabolites.
IDENTIFICATION OF DRUG METABOLITES &
Mass Spectrometry Reviews DOI 10.1002/mas 349

unexpected biotransformation pathways is significantlyimproved. As well as facilitating metabolite detection, the useof Q-TOF instrumentation enables the generation of accuratemass fragment ion data, such that the molecular formulae ofproduct ion fragments can be reliably determined, therebyfacilitating spectral interpretation and structural determination.
B. Sample Preparation Strategies
In addition to MS acquisition and software approaches,metabolite detection in complex mixtures can be greatlyfacilitated by improved sample preparation. Well-establishedextraction methodologies (such as SPE and liquid–liquid
FIGURE 8. MS/MS spectra of Metabolites C1 (top) and C2 (bottom).
FIGURE 9. Major metabolites of compound D in rats.
& PRAKASH, SHAFFER, AND NEDDERMAN
350 Mass Spectrometry Reviews DOI 10.1002/mas

extraction (LLE)) may of course be applied to biological samplesduring metabolite identification studies and will inevitably resultin cleaner samples than cruder approaches, such as proteinprecipitation, and also potentially enable trace-enrichment oflow-level drug-related components. A disadvantage of morethorough sample clean-up, however, is the increased analysistime, a factor of ever-increasing importance in drug discovery.For this reason, online approaches to sample preparation duringmetabolism studies are an attractive option. In recent years,turbulent flow LC (TF-LC) has become a standard approach toquantitative bioanalysis because of the potential to increasethroughput and reduce ion suppression as a result of the onlineremoval of endogenous proteinaceous material from plasmasamples (Ayrton et al., 1997; Ynddal & Hansen, 2003). Morerecently, Herman reported the use of TF-LC for the online clean-up of both plasma and bile samples, followed by chromato-graphic separation and mass spectrometric analysis to effectmetabolite identification (Herman, 2005). Furthermore, Herman
employed a multiple injection approach, such that a 20-foldconcentration of drug-related material was achieved, thusfacilitating low-level metabolite characterization. Related onlinesample preparation technologies that have been applied tometabolite identification include the use of restricted accessmedia (RAM) columns (Keski-Hynnila et al., 2001; Preuss,Koch,&Angerer, 2005), SPE (Dumasia,Morelli,&Teale, 2004),microdialysis (Bergstrom & Markides, 2002), and liquid-phasemembrane extraction (Kuuranne et al., 2003). The application ofsuch online extraction strategies to metabolite identification iscomplicated by the risk of variable recovery of drug-relatedcomponents during the extraction process, a factor that is difficultto assess when the analyte structures are unknown, difficult tomonitor without radiolabeled material, and potentially signifi-cant when assessing the importance of metabolic pathways.Nevertheless, the high throughput and ability to enable improvedmetabolite detection give these approaches considerable appealin early discovery metabolite profiling studies and in drug
FIGURE 10. MS/MS spectra of metabolites D1 (top) and D2 (bottom).
IDENTIFICATION OF DRUG METABOLITES &
Mass Spectrometry Reviews DOI 10.1002/mas 351

development for low-level metabolite identification, whereradiolabeled material will commonly be available to monitorrecovery.
C. Sample Introduction Strategies
While sample preparation can reduce ion suppression andthereby improve mass spectrometric signal-to-noise, a numberof sample introduction strategies can serve as alternativeapproaches to facilitate metabolite detection and identification.
1. Ultra High Performance LiquidChromatography (UPLC)
The advent of UPLC has generated considerable interest inmany areas of research and has been applied to metabolite
identification for a variety of sample types (Castro-Perez et al.,2005; Johnson & Plumb, 2005). The increased chromatographicresolution of the technique, achieved via reduced particle sizepackingmaterials and high-pressure LC systems, has been shownto offer significant advantages for metabolite characterization.First, isobaric components such as oxygenated regioisomers thatco-elute under conventional HPLC conditions can be separatedand thereby distinguished. Second, ion suppression is reducedby virtue of the improved separation of drug-related fromendogenous components, and third, throughput can be increasedsignificantly via reduced chromatographic run-times. Thedramatic improvements in chromatographic resolution have ledto the technique being commonly coupled to TOF instrumenta-tion, where the rapid scanning speed allows the acquisition ofsufficient data points across very narrow peaks. Recent publica-tions (Castro-Perez et al., 2005; Johnson & Plumb, 2005) havedemonstrated the effectiveness of UPLC coupled to TOF-MS forprofiling metabolites in both in vivo and in vitro samples.
FIGURE 11. MS3 spectra of metabolites D1 (top) and D2 (bottom).
& PRAKASH, SHAFFER, AND NEDDERMAN
352 Mass Spectrometry Reviews DOI 10.1002/mas

2. Nano-Flow Approaches
An alternative method of sample introduction is the use of nano-HPLC-electrospray, whereby ion suppression may be reducedboth by improved chromatographic resolution and as a directresult of the low flow-rate (Schmidt, Karas, & Dulcks, 2003),such that mass spectrometric signal-to-noise is increased. Meierand Blaschke (2000) have used the nano-flow approach tocharacterize glucuronide conjugates of praziquantel metabolitesin human urine and in vitro incubates. The low flow-rate enabledseparation of regioisomers, provided sufficient signal-to-noise toallow detection of low abundance metabolites, and also enabledadditional mass spectrometric experiments to be performed,
resulting in the structural characterization of the glucuronideconjugates using ion trap MS approaches. Hallensleben, Raida,and Habermehl (2000) have also reported how low flow-rateHPLC facilitated the identification of low abundancemetabolitesin biological samples. An alternative approach to low flow-rateHPLC involves the use of automated chip-based infusionapproaches, such as the Nanomate from Advion Biosciences,which employs low flow-rate infusion through a chip containing100 separate electrospray nozzles. This methodology has beenapplied to metabolite identification in recent studies (Staack,Varesio, & Hopfgartner, 2005; Yu et al., 2005), and has thepotential to increase mass spectrometric signal-to-noise in threeways: long infusion times enable signal averaging which
FIGURE 12. MRMchromatograms of oxidativemetabolites of compoundA from human plasma after oral
administration of A.
IDENTIFICATION OF DRUG METABOLITES &
Mass Spectrometry Reviews DOI 10.1002/mas 353

enhances the mass spectrometric signal; samples may beconcentrated without adversely affecting analysis time; and ionsuppression effects may theoretically be reduced (Schmidt,Karas, & Dulcks, 2003). Indeed, a recent publication (Hop,Chen, & Yu, 2005) demonstrated that the approach resulted insignificantly less variation in ionization efficiency than LC–MSfor a range of compounds and therefore has the potential toovercome a major drawback of conventional LC–MS and beutilized for the quantitation of drug metabolites where noauthentic standard is available.
V. WET CHEMISTRY TECHNIQUES COMBINEDWITH MS
A. Chemical Derivatization
For the analysis of non-volatile metabolites by GC/MS analysis,derivatization is considered a very laborious and cumbersomeprocess. However, derivatization techniques combinedwith LC–MS/MS have proven very useful for the characterization andquantification of novel and unusual metabolites (Prakash & Cui,1997; Liu & Hop, 2005; Miao, Kamel, & Prakash, 2005).Derivatization of a metabolite results in its reduction in polarity(Dalvie & O’Donnell, 1998), stabilization if unstable (Guanet al., 2003;Miao, Kamel, & Prakash, 2005), differentiation fromregioisomeric (Hop & Prakash, 2005) or isobaric components,improved separation from endogenous substances (Prakash et al.,1997b), reduction in volatility, increase in molecular weight(Dalvie & O’Donnell, 1998), and enhanced ionization efficiencyand fragmentation (Anari et al., 2002; Xu et al., 2002). Some ofthe commonderivatization reagents for various functional groupsare shown in Table 1.
Kassahun et al. (1997) reported the structural characteriza-tion of two regioisomeric N-glucuronides of the antipsychoticolanzepine by derivatization with phenyl isothiocynate. Liet al. (2005b) have demonstrated that the derivatization of
1-hydroxypyrene, a biomarker of polycyclic hydrocarbons, bydansyl chloride enhanced its MS response 200-fold. Miao,Kamel, & Prakash (2005) have reported the characterization ofan unstable metabolite, a 2-mercaptophenyl-amidine analog ofthe antipsychotic ziprasidone, by its chemical derivatization withN-dansylaziridine. Derivatization of an uncommonmetabolite ofcompound D with hexafluoroacetylacetone proved effective indifferentiating two isobaricmetabolites (Fig. 13) (Prakash&Cui,1997). Several quaternary nitrogen and triphenyl phosphoniumcompounds have been developed for derivatizing low molecularweight primary and secondary amines and carboxylic acids toenhance their detection by LC–MS (Leavens et al., 2002; Barryet al., 2003). In addition, TiCl3 has been used to differentiateN-oxide from hydroxylated metabolites (Kulanthaivel et al.,2004; Johnson & Prakash, 2005).
B. Hydrogen/Deuterium-Exchange (H/D-Exchange)
Hydrogen/deuterium-exchange followed by MS has long beenrecognized as a valuable means to study mechanisms of MSfragment ion formation and metabolic pathways of xenobiotics,as well as differentiate the structures of isomeric metabolites(Kamel & Munson, 2004). As described previously, metabolismof xenobiotics involves functionalization of polar groups (e.g.,–OH, –SH, –NH, –NH2, and –CO2H), thus increasing the numberof exchangeable hydrogen atoms. Therefore, H/D-exchangetechniques help determine the presence, number, and position ofH/D-exchangeable functional groups within a metabolite, andserve as an aid in its structure elucidation (Nassar, 2003). Usingthis approach, isomeric mono- and dihydroxylated metaboliteswere differentiated from N-oxide and S-oxide, and sulfonemetabolites, respectively (Ohashi, Furuuchi, & Yoshikawa,1998; Liu et al., 2001). In addition, H/D-exchange experimentsfacilitate the interpretation of MS/MS fragmentation processes.Miao, Kamel, & Prakash (2005) recently reported the charac-terization of an unusualmetabolite of ziprasidone by using onlineH/D-exchange and MS. The metabolite displayed an increase of
TABLE 1. Some common derivatization reagents for various functional groups
& PRAKASH, SHAFFER, AND NEDDERMAN
354 Mass Spectrometry Reviews DOI 10.1002/mas

2 Da in its molecular ion compared to parent compound indeuterated solvents suggesting the introduction of two exchange-able hydrogen atoms. The MS/MS spectra of protonated anddeuterated molecular ions determined the precise structure of themetabolite (Miao, Kamel, & Prakash, 2005).
C. Hydrolysis
Chemical and enzymatic hydrolyses of metabolites have alsoproved useful in their identification. N-Glucuronide conjugatesof primary, secondary or N-hydroxylated amines are hydrolyzedto their parent compound and glucuronic acid under mild acidicconditions (Kadlubar, Miller, & Miller, 1997); quaternaryammonium glucuronides are hydrolyzed under basic conditions.BothO- and N-glucuronides are hydrolyzed by b-glucuronidase,but acyl glucuronides are relatively unstable and undergo acylgroup migration to form isomers that are stable to suchhydrolysis. However, these isomers are hydrolyzed by sodiumhydroxide. Shpkova et al. (1999) described the differentiation ofacyl- and O-glucuronides by hydrolysis with b-glucuronidaseand sodium hydroxide. Chen, Zhao, and Zhong (2003) reportedcharacterization of the glucoside conjugates of morphine byhydrolysis of urine samples with b-glucosidase. Recently, Kamelet al. (2006) reported the characterization of a novel oxidativemetabolite of a 2-methoxy-5-trifluoromethoxy benzylamineanalog by hydrolysis with b-glucuronidase and tandem MS.The metabolite formed from ipso-substitution of an oxygenatom via trifluoromethoxy elimination followed by glucuronideconjugation of the resulting hydroquinone (Kamel et al., 2006).
VI. METABOLITE QUANTITATION
Although the abundance of a metabolite is not necessarily linkedto its importance (Smith&Obach, 2005),metabolite quantitationis still an important factor in assessing the significance ofproducts of biotransformation. Notably, determination of themajor metabolic pathways of compounds in early discoverymetabolism studies and comparison of metabolite exposure in
relevant species in drug development require an appropriateassessment of metabolite abundance. For the purposes of thisreview, quantitation methodologies are divided between thosethat are effective when no radiolabel is available and those thatinvolve radioactivity determination. In general, radiolabeledmaterial will only be available when a compound is in drugdevelopment, although the timing of radiolabeled synthesisvaries significantly between organizations and between drugdiscovery and development programs.
A. Drug Discovery
Liquid chromatography-MS or LC–MS/MS using authenticstandards is widely accepted as the method of choice for thequantitation of pharmaceutical compounds (Dulik et al., 1996;Lee & Kerns, 1999). In addition, alternative quantitativetechniques, such as UV (Lee et al., 2005; Loboz et al., 2005) orfluorescence detection (Fang, Semple,&Song, 2004;Wang et al.,2005b), have commonly been applied to biological analyseswhen standard compounds are available. However, when noauthentic standard is available and the parent compound is notradiolabeled, both of which are commonly the case withmetabolites in drug discovery studies, quantitation is far lessstraightforward. Although MS and UV may be used to estimatethe relative abundance of drug-related components, it isimportant to acknowledge that these approaches give at best anapproximation of quantity and at worst a significantly mislead-ing representation of abundance. In this section, alternativeapproaches to non-radiolabeled metabolite quantitation arediscussed.
1. Chemiluminescent Nitrogen Detection (CLND)
The CLND was first used in 1992 for the quantitation ofammonium ions in waste water (Fujinari & Courthaudon, 1992)and has recently been reviewed in comparison against alternativequantitiation methods (Lane et al., 2005). As the response fromCLND is proportional to the total nitrogen concentration of theanalyte presented to the detector, quantitation of metabolites ispossible, so long as the compound in question contains nitrogenand the number of nitrogen atoms is known. Thus, someknowledge of the structure is required for metabolite quantitationvia CLND, although specific structural characterization is notnecessary. Historically, CLND has been used predominantly foranalysis of underivatized amino acids and peptides (Petritis,Elfakir, & Dreux, 2001) and synthetic chemicals (Hughes &Hunter, 2001). Although few studies have been published on theuse of CLND for metabolite characterization in biologicalsamples, Taylor et al. (2002) described an application of LC–MS/CLND for quantitation of drug metabolites in threebiological matrices: bile, urine, and plasma. Despite the highlevels of nitrogen-containing components in these matrices, thestudy showed that with appropriate sample preparation and LCmethod development, metabolite quantitation could be effected.In a more recent study, Deng et al. (2004) were able to comparethe response factor ratio onCLND for the parent compound and ametabolite with the relative mass spectrometric responses andthereby quantify the metabolite by LC–MS against the parent
FIGURE 13. Structure of compound D and its postulated two isobaric
metabolites.
IDENTIFICATION OF DRUG METABOLITES &
Mass Spectrometry Reviews DOI 10.1002/mas 355

compound standard curve. Although this methodology is un-doubtedly not as robust as using an authentic standard of themetabolite, it serves to demonstrate how CLND can be used togenerate a reasonable estimate of metabolite abundance. Apartfrom the inability to analyze compounds without nitrogen atoms,CLND coupled to LC is limited by the necessity for nitrogen-freemobile phases and gases. In addition, although CLND generallyproduces an equimolar response, there are exceptions. Nitrogengas does not produce a signal on the CLND and therefore, anyanalyte that has the potential to decompose within the detector toN2, such as those containing an N–N or N=N bond (e.g., azogroups, azides or tetrazoles) may not be quantified reliably(Taylor et al., 2002).
2. Inductively Coupled Plasma MassSpectrometry (ICP-MS)
Inductively coupled plasma MS has been utilized in recent yearsfor the quantitation of drug metabolites in plasma and urine.Although the approach is limited to the analysis of compoundscontaining elements such as metals (Sutton & Caruso, 1999),halogens (Axelsson et al., 2001; Duckett et al., 2002), sulfur(Axelsson et al., 2001), and phosphorous (Axelsson et al., 2001),the published data have shown that the technique is compatiblewith a wide range of HPLC mobile phases, and has a sensitivityand dynamic range compatible with metabolism studies. As thetechnique involves atomization and ionization of the elementunder analysis, the detector response is independent ofmolecularstructure, provided that the number of atoms of the elementin question is known, and therefore represents an attractiveapproach to metabolite quantitation for certain compound types.
3. Evaporative Light-Scattering Detection (ELSD) andCorona Charged Aerosol Detection (CAD)
Evaporative light-scattering detection (ELSD) developed in thelate-1970s and early-1980s (Charlesworth, 1978; Mourey &Oppenheimer, 1984), is often cited as a ‘‘universal detector’’,and has therefore generated interest as a possible method formetabolite quantitation in drug-discovery studies. However, anevaluation by Fries, Evans, and Ward (2005) has highlighted anumber of limitations of the technique for this application,notably insufficient sensitivity and dynamic range, an incon-sistent inter-analyte response, an incompatibility with gradientHPLC analysis (typically required for metabolite separation),and significant interference from matrix components, eventhough only in vitro samples were tested. Although recent workhas used an internal calibrant approach to improve the ability ofELSD to quantify accurately across a HPLC run (Matthews et al.,2004), the methodology would appear to be unsuitable formetabolite quantitation in its present form.
Another methodology of potential interest for metabolitequantitation involves the use of aerosol charging (Dixon &Peterson, 2002), exemplified by the recently launched coronaCAD from ESA Biosciences, Inc. (McCarthy, Ganache, & Asa,2005). Although data are limited so far, the detector may havesignificantly improved sensitivity and dynamic range compared
to ELSD andmay offer a more universal detection approach thaneither CLND or ICP-MS. Thus, the corona CAD may be apotential solution for the quantitation of metabolites in drug-discovery studies.
4. Nuclear Magnetic Resonance Spectroscopy (NMR)
Nuclear magnetic resonance (Section II.D) is commonly utilizedfor definitive structural characterization of metabolites. Inprinciple, NMR can be used to quantify metabolites, as thesignal intensity for specific atoms (e.g., 1H, but not 13C) isproportional to the number of resonating nuclei. Indeed, impurityquantitation has been achieved by 1H NMR using either internalstandards or electronic references (Lane et al., 2005). However,quantitation by 1H NMR in crude samples is limited by thepotential overlap of drug-related and endogenous signals. Incontrast, the selectivity and relative simplicity of 19F NMRspectra for drug-related components in biological samples hasbeen utilized for the quantitation of the metabolites of fluorine-containing compounds in a variety of matrices using fluorinatedstandards as calibrants (Scarfe et al., 1999; Martino, Malet-Martino, & Gilard, 2000; Orhan et al., 2004). Although thesensitivity of the approach may limit its effectiveness, the use of19F NMR offers a simple method of metabolite quantitation forappropriate compounds.
B. Drug Development
Conventional practice is to perform definitive metabolisminvestigations for all development candidates during radiola-beled studies in appropriate animal species and in man, typicallyusing either 14C or 3H isotopes. The most common method usedto monitor and quantify drug-related material during HPLCprofiling is online radiochemical flow detection, using eithersolid cells, packed with a solid scintillator (heterogeneousdetection), or liquid cells, where liquid scintillant is added tothe HPLC eluent as it passes through the cell (homogeneousdetection) (Egnash & Ramanathan, 2002; Ilett et al., 2002). Theonline approach is attractive, because of its rapid throughput and,in the case of heterogeneous detection, its non-destructive nature,such that identification and relative quantitation of the drug-related components can be achieved in the same analysis. Thedisadvantage, however, is poor sensitivity, because of therelatively low residence time of the radioactive components inthe cell at conventional HPLC flow-rates. Although the use ofhomogeneous online detection gives improved sensitivity,particularly for 3H-labeled material, signal-to-noise remains asignificant problem when the levels of radioactivity are low.Much improved counting efficiency can be achieved by fractioncollection into vials during HPLC analysis and off-line scintilla-tion counting following the addition of liquid scintillant to theisolated samples. In this way, the counting time can be increased,thus dramatically lowering the limit of detection. However,collection into vials is a destructive approach and is alsoextremely time-consuming and laborious. In recent years,alternative techniques have been developed to overcome thesechallenges.
& PRAKASH, SHAFFER, AND NEDDERMAN
356 Mass Spectrometry Reviews DOI 10.1002/mas

1. Liquid Chromatography-Accurate RadioisotopeCounting (LC–ARC)
Liquid chromatography-accurate radioisotope counting (LC–ARC) is a novel radiochemical detection system designed todetect samples with very low levels of radioactivity (Nassar,Bjorge, & Lee, 2003). Similar to conventional radiochemicalflow detection, LC–ARC is an in-line detection technique thatallows real-time display of metabolite peaks. However, the LC–ARC system utilizes a stop-flow technique to increase theresidence time of the radiolabeled components in the cell, thusincreasing radiochemical signal-to-noise. As well as operating inthis stop-flow mode throughout the analysis, the system can beprogrammed to stop the flow only when a radioactive signalabove a pre-defined threshold is detected. In this way, longanalysis times, an inevitable drawback of the approach, can beminimized. LC–ARC can be coupled with a mass spectrometerto become LC–ARC–MS. However, the interface is not withoutissue as the mass spectrometer does not recognize that the LC–ARC system has stopped the flow and continues to acquire MSdata during the entire run, thus generating excessively large datafiles. LC–ARC has been applied successfully to definitivemetabolism for both 14C- and 3H-containing compounds (Nassar,Bjorge, & Lee, 2003; Zhao et al., 2004) and more recently tobiodegradation studies (Wang et al., 2005a). Such studies haveshown that the limit of detection (LOD) for the analysis of 14C-derived components is ca. 10–20 cpm (Nassar, Bjorge, & Lee,2003; Gaddamidi et al., 2004). Although the counting efficiencyis lower with 3H compared to 14C, the limit of detection forsamples containing 3H-derived components has been reported tobe ca. 10–40 dpm. Taken together, these data suggest that theLC–ARC technique potentially can offer an enhanced sensitivityby at least 10- to 20-fold compared to conventional flow-throughdetection methods.
2. Plate Approaches
An alternative strategy to LC–ARC for generating semi-quantitative metabolism data from samples containing low levelsof radioactivity is to collect fractions into 96-well plates duringHPLC profiling for off-line scintillation counting. As for LC–ARC, the counting time can therefore be increased, thusimproving the sensitivity of 14C and 3H detection compared toconventional online radiochemical detection techniques. Twocommon types of plate are available for this approach: theLumaplate and the Scintiplate, both manufactured by Perkin-Elmer. The former consists of polystyrene wells into which isembedded a solid scintillant, and is counted on the Microbetascintillation counter (Yin, Greenberg, & Fischer, 2000), whereasthe latter incorporates a solid layer of yttrium silicate at thebottom of each well and is analyzed on a TopCount instrument(Boernsen, Floeckher, & Bruin, 2000). As the 96-well plateapproach involves drying and off-line counting, throughput willbe diminished compared to conventional online methodologiesand LC–ARC. Nevertheless, the approach is clearly less labor-intensive and time-consuming than using scintillation vials forfraction collection and off-line counting and therefore offers anattractive method for metabolite profiling where levels ofradioactivity are low. The theoretical LOD for 14C detection
using dried Lumaplates and Scintiplates can be estimated at 5 and7 dpm, respectively, using typical experimental conditions andthe detection and quantitation of 14C-labeled drug-relatedcomponents accounting for ca. 25 dpm using Scintiplates hasbeen reported (Nedderman et al., 2004). Because of the lowercounting efficiency, the theoretical LOD for 3H is somewhathigher at ca. 9 and 16 dpm for the Lumaplates and Scintiplatemethods, respectively. Metabolite profiling studies with rat urinefollowing administration of a 3H-labeled compound using theLumaplate approach have shown that drug-related componentsaccounting for ca. 25 cpm (equivalent to ca. 60 dpm) are readilydetectable and quantifiable (Boernsen, Floeckher, & Bruin,2000). As for LC–ARC, both Scintiplates and Lumaplates can beused online with mass spectrometric detection using appropriateflow splitting. In addition, the Scintiplate approach, by virtue ofthe embedded nature of the scintillant, enables elution of thedrug-related components from the plates after radiochemicalcounting for additional analysis and therefore can provide addi-tional structural data to the online methodologies (Neddermanet al., 2004).
3. Accelerator Mass Spectrometry (AMS)
AcceleratorMS (AMS) offers a significant increase in sensitivitycompared to LC–ARC or the use of 96-well plates, by virtue ofdetecting individual ions as opposed to relatively rare disin-tegration events. The technique has been used predominantly forthe detection of 14C ions, although the analysis of many otherisotopes, including 3H, is also possible (Barker & Garner, 1999;Garner, 2000). AMS for 14C detection involves combustion of thesample and subsequent reduction of the evolved CO2 to form agraphite pellet (Vogel, 1992). Ionization of the pellet, usually bycesium ion sputtering, forms negative ions of the carbon isotopes,which are focused into the accelerator, whereupon electrons arestripped from the ions, either by collision with an inert gas or afoil, to form a range of positively charged species which are thenseparated prior to detection. Originally used for radiocarbondating (Bennett et al., 1977), the methodology was subsequentlyused in biomedical investigations (Elmore et al., 1990) and inrecent years has been utilized for metabolism and pharmacoki-netic studies. Such investigations have demonstrated thatexcretion balance and plasma radioactivity data are routinelyachievable using AMS with dramatically reduced radioactivedoses compared to conventional studies, in spite of the fact thatAMS analysis of neat plasma is compromised by endogenousradioactivity in all species (Young et al., 2001; Garner et al.,2002). In addition, metabolic profiles for both excreta samplesand extremely low-level plasma samples have been generatedusing fraction collection and AMS analysis of individualfractions (Young et al., 2001; Garner et al., 2002). By removingplasma proteins via sample preparation, the endogenous radio-activity is significantly reduced, thus lowering the LOD. WhileAMS presents the ultimate in high sensitivity metaboliteanalysis, the process is labor intensive, such that samplethroughput is slow and analysis cost high. In recent years,attempts have been made to make the technique more accessibleby developing smaller, less expensive instruments (Ognibeneet al., 2002), albeit with some trade-off in sensitivity. In addition,
IDENTIFICATION OF DRUG METABOLITES &
Mass Spectrometry Reviews DOI 10.1002/mas 357

new interfaces are currently under development in an attempt tofacilitate direct analysis of biological samples (Liberman et al.,2004), ultimately leading to an HPLC–AMS system.
VII. APPLICATIONS
Three examples are described illustrating the use of varioustypes of MS and non-MS techniques for elucidating meta-bolite structures. Although LC–MS/MS is a very powerfultechnique for structural information, definitive assignments oftenrequire additional spectroscopic and wet chemistry techniquesand/or the synthesis of authentic standards.
A. Metabolism of Ziprasidone
Ziprasidone (compound E), a substituted benzisothiazolyl-piperazine analog related in structure to the atypical antipsycho-tic tiospirone (Fig. 14), was recently approved for the treatmentof schizophrenia. One of the major biotransformation pathwaysof tiospirone is N-dealkylation of the butyl group attached to thepiperazinyl nitrogen, which results in its cleavage into two majorportions (Mayol et al., 1991). Because these metabolism studieswere conductedwith tiospirone labeledwith 14C at the piperazinering, only metabolites retaining the benzisothiazole piperazinemoiety were monitored. To determine the metabolites from bothportions of the molecule after its N-dealkylation, studies wereconducted using a mixture of 14C- and 3H-labeled ziprasidone(Fig. 14). The use of two radiolabels facilitated both the detectionand identification of metabolites resulting from ziprasidoneN-dealkylation with a total of 11 radioactive peaks identified inlaboratory animals and humans using various MS (PI, CNL, andMS/MS scanning) and wet chemistry techniques (Prakash et al.,1997a,b; Prakash, Kamel, & Cui, 1997c).
Two metabolites E1 and E2 both displayed a protonatedmolecular ion of m/z 429, 16 Da greater than protonatedziprasidone, suggesting the addition of an oxygen atom toziprasidone. MS/MS spectra of E1 and E2 indicated thatoxygenation had occurred at the benzisothiazole region of bothmetabolites. Metabolite E2 was identified as a sulfoxide bycomparison of its chromatographic and spectral properties tothose of a synthetic standard. Based on the addition of 16 Dato the benzisothiazole moiety, three structures were originallyconsidered for E1: an N-oxide, via oxygenation of thebenzisothiazole nitrogen; an aromatically hydroxyled benzi-sothiazole metabolite; and an S-methylamidine, formed bysequential reductive cleavage of the benzisothiazole N–S bondand methylation of the resulting thiophenol. Wet chemistrytechniques, such as treatment with aqueous TiCl3, tert-butyldi-methylsilyl-N-trifluoroacetamide or diazomethane, suggestedE1was neither anN-oxide nor hydroxylatedmetabolite (Prakash,
Kamel, & Cui, 1997c). However, accurate mass analysis ofprotonatedD1was determined to be 429.1520 Th, correspondingto an empirical formula of C22H26N4OSCl (the addition ofone carbon and four hydrogen atoms to ziprasidone(C21H22N4OSCl)), whereas the calculated accurate m/z ofprotonated E2 was 429.1151 Th, corresponding to an empiricalformula of C21H22N4O2SCl (the addition of one oxygen atom toziprasidone) (Fig. 15). Based on these data, E1 was identified asS-methyl-dihydro-ziprasidone (Fig. 16).
B. Metabolism of a GABAA Receptor Partial Agonist
An example of metabolite structure elucidation for compound F,a GABAA receptor partial agonist, employing hyphenated MSsupplemented with other analytical techniques discussed abovewas recently described (Shaffer et al., 2005) for the identificationof an N-carbamoyl metabolite (F1) in both rat and monkey bile.Based upon the CID product ion spectrum of protonatedcompound F (m/z 374) generated by LC–MS/MS, PI scans ofm/z 162 and 213 were used for metabolite structure elucidationsince each fragment reported on molecular modification to eitherthe left or right portion of its amide bond, respectively (Fig. 17).Metabolite F1, which had a molecular ion of m/z 594 (Fig. 18),220 amu greater than compound F, was detected by radio-chromatography and both PI scans. Additionally, m/z 594 wasalso observed as a single peak in aCNL scan of 176Da, indicativeof a glucuronide conjugate. A combination of its MS response toneutral loss 176 scan, diagnostic CID mass fragmentationspectrum, and molecular ion corresponding to compoundFþCO2þ glucuronic acid, F1 was proposed to be an N-carbamoyl glucuronide of compound F. The CID spectrum ofF1 also suggested that carbamoyl glucuronidation of compoundFoccurred at its 2-aminopropylethoxy nitrogen rather than at its 4-oxotetrahydroindole nitrogen, but MS alone could not determinethis unambiguously. To confirm the proposed structure for F1, anN-carbamoyl glucuronide of compound F was generated in vitroto afford both a biosynthetic reference standard and a sample forLC–NMR-MS analysis. Both the biosynthesized N-carbamoylglucuronide and F1 had indistinguishable LC retention times andCID spectra. Both one- and two-dimensional NMR data for F1supported its proposed structure. Furthermore, the [MþD]þ
detected by MS for F1 in deuterated solvents was 7 amu greaterthan its [MþH]þ in non-deuterated solvents, consistent with sixexchangeable protons within F1. Similarly, three exchangeableprotons were observed for compound F.
C. Metabolism of Voriconazole
Voriconazole (Compound G, Fig. 19) is a triazole antifungalagent with potent activity against a broad spectrum of clinicallysignificant pathogens. Metabolic profiling in humans and
FIGURE 14. Structures of 14C- and 3H-labeled ziprasidone.
& PRAKASH, SHAFFER, AND NEDDERMAN
358 Mass Spectrometry Reviews DOI 10.1002/mas

FIGURE 15. Selected ion chromatogram and full-scan MS of metabolites E1 and E2.
FIGURE 16. Structures of ziprasidone metabolites E1 and E2.
FIGURE 17. MS/MS spectrum of compound F.
IDENTIFICATION OF DRUG METABOLITES &
Mass Spectrometry Reviews DOI 10.1002/mas 359

toxicology species following administration of voriconazoleshowed extensive metabolism, with N-oxygenation of thefluoropyrimidine moiety identified as the major metabolicpathway (Roffey et al., 2003). During the metabolite profilingprocess, two metabolites (G1 and G2) were detected that couldnot be unambiguously assigned structures using mass spectro-metric techniques. Therefore, the two metabolites were isolatedfrom urine samples and analyzed by 1H NMR. Metabolite G1(Fig. 19) was shown by MS to involve dioxygenation in thefluoropyrimidine moiety. Comparison of the aromatic region of
the 1H NMR spectrum of G1 (Fig. 20, bottom) with that ofvoriconazole (Fig. 20, top) showed that the two aromatic protonsof the fluoropyrimidine ring within voriconazole were absent,confirming that oxygenation had occurred at the two unsub-stituted fluoropyrimidine carbon atoms. Metabolite G2 wasidentified by MS as a glucuronide conjugate of an unusualmetabolite involving cleavage of voriconazole and oxidativedefluorination of the difluorophenyl ring (Fig. 19). Followingassignment of the 1H NMR spectrum of G2 (Fig. 21), nuclearoverhauser effect (NOE) experiments were used to differentiatebetween the possible glucuronide structures (Figs. 21 and 22).Irradiation of the NMR resonance corresponding to the anomericproton of the glucuronic acid moiety (Ha) showed positive NOEsto two aromatic protons on the fluorophenyl ring (Hf and Hg) aswell as the expected NOEs to the glucuronic acid protons Hb, Hcand He, indicating that Ha was in close proximity to Hf and Hg(Fig. 22). Furthermore, irradiation of the signal corresponding toHf andHg showedNOEs to the anomeric proton (Ha), in additionto the other fluorophenyl ring proton (Hh) (Fig. 22). In contrast,irradiation of the resonance corresponding to the aliphatic protonHi showed no NOEs to the anomeric proton Ha (Fig. 22). In thisway, NOE data were used to prove conclusively that G2 involvedglucuronic acid conjugation on the phenol ring.
VIII. CONCLUSION
This review has discussed the analytical methodologies andstrategies employed by biotransformation scientists to identifyand quantify metabolites of small molecule compounds while
FIGURE 18. MS/MS spectrum of metabolite F1.
FIGURE 19. Structures of voriconazole and its two metabolites G1
and G2.
& PRAKASH, SHAFFER, AND NEDDERMAN
360 Mass Spectrometry Reviews DOI 10.1002/mas

FIGURE 20. NMR spectra of voriconazole (top) and metabolite G1 (bottom).
FIGURE 21. NMR spectrum of metabolite G2.
Mass Spectrometry Reviews DOI 10.1002/mas 361

clearly highlighting MS’s invaluable contribution to the bio-pharmaceutical industry. As MS technology has evolved, so hasthe ability of the drug metabolism scientist to detect, structurallyelucidate and quantitatively monitor drug-related material morequickly and easily. Although mass spectrometric data alone areoften able to determinemetabolite structures, there are numerousinstances that require their supplementation with other analyticalinformation and/or wet chemistry methods. The flexibility andbroad applications of MS have allowed its hybridization withitself and other powerful analytical techniques, most notablyNMR and radioactivity monitors, to further its utility in the fieldof drug metabolism. With this said, from a drug metabolismperspective, one must wonder where future MS-related oppor-tunities lie. As current MS technology continually pushes thefrontiers of analytical sensitivity, have MS technologies already
become sensitive enough at detectingmetabolites of insignificantquantities? Since quantitative cut-offs for drug metaboliteimportance have been recommended (Baillie et al., 2002) andarguments have been proposed that the absolute mass ofmetabolite exposed in vivo rather than its relative abundance tothe parent compound is the key consideration for metaboliteimportance (Smith & Obach, 2005), this is a legitimate questionworth pondering. Therefore, further drug metabolism-relatedopportunities may lie not in sensitivity, but rather application ofnovel methodologies to improve sample preparation prior to MSanalysis and enhanced sample introduction to the MS. Therapidly developing area of microfluidics may present such anopportunity for metabolism studies. Indeed, the ‘‘lab-on-a-chip’’revolution has generated enormous interest for a variety ofbiomedical and bioanalytical applications (Weigl et al., 2003;
FIGURE 22. Nuclear overhauser effect spectra of metabolite G2.
& PRAKASH, SHAFFER, AND NEDDERMAN
362 Mass Spectrometry Reviews DOI 10.1002/mas

Clayton, 2005). A number of publications in the bioanalyticalarena have appeared in recent years describing completeminiaturized HPLC systems, including enrichment columns,separation columns, an electrospray nozzle and the fittingsrequired to integrate these components (Van de Goor, 2004; Xieet al., 2005; Yin et al., 2005). Although recent applications havecommonly focused on proteomics research, the possibility ofenhancing throughput and sensitivity using such devices for theenrichment, separation and analysis of drug-related componentsfrom biological samples is an exciting prospect. Another area ofconsiderable current research involves the use of high tempera-ture chromatography, which has the potential advantages ofaltering mobile phase viscosity, thus allowing higher flow-ratesand sample throughput (Greibrokk & Andersen, 2003; Coym &Dorsey, 2004) and affecting analyte selectivity (Dolan, 2002).Historically limited by the lack of stationary phases that arestable to temperature, recent work has resulted in considerableimprovements in this area (Liu et al., 2005; Sanagi & See, 2005),such that the potential of the approach for applications such asmetabolite identification is growing. Improvements in samplepreparation and/or sample introduction using these and othertechnologies would be predicted to facilitate higher throughputand more favorable signal-to-noise levels concomitantly, enhan-cing the identification of only drug-related MS data resulting infaster turnaround of impactful metabolite information for thecompound of interest.
IX. ABBREVIATIONS
AMS accelerator mass spectrometryAPI atmospheric pressure ionizationAPCI atmospheric pressure chemical ionizationAPPI atmospheric pressure photoionizationCAD charged aerosol detectorCID collision-induced dissociationCNL constant neutral lossCLND chemiluminescent nitrogen detectionDMPK drug metabolism and pharmacokineticsELSD evaporative light-scattering detectionESI electrospray ionizationFAB fast atom bombardmentFT-MS fourier transform-mass spectrometryGC–MS gas chromatography coupled with mass
spectrometryICP-MS inductively coupled plasma mass spectrometryLC liquid chromatographyLC–ARC liquid chromatography-accurate radioisotope
countingLC–MS/MS liquid chromatography-tandemmass spectrometryLOD limit of detectionMALDI matrix assisted laser desorption-ionizationMRM multiple-reaction monitoringMS mass spectrometryNCEs new chemical entitiesNMR nuclear magnetic resonancePI precursor ionQ-TOF quadrupole time-of-flightSIM selective ion monitoring
SSQ single-stage quadrupoleTF-LC turbulent flow liquid chromatographyTSQ triple-stage quadrupoleUPLC ultra high performance liquid chromatography
ACKNOWLEDGMENTS
The authors thank Dr. Amin Kamel, Dr. Dan Cui, Dr. WayneAnderson, Dr. Heather Meigh, Dr. Keith McCarthy, and Dr.Kathleen Zandi, Ms. Kim Johnson and Messrs. Drew Gibson,Mithat Gunduz, and Victor Soliman at Pfizer Global Research &Development for intellectual input and experimental assistance.
REFERENCES
Alavijeh MS, Palmer AM. 2004. The pivotal role of drug metabolism and
pharmacokinetics in the discovery and development of new medicines.
Invest Drugs 7:755–763.
AnariMR,Baillie TA. 2005.Bridging cheminformaticmetabolite predictions
and tandem mass spectrometry. Drug Discov Today 10:711–717.
Anari MR, Bakhtiar R, Zhu B, Huskey S, Franklin RB, Evan D. 2002.
Derivatization of ethinylestradiol with dansyl chloride to enhance
electrospray ionization: Application in trace analysis of ethinylestradiol
in rhesus monkey plasma. Anal Chem 74:4136–4144.
Axelsson B-O, Jornten-Karlsson M, Michelsen P, Abou-Shakra F. 2001. The
potential of inductively coupled plasma mass spectrometry detection
for high-performance liquid chromatography combined with accurate
mass measurement of organic pharmaceutical compounds. Rapid
Commun Mass Spectrom 15:375–385.
Ayrton J, Dear GJ, Leavens WJ, Mallet DN, Plumb RS. 1997. The use of
turbulent flow chromatography/mass spectrometry for the rapid, direct
analysis of a novel pharmaceutical compound in plasma. Rapid
Commun Mass Spectrom 11:1953–1958.
Baillie TA. 2003. Chemically reactive metabolites in drug discovery and
development. In: Lee JS, Fisher M, Obach RS, editors. Drug
metabolizing enzymes: Cytochrome p450 and other enzymes in drug
discovery and development. New York: Marcel Dekker. pp 147–154.
Baillie TA, CayenMN, Fouda HG, Gerson RJ, Gree JD, Grossman SJ, Klunk
LJ, LeBlanc B, Perkins DG, Shipley LA. 2002. Drug metabolites in
safety testing. Toxicol Appl Pharmacol 182:188–196.
Barker J, Garner RC. 1999. Biomedical applications of accelerator mass
spectrometry-isotope measurements at the level of the atom. Rapid
Commun Mass Spectrom 13:285–293.
Barry SJ, Carr RM, Lane SJ, Leavens WJ, Monte S, Waterhouse I. 2003.
Derivatization for liquid chromatography/electrospray mass spectro-
metry: Synthesis of pyridinium compounds and their amine and
carboxylic acid derivatives. Rapid Commun Mass Spectrom 17:603–
620.
Bennett CL, Beukens RP, Clover MR, Gove HE, Liebert RB, Litherland AE,
Purser KH, SondheimWE. 1977. Radiocarbon dating using electrostatic
accelerators: Negative ions provide the key. Science 198:508–510.
Bergstrom SK, Markides KE. 2002. On-line coupling of microdialysis
to packed capillary column liquid-chromatography-tandem mass
spectrometry demonstrated by measurement of free concentrations of
ropivacaine and metabolite from spiked plasma samples. J Chromatogr
B 775:79–87.
Blair I, Tilve A. 2002. Analysis of anticancer drugs and their metabolites by
mass spectrometry. Curr Drug Metab 3:463–480.
Boernsen KO, Floeckher JM, Bruin GJM. 2000. Use of a microplate
scintillation counter as a radioactivity detector for miniaturized
separation techniques in drug metabolism. Anal Chem 72:3956–3959.
IDENTIFICATION OF DRUG METABOLITES &
Mass Spectrometry Reviews DOI 10.1002/mas 363

Brown SC, Kruppa G, Dasseux J-L. 2005. Metabolomics applications of
FT-ICR mass spectrometry. Mass Spectrom Rev 24:223–231.
Bruins AP. 1991. Mass spectrometry with ion sources operating at
atmospheric pressure. Mass Spectrom Rev 10:53–77.
Caldwell J. 1996. The Role of drug metabolism studies for efficient drug
discovery and development: Opportunities to enhance time- and cost-
efficiency. J Pharm Sci 2:117–119.
Castro-Perez J, Plumb R, Granger JH, Beattie I, Joncour K, Wright A. 2005.
Increasing throughput and information content for in vitro drug
metabolism experiments using ultra-performance liquid chromatogra-
phy coupled to a quadrupole time-of-flight mass spectrometer. Rapid
Commun Mass Spectrom 19:843–848.
Charlesworth JM. 1978. Evaporative analyzer as a mass detector for liquid
chromatography. Anal Chem 50:1414–1420.
ChenWG, Zhang C, Avery MJ, Fouda HG. 2001. Reactive metabolite screen
for reducing candidate attrition in drug discovery. Adv Exp Med Biol
500:521–524.
Chen XY, Zhao LM, Zhong DF. 2003. A novel metabolic pathway of
morphine: Formation of morphine glucosides in cancer patients. Br J
Clin Pharmacol 55:570–578.
Christie WW. 1998. Gas chromatography–mass spectrometry methods for
structural analysis of fatty acids. Lipids 33:343–353.
Clarke NJ, Rindgen D, Korfmacher WA, Cox KA. 2001. Systematic LC/MS
metabolite identification in drug discovery. Anal Chem A-Pages 73:
430A–439A.
Clayton J. 2005. Go with the microflow. Nat Methods 2:612–616.
CorcoranO, SpraulM. 2003. LC–NMR–MS in drug discovery. Drug Discov
Today 8:624–631.
Covey TR, Lee ED, Bruins AP, Henion JD. 1986. Liquid chromatography/
mass spectrometry. Anal Chem 58:1451A–1461A.
Cox KA. 2005. Special requirements for metabolite characterization. In:
Korfmacher WA, editor. Using mass spectrometry for drug metabolism
studies. Boca Raton, FL: CRC Press. pp 229–252.
Coym JW, Dorsey JG. 2004. Superheated water chromatography: A brief
review of an emerging technique. Anal Lett 37:1013–1023.
Cruciani G, Carosati E, De Boeck B, Ethirajulu K, Mackie C, Howe T,
Vianello R. 2005. MetaSite: Understanding metabolism in human
cytochromes from the perspective of the chemist. J Med Chem 48:
6970–6979.
Cui D, Subramanian R, Shou M, Yu X, Wallace MA, Braun MP, Arison BH,
Yergey JA, Prueksanitanont T. 2004. In vitro and in vivometabolism of a
potent and selective integrin avb3 antagonist in rats, dogs andmonkeys.
Drug Metab Dispos 32:848–861.
Dalvie D. 2000. Recent advances in the applications of radioisotopes in drug
metabolism, toxicology and pharmacokinetics. Curr Pharm Des 6:
1009–1028.
DalvieD,O’Donnell J. 1998.Characterization of polar urinarymetabolites by
ion-spray tandem mass spectrometry. Rapid Commun Mass Spectrom
12:419–422.
De Brabander HF, De Wasch K, Impens S, Schilt R, Leloux MS. 2001. Gas
chromatography–mass spectrometry for residue analysis: Some basic
concepts. Chromatogr Sci Ser 86:441–454.
Dear GJ, Plumb RS, Sweatman BC, Ayrton J, Lindon JC, Nicholson JK,
Ismail IM. 2000. Mass directed peak selection, an efficient method of
drug metabolite identification using directly coupled liquid chromato-
graphy-mass spectrometry-nuclear magnetic resonance spectroscopy.
J Chromatogr B Biomed Sci Appl 748:281–293.
DengY,Wu J-T, ZhangH,Olah TV. 2004.Quantitation of drugmetabolites in
the absence of pure metabolite standards by high-performance liquid
chromatography coupled with a chemiluminescence nitrogen detector
and mass spectrometer. Rapid Commun Mass Spectrom 18:1681–
1685.
DiMasi JA, Hansen RW, Grabowski HG. 2003. The price of innovation:
New estimates of drug development costs. J Health Econ 22:151–185.
Dixon RW, Peterson DS. 2002. Development and testing of a detection
method for liquid chromatography based on aerosol charging. Anal
Chem 74:2930–2937.
Dolan JW. 2002. Temperature selectivity in reversed-phase high performance
liquid chromatography. J Chromatogr A 965:195–205.
Duckett CJ, Bailey NJC, Walker H, Abou-Shakra J, Wilson ID, Lindon JC,
Nicholson JK. 2002. Quantitation in gradient high performance liquid
chromatography/inductively coupled mass spectrometry using diclo-
fenac and chlorpromazine. Rapid Commun Mass Spectrom 16:245–
247.
DulikDM, SchaeferWH,Bordas-Nagy J, SimpsonRC,MurphyDM,Rhodes
GR. 1996. Applications of tandem liquid chromatography/mass
spectrometry in drug biotransformation and quantification studies.
In: BurlingameA, Carr SA, editors.Mass spectrometry in the biological
sciences. Totowa, NJ: Humana Press. pp 425–449.
Dumasia M, Morelli I, Teale P. 2004. Detection of eltenac in the horse:
Identification of Phase I metabolites in urine by capillary gas
chromatography–mass spectrometry and the determination of excre-
tion profile by liquid chromatography-mass spectrometry. Chromato-
graphia 59:S115–S121.
Eddershaw PJ, Dickins M. 1999. Advances in in vitro drug metabolism
screening. Pharm Sci Technol Today 2:13–19.
Egnash LA, Ramanathan R. 2002. Comparison of heterogeneous and
homogeneous radioactivity flow detectors for simultaneous profiling
andLC–MS/MS characterization ofmetabolites. J PharmBiomedAnal
27:271–284.
ElmoreD,BhattacharyyaMH,Sacco-GibsonN, PetersonDP. 1990.Calcium-
41 as a long-term biological tracer for bone resorption. Nucl Inst
Methods Phys Res B52:531–535.
Evans DC, Watt AP, Nicoll-Griffith DA, Baillie T. 2004. Drug-protein
adducts: An industry perspective on minimizing the potential for drug
bioactivation in drug discovery and development. Chem Res Toxicol
17:3–6.
Fang J, Semple HA, Song J. 2004. Determination of metoprolol and its four
metabolites in dog plasma. J Chromatogr BAnal Technol Biomed Life
Sci 809:9–14.
Fries HE, Evans CA, Ward KW. 2005. Evaluation of evaporative light-
scattering detection for metabolite quantitation without authentic
analytical standards or radiolabel. J Chromatogr B Anal Technol
Biomed Life Sci 819:339–344.
Fujinari EM,CourthaudonLO. 1992.Nitrogen-specific liquid chromatography
detector based on chemiluminescence: Application to the analysis of
ammonium nitrogen in waste water. J Chromatogr 592:209–214.
Fura A, Shu Y, Zhu M, Hanson RL, Roongta V, Humphreys WG. 2004.
Discovering drugs through biological transformation: Role of pharma-
cologically activemetabolites in drug discovery. JMedChem47:4339–
4351.
GaddamidiV, ScottMT, SwainSR,BrownAM,YoungG,HashingerBM,Lee
D, BookhartW. 2004. Sensitive on-line detection of radioisotopes using
LC–ARC applications in agrochemical research. Drug Metab Rev 36:
256.
Garner RC. 2000. Accelerator mass spectrometry in pharmaceutical research
and development—A new ultrasensitive analytical method for isotope
measurement. Curr Drug Metab 1:205–213.
Garner RC, Goris I, Laenen AAE, Vanhoutte E, MeuldermansW, Gregory S,
Garner JV, Leong D, Whattam M, Calam A, Snel CAW. 2002.
Evaluation of accelerator mass spectrometry in a human mass
balance and pharmacokinetic study—Experience with 14C-labeled
(R)-6-[Amino(4-chlorophenyl)(1-methyl-1H-imidazol-5-yl)methyl]-
4-(3-chlorophenyl)-1-methyl-2(1H)-quinolinone (R115777), a farnesyl
transferase inhibitor. Drug Metab Dispos 30:823–830.
& PRAKASH, SHAFFER, AND NEDDERMAN
364 Mass Spectrometry Reviews DOI 10.1002/mas

Godejohann M, Tseng L-H, Braumann U, Fuchser J, Spraul M. 2004.
Characterization of a paracetamol metabolite using on-line LC–SPE–
NMR–MS and a cryogenic NMR probe. J Chromatogr A 1058.
Grabowski H, Vernon J, DiMasi JA. 2002. Returns on research and develop-
ment for 1990 drug introductions. Pharmacoeconomics 20: 11–29.
Greibrokk T, Andersen T. 2003. High-temperature liquid chromatography.
J Chromatogr A 1000:743–755.
Griffin JL, Shockcor JP. 2004. Metabolic profiles of cancer cells. Nat Rev
Cancer 4:551–561.
Guan X, Hoffman B, Dwivedi C, Matthees DP. 2003. A Simultaneous liquid
chromatography/mass spectrometric assay of glutathione, cysteine,
homocysteine and their disulfides in biological samples. J Pharm
Biomed Anal 31:251–261.
Hager JW. 2002a. A new linear ion trap mass spectrometer. Rapid Commun
Mass Spectrom 16:512–526.
Hager JW. 2002b. A new linear trapmass spectrometer. Rapid CommunMass
Spectrom 16:512–540.
Hagger JW, Yves Le Blanc JC. 2003. Product ion scanning using a
Q-q-Qlinear ion trap (Q TRAPTM) mass spectrometer. Rapid Commun
Mass Spectrom 17:1056–1064.
Hallensleben K, Raida M, Habermehl G. 2000. Identification of a new
metabolite of macrolide immunosuppressant, like rapamycin and SDZ
RAD, using high performance liquid chromatography and electrospray
tandem mass spectrometry. J Am Soc Mass Spectrom 11:516–525.
Herman JL. 2005. The use of turbulent flow chromatography and the isocratic
focusing effect to achieve on-line clean-up and concentration of neat
biological samples for low-level metabolite analysis. Rapid Commun
Mass Spectrom 19:696–700.
Hop CECA. 2004. Applications of quadrupole-time-of-flight mass spectro-
metry to facilitate metabolite identification. Am Pharm Rev 7:76–79.
Hop CECA, Prakash C. 2005. Metabolite identification by LC–MS:
Applications in drug discovery and development. In: Chowdhury SK,
editor. Identification and quantification of drugs, metabolites and
metabolizing enzymes by LC–MS. New York: Elsevier. pp 123–158.
Hop CECA, Chen Y, Yu LJ. 2005. Uniformity of ionization response of
structurally diverse analytes using a chip-based nanoelectrospray
ionization source. Rapid Commun Mass Spectrom 19:3139–3142.
Hopfgartner G, Zell M. 2005. Q trap MS: A new tool for metabolite
identification. In: Korfmacher W, editor. Using mass spectrometry for
drug metabolism studies. Boca Raton, FL: CRC Press. pp 277–304.
Hopfgartner G, Chernushevich IV, Covey T, Plomley JB, Bonner R. 1999.
Exact mass measurement of product ions for the structural elucidation
of drug metabolites with a tandem quadrupole orthogonal-acceleration
time-of-flight mass spectrometer. J Am Soc Mass Spectrom 10:1305–
1314.
Hopfgartner G, Husser C, ZellM. 2003. Rapid screening and characterization
of drug metabolites using a new quadrupole-linear ion trap mass
spectrometer. J Mass Spectrom 38:138–150.
HopfgartnerG,VaresioE, TschappatV,GrivetC, BourgogneE, LeutholdLA.
2004. Triple quadrupole linear ion trap mass spectrometer for the
analysis of small molecules and macromolecules. J Mass Spectrom
39:845–855.
Horning EC, Horning MG, Carroll DI, Dzidic I, Stillwell RN. 1973.
New picogram detection system based on a mass spectrometer with an
external ionization source at atmospheric pressure.AnalChem45:936–
943.
Hu Q, Noll RJ, Li H, Makarov AA, Hardman M, Cooks RG. 2005. The
orbitrap: A new mass spectrometer. J Mass Spectrom 40:430–443.
Hughes I, Hunter D. 2001. Techniques for analysis and purification in high-
throughput chemistry. Curr Opin Chem Biol 5:243–247.
Ikonomou MG, Blades AT, Kebarle P. 1991. Electrospray-ion spray: A com-
parison of mechanisms and performance. Anal Chem 63:1989–1998.
Ilett KF, Ethell BT, Maggs JL, Davis TME, Batty KT, Burchell B, Binh TQ,
Thu LTA, Hung NC, Pirmohamed M, Park BK, Edwards G. 2002.
Glucuronidation of dihydroartemisinin in vivo and by human liver
microsomes and expressed UDP-glucuronyltransferases. Drug Metab
Dispos 30:1005–1012.
Jackson PJ, Brownsill RD, Taylor AR, Walther B. 1995. Use of electrospray
ionisation and neutral loss liquid chromatography/tandem mass
spectrometry in drug metabolism studies. J Mass Spectrom 20:446–
451.
Jamel M, Ouyang Z, Zhao W, Zhu M, Wu WW. 2003. A strategy for
metabolite identification using triple-quadupole mass spectrometry
with enhanced resolution and accurate mass capability. Rapid Commun
Mass Spectrom 17:2732–2740.
Johnson KA, Plumb R. 2005. Investigating the human metabolism of
acetaminophen using UPLC and exact mass oa-TOF MS. J Pharm
Biomed Anal 39:805–810.
Johnson KA, Prakash C. 2005. Metabolism, excretion and pharmacokinetics
of (3-{[4-tert-butyl-benzyl)-(pyridine-3-sulfonyl)-amino]-methyl}-
phenoxy)-acetic acid, an EP-2 receptor selective PGE2 agonist, in
male and female Sprague–Dawley rats. Drug Metab Dispos 33:1191–
1201.
Kadlubar FF, Miller JA, Miller EC. 1997. Hepatic microsomal
N-glucuronidation and nucleic acid binding of N-hydroxy arylamines
in relation to urinary bladder carcinogenesis. Cancer Res 37:805–814.
Kalgutkar AS, Gardner I, Obach RS, Shaffer CL, Callegari E, Henne KR,
Mutlib AE, Dalvie DK, Lee JS, Nakai Y, O’Donnell JP, Boer J,
Harriman SP. 2005. A comprehensive listing of bioactivation pathways
of organic functional groups. Curr Drug Metab 6:161–225.
Kamel A, Munson B. 2004. Collisionally induced dissociation of purine
antiviral agents: Mechanisms of ion formation using gas phase
hydrogen/deuterium exchange and electrospray ionization tandem
mass spectrometry. Eur J Mass Spectrom 10:239–257.
Kamel A, Prakash C. 2006. High performance liquid chromatography/
atmospheric pressure ionization /tandem mass spectrometry (HPLC/
API/MS/MS) in drug metabolism and toxicology studies. Curr Drug
Metab 7:828–843.
Kamel A, Davis J, Potchoiba MJ, Parkash C. 2006. Metabolism,
pharmacokinetics, tissue distribution and excretion of the potent
tachykinin NK1 receptor antagonist (CP-122,721) in the rat: Char-
acterization of a novel oxidative pathway. Xenobiotica 36:235–258.
Kassahun K, Mattiuz E, Nyhart J, Eldon,Obermeyer B, Gillespie T, Murphy
A, Goodwin RM, Tupper D, Callaghan JT, Lemberger L. 1997.
Disposition and biotransformation of the antipsychotic agent olanza-
pine in humans. Drug Metab Dispos 25:81–93.
Kebarle P, Tang L. 1993. From ions in solution to ions in the gas phase: The
mechanism of electrospray mass spectrometry. Anal Chem 65:972A–
986A.
Keski-HynnilaH,RaanaaK,ForsbergM,MannistoP,TaskinenJ,KostiainenR.
2001. Quantitation of entacapone glucuronide in rat plasma by on-line
coupled restricted-access media column liquid chromatography-
tandem mass spectrometry. J Chromatogr B Biomed Sci Appl 759:
227–236.
King R, Fernandez-Metzler C. 2006. The use of qtrap technology in drug
metabolism. Curr Drug Metab 7:541–545.
Korfmacher WA, Bryant MS, Cox KA, Ng K, Veals J, Clarke N, Hsieh Y,
Rindgen D, Tandler P, Wainhaus S, White RE. 2001. Strategies for
optimizing the use of mass spectrometry for drug metabolism
participation in new drug discovery. Adv Mass Spectrom 15:679–680.
Kostiainen R, Kotiaho T, Kuuranne T, Auriola S. 2003. Liquid chromato-
graphy/atmospheric pressure ionization-mass spectrometry in drug
metabolism studies. J Mass Spectrom 38:357–372.
Kulanthaivel P, Barbuch RJ, Davidson RS, Yi P, Rener GA, Mattiuz EL,
Hadden CE, Goodwiin LA, Ehlhardt WJ. 2004. Selective reduction of
IDENTIFICATION OF DRUG METABOLITES &
Mass Spectrometry Reviews DOI 10.1002/mas 365
N-oxides to amines: Application to drug metabolism. Drug Metab
Dispos 32:966–972.
Kuuranne T, Kotiaho T, Pedersen-Bjergaard S, Rasmussen KE, Leinonen A,
Westwood S, Kostiainen R. 2003. Feasibility of a liquid-phase
microextraction sample clean-up and LC–MS/MS screening method
for selected anabolic steroid glucuronides in biological samples. JMass
Spectrom 38:16–26.
Lane S, Boughtflower B,Mutton I, Paterson C, Farrant D, Taylor N, Blaxill Z,
Carmody C, Borman P. 2005. Toward single-calibrant quantification in
HPLC. A comparison of three detection strategies: Evaporative light
scattering, chemiluminescent nitrogen and proton NMR. Anal Chem
77:4354–4365.
LeavensWJ, Lane SJ, Carr RM,Waterhouse I. 2002. Derivatization for liquid
chromatography/electrospray mass spectrometry: Synthesis of Tris-
(trimethoxyphenyl)phosphonium compounds and their derivatives of
amine and carboxylic acids. Rapid Commun Mass Spectrom 16:433–
441.
Lee MS, Kerns EH. 1999. LC/MS applications in drug development. Mass
Spectrom Rev 18:187–279.
LeeHW,WonKJ,ChoSH,HaYH, ParkWS,YimHT,BaekM,Rew JH,Yoon
SH, Yim SV, Chung JH, Lee KT. 2005. Quantitation of niflumic acid in
human plasma by high-performance liquid chromatography with
ultraviolet absorbance detection and its application to a bioequivalence
study of talniflumate tablets. J ChromatogrBAnal TechnolBiomedLife
Sci 821:215–220.
Li AC, Alton D, Bryant MS, Shou WZ. 2005a. Simultaneously quantifying
parent drugs and screening for metabolites in plasma pharmacokinetic
samples using selected reaction monitoring information-dependent
acquisition on a Q trap instrument. Rapid Commun Mass Spectrom
19:1943–1950.
Li Y, Li AC, Shi H, Zhou S, Shou WZ, Jiang X, Naidong W, Lauterbach
JH. 2005b. The use of chemical derivatization to enhance liquid
chromatography/tandem mass spectrometric determination of 1-
hydroxypyrene, a biomarker for polycyclic aromatic hydrocarbons in
human urine. Rapid Commun Mass Spectrom 19:3331–3338.
Liberman RG, Tannenbaum SR, Hughey BJ, Shefer RE, Klinkowstein RE,
Prakash C, Harriman SP, Skipper PL. 2004. An interface for direct
analysis of 14C in non-volatile samples by accelerator mass spectro-
metry. Anal Chem 76:328–334.
LiuDQ,HopCECA. 2005. Strategies for characterization of drugmetabolites
using liquid chromatography-tandemmass spectrometry in conjunction
with chemical derivatization and on-line H/D exchange approaches.
J Pharm Biomed Anal 37:1–18.
Liu DQ, Hop CECA, Beconi MG, Mao A, Chiu S-HL. 2001. Use of on-line
hydrogen/deuterium exchange to facilitate metabolite identification.
Rapid Commun Mass Spectrom 15:1832–1839.
Liu Y, Grinberg N, Thompson KC, Wenslow RM, Neue UD, Morrison D,
Walter TH,O’Gara JE,WyndhamKD. 2005.Evaluation of aC18 hybrid
stationary phase using high-temperature chromatography. Anal Chim
Acta 554:144–151.
LobozKK,GrossAS,Ray J,McLachlanAJ. 2005.HPLCassay for bupropion
and its major metabolite in human plasma. J Chromatogr B Anal
Technol Biomed Life Sci 823:115–121.
March RE. 1997. An introduction to quadrupole ion trap mass spectrometry.
J Mass Spectrom 32:351–369.
Marshall AG. 1996. Ion cyclotron resonance and nuclear magnetic resonance
spectroscopies: Magnetic partners for elucidation of molecular
structure and reactivity. Acc Chem Res 29:307–316.
Martino R, Malet-Martino M, Gilard V. 2000. Fluorine nuclear magnetic
resonance, a privileged tool for metabolic studies of fluoropyrimidine
drugs. Curr Drug Metab 1:271–303.
Matthews BT, Higginson PD, Lyons R, Mitchell JC, Sach NW, SnowdenMJ,
Taylor MR, Wright AG. 2004. Improving quantitative measurements
for the evaporative light scattering detector. Chromatographia 60:625–
633.
Mauriala T, Chauret N, Oballa R, Nicol-Griffith DA, Bateman KP. 2005.
A strategy for identification of drug metabolites from dried blood
spots using triple-quadrupole/linear ion trap hybrid mass spectrometry.
Rapid Commun Mass Spectrom 19:1984–1992.
Mayol RF, Jajoo HK, Klunk J, Blair IA. 1991. Metabolism of the
antipsychotic drug tiospirone in humans. Drug Metab Dispos 19:
394–399.
McCarthy R, Ganache P, Asa D. 2005. Compound purity assessment and
impurity testing with corona CAD. GIT Lab J, Eur 9:26–27.
Meier H, Blaschke G. 2000. Capillary electrophoresis-mass spectrometry,
liquid chromatography-mass spectrometry and nanoelectrospray-mass
spectrometry of praziquantel metabolites. J Chromatogr B 748:221–
231.
Miao Z, Kamel A, Prakash C. 2005. Characterization of a novel metabolite
intermediate of ziprasidone in hepatic cytosolic fractions of rat, dog and
human by ESI-MS/MS, H/D exchange and chemical derivatization.
Drug Metab Dispos 33.
Mortishire-Smith RJ, O’Connor D, Castro-Perez JM, Kirby J. 2005.
Accelerated throughput metabolic route screening in early drug
discovery using high-resolution liquid chromatography/quadrupole
time-of-flight mass spectrometry and automated data analysis. Rapid
Commun Mass Spectrom 19:2659–2670.
Mourey TH, Oppenheimer LE. 1984. Use of an evaporative light-scattering
mass detector in sedimentation field flow fractionation. Anal Chem
56:2427–2434.
Mutlib AE, Shockor JP. 2003. Application of LC/MS, LC/NMR, NMR and
stable isotopes in identifying and characterizingmetabolites. In: Lee JS,
Obach RS, Fisher MB, editors. Drug metabolizing enzymes: Cyto-
chrome P450 and other enzymes in drug discovery and development.
New York: Marcel Dekker, Inc. pp 33–86.
Nassar A-EF. 2003. Online hydrogen-deuterium exchange and a tandem-
quadrupole time-of-flight mass spectrometer coupled with liquid
chromatography for metabolite identification in drug metabolism.
J Chromatogr Sci 41:398–404.
Nassar A-EF, Bjorge SM, Lee DY. 2003. On-line liquid chromatography-
accurate radioisotope counting coupled with a radioactivity detector
and mass spectrometer for metabolite identificaiton in drug discovery
and development. Anal Chem 75:785–790.
Nassar A-EF, Kamel AM, Clarimont C. 2004a. Improving decision-making
process in the structural modification of drug candidates: Enhancing
metabolic stability. Drug Discov Today 9:1020–1028.
Nassar A-EF, Kamel AM, Clarimont C. 2004b. Improving decision-making
process in the structural modification of drug candidates: Reducing
toxicity. Drug Discov Today 9:1055–1064.
Nedderman ANR, Savage ME, White KL, Walker DK. 2004. The use of 96-
well scintiplates to facilitate definitive metabolism studies for drug
candidates. J Pharm Biomed Anal 34:607–617.
Norwood DL, Qiu F. 2004. Strategies for the analysis of pharmaceutical
excipients and their trace level impurities. Am Pharm Rev 7:92–99.
Obach RS. 2003. Drug–drug interactions: An important negative attribute in
drugs. Drug Discov Today 39:301–338.
Ognibene TJ, Bench G, Brown TA, Peaslee GF, Vogel JS. 2002. A new
accelerator mass spectrometry system for 14C-quantification of
biochemical samples. Int J Mass Spectrom 218:255–264.
Ohashi N, Furuuchi S, Yoshikawa M. 1998. Usefulness of the hydrogen–
deuterium exchange method in the study of drug metabolism using
liquid chromatography-tandem mass spectrometry. J Pharm Biomed
Anal 18:325–334.
Orhan H, Commandeur JNM, Sahin G, Aypar U, Vermeulen NPE. 2004. Use
of 19F-nuclear magnetic resonance and gas chromatography–electron
capture detection in the quantitative analysis of fluorine-containing
& PRAKASH, SHAFFER, AND NEDDERMAN
366 Mass Spectrometry Reviews DOI 10.1002/mas

metabolites in urine of sevoflurane-anaesthetised patients. Xenobiotica
34:301–316.
Parkinson A. 2001. Biotransformation of xenobiotics. In: Klaassen CD,
editor. Casarett and Doul’s toxicology: The basic science of poisons.
New York: McGraw-Hill. pp 133–224.
Petritis K, Elfakir C, Dreux M. 2001. HPLC–CLND for the analysis of
underivatized amino acids. LC–GC Eur 14:389–395.
Prakash C, Cui D. 1997. Metabolism and excretion of a new antianxiety drug
candidate, CP-93,393, in cynomolgus monkeys. Identification of the
novel pyrimidine ring cleaved metabolites. Drug Metab Dispos
25:1395–1406.
Prakash C, SolimanV. 1997.Metabolism and excretion of a novel antianxiety
drug candidate, CP-93,393, in long-evans rats. Differentiation of
regioisomeric glucuronides by LC/MS/MS. Drug Metab Dispos 25:
1288–1297.
Prakash C, Kamel A, Anderson W, Howard H. 1997a. Metabolism and
excretion of the antipsychotic drug ziprasidone in rat after administra-
tion of a mixture of 3H- and 14C-labeled ziprasidone. Drug Metab
Dispos 25:206–218.
Prakash C, Kamel A, Gummerus J, Wilner K. 1997b. Metabolism and
excretion of a new antipsychotic drug, ziprasidone, in humans. Drug
Metab Dispos 25:863–872.
Prakash C, Kamel A, Cui D. 1997c. Identification of novel benzisothiazole
cleaved products of ziprasidone. Drug Metab Dispos 25:897–901.
PrakashC,KamelA,MiaoZ. 2004.Radiochemical tracers: Essential tools for
the drug metabolism studies. In: Dean DC, Filer CN, McCarthy KE,
editors. Synthesis and application of isotopically labelled compounds,
Vol. 8 . West Sussex, UK: John Wiley & Sons Ltd. pp 115–120.
Preuss R, Koch HM,Angerer J. 2005. Biological monitoring of the fivemajor
metabolites of di-(2-ethylhexyl)phthalate (DEHP) in humanurine using
column-switching liquid chromatography-tandem mass spectrometry.
J Chromatogr B Anal Technol Biomed Life Sci 816:269–280.
Riley RJ, Martin IJ, Cooper AE. 2002. The influence of DMPK as an inte-
grated partner in modern drug discovery. Curr DrugMetab 3:527–550.
Robb DB, Covey TR, Bruins AP. 2000. Atmospheric pressure photoioniza-
tion: An ionization method for liquid chromatography-mass spectro-
metry. Anal Chem 72:3653–3659.
Rodrigues AD. 2002. Drug–drug interactions. In: Rodrigues AD, editor.
Drugs and the pharmaceutical sciences. New York: Marcel Dekker.
pp 650
RoffeySJ,Cole S,CombyP,GibsonD, Jezequel SG,NeddermanANR, Smith
DA, Walker DK, Wood N. 2003. The disposition of voriconazole in
mouse, rat, rabbit, guinea pig, dog, and human. Drug Metab Dispos
31:731–741.
Rufer CE, Glatt H, Kulling SE. 2006. Structural elucidation of hydroxylated
metabolites of the isoflavan equol by gas chromatography–mass
spectrometry and high-performance liquid chromatography-mass
spectrometry. Drug Metab Dispos 34:51–60.
Sanagi MM, See HH. 2005. High temperature liquid chromatography on a
poly(styrene-divinylbenzene) stationary phase. J Liquid Chromatogr
Relat Technol 28:3065–3076.
Scarfe GB, Wright B, Clayton E, Taylor S, Wilson ID, Lindon JC, Nicholson
JK. 1999.Quantitative studies on the urinarymetabolic fate of 2-chloro-
4-trifluoromethylaniline in the rat using 19F-NMR spectroscopy and
directly coupled HPLC–NMR–MS. Xenobiotica 29:77–91.
Schaefer WH, Dixon JFrank. 1996. Effect of high-performance liquid
chromatography mobile phase components on sensitivity in negative
atmospheric pressure chemical ionization liquid chromatography-mass
spectrometry. J Am Soc Mass Spectrom 7:1059–1069.
SchmidtA,KarasM,Dulcks T. 2003. Effect of different solution flow rates on
analyte sgnals in nano-ESIMS, or: When does ESI turn into nano-ESI?
J Am Soc Mass Spectrom 14:492–500.
Shaffer CL, Gunduz M, O’Connell TN, Obach RS, Yee S. 2005.
Biotransformation of a GABAA receptor partial agonist in sprague-
dawley rats and cynomolgus monkeys: Identification of two unique
N-carbamoyl metabolites. Drug Metab Dispos 33:1688–1699.
ShevchenkoA, Chernushevich I, EnsW, StandingKG, ThomsonB,WilmM,
MannM.1997.Rapid ‘de novo’ peptide sequencing by a combination of
nanoelectrospray, isotopic labeling and a quadrupole/time-of-flight
mass spectrometer. Rapid Commun Mass Spectrom 11:1015–1024.
Shockcor JP, Unger SE, Wilson ID, Foxall PJD, Nicholson JK, Lindon JC.
1996. Combined HPLC, NMR spectroscopy, and ion-trap mass
spectrometry with application to the detection and characterization of
xenobiotic and endogenous metabolites in human urine. Anal Chem
68:4431–4435.
ShpkovaM, Armstrong VW,Wielaqnd E, Niedmann PD, Schutz E, Brenner-
Weib G, Voihsel M, Braun F, Oellerich M. 1999. Identification of
glucoside and carboxyl-linked glucuronide conjugates of mycopheno-
lic acid in plasma of transplant recipients treated with mycophenolate
mofetil. Br J Pharmacol 126:1075–1082.
Sidelmann UG, Bjornsdottir I, Shockcor JP, Hansen SH, Lindon JC,
Nicholson JK. 2001. Directly coupled HPLC–NMR and HPLC–MS
approaches for the rapid characterization of drug metabolites in urine:
Application to the human metabolism of naproxen. J Pharm Biomed
Anal 24:569–579.
Sin CH, Lee ED, Lee ML. 1991. Atmospheric pressure ionization time-of-
flightmass spectrometrywith a supersonic beam.Anal Chem63:2897–
2900.
Sinz MW, Podoll T. 2002. The mass spectrometer in drug metabolism.
In: Rossi DT, Sinz MW, editors. Mass spectrometry in drug discovery.
New York: Marcel Dekker. pp 271–336.
Smith DA, Obach RS. 2005. Seeing through the MIST: Abundance versus
percentage. Commentary on metabolites in safety testing. Drug Metab
Dispos 33:1409–1417.
SmithD, SchmidE, Jones B. 2002.Do drugmetabolism and pharmacokinetic
departments make any contribution to drug discovery. Clin Pharmaco-
kinet 41:1005–1019.
Soglia JR, Harriman SP, Zhao S, Barberia J, Cole MJ, Boyd JG, Contillo LG.
2004. The development of a higher throughput reactive intermediate
assay incorporating micro-bore liquid chromatography-micro-electro-
spray ionisation-tandem mass spectrometry and glutathione ethyl ester
as an in vitro conjugating agent. J Pharm Biomed Anal 36:105–116.
Spraul M, Hofmann M, Dvortsak P, Nicholson JK, Wilson ID. 1993. High-
performance liquid chromatography coupled to high-field proton
nuclear magnetic resonance spectroscopy: Application to the urinary
metabolites of ibuprofen. Anal Chem 65:327–330.
Spraul M, Freund AS, Nast RE, Withers RS, Maas WE, Corcoran O. 2003.
Advancing NMR sensitivity for LC–NMR–MS using a cryoflow
probe: Application to the analysis of acetaminophen metabolites in
urine. Anal Chem 75:1536–1541.
Staack RF, Varesio E, Hopfgartner G. 2005. The combination of liquid
chromatography/tandem mass spectrometry and chip-based infusion
for improved screening and characterization of drugmetabolites. Rapid
Commun Mass Spectrom 19:618–626.
Sutton KL, Caruso JA. 1999. Liquid chromatography-inductively coupled
plasma mass spectrometry. J Chromatogr A 856:243–258.
Taylor EW, Jia W, Bush M, Dollinger GD. 2002. Accelerating the drug
optimization process: Identification, structure elucidation and quanti-
fication of in vivo metabolites using stable isotopes with LC/MSn and
the chemiluminescent nitrogen detector. Anal Chem 74:3232–3238.
ThevisM,MakarovAA,Horning S, SchanzerW. 2005.Mass spectrometry of
stanozolol and its analogues using electrospray ionization and collision-
induced dissociation with quadrupole-linear ion trap and linear ion
trap-orbitrap hybrid mass analyzers. Rapid Commun Mass Spectrom
19:3369–3378.
IDENTIFICATION OF DRUG METABOLITES &
Mass Spectrometry Reviews DOI 10.1002/mas 367

Van de Goor TA. 2004. Moving liquid chromatography from nano to chip.
Pharm Genomics 4:20–22.
Vogel JS. 1992. Rapid production of graphite without contamination for
biomedical AMS. Radiocarbon 34:344–350.
Wang N, Szoatek B, Buck RC, Folsom PW, Sulecki LM, Capka V, Berti WR,
Gannon JT. 2005a. Fluorotelomer alcohol biodegradation—Direct
evidence that perfluorinated carbon chains breakdown. Environ Sci
Technol 39:7516–7528.
Wang Y, Zhang W, Dong Y, Fan R, Sheng G, Fu J. 2005b. Quantification of
several monohydroxylated metabolites of polycyclic aromatic hydro-
carbons in urine by high-performance liquid chromatography with
fluorescence detection. Anal Bioanal Chem 383:804–809.
Watt AP, Mortishire-Smith RJ, Grhard U, Thomas T. 2003. Metabolite
identification in drug discovery. Drug Discov Dev 6:57–65.
Weigl BH, Bardell RL, Cabrera CR. 2003. Lab-on-a-chip for drug
development. Adv Drug Deliv Rev 55:349–377.
White RE. 2000. High-throughput screening in drug metabolism and
pharmacokinetic support of drug discovery. Annu Rev Pharm Toxicol
40:133–157.
Wilson ID, Plumb R, Granger J, Major H, Williams R, Lenz EM. 2005.
HPLC–MS-based methods for the study of metabonomics. J Chroma-
togr B 817:67–76.
WronaM,MaurialaT, BatemanKP,Mortishire-SmithRJ,O’ConnorD. 2005.
‘All-in-one’ analysis for metabolite identification using liquid chroma-
tography/hybrid quadrupole time-of-flight mass spectrometry with
collision energy switching. Rapid Commun Mass Spectrom 19:2597–
2602.
Xia Y-Q, Miller JD, Bakhtiar R, Franklin RB, Liu DQ. 2003. Use of a
quadrupole linear ion trap mass spectrometer in metabolite identifica-
tion and bioanalysis. Rapid Commun Mass Spectrom 17:1137–1145.
Xie J,MiaoY, Shih J, Tai Y-C, Lee TD. 2005.Microfluidic platform for liquid
chromatography-tandem mass spectrometry analysis of complex
peptide mixture. Anal Chem 77:6947–6953.
Xu X, Ziegler RG, Waterhouse DJ, Saavedra JE, Keefer LK. 2002.
Stable isotope dilution high-performance liquid chromatography–
electrospray ionization mass spectrometry method for endogenous
2- and4-hydroxyestrones in humanurine. J ChromatogrBAnal Technol
Biomed Life Sci 780:315–330.
Yamashita M, Fenn JB. 1984a. Electrospray ion source. Another variation on
the free-jet theme. J Phys Chem 88:4451–4459.
YamashitaM, Fenn JB. 1984b. Negative ion production with the electrospray
ion source. J Phys Chem 88:4671–4675.
Yin H, Greenberg GE, Fischer V. 2000. Application of wallac microbeta
radioactivity counter and wallac scintiplate in metabolite profiling and
identification studies. Application Note, Perkin-Elmer Life Sci
Yin H, Killeen K, Brennen R, Sobek D, Werlich M, Van de Goor TA. 2005.
Microfluidic chip for peptide analysiswith an integratedHPLCcolumn,
sample enrichment column and nanoelectrospray tip. Anal Chem
77:527–533.
Ynddal L, Hansen SH. 2003. On-line turbulent-flow chromatography-
high-performance liquid chromatography-mass spectrometry for
fast sample preparation and quantitation. J Chromatogr A 1020:
59–67.
Young G, Ellis W, Ayrton J, Hussey E, Adamkiewicz B. 2001. Accelerator
mass spectrometry (AMS): Recent experience of its use in a clinical
study and the potential future of the technique. Xenobiotica 31:619–
632.
YuLJ, ChenY,DeNinnoMP,O’Connell TN,HopCECA. 2005. Identification
of a novel glutathione adduct of diclofenac, 40-hydroxy-20-glutathion-deschloro-diclofenac, upon incubation with human liver microsomes.
Drug Metab Dispos 33:484–488.
Zhang N, Fountain ST, Bi H, Rossi DT. 2000. Quantification and rapid
metabolite identification in drug discovery usingAPI time-of-flight LC/
MS. Anal Chem 72:800–806.
ZhangH, ZhangD,RayK. 2003. A software filter to remove interference ions
from drug metabolites in accurate mass liquid chromatography/mass
spectrometric analyses. J Mass Spectrom 38:1110–1112.
ZhaoW, Wang L, Zhang D, Zhu M. 2004. Rapid and sensitive determination
of enzyme kinetics of drug metabolism using HPLC coupled with a
stop-flow radioactivity flow detector. Drug Metab Rev 36:257.
Chandra Prakash obtained his Ph.D. in organic chemistry in 1977. He held several
academic appointments, the last of which as Research Associate Professor and Associate
Director of Mass Spectrometry resources at Vanderbilt University. He is currently a
Research Fellow at Pfizer Global Research and Development and has been involved in drug
metabolism studies to support drug development and registration. His work is focused on
the development of approaches and techniques for the rapid identification of drug
metabolites and the prediction of human circulating metabolites based on in vitro and
preclinical studies. His research interests include the application of LC-MS and radio
detection techniques, development of chemical model to mimic CYP metabolic activities,
metabolic bioactivation, and reaction phenotyping ofmetabolizing enzymes to facilitate the
discovery and development of new chemical entities as drug candidates. He is the author of
more than 200 manuscripts, book chapters, and abstracts. He reviews extensively for a
number of scientific journals and serves as the editor-in-Chief of the journal Current Drug
Metabolism and Drug Metabolism Letters. He is also on the editorial board of the journal
Expert Opinion on Drug Metabolism & Toxicology. Dr. Prakash is a member of American
Society of Mass Spectrometry and Allied Topics, International Society for the Study of
Xenobiotics, Medicinal Chemistry and Chemical Toxicology Divisions of American
Chemical Society, Asian Federation ofClinical Pharmacologist, andNewYorkAcademy of
Science.
& PRAKASH, SHAFFER, AND NEDDERMAN
368 Mass Spectrometry Reviews DOI 10.1002/mas
Christopher L. Shaffer obtained his B.S. (High Honors) in chemistry from The College of
William andMary (1994). Following two years of employment as an analytical chemist for
Whitehall-Robins Healthcare, Inc., he attended the University of Kansas earning a M.S.
(1999) and Ph.D. (Honors, 2001) in medicinal chemistry under the mentorship of Professor
Robert P. Hanzlik. Subsequently, he joined the department of Pharmacokinetics, Dynamics
and Metabolism within Pfizer Global Research and Development where he is currently a
Principal Scientist. His research interests include mechanistic studies in drug metabolism,
metabolite structure elucidation, the discovery and development of drug candidates for
CNS-related targets, and the development and implementation of nascent analytical
technologies. Dr. Shaffer is a member of the American Chemical Society and its Medicinal
Chemistry Division, and the International Society for the Study of Xenobiotics.
Angus Nedderman obtained his B.Sc. in chemistry from the University of Edinburgh in
1988 and his Ph.D in organic chemistry from theUniversity of Cambridge in 1991.Working
with Professor Dudley Williams, his Ph.D research focused on mass spectrometric and
NMR approaches to understand biomolecular function via structural elucidation of
bioorganic entities. Dr Nedderman is currently an Associate Research Fellow at Pfizer
Global Research and Development and Head of the Metabolism and Disposition Group at
the Pfizer site in Sandwich, UK. His current position involves the determination of
metabolic routes and disposition characteristics for novel compounds in both drug
discovery and drug development using MS, NMR, radiochemical, in silico and chemical
methodologies. The research portfolio of his group focuses on novel approaches to facilitate
metabolite detection, structural elucidation, activity characterization, and analyte
quantitation in order to increase the efficiency and effectiveness of current methodologies
designed to improve our understanding of the safety and efficacy characteristics of novel
chemical entities. Dr.Nedderman is amember of theBritishMass Spectrometry Society and
the Royal Society of Chemistry.
IDENTIFICATION OF DRUG METABOLITES &
Mass Spectrometry Reviews DOI 10.1002/mas 369