Embed Size (px)
Citation preview

U.S. Department of the InteriorU.S. Geological Survey
Scientific Investigations Report 2013–5033
Prepared by the U.S. Geological Survey Office of Water Quality, National Water Quality Laboratory
Analytical Properties of Some Commercially Available Nitrate Reductase Enzymes Evaluated as Replacements for Cadmium in Automated, Semiautomated, and Manual Colorimetric Methods for Determination of Nitrate Plus Nitrite in Water
Model of Nitrate Reductase Dimer (MW ≈ 200 kD)
NADH
Mo-MPT
FAD
NO3– NO2
–
Hinge 2
Dimerinterface
Fe
Fe
N-X
Hinge 1
Ser-P

Front Cover. Schematic model of eukaryotic nitrate reductase showing the domain structure of each monomeric unit of homodimer. Cofactor binding sites are shown for each domain of the subunit. Reaction catalyzed by nitrate reductase is also shown. Courtesy of W.H. Campbell, Ph.D., Nitrate Elimination Company, Lake Linden, MI 49945.
Back Cover. Reaction sequence of nitrite produced by enzymatic reduction of nitrate with Griess reagents—sulfanilamide and N-(1-Naphthyl) ethylenediamine—to form a pink azo dye with an absorption maximum of 543 nanometers.

Analytical Properties of Some Commercially Available Nitrate Reductase Enzymes Evaluated as Replacements for Cadmium in Automated, Semiautomated, and Manual Colorimetric Methods for Determination of Nitrate Plus Nitrite in Water
By Charles J. Patton and Jennifer R. Kryskalla
Prepared by the U.S. Geological Survey Office of Water Quality, National Water Quality Laboratory
Scientific Investigations Report 2013–5033
U.S. Department of the InteriorU.S. Geological Survey

U.S. Department of the InteriorSALLY JEWELL, Secretary
U.S. Geological SurveySuzette M. Kimball, Acting Director
U.S. Geological Survey, Reston, Virginia: 2013
For more information on the USGS—the Federal source for science about the Earth, its natural and living resources, natural hazards, and the environment, visit http://www.usgs.gov or call 1–888–ASK–USGS.
For an overview of USGS information products, including maps, imagery, and publications, visit http://www.usgs.gov/pubprod
To order this and other USGS information products, visit http://store.usgs.gov
Any use of trade, firm, or product names is for descriptive purposes only and does not imply endorsement by the U.S. Government.
Although this information product, for the most part, is in the public domain, it also may contain copyrighted materials as noted in the text. Permission to reproduce copyrighted items must be secured from the copyright owner.
Suggested citation:Patton, C.J., and Kryskalla, J.R., 2013, Analytical properties of some commercially available nitrate reductase enzymes evaluated as replacements for cadmium in automated, semiautomated, and manual colorimetric methods for determination of nitrate plus nitrite in water: U.S. Geological Survey Scientific Investigations Report 2013–5033, 36 p., http://pubs.usgs.gov/sir/2013/5033/.

iii
Contents
Abstract ...........................................................................................................................................................1Introduction.....................................................................................................................................................1
Purpose and Scope ..............................................................................................................................2Description of Study Approach ..........................................................................................................3
Analytical Methods........................................................................................................................................31. Application ....................................................................................................................................32. Method Summaries and Analytical Considerations ..............................................................33. Interferences ................................................................................................................................44. Instrumentation ............................................................................................................................55. Apparatus and Operating Parameters .....................................................................................56. Reagent Preparation ...................................................................................................................77. Calibrants and Quality-Control Solutions .................................................................................98. Sample Preparation .....................................................................................................................99. Instrument Performance ............................................................................................................9
10. Calibration ...................................................................................................................................1011. Procedure and Data Evaluation ..............................................................................................1012. Calculations ................................................................................................................................1013. Reporting Results .......................................................................................................................1014. Detection Limits, Bias, and Precision .....................................................................................11
Characterization of Nontoxic Nitrate Reductase Enzymes and Analytical Performance ...............12Background Information ....................................................................................................................12Standard-Level Validation Results ...................................................................................................14Metal Ion Effects .................................................................................................................................25Effects of Temperature and Dissolved Organic Matter on YNaR1 Activity ...............................28Nitrate Reductase from Arabidopsis thaliana ...............................................................................32Effects of Temperature and Dissolved Organic Matter on AtNaR2 Activity .............................32
Conclusions...................................................................................................................................................33Acknowledgments .......................................................................................................................................34References Cited..........................................................................................................................................35
Figures 1. Sketches showing steps for offline enzymatic reduction of nitrate to nitrite
using a syringe-pump-based dispenser/diluter module ........................................................6 2. Arrangement of components used for thermostatted nitrate reductase
kinetics experiments ....................................................................................................................7 3. Typical nitrite analyzer output for nitrate reductase kinetics experiments ........................8 4. Control chart for low-level continuous flow analysis cadmium reduction
and nitrate reductase reduction methods ..............................................................................12

iv
5. Relative standard deviation of same-bottle duplicate, triplicate, and quintuplicate nitrate + nitrite concentrations ........................................................................13
6. Agreement of between-day duplicate nitrate + nitrite concentrations .............................14 7. YNaR1 storage stability plots ....................................................................................................14 8. Graphical summary of data from an experiment to assess stability of mixed
nicotinamide adenine dinucleotide nitrate reductase reagent solutions .........................15 9. National Water Quality Laboratory login dates for groundwater and
surface-water samples ..............................................................................................................15 10. Box plots showing concentration distributions for the population of 3,318
standard-level nitrate + nitrite concentrations determined in groundwater and surface-water samples .......................................................................................................16
11. Scatter plot of standard-level nitrate + nitrite concentrations determined simultaneously by CdR and YNaR1 methods during validation experiments ...................17
12. Differences (in percent) between nitrate + nitrite concentrations in groundwater and surface-water samples ..............................................................................20
13. Scatter plot of nitrate + nitrite concentrations determined by CdR and YNaR1 methods in groundwater and surface-water samples ............................................21
14. Box plots showing concentration distributions for the population of 979 low-level nitrate + nitrite concentrations determined in groundwater and surface-water samples ..............................................................................................................22
15. Scatter plot of nitrate + nitrite concentrations simultaneously determined by CdR and YNaR1 methods for 182 acidified samples ........................................................22
16. Analytical cartridge diagram for a simple, purpose-built, flow-injection nitrite analyzer .............................................................................................................................23
17. Flow injection analysis peaks for batch YNaR1-reduction nitrate determinations .............23 18. Graphs demonstrating effectiveness of the semiautomated batch method for
reducing to nitrate to nitrite in water samples with soluble nitrate reductase ................24 19. Linear least squares regression plots of nitrate + nitrite concentrations ........................25 20. Effect of various metal ions at times x1, x10, and x100 their median
concentrations on nitrate concentration ................................................................................26 21. Graph showing the rate of nitrate reduction to nitrite by YNaR1 nitrate
reductase in relation to reaction temperature ......................................................................28 22. Graph showing the rate of nitrate reduction to nitrite by YNaR1 nitrate
reductase in relation to reaction temperature ......................................................................28 23. Effect of Suwannee River humic acid concentration on nitrate reduction ......................29 24. Peak heights for 5.0 milligrams nitrate-nitrogen per liter solutions ........................................30 25. Reaction rate plots for surface-water samples, each with nitrate
concentrations of ≈ 0.8 milligram nitrate-nitrogen per liter......................................................30 26. Plots showing effects of Suwannee River humic acid on nitrate reductase
activity in relation to reaction temperature ............................................................................31 27. Plots showing effect of reaction pH on nitrate reductase reduction
rates for solutions containing 5.0 milligrams nitrate-nitrogen per liter at 25 degrees Celsius .................................................................................................................31

v
Tables 1. Parameter and method codes for unapproved U.S. Geological Survey
enzymatic reduction nitrate + nitrite determination methods ...............................................3 2. Effects of chloride and sulfate on reduction of 5 milligrams nitrate-nitrogen
per liter solutions by CdR and YNaR1 nitrate reductase ........................................................4 3. National Water Quality Laboratory standard operating procedures for
automated continuous-flow analyzer cadmium reduction nitrate + nitrite determination methods ..............................................................................................................10
4. Data and calculations used to estimate method detection limits for nitrate + nitrite determination by automated CFA methods .................................................11
5. Third-party check sample nitrate + nitrite data summary ...................................................11 6. Nitrate + nitrite concentration summaries for low- and high-flow subsets .....................16 7. Agreement between nitrate + nitrite concentrations determined by CFA-CdR
and CFA-YNaR1 reduction methods ........................................................................................17 8. Two-population paired t-test results for nitrate + nitrite concentrations .........................18 9. Wilcoxon signed-rank test results for nitrate + nitrite concentrations .............................18 10. Summary statistics for nitrate + nitrite concentrations .......................................................19 11. Metal ions tested for possible inhibition of YNaR1 enzyme and Griess-
reaction interference .................................................................................................................26 12. Effect of storage time on the potency of Suwannee River humic acid dissolved
in deionized water as an inhibitor of YNaR1 and AtNaR2 nitrate reductases ..................33
Conversion Factors and Abbreviated Water-Quality Units
Multiply By To obtainLength
centimeter (cm) 3.94 × 10⁻¹ inch (in.)micrometer (µm) 3.94 × 10⁻⁵ inch (in.)millimeter (mm) 3.94 × 10⁻² inch (in.)nanometer (nm) 3.94 × 10⁻⁸ inch (in.)
Massgram (g) 3.53 × 10⁻² ounce, avoirdupoismilligram (mg) 3.53 × 10⁻⁵ ounce, avoirdupois
Volumeliter (L) 2.64 × 10⁻¹ gallonliter (L) 3.38 × 101 ounce, fluidmicroliter (µL) 2.64 × 10⁻⁷ gallonmilliliter (mL) 2.64 × 10⁻⁴ gallon
Concentrationmilligram nitrate nitrogen per liter
(mg NO3–-N/L)
7.14 × 101 micromole nitrate per liter (NO3
–, µM)milligram nitrite nitrogen per liter
(mg NO2–-N/L)
7.14 × 101 micromole nitrite per liter (NO2
–, µM)molar (M, moles/L) 1.00 × 10³ millimolar (mM)molar (M, moles/L) 1.00 × 10⁶ micromolar (µM)
Degrees Celsius (°C) may be converted to degrees Fahrenheit (°F) by using the following equation:
°F = 1.8 (°C) + 32.

vi
Abbreviations Used in This Report
≈ Approximately equal
± Plus or minus
> Greater than
>> Much greater than
< Less than
°C Degree Celsius
ASTM American Society for Testing and Materials
AtNaR2 Recombinant nitrate reductase from Arabidopsis thaliana (Enzyme Commission number EC 1.7.1.1) expressed in the yeast Pichia pastoris
CdR Cadmium reduction
CFA Air-segmented continuous-flow analysis (or analyzer)
DA Automated discrete analysis (or analyzer)
DI (water) Deionized water piped throughout the National Water Quality Laboratory. For purposes of nutrient analysis, the laboratory DI water is equivalent to ASTM type I DI water.
DOC Dissolved organic carbon
EC Enzyme Commission, a Swiss organization that assigns unique numerical identifiers to enzymes
EDTA Ethylenediaminetetraacetic acid and its di-sodium salt
EPA U.S. Environmental Protection Agency
FCA A U.S. Geological Survey National Water Quality Laboratory bottle type for nutrient samples that are filtered (0.45 micrometer), amended with sulfuric acid, and chilled at collection sites. FCA samples are shipped and stored at a nominal temperature of 4 °C ± 2 °C.
FCC A U.S. Geological Survey National Water Quality Laboratory bottle type for nutrient samples that are filtered (0.45 micrometer) and chilled at collection sites. FCC samples are shipped and stored at a nominal temperature of 4 °C ± 2 °C.
FIA Flow injection analysis (or analyzer)
FW Formula weight
h hour
HA High-phenolic-content humic acid
LCL Lower control limit
M Molar (molarity); a unit of concentration equal to moles solute per liter of solution
MC A U.S. Geological Survey National Water Information System sample medium code used to identify sample matrix types
MDL Method detection limit
mL Milliliter
min Minute
MOPS 3-N-morpholino-propansulfonic acid; pKa = 7.20
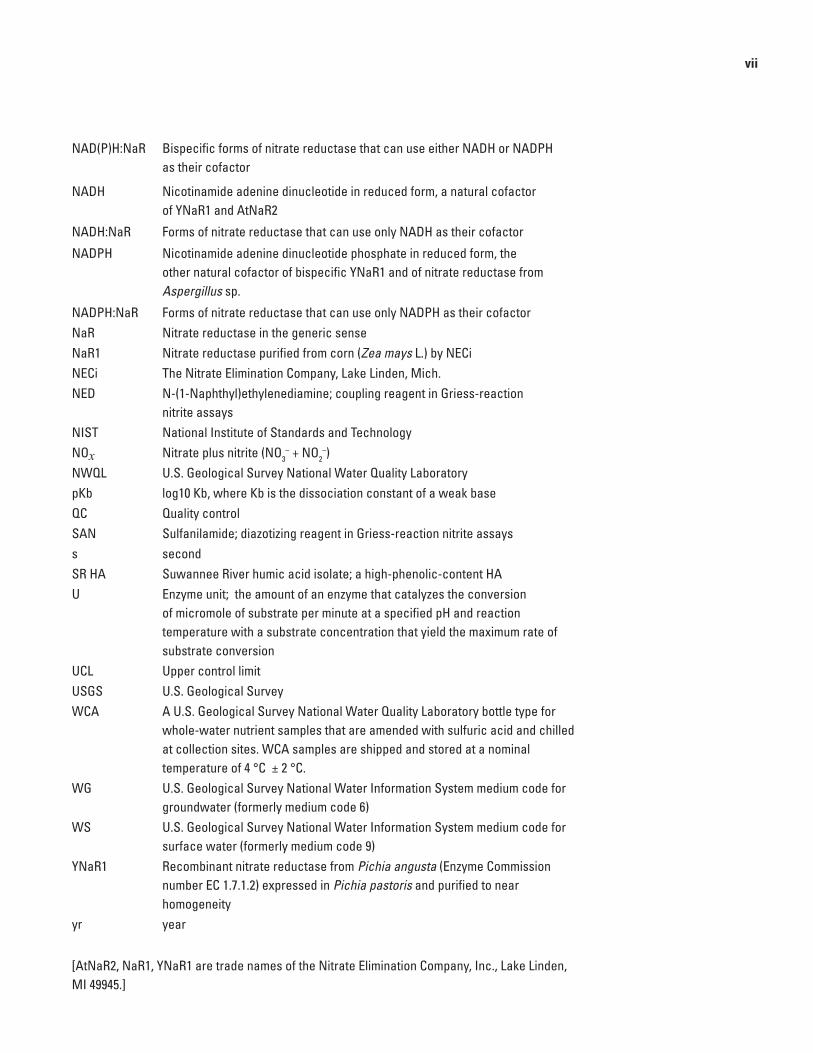
vii
NAD(P)H:NaR Bispecific forms of nitrate reductase that can use either NADH or NADPH as their cofactor
NADH Nicotinamide adenine dinucleotide in reduced form, a natural cofactor of YNaR1 and AtNaR2
NADH:NaR Forms of nitrate reductase that can use only NADH as their cofactor
NADPH Nicotinamide adenine dinucleotide phosphate in reduced form, the other natural cofactor of bispecific YNaR1 and of nitrate reductase from Aspergillus sp.
NADPH:NaR Forms of nitrate reductase that can use only NADPH as their cofactorNaR Nitrate reductase in the generic senseNaR1 Nitrate reductase purified from corn (Zea mays L.) by NECiNECi The Nitrate Elimination Company, Lake Linden, Mich.NED N-(1-Naphthyl)ethylenediamine; coupling reagent in Griess-reaction nitrite assaysNIST National Institute of Standards and TechnologyNOx Nitrate plus nitrite (NO3
– + NO2–)
NWQL U.S. Geological Survey National Water Quality LaboratorypKb log10 Kb, where Kb is the dissociation constant of a weak baseQC Quality controlSAN Sulfanilamide; diazotizing reagent in Griess-reaction nitrite assayss secondSR HA Suwannee River humic acid isolate; a high-phenolic-content HAU Enzyme unit; the amount of an enzyme that catalyzes the conversion of micromole of substrate per minute at a specified pH and reaction temperature with a substrate concentration that yield the maximum rate of substrate conversion UCL Upper control limitUSGS U.S. Geological SurveyWCA A U.S. Geological Survey National Water Quality Laboratory bottle type for whole-water nutrient samples that are amended with sulfuric acid and chilled at collection sites. WCA samples are shipped and stored at a nominal temperature of 4 °C ± 2 °C.WG U.S. Geological Survey National Water Information System medium code for groundwater (formerly medium code 6)WS U.S. Geological Survey National Water Information System medium code for surface water (formerly medium code 9)YNaR1 Recombinant nitrate reductase from Pichia angusta (Enzyme Commission number EC 1.7.1.2) expressed in Pichia pastoris and purified to near homogeneityyr year
[AtNaR2, NaR1, YNaR1 are trade names of the Nitrate Elimination Company, Inc., Lake Linden, MI 49945.]


Analytical Properties of Some Commercially Available Nitrate Reductase Enzymes Evaluated as Replacements for Cadmium in Automated, Semiautomated, and Manual Colorimetric Methods for Determination of Nitrate Plus Nitrite in Water
By Charles J. Patton1 and Jennifer R. Kryskalla2
from more than 3,800 geographically and seasonally diverse surface-water and groundwater samples that were analyzed in parallel by CFA-CdR and CFA enzyme-reduction methods. Finally, (3) demonstration of a semiautomated batch proce-dure in which 2-milliliter analyzer cups or disposable spectro-photometer cuvettes serve as reaction vessels for enzymatic reduction of nitrate to nitrite prior to analytical determinations. After the reduction step, analyzer cups are loaded onto CFA, flow injection, or discrete analyzers for simple, rapid, automatic nitrite determinations. In the case of manual determinations, analysts dispense colorimetric reagents into cuvettes containing post-reduction samples, allow time for color to develop, insert cuvettes individually into a spectrophotometer, and record per-cent transmittance or absorbance in relation to a reagent blank. Data presented here demonstrate equivalent analytical perfor-mance of enzymatic reduction NOx methods in these various formats to that of benchmark CFA-CdR NOx methods.
IntroductionNitrate is one of the most universally determined anions
in environmental water, drinking water, and wastewater because it can promote eutrophication and is toxic to fetuses and young of livestock and humans at concentrations that exceed about 10 milligrams nitrogen per liter (mg-N/L). A thorough review of detection and determination methods for nitrate and nitrite in a variety of matrices is available else-where (Moorcroft and others, 2001) and is not duplicated here. Some important references not cited in the Moorcroft review include one describing reduction of nitrate to nitrite with trivalent vanadium (Miranda, 2001), another on optimiz-ing cadmium-reduction (CdR) assays (Gal and others, 2004), a third documenting ferrous iron interference in the Griess colorimetric indicator reaction (Colman and Schimel, 2010a, b), and several pertaining to nitrate-reductase-based nitrate assays (Senn and Carr, 1976; Guevara and others, 1998; Mori
AbstractA multiyear research effort at the U.S. Geological Survey
(USGS) National Water Quality Laboratory (NWQL) evaluated several commercially available nitrate reductase (NaR) enzymes as replacements for toxic cadmium in longstanding automated colorimetric air-segmented continuous-flow analyzer (CFA) methods for determining nitrate plus nitrite (NOx) in water. This research culminated in USGS approved standard- and low-level enzymatic reduction, colorimetric automated discrete analyzer NOx methods that have been in routine operation at the NWQL since October 2011. The enzyme used in these methods (AtNaR2) is a product of recombinant expression of NaR from Arabidopsis thaliana (L.) Heynh. (mouseear cress) in the yeast Pichia pastoris. Because the scope of the validation report for these new automated discrete analyzer methods, published as U.S. Geological Survey Techniques and Methods 5–B8, was limited to performance benchmarks and operational details, extensive foundational research with different enzymes—primarily YNaR1, a product of recombinant expression of NaR from Pichia angusta in the yeast Pichia pastoris—remained unpublished until now. This report documents research and development at the NWQL that was foundational to devel-opment and validation of the discrete analyzer methods. It includes: (1) details of instrumentation used to acquire kinet-ics data for several NaR enzymes in the presence and absence of known or suspected inhibitors in relation to reaction tem-perature and reaction pH; and (2) validation results—method detection limits, precision and bias estimates, spike recoveries, and interference studies—for standard- and low-level automated colorimetric CFA-YNaR1 reduction NOx methods in relation to corresponding USGS approved CFA cadmium-reduction (CdR) NOx methods. The cornerstone of this validation is paired-sample statistical and graphical analysis of NOx concentrations
1U.S. Geological Survey, National Water Quality Laboratory, Denver, Colo.2VA Desert Pacific Network. Long Beach, Calif.

2 Colorimetric Assays of Nitrate in Water—Replacing Cadmium with Nitrate Reductase Enzymes
2000, 2001; Patton and others, 2002; MacKown and Weik, 2004; Pinto and others, 2005; Campbell and others, 2006; Patton and Kryskalla, 2011).
Typically for water analysis applications, nitrate is reduced to nitrite and subsequently determined colorimetri-cally with Griess reagents (Bratton and Marshall, 1939; Bendschneider and Robinson, 1952). Cadmium in various forms—electrolytically precipitated, “mossy” or “spongy,” filings, granules, and filings or granules washed with solutions of mercury (II), silver (I), or copper (II) ions (Nydahl, 1976; Davison and Woof, 1978)—has long been the reducing agent of choice for colorimetric nitrate plus nitrite (NOx) determi-nations. For example, copper-washed (copperized) cadmium granules packed into small columns (Wood and others, 1967) are prescribed in the longstanding U.S. Geological Survey (USGS) and U.S. Environmental Protection Agency (EPA) air-segmented continuous-flow analyzer, cadmium-reduction (CFA-CdR) methods I-2545-90 and 353.2, respectively. Wire-in-tube cadmium reactors (Stainton, 1974; Willis, 1980; Willis and Gentry, 1987; Patton and Rogerson, 2007) and open-tubular cadmium reactors (Patton, 1983; Elliot and others, 1989; Zhang and others, 2000) are well known and effective alternatives to packed-bed reactors. A definitive study of continuous-flow cadmium reactor chemistry and kinetics (Nydahl, 1976) demonstrated that reaction-stream pH in the range of 7.0 to 8.5 is required for near-quantitative reduction of nitrate to nitrite with only minor (less than 3 percent) reduc-tion of nitrite to lower oxidation species. In this pH regime, cadmium hydroxide—produced primarily by quantitative reaction of cadmium with dissolved oxygen in samples and reagents (Nydahl, 1974)—precipitates on cadmium granules and continuously deactivates the reactor. Adding a reagent that forms soluble complexes with cadmium (II) ions—imidazole or ammonium chloride, typically—to the pH buffer minimizes this problem and stabilizes reduction of nitrate to nitrite during operation. Nydahl appears to be the first to recognize the unique properties of imidazole—specifically, its high buffer capacity at pH 7.5 (pKb = 7.09) and its abil-ity to complex cadmium (II) even in the presence of Ca (II) and Mg (II) ions—that account for its use in most CFA-CdR nitrate determination methods.
Widespread acceptance and application of CdR methods for nitrate determination notwithstanding, reactor geometry, activation procedures, and reagent formulations remain top-ics of perennial discussion among environmental analytical chemists (Gal and others, 2004; Colman and Schimel, 2010a, b). Ease-of-use, toxicity, and waste-disposal issues associ-ated with CdR devices, however, led us to explore commer-cially available, nontoxic nitrate reductase (NaR) enzymes as replacements for granular copperized cadmium (Patton and others, 2002). The NaR reduces nitrate to nitrite with specific-ity exceeding that of copperized cadmium and is nontoxic. In this report we share our analytical experience with sev-eral NaRs and describe how to use them as replacements for
cadmium in automatic, semiautomatic, and manual methods for colorimetric determination of NOx in water. We provide details of reagent preparation, instrumentation, and data dem-onstrating statistical equivalence of NOx concentrations deter-mined with granular copperized cadmium and soluble NaR.
Purpose and Scope
This report documents our multiyear study to character-ize several commercially available, nontoxic NaR enzymes as replacement reagents for cadmium in routine, colorimetric determinative methods for nitrate in water. We evaluated the performance of NaR as an analytical reagent in relation to cadmium. Cadmium has been the reagent of choice for NOx determinations in water for over 40 years (Wood and others, 1967) and is specified in longstanding reference methods such as USGS I–2545–90 and EPA 353.2. We wrote this report pri-marily to provide USGS scientists and decision-makers, USGS cooperators, and other National Water Quality Laboratory (NWQL) customers with graphical and statistical summaries of validation data, including method detection limits, calibra-tion curves, control charts, and between-day concentration variability for environmental sample replicates that support replacement of toxic cadmium with nontoxic, soluble NaR reagents in these time-honored methods for determining NOx in water. Additionally, to facilitate incorporation of these green chemistry nitrate reduction reagents into the routine operations of public-, private-, and academic-sector water quality and teaching laboratories, we have included details of soluble NaR nitrate determination methods in several different analytical formats. To these ends we provide the following:
1. Paired graphical and statistical analyses of NOx concen-trations for about 3,800 seasonally, geographically, and compositionally diverse surface-water and groundwater samples that were analyzed by USGS CdR reference methods and our previously reported (Patton and others, 2002) CFA soluble NaR method.
2. Summaries of the effects of numerous anionic and cationic constituents of surface-water and groundwater matrices on the reduction efficiencies of copperized cad-mium, several NaRs, and the Griess indicator reaction.
3. Summaries of the effects of several humic acid isolates on the activity of four commercially available NaRs in rela-tion to reaction temperature and humic acid concentration.
4. Information necessary to replace granular, copperized cad-mium reactors with soluble NaR on a variety of automated and manual analytical platforms. We provide this to aid public-, private-, and academic-sector analysts who might want to incorporate these green chemistry nitrate reduction reagents into routine operations in their laboratories.

Analytical Methods 3
Description of Study Approach
This report provides a chronological narrative of research with several commercially available NaRs that led to validation and approval of standard- and low-level USGS method numbers I-2547-11 and I-2548-11, respectively, for enzymatic reduction colorimetric determination of NOx in water by automated discrete analysis (DA). The narrative begins shortly after publication of an automated CFA NOx method that used NaR purified from corn seedlings (Patton and others, 2002) and ends just before validation of auto-mated discrete analyzer methods using AtNaR2 (Patton and Kryskalla, 2011) began. In this report, our intent is to provide a level of experimental detail that permits others to duplicate or extend work reported here.
Analytical Methods
1. Application
These methods (see table 1) are intended for determina-tion of dissolved NOx in filtered and filtered-acidified water samples. They also are applicable to wholewater-acidified samples that are laboratory filtered prior to analysis. They are direct replacements for longstanding USGS and EPA colorimetric nitrate methods and differ from them only in the reagents used to reduce nitrate to nitrite—nontoxic, soluble NaR replaces toxic granular, copperized cadmium—prior to colorimetric nitrite determination with Griess reagents. As is the case for CdR methods, these NaR methods are intended for surface-water and groundwater matrices—USGS National Water Information System medium codes WS and WG, respectively. We did not investigate sample media such as seawater, brines, leachates, potassium chloride soil extracts,
landfill effluents, and other nonconforming matrices. Unless stated otherwise, we prepared calibrants and quality control (QC) solutions in deionized (DI) water. Nominal analytical ranges for standard- and low-level methods are 0.05 to 5.00 mg-N/L and 0.01 to 1.00 mg-N/L, respectively.
2. Method Summaries and Analytical Considerations
2.1 Except as noted, analytical methods used NaR from Pichia angusta—Enzyme Commission (EC) 1.7.1.2—produced by recombinant expression in Pichia pastoris and marketed as YNaR1 (Campbell and others, 2004; Barbier and others, 2004) by its manufacturer, the Nitrate Elimination Company (NECi), Lake Linden, Mich. Recom-binant expression is a technique by which a gene that codes for NaR is excised from one organism and inserted into a different organism from which it is harvested. YNaR1 is bispecific [generically designated, NAD(P)H:NaR], meaning that it can use either β-nicotinamide adenine dinucleotide, reduced form (NADH) or β-nicotinamide adenine dinucleo-tide phosphate, reduced form (NADPH) as its obligatory electron donor (“cofactor”). Analytical properties of YNaR1 and NADH-specific NaR purified from Zea mays L. (corn) seedlings—EC 1.7.1.1 and marketed by NECi as NaR1—used in our preliminary research (Patton and others, 2002) are equivalent.
In humic acid interference experiments, we tested YNaR1, NaR1, NaR from mold (Aspergillus sp., EC 1.7.1.2), and recombinant NaR from mouseear cress (Arabidopsis thaliana, EC 1.7.1.1, expressed in Pichia pastoris and mar-keted as AtNaR2). YNaR1, NaR1, and AtNaR2 are proprietary products of the Nitrate Elimination Company (NECi), Lake Linden, Mich. In the presence of obligatory cofactors, all four enzymes quantitatively reduce nitrate (NO3
–) to nitrite (NO2–)
Table 1. Parameter and method codes for unapproved U.S. Geological Survey enzymatic reduction nitrate + nitrite determination methods I-2531-12 (automated continuous-flow analyzer), I-2532-12 (low-level automated continuous-flow analyzer), I-1531-12 (semiautomated batch reduction), and I-1532-12 (low-level semiautomated batch reduction).
[+, plus; Lab, laboratory; N, nitrogen; CFA, air-segmented continuous-flow analysis; TBA, to be assigned; FCC, filtered, chilled sample bottle type; FCA, filtered, chilled, acidified sample bottle type; µm, micrometer; mL, milliliter; N, normal; H2SO4, sulfuric acid; USGS, U.S. Geological Survey]
DescriptionCodes Bottle
typeLab Parameter MethodNitrate + nitrite, as N, colorimetry, CFA, enzymatic reduction-diazotization, filtered TBA 00631 RED10 FCC1
Nitrate + nitrite, as N, low level, colorimetry, CFA, enzymatic reduction-diazotization, filtered TBA 00631 RED11 FCC1
Nitrate + nitrite, as N, colorimetry, CFA, enzymatic reduction-diazotization, filtered acidified TBA 00631 RED12 FCA2
Nitrate + nitrite, as N, colorimetry, semiautomated batch enzymatic reduction-diazotization, filtered TBA 00631 RED13 FCC1
Nitrate + nitrite, as N, colorimetry, semiautomated batch enzymatic reduction-diazotization, filtered, low-level
TBA 00631 RED14 FCC1
Nitrate + nitrite, as N, colorimetry, semiautomated batch enzymatic reduction-diazotization, filtered acidified
TBA 00631 RED15 FCA2
1FCC samples must be processed through 0.45-µm filters and chilled at collection sites.2FCA samples must be processed through 0.45-µm filters, chilled, and amended with 1 mL of 4.5 N H2SO4 solution (USGS water-quality field supply
number Q438FLD) per 120 mL of sample at collection sites.

4 Colorimetric Assays of Nitrate in Water—Replacing Cadmium with Nitrate Reductase Enzymes
in the pH range of 7–8 and have high activity at pH 7.5 in phosphate or 3-N-morpholino-propansulfonic acid (MOPS) buffers (see equation 1). NO NADH H pH NO NAD H ONaR
3 2 27 8− + − ++ + = − + +⎯ →⎯⎯⎯⎯⎯( )
(1)
2.2 As shown in the following reaction scheme, resultant nitrite plus any nitrite present in the sample prior to enzymatic reduction, diazotizes with sulfanilamide (SAN) at pH ≈ 1. The p-diazonium sulfanilamide thus formed subse-quently reacts with N-(1-Naphthyl) ethylenediamine (NED)—the Bratton-Marshall variant of the Griess reaction—to form a pink azo dye with an absorption maximum at 543 nanometers (nm) (Bendschneider and Robinson, 1952; Fox, 1979, 1985; Pai and others, 1990).
+
NH2
N
HN NH2
HNNH2
N
N
SO2NH2
SO2NH2
N+
NO2–
H+
SO2NH2
Sulfanilamide(SAN)
p-Diazoniumsulfanilamide
N-(1-Napthyl)-ethylenediamine
(NED)Azo chromophore
(λmax = 543 nm)
3. Interferences
3.1 During photometric detection any particles in sam-ples (turbidity) scatter light and thereby contribute to apparent chromophore absorbance. Discernible sample turbidity that would otherwise falsely elevate apparent nitrate concentration, therefore, should be removed by 0.45-micrometer membrane filtration prior to analytical determinations.
3.2 Data in table 2 confirm that chloride and sulfate slightly retard reduction of nitrate to nitrite by cadmium (Nydahl, 1976) and indicate that these anions have a similar effect on reduction of nitrate to nitrite by soluble YNaR1. We normalized percent nitrate reduction values in this table by assuming 100-percent reduction for 5 mg-N/L nitrate solutions that did not contain chloride or sulfate. Considering median con-centrations of chloride and sulfate determined annually at the NWQL—about 15 mg/L and 23 mg/L, respectively—and the greater than 95-percent nitrate recovery at chloride and sulfate concentrations up to 1,000 mg/L, these anions should interfere negligibly in surface-water and groundwater samples typically analyzed for nitrate at the NWQL. Furthermore, the similar CdR- and YNaR1-method dose/response functions for chloride and sulfate indicated in table 2 suggest that these anions may also slightly retard the colorimetric indicator reaction. In any
case, these anions at concentrations up to 1,000 mg/L would have negligible effect on statistical comparisons of NOx con-centrations determined by CdR- and NaR-based methods.
3.3 High concentrations of certain transition- and heavy-metal ions such as iron, copper, zinc, and lead inhibit NaR to various extents and therefore might hinder quantitative reduction of nitrate to nitrite. Ethylenediamine tetraacetic acid (EDTA) forms strong complexes with such metal ions and effectively minimizes their potential interference. Large buffer-to-sample volume ratios used in methods described here further mitigate reduction-step and colorimetric-step interferences.
3.4 High-phenolic-content humic acids (HA) in samples are powerful inhibitors of several NaRs evaluated in this work. It is noteworthy that at subambient temperatures (5–20 °C), HA inhibition is negligible for the four NaRs we evaluated. Except for AtNaR2, HA inhibition increases as reaction tem-perature increases above 20 °C. AtNaR2 is unique in maintain-ing high activity at HA concentrations up to 20 mg/L even at 37 °C.
3.5 Colorimetric Griess indicator reaction interfer-ences have been characterized and assessed systematically by Norwitz and Keliher (1985, 1986). Recently elucidated Griess reaction chromophore formation suppression caused by Fe (II) concentrations greater than or equal to about 10 mg/L can be eliminated by replacing EDTA with diethylenetriamine-pentaacetic acid in NOx assay buffers (Colman and Schimel, 2010a, b). Fe (II) concentrations of this magnitude are rare in surface water and groundwater, but analysts applying methods described in this report to determination of NOx in high-iron soil extracts, acid mine drainage water, or pore water from low-oxygen bed sediments should be aware of this potential interference and its remedy.
3.6 NADH, the cofactor reagent we used with YNaR1 and AtNaR2 enzymes, inhibits the Griess indicator reaction (Patton and others, 2002, table 1; Moody and Shaw, 2006). In our experience, quantitative reduction of nitrate to nitrite with minimum Griess reaction inhibition occurs when initial NADH
Table 2. Effects of chloride and sulfate on reduction of 5 milligrams nitrate-nitrogen per liter solutions by CdR and YNaR1 nitrate reductase.
[mg/L, milligram(s) per liter; CdR, cadmium reduction; YNaR1, recombinant nitrate reductase from Pichia angusta]
Anion concentration
(mg/L)
Nitrate reduction (percent)
Chloride SulfateCdR YNaR1 CdR YNaR1
0 100.0 100.0 100.0 100.05 100.0 100.8 97.7 98.8
10 98.1 98.1 97.4 98.350 96.3 97.0 97.1 97.4
100 96.0 96.1 96.9 97.3500 95.9 96.2 96.5 97.3
1,000 96.5 97.4 96.6 97.4

Analytical Methods 5
concentration is in two-fold molar excess to that of a method’s maximum nitrate concentration in the reaction medium. All methods described here conform to this initial NADH con-centration condition. It is also noteworthy that NaR promotes oxidation of NADH to NAD+ even in the absence of nitrate. This property is of little consequence in automated methods that use separate NaR and NADH reagents, but it limits the useful lifetime of combined NaR/NADH reagent used in semiauto-mated batch (batch) methods to about one hour.
4. Instrumentation
4.1 We previously described (Patton and others, 2002) complete details of the three-channel, CFA instrument con-figured for simultaneous photometric determination of nitrite, CdR NOx, and YNaR1-reduction NOx. In CFA-method valida-tion work reported here, we substituted 3 enzyme units (U) of YNaR1 for each unit of NaR1 (section 2.1) that we had used in previous research (Patton and others, 2002). This increase in enzyme concentration allowed us to reduce the reaction coil volume to 4 milliliters (mL). We also decreased reaction coil temperature from 30 °C to near ambient (≈ 26 °C) for reasons explained in section 3.4.
For low-level CdR and YNaR1 validation work, we modified CdR and NaR analytical cartridges as follows:
dispensing sample and enzyme reagent into reaction vessels induces secondary flow that results in rapid mixing. Forty minutes to 24 hours after initiating enzymatic nitrate reduc-tion reactions, we performed colorimetric nitrite assays either automatically by CFA, FIA, or DA at analysis rates of 180 samples per hour (samples/h), 75 samples/h, or 600 samples/h, respectively, or manually with a Cary 50 spectrophotometer (Agilent Technologies, Inc, Santa Clara, Calif.). In the latter case, we dispensed Griess reagents into disposable cuvettes prior to absorbance measurements at 543 nm with the spectro-photometer. We typically dispensed sample and mixed NaR/NADH reagent volumes of 25 µL and 500 µL, respectively, for CFA and DA assays, and 50 µL and 1,000 µL, respectively, for FIA and manual assays. Figure 1 (A–C) illustrates prepara-tive steps for batch-reduction procedures.
5. Apparatus and Operating Parameters
We used EDP-plus digital pipets (Rainin Instruments, Oakland, Calif.) fitted with 10–100-µL, 100–1,000-µL, and 1.00–10.00-mL liquid ends as appropriate for most precision dispensing such as preparing calibrants, third-party check solutions, spike solutions and spikes, and some reagents. In batch reduction procedures, we used a programmable, dual-syringe dispenser/dilutor (Model IQ 190 DS, Cavro OEM Components, San Jose, Calif.) equipped with a 100-μL sample syringe and a 5- or 10-mL reagent syringe (fig. 1) to aspirate samples, dose them with mixed NADH/YNaR1 reagent, and dispense them into appropriate reaction vessels. Although figure 1 shows samples being aspirated directly from bottles, we poured small volumes of calibrants, QC solutions, and samples into 2-mL autosampler cups and placed them on an autosampler tray (fig. 1C). We then aspirated samples from these cups and dispensed them with NaR/NADH reagent into colorimetric-method-appropriate containers. The Cavro IQ 190 is no longer in productions, but other currently available benchtop dispensers/dilutors—Hamilton 500 series (Hamilton Instruments, Reno, Nev.), for example—are functionally equivalent.
A model TLC 40 temperature-controlled cuvette holder (Quantum Northwest, Spokane, Wash.) equipped with a magnetic stirring accessory provided continuous stirring and cooling/heating to ±0.03 °C for enzymatic and colorimetric reactions that we monitored over a 5–50 °C temperature range. In such experiments we used standard, 1.0-centimeter (cm) path length, quartz cuvettes (Starna Cells, Inc., Atascadero, Calif.) as reaction vessels. Although the TLC 40 module was designed for use with Cary 50 spectrophotometers, we also mounted it on the deck of an OB-1 autosampler (Oregon Manufacturing Support, Malin, Oreg.) for automated kinetics experiments as shown in figure 2. For such experiments we connected the OB-1 sampler probe to the sample inlet of an RFA-300 CFA nitrite analyzer and set sample and wash times at 20 seconds (s) and 10 s, respectively.
CdR Increased sample flow rate to 166 microliter per minute (µL/min)—an orange-white pump tube replaced the orange-green pump tube.NaR 1. Removed dilution loop. 2. Removed and replaced resample pump tube with three pump tubes:
• 2.5 millimoles per liter (mM) EDTA diluent (orange-yellow, 118 µL/min),
• air (orange-green, 74 µL/min), and• sample (orange-yellow, 118 µL/min).
4.2 We also developed an offline, batch NaR-reduction method amenable to automated or manual colorimetric determination of resulting nitrite with a variety of instrument types such as CFA, flow injection analyzers (FIA), DA, and benchtop spectrophotometers. Our goal in this work was to make simple, green-chemistry NOx analysis accessible to public-, private-, and academic-sector water-quality and teach-ing laboratories. Although our batch method can be carried out with traditional Class A or digital pipets, we found that programmable dispensers/dilutors (fig. 1) streamlined dispens-ing operations substantially. They were particularly when we used autosampler cups or disposable cuvettes as reaction vessels for the enzymatic reduction step. For example, we used a dispenser/dilutor to aspirate samples, dose them with a combined YNaR1/NADH reagent, and deliver the reactive solutions into autosampler cups or disposable spectropho-tometer cuvettes in a single, rapid operation. The force of

6 Colorimetric Assays of Nitrate in Water—Replacing Cadmium with Nitrate Reductase Enzymes
Figure 1. Sketches showing steps for offline enzymatic reduction of nitrate to nitrite using a syringe-pump-based dispenser/diluter module. A, reagent syringe filled and ready for sample aspiration; B, sample pickup; C, sample and reagent dispensed and mixed. (NADH, nicotinamide adenine dinucleotide in reduced form, a natural cofactor of NaR enzyme reagents YNaR1 and AtNaR2)
Samplecup
NaR/NADHreagent
Programmabledispenser/dilutor
Cuvette
(enlarged)
C
B
A
Autosampler tray
CuvetteSamplecupSample bottles
Programmabledispenser/dilutor
NaR/NADHreagent
Reagent
Sample
Air

Analytical Methods 7
The OB-1 sampler wash reservoir (B in fig. 2) was not thermostatted. We began each experiment by pipetting 2.460 mL of buffered NaR reagent (refer to section 6.1.4) and 0.150 mL of sample into a magnetically stirred cuvette posi-tioned in the TLC 40 module. After NaR reagent and sample had equilibrated to the desired temperature (5–40 °C, typically), we added 0.540 mL of NADH reagent to initiate reduction of nitrate to nitrite.
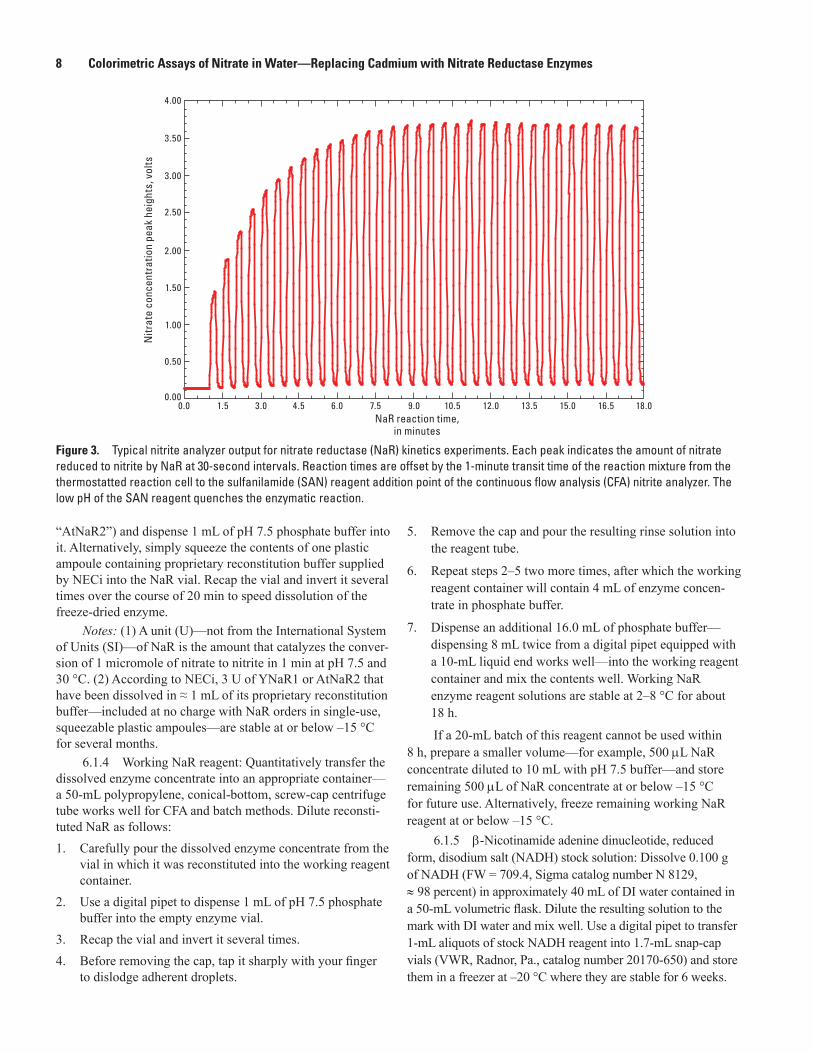
We followed reaction progress by Griess-reaction nitrite analysis using our standard CFA nitrite analytical cartridge (Patton and others, 2002). Nominal pump tube delivery rates for air, sample, diluent, SAN reagent, and NED in this applica-tion (fig. 2) were 74 µL/min, 287 µL/min, 166 µL/min, 74 µL/min, and 74 µL/min, respectively. This third-generation CFA analyzer with pecked sampling, 1-mm internal diameter analytical cartridge components, 1.5 hertz (Hz) segmenta-tion frequency, and 2-µL bubble-through flow cells (Patton and Wade, 1997) produced baseline resolved peaks at the 2 samples/min analysis rate we used for all such experiments. The sampling cycle (20 s sample; 10 s wash) began with aspiration of the first reaction solution aliquot, which we initi-ated within a second or two of NADH addition. The aspirated slug of enzymatic test solution continues to react, without temperature regulation, within the sample pump tube and first mixing coil of the CFA nitrite analyzer. Therefore NaR in the aspirated reaction solution remains active for about 60 s until it reaches the point of acidic SAN reagent addition. At that point NaR is denatured and reduction of nitrate to nitrite stops (see fig. 2). Figure 3 shows the output from a typical kinetics experiment; here, the first peak (left-to-right) represents the amount of nitrate reduced to nitrite during the 1-min transit time between the tip of the sampler needle and the point of SAN reagent addition.
6. Reagent Preparation
Here we provide detailed instructions for preparing enzymatic and colorimetric reagents, which are the same for CFA and batch methods. All references to DI water refer to DI water piped throughout the NWQL. For purposes of nutrient analysis, NWQL DI water is equivalent to ASTM type I DI water (American Society for Testing and Materials, 2001, p. 107–109). We triple rinsed all volumetric glassware and containers for reagent and calibrant storage with dilute (≈ 5 percent volume-to-volume) hydrochloric acid and DI water just prior to use. We also triple rinsed reagent and cali-brant storage containers with small portions of the solutions they were to contain before we filled them.
6.1 Enzymatic reagents6.1.1 Disodium ethylenediaminetetraacetic acid
(EDTA), 25 mM: Dissolve 9.3 grams (g) EDTA—formula weight (FW) = 372.24, ultrapure grade—in approximately 800 mL DI water contained in a 1-L volumetric flask. Dilute the resulting solution to the mark with DI water, mix well, and transfer to a tightly capped bottle. The solution is stable at room temperature for 1 year.
6.1.2 Phosphate buffer (pH = 7.5): Dissolve 3.75 g potassium dihydrogen phosphate (KH2PO4, FW = 136.1) and 1.4 g potassium hydroxide (KOH, FW = 56.11) in about 800 mL of DI water contained in a 1-L volumetric flask. Add 1 mL 25 mM EDTA, dilute the resulting solution to the mark with DI water, and mix well. Transfer this solution to a tightly capped bottle where it is stable at room temperature for 1 year.
6.1.3 Nitrate reductase (NaR): Remove the cap from a vial containing 3 U of freeze-dried Pichia angusta NaR (EC 1.7.1.2, formerly EC 1.6.6.2, designated “YNaR1”) or 3 U of Arabidopsis thaliana NaR (EC 1.7.1.1, designated
Figure 2. Arrangement of components used for thermostatted nitrate reductase (NaR) kinetics experiments. A, TLC 40 peltier heating and cooling module; B, OB-1 sampler wash solution reservoir; dotted line indicates movement of the sampler probe between A and B. Sulfanilamide and N-(1-Naphthyl)-ethylenediamine reagents are abbreviated as SAN and NED, respectively; F/C denotes the photometer flow cell; nm, nanometers. See sections 5 and 6 text for additional details.
Waste
OB-1™sampler
A
Air
SAN
NED
Diluent
10 mm F/C 540 nm
Pump
B
8 Colorimetric Assays of Nitrate in Water—Replacing Cadmium with Nitrate Reductase Enzymes
“AtNaR2”) and dispense 1 mL of pH 7.5 phosphate buffer into it. Alternatively, simply squeeze the contents of one plastic ampoule containing proprietary reconstitution buffer supplied by NECi into the NaR vial. Recap the vial and invert it several times over the course of 20 min to speed dissolution of the freeze-dried enzyme.
Notes: (1) A unit (U)—not from the International System of Units (SI)—of NaR is the amount that catalyzes the conver-sion of 1 micromole of nitrate to nitrite in 1 min at pH 7.5 and 30 °C. (2) According to NECi, 3 U of YNaR1 or AtNaR2 that have been dissolved in ≈ 1 mL of its proprietary reconstitution buffer—included at no charge with NaR orders in single-use, squeezable plastic ampoules—are stable at or below –15 °C for several months.
6.1.4 Working NaR reagent: Quantitatively transfer the dissolved enzyme concentrate into an appropriate container—a 50-mL polypropylene, conical-bottom, screw-cap centrifuge tube works well for CFA and batch methods. Dilute reconsti-tuted NaR as follows:1. Carefully pour the dissolved enzyme concentrate from the
vial in which it was reconstituted into the working reagent container.
2. Use a digital pipet to dispense 1 mL of pH 7.5 phosphate buffer into the empty enzyme vial.
3. Recap the vial and invert it several times.4. Before removing the cap, tap it sharply with your finger
to dislodge adherent droplets.
5. Remove the cap and pour the resulting rinse solution into the reagent tube.
6. Repeat steps 2–5 two more times, after which the working reagent container will contain 4 mL of enzyme concen-trate in phosphate buffer.
7. Dispense an additional 16.0 mL of phosphate buffer— dispensing 8 mL twice from a digital pipet equipped with a 10-mL liquid end works well—into the working reagent container and mix the contents well. Working NaR enzyme reagent solutions are stable at 2–8 °C for about 18 h.
If a 20-mL batch of this reagent cannot be used within 8 h, prepare a smaller volume—for example, 500 µL NaR concentrate diluted to 10 mL with pH 7.5 buffer—and store remaining 500 µL of NaR concentrate at or below –15 °C for future use. Alternatively, freeze remaining working NaR reagent at or below –15 °C.
6.1.5 β-Nicotinamide adenine dinucleotide, reduced form, disodium salt (NADH) stock solution: Dissolve 0.100 g of NADH (FW = 709.4, Sigma catalog number N 8129, ≈ 98 percent) in approximately 40 mL of DI water contained in a 50-mL volumetric flask. Dilute the resulting solution to the mark with DI water and mix well. Use a digital pipet to transfer 1-mL aliquots of stock NADH reagent into 1.7-mL snap-cap vials (VWR, Radnor, Pa., catalog number 20170-650) and store them in a freezer at –20 °C where they are stable for 6 weeks.
Figure 3. Typical nitrite analyzer output for nitrate reductase (NaR) kinetics experiments. Each peak indicates the amount of nitrate reduced to nitrite by NaR at 30-second intervals. Reaction times are offset by the 1-minute transit time of the reaction mixture from the thermostatted reaction cell to the sulfanilamide (SAN) reagent addition point of the continuous flow analysis (CFA) nitrite analyzer. The low pH of the SAN reagent quenches the enzymatic reaction.
4.00
3.50
3.00
2.50
2.00
1.50
1.00
0.50
0.00
Nitr
ate
conc
entr
atio
n pe
ak h
eigh
ts, v
olts
0.0 1.5 3.0 4.5 6.0 7.5 9.0 10.5 12.0 13.5 15.0 16.5 18.0NaR reaction time,
in minutes

Analytical Methods 9
6.1.6 NADH working solution: Remove one vial of stock NADH from the freezer and allow it to thaw at ambient temperature for about 20 min. Quantitatively transfer the stock NADH solution into in an appropriate reagent container—a 15-mL polypropylene, conical-bottom, screw-cap centrifuge tube works well for CFA and batch methods. Dilute thawed NADH as follows:
1. Carefully pour the thawed NADH concentrate into the working reagent tube.
2. Use a digital pipet to dispense 1 mL of phosphate buffer into the empty snap-cap vial.
3. Recap the vial and invert it several times.
4. Before flipping the cap up, tap it sharply with your finger to dislodge adherent droplets and add this rinse to the working NADH reagent tube, which will then contain 2 mL.
5. Use a digital pipet equipped with a 10-mL liquid end to dispense 8.0 mL of phosphate buffer into the work-ing NADH reagent tube and mix the contents well. This 10-mL volume of working NADH reagent is stable at 2–8 °C for at least 24 h.
Note: (1) In 2007, the NWQL began using NECi reagent kits that contain 3 U of freeze-dried NaR, 2 mg of NADH (each in a separate vial), and a plastic ampoule containing 1 mL of proprietary reconstitution buffer. After 1 mL of pH 7.5 phosphate buffer is added to the vial containing 2 mg of NADH, preparative steps are identical to those described for thawed NADH concentrate (section 6.1.5).
6.1.7 Combined NaR/NADH reagent (batch methods only): Combine and mix 20 mL of working NaR reagent (section 6.1.4), 10 mL of working NADH reagent (section 6.1.6), and 25 mL of DI water in a plastic container. This reagent is stable only for about 1 hour.
6.2 Colorimetric reagents
6.2.1 Sulfanilamide reagent (SAN): Slowly add 150 mL concentrated hydrochloric acid (HCl, ≈ 12M) to about 250 mL DI water contained in a 500-mL volumetric flask. While the solution is still warm, add 5.0 g sulfanilamide (C6H8N2O2S, FW = 172.2) to the flask. Swirl the flask gently to dissolve the SAN. Dilute this reagent to the mark with DI water and mix it well. Store SAN at room temperature in a clear glass or trans-lucent plastic, 500-mL bottle where it is stable for 6 months.
6.2.2 N-(1-Naphthyl)-ethylenediamine reagent (NED): Dissolve 0.5 g NED (C12H14N2•2HCl, FW = 259.2) in about 400 mL of DI water contained in a 500-mL volumetric flask. Dilute this reagent to the mark with DI water and mix it well. Store NED at room temperature in an amber, 500-mL glass bottle where it is stable for 6 months.
7. Calibrants and Quality-Control Solutions
For continuous-flow and manual batch nitrate and nitrite calibration, we obtained National Institute of Standards and Technology (NIST)-traceable 1,000 mg-N/L nitrate and nitrite solutions commercially and used them to prepare working calibrants and spike solutions by dilution with DI water. We used electronic digital pipets and Class A volumetric flasks to prepare all calibrants and QC solutions used in validation experiments described in this report. We observed vendor-specified storage temperatures and shelf lives for primary calibrants. We prepared working calibrants, QC, and spike solutions monthly and stored them in tightly capped containers in a refrigerator.
8. Sample Preparation
8.1 CFA enzymatic NOx methods require analysts to rinse and fill analyzer-appropriate cups or tubes with well-shaken sample and place them into autosampler trays. No other manual sample preparation is required.
8.2 The batch enzymatic NOx method requires analysts to dose samples, calibrants, and reference solutions with a combined NaR/NADH reagent buffered at pH 7.5. After at least 20 min—about twice the minimum time required for quantitative reduction of nitrate to nitrite under assay condi-tions specified here—and up to 24 h later, analysts determine resulting nitrite by automated or manual Griess reaction colorimetry. Handheld or benchtop programmable dispensers/dilutors streamline dispensing operations, particularly if autosampler cups or disposable cuvettes are used as reac-tion vessels for the enzymatic reduction step (section 4.2). We provide details of post-reduction, colorimetric nitrite determinations by automated CFA, FIA, and DA in the “Characterization of Nontoxic Nitrate Reductase Enzymes and Analytical Performance” section. For manual Griess reaction colorimetry we dispensed 250 µL of SAN, waited 60–120 s, and then dispensed 250 µL of NED into post-reduction solu-tions (50 µL of sample plus 1 mL of combined NaR/NADH reagent). We inserted cuvettes into the sample compartment of a Cary 50 spectrophotometer and measured absorbance at 543 nm 10 min to 1 h after addition of colorimetric reagents. Unless specified otherwise, we measured absorbance at ambi-ent temperature (≈ 23 °C).
9. Instrument Performance
9.1 Automated CFA and DA (nitrite only) methods operate at rates of 90 and 600 tests per hour, respectively. Approximate test volumes for CFA (excluding dilution loop) and DA methods are 400 µL and 125 µL, respectively.
9.2 For batch NaR reduction procedures, we used a pro-grammable dispenser/dilutor (see section 5) to aspirate samples, dose them with a combined YNaR1/NADH reagent, and deliver

10 Colorimetric Assays of Nitrate in Water—Replacing Cadmium with Nitrate Reductase Enzymes
the reactive solutions into autosampler cups or disposable spectrophotometer cuvettes at a rate of about 80/h. This rate includes about 30 min needed to transfer a batch of 80 samples from their storage bottles into secondary containers—2-mL analyzer cups, typically. We took this precaution to avoid the possibility of contaminating bulk samples by aspirating subsam-ples directly from primary storage containers. Readers should note that as described under “Background Information” in the “Characterization of Nontoxic Nitrate Reductase Enzymes and Analytical Performance” section, the useful lifetime of combined NaR/NADH reagent is only about 1 h. After at least 20 min and up to 24 h after initiation of enzymatic nitrate reduction, resultant nitrite can be determined by automatic or manual colorimetry as described in the “Characterization of Nontoxic Nitrate Reductase Enzymes and Analytical Performance” section.
10. Calibration
For automated, semiautomated, and manual NaR nitrate-determination methods described in this report, we routinely obtained calibration curves with correlation coefficients (r2) greater than 0.999 for second-order polynomial least-squares calibration functions (y = a + bx + cx2) (Draper and Smith, 1966). In this equation, y is the baseline and blank-corrected absorbance (peak heights in the case of CFA and FIA methods) and x is the nominal nitrate concentration. Typical nitrate and nitrite calibration curves for NaR validation experiments with CFA instruments are published elsewhere (Patton and others, 2002). Calibration ranges for all standard- and low-level NOx methods described in this report are 0.05–5.00 mg-N/L and 0.01–1.00 mg-N/L, respectively. Throughout this report, dilu-tion limits are 5.00 mg-N/L and 1.00 mg-N/L for standard- and low-level NOx methods, respectively.
11. Procedure and Data Evaluation
Except as noted in section 4.1, we have published (Pat-ton and others, 2002) complete details, including analytical cartridge diagrams for the nitrite, and CdR and NaR NOx determination methods that we used for CFA-method valida-tion data reported here. Table 3 identifies NWQL standard operating procedures that provide complete procedural details of USGS CFA-CdR methods against which we validated soluble, NaR-reduction CFA methods.
12. Calculations
12.1 We used vendor-supplied software—fASPac version 3.3 (Astoria-Pacific, Clackamas, Oreg.) and WinUV (Agilent Technologies, Inc., Santa Clara, Calif.)—to acquire photometric data from CFA and benchtop spectrophotometer instruments and convert them into concentration units. Unless otherwise noted, we selected quadric, linear least-squares calibration functions (Draper and Smith, 1966) of the form
y = a + bx + cx2 (refer to section 10). Method-specific standard operating procedures referenced in table 3 provide calibra-tion protocols and complete calibrant preparation details for CFA methods. We manually prepared working calibrants for CFA methods.
12.2 We used Microsoft Office 2003 Excel to compile data acquired from instrument-specific software packages, to perform arithmetic and linear least-squares regression parameter calculations, and to prepare most graphical representations of data in this report. We used Origin Pro 8.0 (OriginLab Corp., Northampton, Mass.) to prepare box plots and to perform paired t-test and Wilcoxon signed-rank test statistical analyses.
12.3 The fASPac software identified in section 12.1 pro-vides for automatic application of dilution factors—the number by which a measured concentration must be multiplied to obtain the analyte concentration in the sample prior to dilution. We diluted off-scale samples manually using digital pipets. The software requires entering the sum of one part sample + n parts diluent. For example, entering dilution factor values of 2, 5, and 10 indicate sample to diluent proportions of 1 + 1, 1 + 4, and 1 + 9—that is, twofold, fivefold, and tenfold dilutions.
13. Reporting Results
13.1 Reporting units for NOx and nitrite concentrations are milligrams nitrogen per liter (mg-N/L) in accordance with long standing USGS conventions. A table at the front of this report provides factors necessary to convert these units into several other commonly used concentration units.
13.2 We report concentrations such that the rightmost digit (called the least significant digit) represents the uncer-tainty in the analytical result (Novak, 1985; Hansen, 1991; U.S. Geological Survey, 2002). The least significant digit is determined using guidance outlined by the American Society for Testing and Materials (1999). By internal convention the NWQL reports results to the USGS National Water Information System (NWIS) database to one digit beyond the least signifi-cant digit.
Table 3. National Water Quality Laboratory (NWQL) standard operating procedures for automated continuous-flow analyzer cadmium reduction nitrate + nitrite determination methods referenced in this report.
[+, plus; Lab, laboratory; SOP, standard operating procedure]
Method nameLab
codeNWQL
SOP numberNitrate + nitrite, cadmium reduction, automated
continuous flow1975 ID0163.4
Nitrate + nitrite, cadmium reduction, automated continuous flow, low-level
1979 ID0200.0
Nitrate + nitrite, cadmium reduction, automated continuous flow, acidified
1990 IM0208.2
Nitrate + nitrite, cadmium reduction, automated continuous flow, low-level, acidified
3112 INCW0440.0
Analytical Methods 11
14. Detection Limits, Bias, and Precision
14.1 We estimated method detection limits (MDLs) for standard- and low-level concentration range CFA-CdR and CFA-YNaR1 methods (table 4) with composite, low-concentration environmental samples—FCC bottle types— as promulgated by the EPA in CFR 40 part 136, Appendix B (U.S. Environmental Protection Agency, 1997). Between 2003 and 2006 when we acquired data for this report, the laboratory reporting level (LRL) indicated in some figures was operationally defined by NWQL convention as the MDL multiplied by 2.
14.2 Table 5 lists the mean and standard deviation of third-party check samples 092 L, 092 M, and 092 H that we included with each run of environmental water samples
during CFA method validation work between August 2003 and August 2004. We calculated control limits in table 5 using the USGS Branch of Quality Systems regression equations for median-based (robust) standard deviation (F-pseudosigma, “fσ”) in relation to concentration. The Branch of Quality Systems publishes these regression equations yearly on the basis of its blind sample program data on its USGS-visible intranet site (http://bqs.usgs.gov/ibsp/regress.shtml, accessed October 5, 2012). Inspection of table 5 reveals that NOx concentration data for CFA-CdR and CFA-YNaR1 reduc-tion methods were tightly centered around most probable values (MPV) and well within control limits. Figure 4 shows a control chart of third-party check concentrations obtained by low-level CFA-CdR and CFA-YNaR1 reduction methods during August and September 2004 validation experiments. Inspection of figure 4 indicates both CdR and YNaR1 method results were tightly clustered and within control limits. Typi-cally, concentrations obtained by both reduction methods were slightly below the nominal concentration at which we prepared the third-party check samples.
Figure 5 shows a plot of percent relative standard devia-tions of replicate NOx concentrations in relation to CFA-CdR NOx concentrations that we determined in surface water (fig. 5A) and groundwater (fig. 5B) by standard-level CdR and YNaR1 reduction methods during CFA validation work between August 2003 and August 2004. Typically, concen-trations replicated to within 25 percent near the MDL and approached about 5 percent at concentrations greater than five times the MDL.
Figure 6 shows a plot of percent relative standard devia-tions of duplicate NOx concentrations in relation to CdR NOx concentrations that we determined in surface water and groundwater by low-level methods during CFA validation work between August and September 2004.. Relative standard deviations were 4 and 5 percent for duplicate analyses of 29 surface-water samples by CdR and YNaR1 methods, respec-tively, and 7 and 9 percent for duplicate analyses of seven groundwater samples, respectively.
Table 4. Data and calculations used to estimate method detection limits for nitrate + nitrite determination by automated CFA methods using packed bed CdR and soluble YNaR1 nitrate reductase methods.
[+, plus; CFA, continuous-flow analysis; CdR, cadmium reduction; YNaR1, recombinant nitrate reductase from Pichia angusta; mg-NO3
–-N + NO2–-N/L,
milligram(s) nitrate-nitrogen plus nitrite nitrogen per liter]
Target concentration [standard-(low-)
level]
Concentration found (mg-NO3
–-N + NO2
–-N/L)CdR
(standard- level)
YNaR1 (standard-
level)
CdR (low- level)
YNaR1 (low- level)
0.05 (0.020) 0.0544 0.0284 0.0180 0.02000.05 (0.020) 0.0537 0.0283 0.0176 0.01870.05 (0.020) 0.0525 0.0265 0.0173 0.01820.05 (0.020) 0.0528 0.0350 0.0177 0.01840.05 (0.020) 0.0519 0.0250 0.0177 0.01870.05 (0.020) 0.0537 0.0319 0.0177 0.01770.05 (0.020) 0.0520 0.0234 0.0170 0.01180.05 (0.020) 0.0522 0.0265 0.0174 0.0179
Mean 0.0529 0.0281 0.0176 0.0038Standard deviation 0.0009 0.004 0.0003 0.0007Number of values 8 8 8 8Degrees of freedom 7 7 7 7t-value (1-sided, 99%) 2.998 2.998 2.998 2.998Method detection limit 0.003 0.01 0.0009 0.002
Table 5. Third-party check sample nitrate + nitrite data summary for automated CFA-CdR and soluble CFA-YNaR1 reduction methods collected during validation experiments between August 2003 and August 2004.
[+, plus; CFA, continuous-flow analysis; CdR, cadmium reduction; YNaR1, recombinant nitrate reductase from Pichia angusta; NO3– + NO2
– (mg-N/L), milligram(s) nitrate nitrogen plus nitrite nitrogen per liter; ID, identification; SD, standard deviation]
CdR NO3– + NO2
– (mg-N/L) YNaR1 NO3– + NO2
–– (mg-N/L)Reference sample ID 092 L 092 M 092 H 092 L 092 M 092 HMost probable value 0.20 2.00 4.00 0.20 2.00 4.00Upper control limit 0.22 2.17 4.33 0.22 2.17 4.33Lower control limit 0.18 1.83 3.67 0.18 1.83 3.67Mean concentration 0.19 2.00 4.07 0.19 2.00 4.02SD 0.01 0.05 0.07 0.01 0.05 0.11Relative SD (percent) 3.53 2.26 1.61 3.67 2.69 2.63Number of points 63 62 65 63 62 63

12 Colorimetric Assays of Nitrate in Water—Replacing Cadmium with Nitrate Reductase Enzymes
Characterization of Nontoxic Nitrate Reductase Enzymes and Analytical Performance
Background Information
As our preliminary work demonstrating the feasibility of replacing packed bed CdRs with soluble NADH:NaR puri-fied from corn seedlings (NaR1) for routine automated nitrate determinations in water (Patton and others, 2002) drew to a close, NECi was finishing development work on a new, bispe-cific nitrate reductase (YNaR1) manufactured by recombinant expression of the NaR gene from Pichia angusta, EC 1.7.1.2 (Barbier and others, 2004) in a Pichia pastoris system. NECi reported that YNaR1 was more robust and less costly to produce than NaR1. With partial funding from a Phase II U.S. Department of Agriculture small business innovation research (SBIR) grant—USDA SBIR # 2002-33610-12300, Environmentally benign automated nitrate analysis—NECi and the NWQL partnered through a formal, 2-year technical assistance agreement to characterize and validate YNaR1 as a soluble, nontoxic replacement reagent for granular, copperized cadmium in routine colorimetric nitrate determinations.
Our initial experiments with YNaR1 indicated that its analytical performance was similar to that of NaR1. And because YNaR1 costs less than NaR1, we doubled (and later tripled) its concentration in reagent formulations to reduce times necessary for quantitative reduction of nitrate to nitrite.
Figure 4. Control chart for low-level (LL) continuous flow analysis cadmium reduction (CdR) and nitrate reductase (YNaR1) reduction methods used during National Water Quality Laboratory validation experiments conducted between August 23, 2004 and September 30, 2004 (UCL, upper control limit; LCL, lower control limit).
We also reasoned that increased YNaR1 concentrations would provide a hedge against low nitrate recoveries in unusual matrices—urban runoff effluents, for example—that might contain abnormally high and uncharacterized concentrations of NaR inhibitors. We also found that the useful lifetime of working YNaR1 reagent was considerably longer than the 8 h at 4 °C that we measured previously for working NaR1 reagent.
We established this by preparing four batches of working YNaR1 reagent (same procedures as described for NaR in sec-tions 6.1.3 and 6.1.4)—two containing 25 volume percent of glycerol, a widely recognized stabilizer of enzymes and other complex proteins in aqueous solution (Bradbury and Jakoby, 1972)—and on the day of their preparation and for several days thereafter, we assessed their ability to reduce 5 mg-N/L nitrate calibrants to nitrite in the standard-level, CFA-YNaR1 nitrate assay quantitatively. We stored all four batches of these working YNaR1 reagents in a refrigerator between uses, but allowed two batches—one containing glycerol, the other not—to equilibrate to room temperature for about 2 h before each use. We maintained the temperature of the other two batches below 10 °C in a water-ice bath during each use. Figure 7 pro-vides graphical summaries of working YNaR1 reagent storage stability. Inspection of this figure reveals that working YNaR1 reagents maintained below 10 °C performed comparably to freshly prepared reagent for 12 days. During this interval, glycerol had negligible effect on the stability of working YNaR1 reagents, but activity of the glycerol-containing batch that was maintained below 10 °C declined less rapidly than the other three batches after 12 days. For the two batches of working YNaR1 reagent allowed to warm to ambient tempera-ture for several hours during each trial, the stabilizing effect of glycerol was noticeable even during the initial five days of the experiment.
As previously noted, the mixed YNaR1/NADH reagent (prepared using the same procedure described for NaR/NADH in section 6.1.7) has a useful lifetime of only about an hour. This is because YNaR1 promotes oxidation of its NADH cofactor to NAD+ even in the absence of nitrate. Figure 8 provides a graphical summary of experimental data that docu-ments this phenomenon. To obtain data plotted in this figure, we prepared mixed YNaR1-NADH reagent (section 6.1.7) and after 10 min and at regular intervals thereafter, we used it to dose a DI water blank, a 5 mg-N/L nitrate calibrant, and a surface-water sample. Inspection of figure 8 reveals that the reagent blank remained constant for the 3-h dura-tion of the experiment. Apparent nitrate concentrations in the calibrant and surface-water sample dosed 1 h or more after mixed YNaR1-NADH reagent preparation, however, began to decrease exponentially about 1 h after its preparation. To demonstrate that this observed decrease in nitrate concentra-tion was not caused by YNaR1 denaturation, we added 1 mg of NADH to the remaining 30 mL of mixed YNaR1-NADH reagent about 5 min before using it to dose another blank, calibrant, and sample triad at the 3-hr mark. With reference again to figure 8, the apparent nitrate concentrations in this
LL CdRLL YNaR1
Nominal concentrationUCLLCL
EXPLANATION
0.225
0.220
0.215
0.210
0.205
0.200
0.195
0.190
0.185
0.180
0.175
8/21/2004
8/26/2004
8/31/2004
9/5/2004
9/10/2004
9/15/2004
9/20/2004
9/25/2004
9/30/2004
10/5/2004
Nitr
ate
+ ni
trite
con
cent
ratio
n,in
mill
igra
ms
nitr
ogen
per
lite
r

Characterization of Nontoxic Nitrate Reductase Enzymes and Analytical Performance 13
Figure 5. Relative standard deviation (RSD) of same-bottle duplicate, triplicate, and quintuplicate nitrate + nitrite concentrations determined by standard-level continuous flow analyzer (CFA) cadmium reduction (CdR) and CFA-nitrate reductase (NaR) reduction methods.
100
75
50
25
0
–250.01 0.1 1 10 100
100
75
50
25
0
Diff
eren
ce a
mon
g re
plic
ates
, per
cent
RSD
–250.01 0.1 1 10 100
Groundwater CdR nitrate + nitrite concentration,in milligrams nitrogen per liter
Surface water CdR nitrate + nitrite concentration,in milligrams nitrogen per liter
Diff
eren
ce a
mon
g re
plic
ates
, per
cent
RSD
EXPLANATION
CdR duplicates, n = 95CdR triplicates, n = 11CdR quintuplicates, n = 29NaR duplicates, n = 95NaR triplicates, n = 11NaR quintuplicates, n = 29
National Water Quality Laboratory reporting limit
Method detection limitDilution limit
EXPLANATION
CdR duplicates, n = 256CdR triplicates, n = 37CdR quintuplicates, n = 41NaR duplicates, n = 256NaR triplicates, n = 37NaR quintuplicates, n = 41
National Water Quality Laboratory reporting limit
Method detection limitDilution limit
A
B

14 Colorimetric Assays of Nitrate in Water—Replacing Cadmium with Nitrate Reductase Enzymes
triad closely approximated those dosed within the first hour after mixed reagent preparation. We did not investigate the rate of NaR-induced NADH reduction at 10- or 100-fold lower YNaR1 concentrations, but such experiments would be use-ful to determine the feasibility of exchanging longer reaction times for greater enzyme economy.
With these preliminary experiments establishing the general analytical interchangeability of NaR1 and YNaR1 completed, we began using standard-level CFA-CdR (NWQL laboratory code 1975) and CFA-YNaR1 reduction methods to acquire paired, NOx concentration data from a seasonally, geographically, and compositionally diverse subset of surface-water and groundwater samples received at the NWQL for nutrient analyses between June 2003 and July 2004. In addi-tion, we took advantage of the large sample load in August and September 2004 to acquire paired data for low-level NOx con-centrations with low-level CFA-CdR (NWQL laboratory code 1979) and CFA-YNaR1 reduction CFA methods. Throughout the 2003–2004 validation period, we also refined the batch enzymatic nitrate-reduction method and demonstrated its util-ity for “green chemistry” nitrate assays on a variety of analyti-cal platforms. These include FIA and CFA nitrite analyzers, a discrete analyzer, and a benchtop spectrophotometer, all of which are substantially easier to operate and maintain than fully automated standard- and low-level CFA (I-2531-12 and I-2532-12, respectively) and DA (I-2547-11 and I-2548-11, respectively) methods.
Standard-Level Validation Results
As shown in figure 9, we scheduled the bulk of validation analyses to coincide with nominal periods of high (April–June) and low (August–October) streamflow conditions. Including QC solutions, calibrators, and replicates, we analyzed more than 5,000 samples for nitrite and NOx by CdR- and YNaR1-reduc-tion methods between April 2003 and July 2004. The valida-tion data set consists of 3,318 paired NOx analyses—2,364 surface-water samples and 954 groundwater samples. Monthly sample number totals indicated in figure 9 pertain only to these samples. Inspection of figure 10, showing NOx concentrations determined during the validation period by the two reduc-tion methods as box plots, reveals that median and maximum nitrate concentrations in the groundwater subset are several times greater than those in the surface-water subset. The higher median and maximum nitrate concentrations in the former reflect the fact that many groundwater samples received at the NWQL for analysis are from wells affected by sewage, septage, and agricultural runoff. Mean, median, and maximum values for CFA-CdR and CFA-YNaR1 reduction methods NOx concentra-tions are quite similar for samples collected during both flow regimes (table 6).
Figure 11 shows the scatter of NOx concentrations determined by the standard-level YNaR1-reduction method (y-axis) in relation to those determined by the standard-level CdR-reduction method during the entire validation period from April 2003 to July 2004. Not shown in this graph are
Figure 6. Agreement of between-day duplicate nitrate + nitrite concentrations for samples determined by low-level CFA-CdR and CFA-YNaR1 reduction methods. Percent relative standard deviation (RSD) for each duplicate pair is plotted as a function of mean CdR method concentration. The hash mark indicates 2004 reporting level of 0.016 milligram nitrogen per liter for NWQL low-level CFA-CdR nitrate + nitrite method (lab code 1979). (CFA, continuous flow analyzer; CdR, cadmium reduction; NWQL, National Water Quality Laboratory)
50
40
30
20
10
0
–10Diff
eren
ce b
etw
een
dupl
icat
es, p
erce
nt R
SD
0.00 0.10 0.20 0.30 0.40 0.50 0.60 0.70 0.80 0.90 1.00Nitrate + nitrite concentration,in milligrams nitrogen per liter
EXPLANATIONYNaR1, surface waterYNaR1, groundwaterCdR, surface waterCdR, groundwaterNWQL reporting level
Figure 7. YNaR1 storage stability plots. Between-day storage for all four YNaR1 solutions was at 4 degrees Celsius (°C) ± 2 °C. During each 3-h use period we did not chill two of the test solutions, designated “RT,” but maintained the other two, designated “Ice,” at ≈4–8 °C in a water-ice bath. In these tests we prepared working nicotinamide adenine dinucleotide (NADH) reagent daily from frozen concentrate (see section 6.1.5).
5.0
5 m
illig
ram
s ni
trat
e-ni
trog
en p
er li
ter p
eak
heig
hts,
volts
4.5
4.0
3.5
3.0
2.5
2.0
1.5
1.0
0.5
0.012/1/2003 12/8/2003 12/15/2003 12/22/2003 12/29/2003 1/5/2004
No glycerol, iceGlycerol, iceNo glycerol, RTGlycerol, RT
EXPLANATION

Characterization of Nontoxic Nitrate Reductase Enzymes and Analytical Performance 15
Figure 8. Graphical summary of data from an experiment to assess stability of mixed nicotinamide adenine dinucleotide (NADH) nitrate reductase (YNaR1) reagent solutions used in batch reduction methods. Refer to text for additional details.
00:00 00:45 01:30 02:15 03:00
0.00
1.00
2.00
3.00
4.00
5.00 1 milligram NADH added to 30 milliliters of remaining reagent
Elapsed time, in hours:minutes between reagent preparation and sample addition
App
aren
t nitr
ate
conc
entr
atio
n,in
mill
igra
ms
nitr
ogen
per
lite
r
EXPLANATIONSurface-water sample
5 milligrams nitrate-nitrogen per liter calibrant
Reagent blank
500
255
226
56
118
90
267
552 583
325
0
100
200
300
400
500
600
Num
ber o
f sam
ple
pairs
ana
lyze
d
Jun 2003
Jul 200
3
Aug 2003
Sep20
03
Oct 200
3
Nov 200
3
Jan 2004
Feb 20
04
Mar 20
04
Apr 200
4
May 200
4
Jun 2004
Jul 200
4
NWQL sample login month
273
40 33
WG WS Total
EXPLANATION
Figure 9. National Water Quality Laboratory (NWQL) login dates for groundwater samples—USGS National Water Information System (NWIS) medium code WG—and surface-water samples (NWIS medium code WS) included in the NWQL standard-level continuous flow analysis (CFA) nitrate reductase (YNaR1) nitrate method (CFA-YNaR1) validation study.
137 data pairs with concentrations less than 0.01 mg NOx-N/L that were included in statistical comparisons. Inspection of figure 11 reveals points well distributed about the green, unity-slope line of equal relation. Clearly, however, more points lie below the line of equal relation than above it. Linear regression parameters (see text box in fig. 11) support this qualitative assessment. The correlation between NOx concen-trations determined by CFA-CdR and CFA-YNaR1 reduc-tion methods is highly significant (r2 = 0.9997), the slope is slightly less than 1.00 (0.99), and the y-intercept is slightly negative (–0.02), which suggest negative bias (YNaR1 method NOx concentration < CdR NOx method concentration) in the YNaR1-reduction method of perhaps 0.03–0.05 mg-N/L. The NWQL long-term method detection level for standard-level NOx concentrations (laboratory code 1975) was 0.06 mg-N/L during the August 2003 to August 2004 period during which we acquired these data. In the context of the NWQL reporting level, bias of this magnitude is of marginal analytical signifi-cance. The substantially lower MDLs that we determined with CFA instruments used exclusively to obtain validation data reported here (see table 4), however, suggest that this slight negative bias is real.
In table 7 the data plotted in figure 11 are categorized according to agreement between CFA NOx concentrations determined by the CdR- and YNaR1-reduction methods with
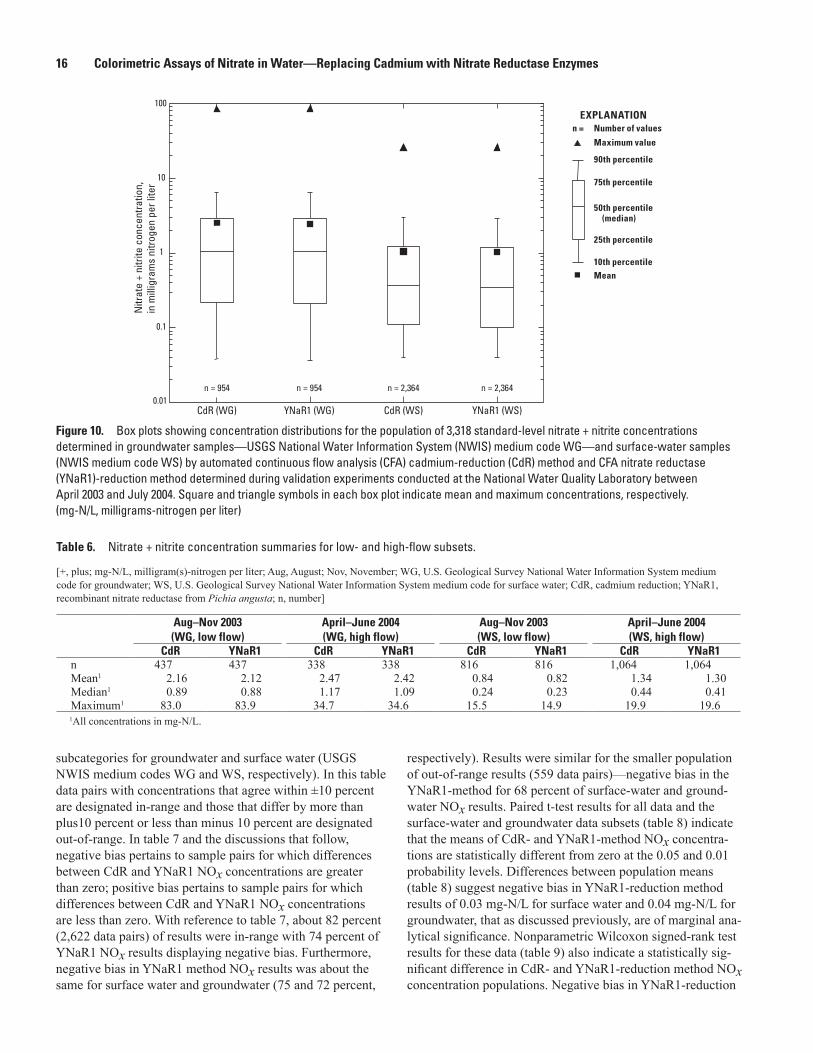
16 Colorimetric Assays of Nitrate in Water—Replacing Cadmium with Nitrate Reductase Enzymes
Table 6. Nitrate + nitrite concentration summaries for low- and high-flow subsets.
[+, plus; mg-N/L, milligram(s)-nitrogen per liter; Aug, August; Nov, November; WG, U.S. Geological Survey National Water Information System medium code for groundwater; WS, U.S. Geological Survey National Water Information System medium code for surface water; CdR, cadmium reduction; YNaR1, recombinant nitrate reductase from Pichia angusta; n, number]
Aug–Nov 2003 (WG, low flow)
April–June 2004 (WG, high flow)
Aug–Nov 2003 (WS, low flow)
April–June 2004 (WS, high flow)
CdR YNaR1 CdR YNaR1 CdR YNaR1 CdR YNaR1n 437 437 338 338 816 816 1,064 1,064Mean1 2.16 2.12 2.47 2.42 0.84 0.82 1.34 1.30Median1 0.89 0.88 1.17 1.09 0.24 0.23 0.44 0.41Maximum1 83.0 83.9 34.7 34.6 15.5 14.9 19.9 19.61All concentrations in mg-N/L.
Figure 10. Box plots showing concentration distributions for the population of 3,318 standard-level nitrate + nitrite concentrations determined in groundwater samples—USGS National Water Information System (NWIS) medium code WG—and surface-water samples (NWIS medium code WS) by automated continuous flow analysis (CFA) cadmium-reduction (CdR) method and CFA nitrate reductase (YNaR1)-reduction method determined during validation experiments conducted at the National Water Quality Laboratory between April 2003 and July 2004. Square and triangle symbols in each box plot indicate mean and maximum concentrations, respectively. (mg-N/L, milligrams-nitrogen per liter)
subcategories for groundwater and surface water (USGS NWIS medium codes WG and WS, respectively). In this table data pairs with concentrations that agree within ±10 percent are designated in-range and those that differ by more than plus10 percent or less than minus 10 percent are designated out-of-range. In table 7 and the discussions that follow, negative bias pertains to sample pairs for which differences between CdR and YNaR1 NOx concentrations are greater than zero; positive bias pertains to sample pairs for which differences between CdR and YNaR1 NOx concentrations are less than zero. With reference to table 7, about 82 percent (2,622 data pairs) of results were in-range with 74 percent of YNaR1 NOx results displaying negative bias. Furthermore, negative bias in YNaR1 method NOx results was about the same for surface water and groundwater (75 and 72 percent,
respectively). Results were similar for the smaller population of out-of-range results (559 data pairs)—negative bias in the YNaR1-method for 68 percent of surface-water and ground-water NOx results. Paired t-test results for all data and the surface-water and groundwater data subsets (table 8) indicate that the means of CdR- and YNaR1-method NOx concentra-tions are statistically different from zero at the 0.05 and 0.01 probability levels. Differences between population means (table 8) suggest negative bias in YNaR1-reduction method results of 0.03 mg-N/L for surface water and 0.04 mg-N/L for groundwater, that as discussed previously, are of marginal ana-lytical significance. Nonparametric Wilcoxon signed-rank test results for these data (table 9) also indicate a statistically sig-nificant difference in CdR- and YNaR1-reduction method NOx concentration populations. Negative bias in YNaR1-reduction
CdR (WG) YNaR1 (WG) CdR (WS) YNaR1 (WS)0.01
0.1
1
10
100
n = 2,364 n = 954 n = 954
Nitr
ate
+ ni
trite
con
cent
ratio
n,
in m
illig
ram
s ni
trog
en p
er li
ter
n = 2,364
EXPLANATIONNumber of values
Maximum value
90th percentile
75th percentile
50th percentile (median)
25th percentile
10th percentileMean
n =

Characterization of Nontoxic Nitrate Reductase Enzymes and Analytical Performance 17
Figure 11. Scatter plot of standard-level nitrate + nitrite concentrations determined simultaneously during validation experiments at the National Water Quality Laboratory (NWQL) between August 2003 and August 2004 by automated continuous flow analysis (CFA) cadmium-reduction (CdR) and CFA nitrate reductase (YNaR1)-reduction methods. The complete data set contains 3,318 paired results, but in this plot, 137 of these with CdR- or YNaR1-method nitrate + nitrite concentrations less than 0.01 milligram nitrogen per liter are not shown.
Table 7. Agreement between nitrate + nitrite (NOx) concentrations determined by CFA- CdR and CFA-YNaR1 reduction methods. Groundwater and surface-water samples are denoted by their medium codes WG and WS, respectively.
[In-range results are those for which differences between CFA-CdR and CFA-YNaR1 NOx concentrations are within ±10 percent. Out-of-range results are those for which differences between CFA-CdR and CFA-YNaR1 NOx concentrations are less than minus 10 percent or greater than plus 10 percent. +, plus; NOx, nitrate plus nitrite; CFA, continuous-flow analysis; CdR, cadmium reduction; YNaR1, recombinant nitrate reductase from Pichia angusta; ±, plus or minus; WG, U.S. Geological Survey National Water Information System medium code for groundwater; WS, U.S. Geological Survey National Water Information System medium code for surface water; n/a, not applicable; <, less than; mg-N/L, milligrams-nitrogen per liter; ≥, greater than or equal to; –, minus; ≤, less than or equal to; >, greater than]
CategoryCounts
(percent of category)All WG WS
All samples 3,318 (n/a) 954 (n/a) 2,364 (n/a)YNaR1 nitrate + nitrite concentration < 0.01 mg-N/L 137 (4.1) 58 (6.1) 79 (3.3)YNaR1 nitrate + nitrite concentration ≥ 0.01 mg-N/L 3,181 (95.9) 896 (93.9) 2,285 (96.7)In-range results: –10 percent ≤ CdR – YNaR1 ≤ 10 percent 2,622 (82.4) 795 (88.7) 1,827 (80.0)In-range, negative bias: CdR NOx – YNaR1 NOx > 0 1,947 (74.3) 573 (72.1) 1,374 (75.2)In-range, positive bias: CdR NOx – YNaR1 NOx < 0 675 (25.7) 222 (27.9) 453 (24.8)Out-of-range results: –10 percent > CdR-YNaR1 > 10 percent 559 (17.6) 101 (11.3) 458 (20.0)Out-of-range, negative bias: CdR NOx – YNaR1 NOx > 0 381 (68.2) 69 (68.3) 312 (68.1)Out-of-range, positive bias: CdR NOx – YNaR1 NOx < 0 178 (31.8) 32 (31.7) 146 (31.9)
0.01
0.1
1
10
100
0.01 0.1 1 10 100CdR nitrate + nitrite concentration,
in milligrams nitrogen per liter
YNaR
1 ni
trate
+ n
itrite
con
cent
ratio
n,in
mill
igra
ms
nitro
gen
per l
iter
Linear regressiony = 0.993x – 0.020
r2 = 0.9997
EXPLANATIONWS and WG: n = 3,207Line of equal relationMethod detection limitNWQL reporting levelDilution limit

18 Colorimetric Assays of Nitrate in Water—Replacing Cadmium with Nitrate Reductase Enzymes
Table 9. Wilcoxon signed-rank test1 results for nitrate + nitrite concentrations (mg-N/L) determined in filtered-water samples by granular copperized CFA-CdR and soluble CFA-YNaR1 nitrate-reductase reduction methods.
[+, plus; mg-N/L, milligram-nitrogen per liter; CFA, continuous-flow analysis; CdR, cadmium reduction; YNaR1, recombinant nitrate reductase from Pichia angusta; n, number of samples; MC, medium code; WG, U.S. Geological Survey National Water Information System medium code for groundwater; WS, U.S. Geological Survey National Water Information System medium code for surface water; WCA, whole-water chilled acidified sample bottle type; FCA, filtered, chilled, acidified sample bottle type]
Standard-level samples (n) Methods’ results populations different?1
CdR-YNaR1 Positive ranks Negative ranks pcalc p0.05 p0.01
All 860 2,458 <0.0001 yes yesMC WG 259 695 <0.0001 yes yesMC WS 701 1,763 <0.0001 yes yes
Low-level samplesAll 129 850 <0.0001 yes yesMC WG 97 121 0.1193 no noMC WS 32 729 <0.0001 yes yes
Acidified samplesWCA and FCA 93 89 0.8240 no noWCA2 60 76 0.1984 no noFCA 33 13 0.0051 yes yes
1The paired-sample, Wilcoxon signed-rank test is a nonparametric alternative to the paired-sample t-test. It can be used to examine whether or not two paired sample populations have the same distribution. Unlike the paired-sample t-test, this function does not require either test population to be normally distributed (Pollard, 1979).
2Filtered at the U.S. Geological Survey National Water Quality Laboratory prior to analysis.
Low-level FCC n
Nitrate + nitrite concentration (mg-N/L)Significant1
Mean DifferenceStandard deviation
CdR YNaR1 CdR – YNaR1 CdR YNaR1 pcalc p0.05 p0.01
All 979 0.38 0.34 0.04 0.38 0.36 0.0000 yes yesMedium code WG 218 0.36 0.35 0.01 0.30 0.30 0.0154 yes noMedium code WS 761 0.38 0.34 0.04 0.39 0.38 0.0000 yes yes
Acidified samples n
Nitrate + nitrite concentration (mg-N/L)Significant1
Mean DifferenceStandard deviation
CdR YNaR1 CdR – YNaR1 CdR YNaR1 pcalc p0.05 p0.01
All 182 0.711 0.713 –0.002 1.1190 1.194 0.24541 no noWCA2 136 0.780 0.779 0.001 1.274 1.273 0.54060 no noFCA 46 0.509 0.518 –0.009 0.880 0.903 0.03492 yes no1pcalc is the probability that population means of nitrate + nitrite concentrations determined by the CdR- and YNaR1-reduction methods are the same—that
is, difference between the population means is statistically equivalent to zero—on the basis of calculated paired t-tests (Pollard, 1979). Difference between population means is significant at the 95 percent confidence level (p0.05) when pcalc is less than 0.05 and at the 99 percent confidence level (p0.01) when pcalc is less than 0.01.
2Filtered at the U.S. Geological Survey National Water Quality Laboratory prior to analysis.
Table 8. Two-population paired t-test results for nitrate + nitrite concentrations determined in filtered-water samples by CFA-CdR and CFA-YNaR1 nitrate reduction methods.
[+, plus; CFA, continuous-flow analysis; CdR, cadmium reduction; YNaR1, recombinant nitrate reductase from Pichia angusta; mg-N/L, milligram(s)-nitrogen per liter; FCC, filtered, chilled (bottle type for samples); n, number of samples; WG, U.S. Geological Survey National Water Information System medium code for groundwater; WS, U.S. Geological Survey National Water Information System medium code for surface water; WCA, whole water, chilled, acidified sample bottle type; FCA, filtered, chilled, acidified sample bottle type]
Standard FCC n
Nitrate + nitrite concentration (mg-N/L)Significant1
Mean DifferenceStandard deviation
CdR YNaR1 CdR – YNaR1 CdR YNaR1 pcalc p0.05 p0.01
All 3,318 1.56 1.53 0.03 3.38 3.36 0.0000 yes yesMedium code WG 954 2.66 2.62 0.04 5.32 5.31 0.0000 yes yesMedium code WS 2,364 1.11 1.08 0.03 1.99 1.94 0.0000 yes yes

Characterization of Nontoxic Nitrate Reductase Enzymes and Analytical Performance 19
method NOx 25th, 50th, and 75th concentration percentiles, however, is seldom—and then only marginally so—analyti-cally significant (table 10).
Figure 12 provides graphical summaries of in-range (fig. 12A) and out-of-range (fig. 12B) data plotted as the percent difference between CdR- and YNaR1-reduction NOx results in relation to CdR-method NOx results. As shown in this figure, percent differences between NOx concentra-tions determined by CdR and YNaR1 methods were within 25 percent for the majority of high (381 points) and low (178 points) out-of-range data (fig. 12B). Not surprisingly, bias for NOx concentrations determined by the CdR and YNaR1 methods is about as likely to be positive as negative near and below the CdR MDL (green vertical lines in both figs. 12A and 12B). In the absence of supporting data, we spec-ulate that the substantial number of positively biased YNaR1-reduction method NOx results for in-range groundwater samples (fig. 12A) might have contained reduced metals or sulfides that are common constituents in low-oxygen ground-water matrices. Such constituents, which are well-known interferences in CdR methods (Gal and others, 2004), are better tolerated by NaR methods. Also evident in figure 12A is tighter clustering of surface-water and groundwater data pairs around the zero-percent-difference line for in-range NOx concentrations greater than the dilution limit (indicated by
Table 10. Summary statistics for nitrate + nitrite concentrations determined in filtered-water samples by CFA-CdR and soluble CFA-YNaR1 nitrate-reductase-reduction methods.
[+, plus; mg-N/L, milligram(s)-nitrogen per liter; CFA, continuous-flow analysis; CdR, cadmium reduction; YNaR1, recombinant nitrate reductase from Pichia angusta; n, number of samples; MC, USGS sample medium code; WG, U.S. Geological Survey National Water Information System medium code for groundwater; WS, U.S. Geological Survey National Water Information System medium code for surface water; WCA, whole-water chilled acidified sample bottle type; FCA, filtered, chilled, acidified sample bottle type; NWQL, National Water Quality Laboratory]
n Nitrate + nitrite (mg-N/L)Minimum 25th percentile Median 75th percentile Maximum
All CdR 3,318 –0.019 0.124 0.483 1.739 82.95All YNaR1 3,318 –0.031 0.117 0.469 1.719 83.92MC WG CdR 954 –0.019 0.216 1.055 2.924 82.95MC WG YNaR1 954 –0.031 0.210 1.045 2.868 83.92MC WS CdR 2,364 –0.006 0.110 0.362 1.210 25.35MC WS YNaR1 2,364 –0.030 0.102 0.346 1.177 25.39
Low-level CFA CdR and YNaR1 nitrate methodsAll CdR 979 –0.001 0.108 0.261 0.577 3.97All YNaR1 979 –0.003 0.089 0.210 0.520 3.88MC WG CdR 218 –0.000 0.084 0.295 0.580 1.158MC WG YNaR1 218 –0.003 0.089 0.286 0.576 1.146MC WS CdR 761 –0.001 0.111 0.258 0.575 3.97MC WS YNaR1 761 –0.001 0.088 0.205 0.500 3.88
Acidified standard-level CFA CdR and YNaR1 nitrate methodsAll CdR 182 0.008 0.027 0.232 0.891 8.58All YNaR1 182 0.000 0.027 0.237 0.894 8.64WCA1 CdR 136 0.008 0.034 0.262 0.986 8.58WCA1 YNaR1 136 0.003 0.039 0.266 0.9896 8.648FCA CdR 46 0.008 0.011 0.115 0.469 3.36FCA YNaR1 46 0.000 0.013 0.083 0.484 3.49
1Filtered at the NWQL prior to analysis
red vertical lines in figure 12; refer to section 10). Dilution of these samples, with concomitant dilution of any interfer-ing substances in the sample matrices, might account for this observation.
Figure 13 shows the scatter of NOx concentrations determined by the low-level YNaR1-reduction method (y-axis) in relation to those determined by the low-level CdR-reduction method (laboratory code 1979) during August and September 2004. Not shown in this graph are 28 data pairs with YNaR1-method NOx concentrations less than 0.001 mg-N/L that were included in two-population paired t-test and Wilcoxon signed-rank test statistical analyses. Inspection of figure 13 reveals that most points for groundwater samples are tightly clustered and well distributed around the green unity-slope line of equal relation. In contrast, most points for surface-water samples have greater variance and lie below the line of equal relation. Linear regression parameters (fig. 13, text box) support this qualitative assessment. Correlations between nitrate concen-trations determined by CFA-CdR and CFA-YNaR1 reduction methods in surface water and groundwater are highly significant for both (r2 ≈ 0.98). In context of the NWQL 2004 reporting level for low-level CFA-CdR NOx (0.02 mg-N/L), bias between the two methods was negligible for groundwater samples, but significantly negative—CFA-YNaR1 < CFA-CdR—for surface-water samples.
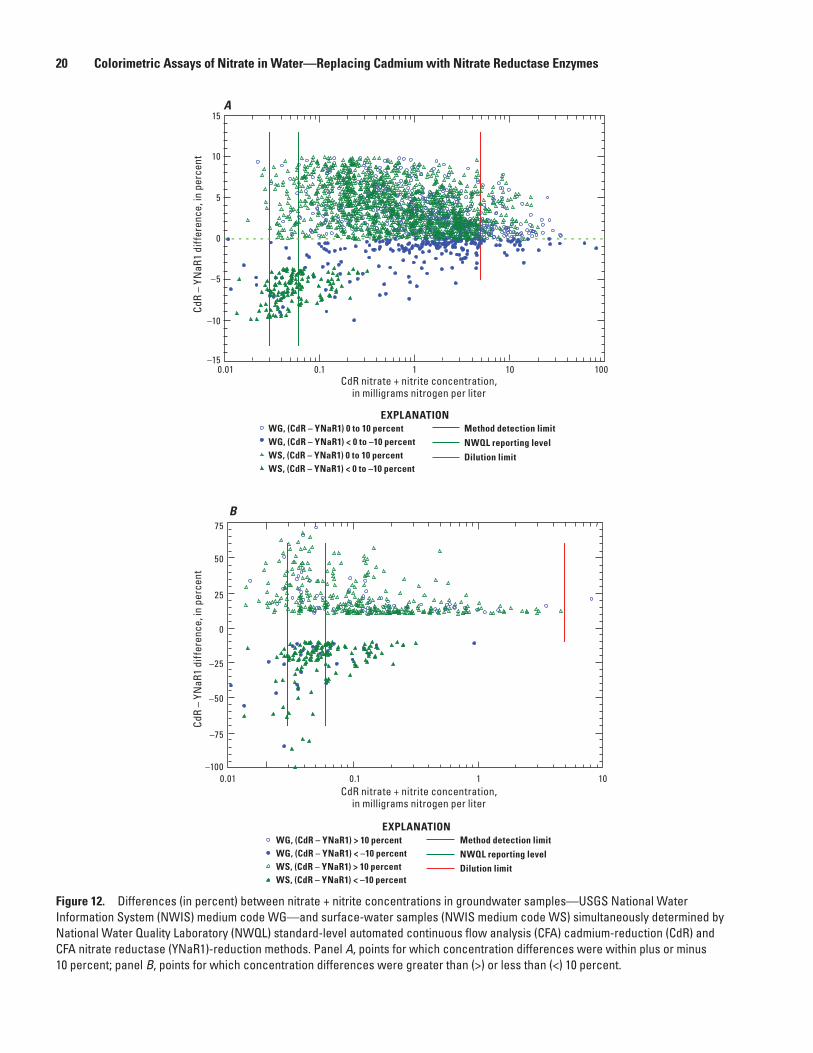
20 Colorimetric Assays of Nitrate in Water—Replacing Cadmium with Nitrate Reductase Enzymes
Figure 12. Differences (in percent) between nitrate + nitrite concentrations in groundwater samples—USGS National Water Information System (NWIS) medium code WG—and surface-water samples (NWIS medium code WS) simultaneously determined by National Water Quality Laboratory (NWQL) standard-level automated continuous flow analysis (CFA) cadmium-reduction (CdR) and CFA nitrate reductase (YNaR1)-reduction methods. Panel A, points for which concentration differences were within plus or minus 10 percent; panel B, points for which concentration differences were greater than (>) or less than (<) 10 percent.
CdR nitrate + nitrite concentration,in milligrams nitrogen per liter
0.01
75
50
25
0
–25
–50
–75
–100
CdR
– YN
aR1
diff
eren
ce, i
n pe
rcen
t
1010.1
B
CdR nitrate + nitrite concentration,in milligrams nitrogen per liter
0.01
15
10
5
0
–5
–10
–15
CdR
– YN
aR1
diff
eren
ce, i
n pe
rcen
t
10 10010.1
A
EXPLANATIONWG, (CdR – YNaR1) > 10 percent
WS, (CdR – YNaR1) > 10 percentWG, (CdR – YNaR1) < –10 percent
WS, (CdR – YNaR1) < –10 percent
Method detection limitNWQL reporting levelDilution limit
EXPLANATIONWG, (CdR – YNaR1) 0 to 10 percent
WS, (CdR – YNaR1) 0 to 10 percentWG, (CdR – YNaR1) < 0 to –10 percent
WS, (CdR – YNaR1) < 0 to –10 percent
Method detection limit
NWQL reporting level
Dilution limit

Characterization of Nontoxic Nitrate Reductase Enzymes and Analytical Performance 21
Figure 13. Scatter plot of nitrate + nitrite concentrations in groundwater samples—red circles, USGS National Water Information System (NWIS) medium code WG, n = number of values—and surface-water samples (blue triangles, NWIS medium code WS) simultaneously determined by low-level automated continuous flow analysis (CFA) cadmium-reduction (CdR) and CFA nitrate reductase (YNaR1)-reduction methods. Data plotted in this figure were obtained in August and September 2004 during validation experiments at the National Water Quality Laboratory (NWQL). The complete data set contained 967 paired results, but in this figure values for nine groundwater samples and 19 surface-water samples with YNaR1-method nitrate + nitrite concentrations less than 0.001 milligram nitrogen per liter are not shown.
Table 8 and box plots (fig. 14) provide summary sta-tistics and graphics for low-level method data sets, which confirm negligible bias in groundwater NOx concentrations determined by CdR and YNaR1 methods. For surface water, however, table 8 and figure 14 reveal small, but analytically significant, negative bias for NOx concentrations determined by the YNaR1 method. Referring again to figure 13, we find it particularly noteworthy that differences between surface water NOx concentrations for CdR- and YNaR1-reduction methods diminish substantially at concentrations greater than 1.00 mg-N/L—the dilution limit, indicated by a red vertical line in this figure. From this observation, we infer that dilution (1 + 4, typically) substantially mitigated the effects of puta-tive (and only later identified) YNaR1 inhibitors in these 32 surface-water samples.
Paired t-test results for all data and the surface-water data subset (table 8) indicate that the means of low-level CdR- and YNaR1-method nitrate concentrations are statistically dif-ferent from zero at the 0.05 and 0.01 probability levels. And in relation to the 0.02 mg-N/L NWQL low-level CdR MDL, observed negative bias (YNaR1 < CdR) of about 0.04 mg-N/L difference between means is analytically significant. Paired
t-test results for the groundwater subset indicate that the means are statistically different from zero at the 0.05 prob-ability level, but not at 0.01 probability level. The less than 0.01 mg-N/L population mean negative bias for groundwater samples is analytically negligible and about the same for the 25th, 50th, and 75th concentration percentiles (table 10). In contrast negative bias for YNaR1 method NOx concentrations in surface water increased across these percentiles (table 10). Typically, nonparametric Wilcoxon signed-rank test results for these data (table 9) agree with t-test results. The groundwater subset population differences, however, are statistically insig-nificant at both the 0.05 and 0.01 probability levels.
The NWQL receives few requests for NOx determina-tions in acidified samples (FCA and WCA bottle types). We did determine NOx concentrations in about 200 FCA and WCA samples by CdR- and YNaR1-reduction methods and found that the correspondence between the methods was excellent (fig. 15). Paired t-test and Wilcoxon signed-rank test results for acidified samples (tables 8 and 9) indicate that CdR- and YNaR1-reduction methods are statistically equivalent for acidified samples.
CdR nitrate + nitrite concentration,in milligrams nitrogen per liter
YNaR
1 ni
trat
e +
nitr
ite c
once
ntra
tion,
in m
illig
ram
s ni
trog
en p
er li
ter
0.0010.001
0.01
0.1
1
10
0.01 0.1 1 10
Linear regressiony = 0.985 x – 0.001
r2 = 0.981y = 0.956 x – 0.028
r2 = 0.988
EXPLANATIONWG (n = 218)WS (n = 761)
Method detection limitLine of equal relation
NWQL reporting levelDilution limit

22 Colorimetric Assays of Nitrate in Water—Replacing Cadmium with Nitrate Reductase Enzymes
Figure 14. Box plots showing concentration distributions for the population of 979 low-level nitrate + nitrite concentrations determined in groundwater samples—USGS National Water Information System (NWIS) medium code WG—and surface-water samples (NWIS medium code WS) by automated continuous flow analysis (CFA) cadmium-reduction (CdR) and CFA nitrate reductase (YNaR1)-reduction methods. Data plotted in this figure were obtained during August—September 2004 validation experiments at the National Water Quality Laboratory.
Figure 15. Scatter plot of nitrate + nitrite concentrations simultaneously determined for 182 acidified samples—National Water Quality Laboratory (NWQL) filtered-chilled-acidified (FCA) and whole-water chilled-acidified (WCA) bottle types—by automated continuous flow analysis (CFA) cadmium-reduction (CdR) and CFA nitrate reductase (YNaR1)-reduction methods. FCA samples were filtered at collection sites; WCA samples were filtered at the NWQL prior to nitrate determinations.
5
1
0.1
0.01
0.005
Nitr
ate
+ ni
trite
con
cent
ratio
n, in
mill
igra
ms
nitr
ogen
per
lite
r
CdR (WG) YNaR1 (WG) CdR (WS) YNaR1 (WS)
n = 761
n =761
n = 218
n = 218
EXPLANATION
90th percentile
75 th percentile
50th percentile (median)
25th percentile
10th percentile
Number of valuesMaximum value
Mean
n =
10.00
1.00
0.10
0.01
CdR nitrate + nitrate concentration,in milligrams nitrogen per liter
YNaR
1 ni
trat
e +
nitr
ite c
once
ntra
tion,
in m
illig
ram
s ni
trog
en p
er li
ter
0.01 0.10 1.00 10.00
y = 0.9969x + 0.0004r2 = 0.9997
WCA samples, n = 136FCA samples, n = 46
Linear (WCA and FCA samples, n = 182)
EXPLANATION

Characterization of Nontoxic Nitrate Reductase Enzymes and Analytical Performance 23
We conclude this section with a few graphs from smaller data sets obtained with the YNaR1 batch reduction method (section 4.2). Figure 16 shows the analytical configura-tion of a purpose built flow injection analyzer assembled from modules and components available at the NWQL: an Alpkem, RFA-302 peristaltic pump; a manual, rotary, six-port sample-injection valve (Rheodyne 5020, Rohnert Park, Calif.) equipped with a 30-µL sample loop; a 500-µL mixer/reactor with super serpentine geometry (Global FIA, Fox Island, Wash.); an RFA 305A photometer equipped with a 2-µL flow cell (10 mm × 0.5 mm inside diameter) and 540-nm interference filters (Alpkem Corp., Clackamas, Oreg., out of business). Nominal flow rates of carrier (DI water) and reagent (10 g SAN and 1 g NED in 20 percent phosphoric acid) streams were each 385 µL/min, resulting in a flow rate of about 0.75 mL/min in the analytical stream. We used a 45-s sampling cycle with this system—30-s load time and 15-s inject time for each sample, which equates to an analysis rate of 80 samples/h. The FIA peaks obtained with this system after offline batch reduction of nitrate to nitrite with YNaR1 are shown in figure 17.
Figure 18 pertains to results from the batch YNaR1 nitrate-reduction method, for which we determined resulting nitrite in three additional analytical formats. Figure 18A shows peaks obtained with a simple CFA nitrite analyzer (Patton and others, 2002, fig. 3, p. 733). Here we used 2-mL analyzer cups as reaction vessels for the enzymatic reduction step as described in section 4.2. Peak identities from left to right are as follows: a 5 mg NO3
–-N/L calibrant, 2 reagent blanks, six nitrate calibrants, 2 reagent blanks, 12 environmental water samples, 2 reagent blanks, 12 different environmental water samples, and 2 reagent blanks. We used separate SAN and NED reagents in the CFA nitrite method. The total ana-lytical stream flow rate, including air segments, was about 0.5 mL/min and the analysis rate was 120 samples/h (20-s
sample time; 10-s wash time). We included CFA peaks in figure 18A primarily for comparison with FIA peaks shown in figure 17. Figures 18B and 18C show post-YNaR1 batch reduction nitrite concentrations determined by manual (Cary 50) and a random-access Olympus AU400 DA (Olympus America, Irving, Tex.) spectrophotometry in relation to those determined by USGS standard-level CFA-CdR colorimetric method. Unity slopes would indicate exact agreement between results determined by CFA-CdR and YNaR1 methods. Figure 18D shows calculated slopes that resulted from linear least-squares regression of NOx concen-trations determined in a set of surface-water and groundwater samples by the CFA-CdR method (independent variable) and the offline, batch YNaR1-reduction method (dependent variable). Unity slope (dashed line in fig. 18D) indicates no bias in NOx concentrations determined by CdR- and YNaR1-reduction methods. In the case of the batch YNaR1-reduction method, post-reduction nitrite in samples was determined by CFA about 40 min after addition of mixed YNaR1/NADH reagent and subsequently at intervals of 3, 4.5, 6, 24, and 48 h. Bias was negligible in batch YNaR1-reduction method NOx concentration results when the intervals between enzy-matic and colorimetric reagent additions were 24 h or less (fig. 18D).
Throughout the course of CFA-YNaR1 validation work, we selected samples for which CFA-YNaR1 method nitrate concentrations were less than those of the CFA-CdR method by more than 10 percent and reanalyzed them with the offline, batch YNaR1 method. Figure 19 shows NOx concentrations measured by the automated CFA (red) and batch (blue) YNaR1 methods in relation to those measured by the CFA-CdR reduction method for 124 such “problem” samples received at the NWQL between February 25, 2004, and September 23, 2004. With reference to figure 19, there is a striking difference
Figure 16. Analytical cartridge diagram for a simple, purpose-built, flow-injection (FIA) nitrite analyzer. M = 0.5-millimeter inside diameter, 500-microliter mixer with super serpentine geometry; D = flow-through photometer equipped with a 2-microliter (µL) flow cell and 540-nanometer interference filters; W = waste. The manual, rotary injection valve was equipped with a 30-µL sample loop. Mixed sulfanilamide and N-(1-Naphthyl)ethylenediamine reagent is abbreviated as SAN/NED.
Figure 17. Flow injection analysis (FIA) peaks for batch YNaR1-reduction nitrate determinations. From left to right: one 5-milligram nitrate-nitrogen calibrant, two reagent blanks, seven nitrate calibrants, two reagent blanks, and duplicate injections of 11 surface-water and groundwater samples.
0
1
2
3
4
5
Abs
orba
nce,
volts
0 3 6 9 12 15 18 21 24 27Time,
in minutes
Flow-injection analysis, 30 microliter sample loop80 samples per hour, flow rate = 0.75 milliliter per minute
Pump
Valve
M D
540 nm
WSample
W
Carrier
SAN/NED

24 Colorimetric Assays of Nitrate in Water—Replacing Cadmium with Nitrate Reductase Enzymes
0 1 2 3CFA-CdR nitrate + nitrite concentration,
in milligrams nitrogen per liter
4 5
3 6 9 12 15 18 21 24 27
0.67 3 4.5 6 24 48
1.00
0.75
0.50
0.25
0.00
Slop
e of
regr
essi
on li
ne fo
r nitr
ate
conc
entra
tions
dete
rmin
ed b
y Cd
R- a
nd N
aR-r
educ
tion
met
hods
Time, in minutes
Time elapsed between enzymatic reductionand addition of colorimetric reagents, in hours
0 1 2 3CFA-CdR nitrate + nitrite concentration,
in milligrams nitrogen per liter
4 5
5
4
3
2
1
0
DA n
itrite
con
cent
ratio
n,in
mill
igra
ms
nitro
gen
per l
iter
0
1
2
3
4
5
Abs
orba
nce,
vol
ts
5
4
3
Nitr
ate
+ ni
trite
, in
mill
igra
m n
itrog
en p
er li
ter
by Y
NaR
1 m
anua
l ana
lysi
s
2
1
0
y = 0.979x + 0.0015r2 = 0.999n = 70
Air-segmented continuous flow analysis120 samples per minute,
flow rate 0.5 milliliter per minute
y = 1.001x – 0.058r2 = 0.99959
C D
BA
Figure 18. Graphs demonstrating effectiveness of the semiautomated batch method for reducing to nitrate to nitrite in water samples with soluble nitrate reductase (NaR). Panel A, photometer output (peaks) for nitrite determined in batch reduced (YNaR1) samples by automated air-segmented continuous flow analysis (CFA). Panel B, scatter plot demonstrating comparability of nitrate + nitrite concentrations determined by the automated CFA-cadmium reduction (CdR) method (x) and manual colorimetry (y) following YNaR1 batch reduction in disposable spectrophotometer cuvettes (see fig. 1C). Panel C, scatter plot demonstrating comparability of nitrate + nitrite concentrations determined by the automated CFA-CdR method (x) and nitrite concentrations determined by the automated discrete analyzer (DA) method (y) following YNaR1 batch reduction in disposable analyzer cups (see fig. 1C). Panel D, bar graph demonstrating negligible nitrate + nitrite concentration differences between samples analyzed by the CFA-CdR method and those for corresponding samples analyzed by the CFA nitrite method up to 24 hours after initiation of the semiautomated YNaR1 batch reduction step.

Characterization of Nontoxic Nitrate Reductase Enzymes and Analytical Performance 25
in agreement between nitrate concentrations determined by batch-YNaR1 and CFA-YNaR1 methods in relation to the CdR method. Note particularly that in comparison to those for the CFA-YNaR1 method, points for the batch-YNaR1 method exhibit less scatter around the CdR method regression line and are more evenly distributed above and below it. We initially attributed this improved agreement between batch-YNaR1 and CFA-CdR reduction methods to the longer reaction time of the former (≥ 40 min, typically) compared to about 10 min for the CFA-YNaR1 method.
Metal Ion Effects
Midway through the CFA-YNaR1 method validation work, we began to suspect that the subset of samples for which CdR-method nitrate concentrations were substantially greater than YNaR1-method NOx concentrations might have matri-ces containing substantial metal ion concentrations. Because major ion and trace metal data were unavailable for most samples in this study, we consulted a compilation of the yearly median concentrations in samples received at the NWQL for analyses (J.W. Pritt, written commun., 2001). Using this docu-ment, we selected metals with some of the higher abundances in samples analyzed at the NWQL for interference experi-ments (table 11).
Table 11 provides NWQL median, 10-times median, and 100-times median concentrations for these metals. We prepared 0.25 mg-N/L, 2.5 mg-N/L, and 5.0 mg-N/L nitrate solutions amended with NWQL median, 10-times median, and 100-times median concentrations of these metals (table 11). Typically, we prepared these metal ion solutions (individually or in combination) from chloride or sulfate salts. We diluted the resulting solutions to final volume with DI water and analyzed them in parallel with the three-channel CFA system (calibrated with metal-free nitrate standards) used for valida-tion work. Figure 20 provides graphical summaries of experi-ments with 5.0 mg-N/L nitrate solutions, which were similar to those for lower nitrate concentration solutions. Bar graph y-axes (apparent nitrate concentrations after calibration with metal-free standards) in figure 20 are truncated to enhance visualization of different treatments (x-axes). Metal ion con-centrations indicated in all panels of figure 20 are the mean of two determinations for chromium (III) and manganese (II) solutions and the mean of three determinations for all others.
Top panels in figure 20 pertain to results obtained for the CFA-CdR method that indicate small increases in appar-ent nitrate concentrations at median and 10-times median individual metal ion concentrations and small decreases at 100-times median concentrations. Small amounts of nitrate or nitrite in salts used to prepare stock metal solutions might account for
Figure 19. Linear least squares regression plots of nitrate + nitrite concentrations determined by USGS automated continuous flow analysis (CFA) cadmium reduction (CdR) method (I-2545-90; National Water Quality Laboratory code 1975) (x) in relation to nitrate + nitrite concentrations (y) determined by the automated CFA-YNaR1 reduction method (red triangles) and the semiautomated batch YNaR1 reduction method (blue circles). Nitrite in batch YNaR1 reduction method samples was determined by automated CFA, typically within 2–6 hours after addition of mixed YNaR1/nicotinamide adenine dinucleotide (NADH) reagent.
y = 1.0094x + 0.0289r2 = 0.9988
y = 0.9889x + 0.1157r2 = 0.9958
EXPLANATION
Batch YNaR1
CFA YNaR1
Linear (Batch YNaR1)
Linear (CFA YNaR1)
CFA-CdR nitrate + nitrite concentration,in milligrams nitrogen per liter
0.00 1.00 2.00 3.00 4.00 5.00
CFA
-YN
aR1
nitr
ate
+ ni
trite
con
cent
ratio
n,in
mill
igra
ms
nitr
ogen
per
lite
r
5.00
4.00
3.00
2.00
1.00
0.00

26 Colorimetric Assays of Nitrate in Water—Replacing Cadmium with Nitrate Reductase Enzymes
Table 11. Metal ions tested for possible inhibition of YNaR1 enzyme and Griess-reaction interference.
[YNaR1, recombinant nitrate reductase from Pichia angusta; µg/L, microgram per liter; µM, micromoles; Ba, barium; Ca, calcium; Cr, chromium; Fe, iron; L, lithium, Mg, magnesium; Mn, manganese, Sr, strontium]
Metal ion
Median concentration
(µg/L)
Atomic weight
Median concentration
(µM)
10x median concentration
(µM)
100x median concentration
(µM)Ba2+ 4.07 × 101 137.34 2.96 × 10⁻¹ 2.96 × 100 2.96 × 101
Ca2+ 3.64 ×10⁴ 40.08 9.08 × 10² 9.08 × 10³ 9.08 × 10⁴
Cr3+ 2.60 × 10⁻¹ 52.00 5.00 × 10⁻³ 5.00 × 10⁻² 5.00 × 10⁻¹
Fe2+ + Fe3+ 7.93 × 100 55.85 1.42 × 10⁻¹ 1.42 × 100 1.42 × 101
Li+ 7.11 × 100 6.94 1.02 × 100 1.02 × 101 1.02 × 10²
Mg2+ 8.33 × 10³ 24.31 3.43 × 10² 3.43 × 10³ 3.43 × 10⁴
Mn2+ 1.07 × 101 54.94 1.95 × 10⁻¹ 1.95 × 100 1.95 × 101
Sr2+ 2.7 × 10² 87.62 3.04 × 100 3.04 × 101 3.04 × 10²
Figure 20. Effect of various metal ions at times x1, x10, and x100 their median concentrations on nitrate concentration measured by continuous flow analysis (CFA) cadmium-reduction (CdR) and nitrate reductase (YNaR1)-reduction nitrate methods. Ethylenediaminetetraacetic acid is abbreviated EDTA. See table 11 for metal ion concentrations.
5.50
App
aren
t CdR
nitr
ate
conc
entr
atio
n,in
mill
igra
ms
nitr
ogen
per
lite
r 5.25
5.00
4.75
4.50
4.25
4.00
3.75
3.50
Ba(II)
Ca(II)
Cr(III)
Fe(III)
Fe(II)
Li(I)
Mg(II)
Mn(II)
Sr(II)
Mix
5.50
App
aren
t YN
aR1
nitr
ate
conc
entr
atio
n,in
mill
igra
ms
nitr
ogen
per
lite
r
App
aren
t CdR
nitr
ate
conc
entr
atio
n,in
mill
igra
ms
nitr
ogen
per
lite
rA
ppar
ent Y
NaR
1 ni
trat
e co
ncen
trat
ion,
in m
illig
ram
s ni
trog
en p
er li
ter5.25
5.00
4.75
4.50
4.25
4.00
3.75
3.50
Ba(II)
Ca(II)
Cr(III)
Fe(III)
Fe(II)
Li(I)
Mg(II)
Mn(II)
Sr(II)
Mix
5.50
5.25
5.00
4.75
4.50
4.25
4.00
3.75
3.50
Ba(II)
Ca(II)
Cr(III)
Fe(III)
Fe(II)
Li(I)
Mg(II)
Mn(II)
Sr(II)
Mix
5.50
5.75
6.00
5.25
5.00
4.75
4.50
4.25
4.00
3.75
3.50
Ba(II)
Ca(II)
Cr(III)
Fe(III)
Fe(II)
Li(I)
Mg(II)
Mn(II)
Sr(II)
Mix
CdR, trial 1
YNaR1
CdR, trial 2
YNaR1, EDTA added to diluent
EXPLANATIONX1 X10 X100

Characterization of Nontoxic Nitrate Reductase Enzymes and Analytical Performance 27
We also investigated kinetics effects of these ions on the Griess nitrite indicator reaction in the absence of NaR/NADH reagents using a Cary 50 spectrophotometer equipped with a thermostatted reaction cell/cuvette (section 5). For these experi-ments, we prepared 0.40 mg NO2
–-N/L solutions amended with NWQL-median concentrations of the metal ions listed in table 11. We dispensed 1.8 mL of each metal-amended nitrite solution into the thermostatted cuvette. When the temperature stabilized at 25 °C, we dispensed 600 µL of SAN reagent, waited 60 s, then added 600 µL of NED reagent, and initiated data collection at 540 nm on the Cary 50 spectrophotometer at 10 hertz (Hz). Of ions tested, only magnesium, calcium, and barium reduced the Griess reaction chromophore equilibrium concentration substantially. At the NWQL-median concentra-tion, calcium ions suppressed the indicator reaction the most although barium ions appear to be the most potent indica-tor reaction suppressor on the basis of molar concentration. Graphical summaries of these results are provided elsewhere (Patton and Kryskalla, 2011; fig. 1). In these experiments, it seems unlikely that counter ions in metal stock solutions influenced results because chloride ions contributed by the sulfanilamide reagent (≈ 0.74 M hydrochloric acid) dominate the reaction medium.
In the course of these indicator reaction interference experiments, we also used the same experimental configura-tion to investigate the effect of reaction temperature on metal-free nitrite solutions. As in previous experiments, the nitrite concentration was 0.40 mg-N/L, sample and reagent volumes were unchanged, but the data acquisition rate was reduced to 0.33 Hz. Results of these experiments indicated an inverse rela-tion between reaction temperature and reaction rate in the range of 10 °C to 50 °C (Patton and Kryskalla, 2011; fig. 2). Above 30 °C, the equilibrium concentration of the indicator reac-tion chromophore decreased as temperature increased. These results are consistent with the instability of Griess reaction intermediates—nitrosonium (NO+) and diazonium (R–N≡N+) ions—above about 5 °C (Noller, 1966). Graphical summaries of these results are provided elsewhere (Patton and Kryskalla, 2011; fig. 2). Griess reaction sensitivity increased by about 30 percent when SAN and NED reagents were added separately (SAN added first) and the reaction temperature was maintained at 4 °C, a finding consistent with work reported by others (Guevara and others, 1998; Miranda and others, 2001).
As we were completing CFA-YNaR1 NOx assay valida-tion experiments, our related project to evaluate automated DAs as replacements for CFA nutrient analyzers at the NWQL was well underway. From the outset of this project, it was clear that CdR-based nitrate assays were cumbersome on DA platforms and that a soluble-reagent nitrate assay would be essential for complete integration of DAs into routine production operations of the NWQL Nutrients Unit. Because of the excellent perfor-mance of the YNaR1 batch reduction procedure in conjunction with a simple DA nitrite assay (fig. 18C), we were optimistic that transferring the CFA-YNaR1 method to a DA platform would be straightforward and require little additional work. We were therefore puzzled and somewhat dismayed by poor correspondence between CFA-CdR and DA-YNaR1 nitrate
these results at median and 10-times median individual metal ion concentrations. Decreases in apparent nitrate concentrations observed at 100-times median metal concentrations might be explained by chloride and sulfate counter ions in the metal stock solutions that were particularly high for calcium (II) and magne-sium (II)—Cl– ≈ 6,400 mg/L and SO4
2– ≈ 3,400 mg/L, respec-tively—in the 100x median runs. Chloride and sulfate ions reduce the rate of nitrate reduction by cadmium (Nydahl, 1976; Gal and others, 2004). These effects were less pronounced in second trial runs, perhaps caused by small differences in cad-mium reactor activity between trials 1 and 2. In any case, appar-ent nitrate concentration changes in both CFA-CdR method trials were no more than about 5 percent at the 5 mg-N/L level.
Bottom panels in figure 20 pertain to results obtained for the CFA-YNaR1 method that indicate similar trends in apparent nitrate concentrations at median, 10-times median, and 100-times individual metal ion concentrations. As we conjectured with respect to the CFA-CdR method, it seems likely that high concentrations of chloride and sulfate counter ions contributed to decreases in apparent nitrate concentra-tions observed for the CFA-YNaR1 method in 100-times median metal ion concentration runs. Results for a second trial of this experiment (not shown) were similar. Because the 100-times median concentration of alkaline earth metal ions lowered apparent nitrate concentrations determined by the YNaR1 method considerably, we repeated the experiment after replacing the DI water diluent on the CFA-YNaR1 analytical cartridge with 25 mM EDTA solution. Results of this experi-ment are shown in the bottom right panel. In this run, calcium and magnesium at 100-times median concentrations enhanced nitrate concentration by about 15 and 10 percent, respectively. Note the scale change in relation to the other three panels.
We performed many additional experiments attempting to confirm the hypothesis that high concentrations of Group II metal ions, particularly calcium, in environmental water samples were the primary cause of differences greater than 10 percent in nitrate concentrations determined by the CdR and YNaR1 methods. Our goal was to establish a concentra-tion of EDTA in the CFA-YNaR1 method reagent system that would consistently minimize the effect of this putative inter-ference. We were unable to confirm this hypothesis, however, as summarized in the excerpt from Kryskalla’s notebook entry of April 21, 2004, that follows. Annotations (by Patton) to this notebook entry appear in brackets in the excerpt that follows.
From recent studies of samples with known high CdR-NaR [nitrate concentration] differences and cal-cium spiked [nitrate] standards…it appears that high concentrations of EDTA in the [YNaR1 method] diluent stream do not help. The plots on pages 163–167 [of this notebook] are from gradient EDTA studies that lead us to believe that lower EDTA concentrations, specifically from 1.5 to 2.5 mM, are the best option for calcium interference, and that [calcium interference does not account] for samples with high CdR-NaR differences… .

28 Colorimetric Assays of Nitrate in Water—Replacing Cadmium with Nitrate Reductase Enzymes
concentrations during initial trials. This unanticipated result led us to consider the possibility that improved agreement between CFA-CdR method nitrate concentrations and those determined by the batch YNaR1 method for the subset of “problem” samples (see fig. 19 and associated text) was due not to lon-ger enzymatic reduction reaction times as we had originally hypothesized, but to the lower reaction temperature at which the batch method enzymatic reduction occurred—ambient (≈ 23 °C) compared to ≈ 27 °C and 37 °C for the CFA- and DA-platform methods, respectively. Concurrently, we also began to suspect that dissolved organic matter might inhibit YNaR1 activity because many “problem” samples were pale to dark yel-low. We therefore began a series of experiments to elucidate the effects of temperature and dissolved organic matter concentra-tion on YNaR1 reactivity. Most of this work occurred between December 2004 and March 2005.
Effects of Temperature and Dissolved Organic Matter on YNaR1 Activity
We consulted Jerry Leenheer, a USGS expert in dissolved organic matter in water, who suggested that reference USGS Suwannee River humic acid (HA) isolate (Weishaar and others, 2003) at a concentration equivalent to about 20 mg/L, as dissolved organic carbon (DOC), would be a good surrogate for assessment of HA effects on NaR activity. In experiments reported here, we prepared stock and working HA solu-tions with the assumption that all three air-dried HA isolates contained 50 percent DOC by weight. We prepared stock HA solutions with nominal 300 mg/L DOC concentrations by dissolving 6 mg of air-dried HA isolates in 10 mL of DI water. Leenheer provided the Suwannee River HA isolate (SR HA) used for all experiments with HA described in this report.
In these experiments we used the large format auto- sampler, thermostatted reaction cell, and CFA colorimetric nitrite analyzer as previously described (section 5, fig. 2 and related text) to monitor the reduction rate of nitrate to nitrite by YNaR1 in relation to temperature in the range of 5–40 °C. Sam-ple and reagent volume ratios of enzymatic and colorimetric reactions matched those of previously described CFA and batch YNaR1 reduction methods. Enzymatic reaction volumes were as follows: 2.460 mL of YNaR1 reagent (pH 7.5), 0.150 mL sample, and 0.540 mL of NADH. Sample and wash times in these experiments were typically 20 s and 10 s, respectively, and therefore enzymatic reaction time between points is 30 s in figures 21 and 22.
Inspection of figure 21 reveals that in the range of 15 °C to 25 °C, initial rates for nitrate reduction and equilibrium nitrite concentrations were comparable after 10-min reaction times. At 30 °C the rate of nitrate reduction decreased, but after about 10 min the equilibrium nitrite concentration approached those obtained at lower reaction temperatures. At 35 °C there was a substantial decrease in the rate of nitrate reduction and at the 10-min reaction time point, the equilibrium nitrite concentration was about 30 percent less than equilibrium nitrite concentrations
obtained at the lower reaction temperatures. At 40 °C YNaR1 activity was greatly diminished. These experiments supported our hypothesis that the 37 °C incubator temperature of the NWQL’s DA was ill-suited for reduction of nitrate to nitrite with YNaR1. Readers should note, however, that initial sample and reagent temperatures dispensed into DA cuvettes are nominally 10 °C and 4 °C, respectively—set points of sample and reagent
Figure 21. Graph showing the rate of nitrate reduction to nitrite by YNaR1 nitrate reductase in relation to reaction temperature in degrees Celsius (ºC) for 5.0 milligrams nitrate-nitrogen per liter (mg NO3
–-N/L) at pH 7.5.
0.0
4.00
3.50
3.00
2.50
2.00
1.50
1.00
0.50
0.00
Peak
hei
ghts
, vol
ts
2.5 5.0 7.5 10.0 12.5 15.0 17.5 20.0YNaR1 reaction time, in minutes
5 mg NO3–-N/L in deionized water matrix
Missing data
15°C20°C25°C
30°C35°C40°C
EXPLANATION
Figure 22. Graph showing the rate of nitrate reduction to nitrite by YNaR1 nitrate reductase in relation to reaction temperature in degrees Celsius (ºC) for 5.0 milligrams nitrate-nitrogen per liter (mg NO3
–-N/L) amended with Suwannee River humic acid at a concentration of 20 milligrams dissolved organic carbon per liter (mg DOC/L).
0.0 2.5 5.0 7.5 10.0 12.5 15.0 17.5 20.0YNaR1 reaction time, in minutes
4.00
3.50
3.00
2.50
2.00
1.50
1.00
0.50
0.00
Peak
hei
ghts
, vol
ts
5 mg NO3–-N/L in deionized water matric
+ 20 mg/L Suwannee River humic acid
15°C20°C25°C
30°C35°C
EXPLANATION

Characterization of Nontoxic Nitrate Reductase Enzymes and Analytical Performance 29
In a discussion following these experiments, Leenheer predicted that low-phenolic-content HAs would be less potent NaR inhibitors. To test this hypothesis, he provided us with a HA sample isolated from Big Soda Lake near Fallon, Nev. This HA was chiefly a product of algal decomposition and therefore had little phenolic content. Robert Wershaw, another USGS dissolved organic matter expert, subsequently provided us with humic material that Leenheer had isolated from black-water pools near a stockpile of wheat straw that had been decomposing for several years at a location in southeastern Kansas (Wershaw and others, 2003). According to Wershaw and Leenheer, this HA had extraordinarily high lignin content so that despite aromatic character similar to SR HA, many of its phenolic oxygens were methylated. Therefore, this might produce an inhibitory effect on YNaR1 that was intermediate to those of Suwannee River and Big Soda Lake HAs. Figure 24 provides a graphical summary of experiments to assess the effect of these three HAs on YNaR1 activity in relation to tem-perature. Inspection of figure 24 substantiates the hypothesis that as phenolic content of HAs increases, YNaR1 inhibition increases. As in previous experiments, HA inhibition was neg-ligible at or below 20 °C and increased as reaction temperature increased above 20 °C.
carousels (Patton and Kryskalla, 2011, fig. 3 and associated text). The Aquakem 600 DA operation manual states that about 300 s are required for dispensed volumes—100 µL to 200 µL, typically—to reach thermal equilibrium with the incubator. The enzymatic reaction temperature, therefore, is not constant initially and is likely less than 30 °C during the first one-third of the programmed 10-min reaction interval. This temperature lag is consistent with the better yields of nitrite for many samples on the DA platform than would be predicted from experimen-tal results summarized in figures 21 and 22 in which sample and YNaR1 reagent were equilibrated at specific temperatures before the enzymatic reduction reaction was initiated by addi-tion of NADH cofactor reagent.
Figure 22 shows results obtained when we repeated the experiment described above using a 5 mg-N/L nitrate solution amended with SR HA at a concentration of 20 mg/L. Inspection of figure 22 reveals that SR HA had little effect on the reduction rate of nitrate to nitrite by YNaR1 at 15 °C and 20 °C reaction temperatures. At 25 °C and 35 °C reaction temperatures, how-ever, SR HA acted as an increasingly potent YNaR1 inhibitor.
These findings support the hypothesis that lower reaction temperature rather than longer reaction time might account for better agreement of NOx results determined by batch YNaR1 methods than for those determined by the CFA-YNaR1 method in relation to reference CFA-CdR method results. These findings also support the hypothesis that the subset of samples for which CFA-CdR and CFA-YNaR1 nitrate concentration differences were greater than 10 percent might have contained substantial concentrations of HA. We repeated these experiments at nitrate concentrations of 2.5 mg-N/L and 0.5 mg-N/L, obtained similar results, and therefore concluded that YNaR1 inhibition by SR HA is independent of nitrate concentration. The observation that rates of YNaR1 nitrate reduction are faster at 10 °C and 15 °C than at higher tem-peratures even in the absence of SR HA was unexpected and contrary to published values for optimum reaction temperature of 30 °C (Campbell and others, 2004).
Next we prepared 10 SR HA solutions in the concentra-tion range of 0 to 20 mg/L and spiked at three different nitrate concentrations—a blank plus 0.5, 2.5, and 5 mg-N/L—and determined nitrate in these solutions by the CFA-CdR, CFA-YNaR1, batch YNaR1 reduction methods. Figure 23 shows results for the experiments in which we spiked SR HA solu-tions with nitrate at a concentration of 5.0 mg-N/L. A six-point calibration preceded each experiment. Calibrants did not contain HA. Therefore, changes in instrument response (CFA peak heights for all three methods) reflect the effect of HA on measured nitrate concentrations.
Inspection of figure 23 reveals that SR HA caused only minor changes in nitrate peak heights for the YNaR1 batch reduction and CFA-CdR methods, but caused a pro-nounced decrease in apparent nitrate concentration mea-sured by the CFA-YNaR1 method that was proportional to SR HA concentration.
Figure 23. Effect of Suwannee River humic acid concentration on nitrate reduction—spiked at 5.0 milligrams nitrate-nitrogen per liter (mg NO3
–-N/L) in reagent water matrix—by continuous flow analysis (CFA) cadmium-reduction (CdR), CFA-nitrate reductase (YNaR1)-reduction, and semiautomated batch-YNaR1-reduction methods. Temperatures of CFA-CdR and batch-YNaR1 methods were not regulated; ambient laboratory temperature was ≈23 degrees Celsius (°C). CFA-YNaR1 method was regulated at 27 °C ± 1 °C. Enzymatic reaction times for CFA-YNaR1 and batch-YNaR1 methods were about 10 min and 1 h, respectively. Plotted points are the average response of three replicate determinations and error bars indicate ± 1 standard deviation.
Suwannee River humic acid concentration as dissolved organic carbon,
in milligrams per liter
0.0 2.5 5.0 7.5 10.0 12.5 15.0 17.5 20.0
Post
-red
uctio
n ni
trite
pea
k he
ight
s, v
olts
5.50
5.25
5.00
4.75
4.50
4.25
4.00
3.75
3.50
EXPLANATIONCFA CdR; ≈23 °C CFA YNaR1; ≈27 °C Batch YNaR1; ≈23 °C

30 Colorimetric Assays of Nitrate in Water—Replacing Cadmium with Nitrate Reductase Enzymes
Results of these experiments demonstrate the relation between the phenolic content of a humic substance and its potency as a YNaR1 inhibitor and provide additional support for our hypothesis that the sample subset with substantial differences between NOx concentrations determined by CFA-CdR and CFA-YNaR1 methods likely contained HAs. To test this hypothesis further, we selected two surface-water samples whose CdR nitrate concentrations were both about 0.8 mg-N/L. For one, the difference between CdR and YNaR1 nitrate concentrations was about 0.01 mg-N/L; for the other it was about 0.1 mg-N/L. Figures 25A and 25B provide graphical summaries of results obtained for YNaR1 reaction rate experiments performed on these samples in the temperature range of 10–30 °C.
The correspondence between reaction rates for the surface-water sample with negligible difference between CFA-CdR and CFA-YNaR1 NOx concentrations (fig. 25A) and a nitrate standard in a humic-acid-free matrix (fig. 21) is striking, as is the correspondence between reaction rates for the surface-water sample with a substantial difference between CdR and YNaR1 NOx concentrations (fig. 25B) and a nitrate standard amended with 20 mg/L SR HA (fig. 22). Note particularly that at 10 °C and 15 °C, reaction rates for these two samples are nearly iden-tical, but they begin to differ markedly at reaction temperatures of 20 °C or higher.
In another set of experiments performed with the thermo-statted CFA kinetics platform (section 5), we investigated the reversibility of YNaR1 inhibition by HA in relation to tem-perature. In these experiments we incubated nitrate solutions containing 20 mg/L SR HA with YNaR1 reagent for 5 min at temperatures ranging from 25–35 °C. We then lowered the
solution temperature to 5 °C, 10 °C, 15 °C, or 20 °C and held it constant for times ranging from 5–30 min. At the end of each subambient incubation period, we added NADH reagent to initiate enzymatic reduction of nitrate to nitrite at each subam-bient temperature. Figure 26 provides a graphical summary of results for pre- and post-incubation temperatures of 30 °C and 10 °C, respectively. Results presented in figure 26 are represen-tative of those obtained with other incubation/reaction tempera-ture combinations above and below ambient temperature. In each case the substantial loss of YNaR1 activity after 5 min of contact with SR HA at solution temperatures of 25 °C or higher
Figure 24. Peak heights for 5.0 milligrams nitrate-nitrogen per liter (mg NO3
–-N/L) solutions spiked with three humic acids (HA) at a concentration of 20 milligrams per liter (mg/L) as dissolved organic carbon (DOC). Phenolic content of the HAs increased in the order deionized water < Big Soda Lake < high lignin (wheat straw) < Suwannee River in relation to nitrate reductase (YNaR1) reaction temperature in degrees Celsius (ºC). 0.0 3.0 6.0 9.0 12.0 15.0 18.0
0.0 3.0 6.0 9.0 12.0 15.0 18.0
0.80
0.75
0.70
0.65
0.60
0.55
0.50
0.45
0.40
0.80
0.75
0.70
0.65
0.60
0.55
0.50
0.45
0.40
Peak
hei
ghts
, vol
tsPe
ak h
eigh
ts, v
olts
NWQL Sample ID 20042360157CdR nitrate concentration = 0.827 mg-N/L
CdR minus YNaR1 concentration = 0.008 mg-N/LYNaR1 nitrate concentration = 0.819 mg-N/L
NWQL Sample ID 2004190233CdR nitrate concentration = 0.812 mg-N/L
CdR minus YNaR1 concentration = 0.113 mg-N/LYNaR1 nitrate concentration = 0.699 mg-N/L
A
B
YNaR1 reaction time, in minutes
EXPLANATIONYNaR1 reaction temperature
10 °C15 °C20 °C
25 °C30 °C
Figure 25. Reaction rate plots for surface-water samples, each with nitrate concentrations of ≈ 0.8 milligram nitrate-nitrogen per liter (mg NO3
–-N/L) by the continuous flow analysis, cadmium-reduction (CdR) method at reaction temperatures from 10 degrees Celsius (ºC) to 30 ºC. In panel A the difference between nitrate concentrations determined by CdR and YNaR1 methods (CdR minus YNaR1 in the figure panels) is less than 0.01 mg NO3
–-N/L. In panel B the difference between nitrate concentrations determined by CdR and YNaR1 methods is greater than 0.1 mg NO3
–-N/L. In this figure, abbreviations for National Water Quality Laboratory and identifier are NWQL and ID, respectively.
5.0 10.0 15.0 20.0 25.0 30.0 35.0
YNaR1 reaction temperature (°C)
4.00
Nitr
ate
redu
ced
by Y
NaR
1 pe
ak h
eigh
ts, v
olts
3.50
3.00
2.50
2.00
1.50
1.00
Nitrate concentration = 5 mg NO3–-N/L
Humic acid (HA) concentration = 20 mg/L, as DOCYNaR1 reaction time = 9 minutes
EXPLANATIONDeionized water, no HABig Soda Lake HAHigh lignin (wheat straw) HASuwannee River HA

Characterization of Nontoxic Nitrate Reductase Enzymes and Analytical Performance 31
was negligibly mitigated by subambient incubation periods up to 30 min. It appears, therefore, that at temperatures greater than about 20 °C, SR HA irreversibly inhibits YNaR1 activity pos-sibly by binding to its reactive centers, by deforming its reactive conformation, or both.
We also investigated the effect of pH on YNaR1 kinet-ics in the presence and absence of SR HA. Here we varied the concentration of potassium hydroxide in standard KH2PO4 phosphate buffer (pH 7.5, section 6.1.2) to produce three additional buffers with pH values of 6.5, 7.0, and 8.0—all about ± 0.2 pH units by narrow-range pH test strips. Figure 27 provides a graphical summary of results from these experi-ments, all run at 25 °C. In the absence of SR HA (fig. 27, top panel), measured reduction rates of nitrate to nitrite by YNaR1 in relation to pH were: 6.5 ≈ 7.0 > 7.5 > 8.0. Note that across this pH range, more than a 95-percent reduction of nitrate to nitrite occurred within 10 min. As expected in the presence of 20 mg/L SR HA at 25 °C (fig. 27, bottom panel), the maxi-mum reduction of nitrate to nitrite by YNaR1 was only about 80 percent. Reduction rates of nitrate to nitrite by YNaR1 in relation to pH were: 6.5 > 7.0 ≈ 7.5 > 8.0.
One interpretation of these results is that SR HA inhibi-tion of YNaR1 is somehow mitigated at neutral or slightly acidic pH, perhaps due to alteration of HA conformation or solubility under these conditions. The fact that CdR and YNaR1 reduction method NOx concentrations were statisti-cally equivalent at the 95-percent confidence level for the small population of acidified samples (n = 182) in this study (fig. 15, table 8) also suggests possible linkage between pH and the potency of HAs as YNaR1 inhibitors. Additional investigation of these effects was beyond the scope of this study, but we have included these limited data because they might provide insight to others in future method-development efforts.
–2 0 2 4 6 8 10 12 14 16 18 20Time, in minutes
4.0
Peak
hei
ghts
, vol
ts
3.6
3.2
2.8
2.4
2.0
1.6
1.2
0.8
4.0
Peak
hei
ghts
, vol
ts
3.6
3.2
2.8
2.4
2.0
1.6
1.2
0.8
Reduction at 25 °C, no DOC in sample
Reduction at 25 °C, 20 mg/L DOC in sample
EXPLANATIONpH = 6.5pH = 7.0pH = 7.5pH = 8.0
Figure 27. Plots showing effect of reaction pH on nitrate reductase (YNaR1) reduction rates for solutions containing 5.0 milligrams nitrate-nitrogen per liter (mg NO3
–-N/L) at 25 degrees Celsius (°C). Top panel: Suwannee River humic acid-free matrix. Bottom panel: Matric contains 20 milligrams per liter (mg/L) Suwannee River humic acid as dissolved organic carbon (DOC).
0.0 1.5 3.0 4.5 6.0 7.5 9.0
YNaR1 reaction time, in minutes10.5 12.0 13.5 15.0
4.00
Peak
hei
ghts
for 5
mg
NO
3– –
N/L
nitr
ate,
vol
ts
3.50
3.00
2.50
2.00
1.50
1.00
0.50
0.00
No SR HA, 10 °C, no incubationNo SR HA, incubate at 30 °C, immediate start at 10 °CSR HA, incubate at 30 °C, immediate start at 10 °CSR HA, incubate at 30 °C, 5 min at 10 °CSR HA, incubate at 30 °C, 10 min at 10 °CSR HA, incubate at 30 °C, 15 min at 10 °CSR HA, incubate at 30 °C, 30 min at 10 °C
EXPLANATION
Figure 26. Plots showing effects of Suwannee River humic acid (SR HA) on nitrate reductase (YNaR1) activity in relation to reaction temperature. Upper points: kinetics of YNaR1 reduction of 5.0 milligrams nitrate-nitrogen per liter (mg NO3
–-N/L) to nitrite—HA SR-free matrix, at 10 degrees Celsius (°C), green symbols; 20 milligrams per liter (mg/L) HA SR as dissolved organic carbon (DOC) matrix, 5-minute pre-incubation at 30 °C followed by reaction at 10 °C, red symbols. Lower points: kinetics of YNaR1 reduction of nitrate to nitrite for solutions containing 5.0 mg NO3
–-N/L and 20 mg/L SR HA-DOC after incubation at 30 °C for 5 minutes followed by subambient incubation at 10 °C for 5-, 10-, 15-, and 30-minute periods before initiation of the YNaR1 reduction reaction by addition of nicotinamide adenine dinucleotide (NADH) reagent.
32 Colorimetric Assays of Nitrate in Water—Replacing Cadmium with Nitrate Reductase Enzymes
Nitrate Reductase from Arabidopsis thaliana
Identifying HAs as the probable primary YNaR1 inhibitor in surface-water and groundwater samples was a major break-through in this research as was the discovery that their inhibitory affects are negligible at or below reaction temperatures of about 20 °C. Applying these findings to the development of robust and easily implemented analytical procedures, however, presented us with a new set of challenges. We considered and briefly inves-tigated equipping the analytical cartridge for the CFA-YNaR1 method with a chilled reaction coil. This proved cumbersome, however, because the rapidity with which HAs irreversibly inhibit YNaR1 at temperatures above 20 °C made it necessary also to chill sample, diluent, buffer, and enzyme streams before they merged and mixed in transit to the chilled reaction coil. Because our primary objective had shifted to development of a soluble NaR nitrate assay for DA platforms, we expended little additional effort on CFA method development.
Although the incubator compartment and dispensing alley temperatures of DAs used at the NWQL (37 °C) were unsuitable for nitrate reduction by YNaR1, sample and reagent compartment temperatures—10 °C and 4 °C, respectively—offered potential locations where the enzymatic nitrate reduction step could take place below the 20 °C HA interference threshold prior to initiation of colorimetric nitrite assays in heated zones of the DA (Patton and Kryskalla, 2011, fig. 3 and related text). Taking advantage of these DA platform features, however, would have required modifications to its operating system soft-ware, dispensing hardware, or both, and after a year of unfruit-ful discussion with the vendor about making such modifica-tions, we abandoned this approach. We bypassed this apparent impasse, however, thanks to the unique properties of a different NaR product that NECi sent us for evaluation in autumn, 2005. NECi manufactures this enzyme, which they designate AtNaR2 (EC 1.7.1.1), by recombinant expression of the NaR gene from Arabidopsis thaliana—a widely distributed terrestrial plant commonly known as mouseear cress—in a Pichia pastoris system (Skipper and others, 2001; Campbell and others, 2006). In the sections that follow, we present descriptions and results of preliminary experiments with AtNaR2 that predicted its suit-ability as an analytical reagent of choice for routine analysis of NOx in environmental water samples on DA platforms.
Effects of Temperature and Dissolved Organic Matter on AtNaR2 Activity
One of the first things we noticed about freeze-dried AtNaR2 was its color, which was discernibly more red than the beige-orange shades of freeze-dried YNaR1 and NaR1 purified from Zea mays that we had used previously (Patton and others, 2002). Our initial characterization of AtNaR2 as an analyti-cal reagent began with a replication of experiments we had performed earlier to elucidate the effects of reaction temperature and SR HA concentration on the activity of YNaR1. As before, we used the large-format sampler, thermostatted reaction cell,
and CFA colorimetric nitrite analyzer for these experiments (section 5). Within the limits of experimental error, the only procedural difference between these and previous experiments detailed under section “Effects of Temperature and Dissolved Organic Matter on YNaR1 Activity,” was substituting 3 U of AtNaR2 for 3 U of YNaR1 per 20 mL pH 7.5 phosphate assay buffer used previously (section 6.1.3, note 1).
Results from these experiments indicated that AtNaR2 activity was high—sufficient for quantitative reduction of 5 mg NO3
–-N/L to 5 mg NO2–-N/L in less than 10 min—and
constant at reaction temperatures ranging from 10–37 °C even in the presence of 20 mg/L SR HA. When repeat experiments produced similar results, we shared our findings with NECi and requested another sample of AtNaR2 to use in a third set of confirmatory experiments. At about the same time, we began to evaluate other commercially available NaRs to assess their susceptibility to SR HA inhibition in relation to reaction temperature. In this round of experiments, we tested a new sample of AtNaR2, a different lot of YNaR1, NaR1 puri-fied from corn seedlings (all three obtained from NECi), and NADPH-specific NaR from Aspergillus sp. (Sigma-Aldrich Corp., St. Louis, Mo., product number N 7265).
Details of these kinetics experiments and a graphi-cal summary of results are published elsewhere (Patton and Kryskalla, 2011, fig. 6 and related text). For nitrate solutions containing 20 mg/L SR HA, apparent activity of AtNaR2 was little affected at reaction temperatures ranging between 10 °C and 37 °C, but apparent activities for the other three NaRs tested began to decrease precipitously when reaction tempera-tures exceeded 20 °C. As expected from previous experiments, the apparent activities of AtNaR1 and YNaR1 were compa-rable at 10 °C. Furthermore, in the absence of SR HA at 37 °C, apparent activities of YNaR1 and Aspergillus sp. NaRs were substantially less than that of NaR purified from corn, which approached that of AtNaR2. In summary, at the 37 °C tem-perature typical in the reaction zones of many automated DAs and for nitrate solutions containing SR HA, apparent activities of the four NaRs tested were as follows: AtNaR2 >> NaR1 > NADPH:NaR ≈ YNaR1.
Using the kinetics platform, we also confirmed that sub-stitution of AtNaR2 for YNaR1 did not affect volume ratios of sample, enzyme, and NADH cofactor that we had optimized previously for CFA and batch reduction NOx methods. Details of these experiments and a graphical summary of results are published elsewhere (Patton and Kryskalla, 2011; figs. 7, 8, and related text). As our HA studies neared completion, we tested unused portions of stock SR HA solutions for any changes in their potency as YNaR1 and AtNaR2 inhibitors. As listed in table 12, we used six stock SR HA solutions to spike 5 mg-N/L nitrate solutions at 20 mg/L. These SR HA stock solutions ranged in age from 1 to 203 days and had been stored in screw-cap polypropylene centrifuge tubes at room temperature without protection from ambient fluorescent labo-ratory lighting. Data in table 12 indicate that the age of SR HA solutions had little effect on their ability to inhibit YNaR1 or inability to inhibit AtNaR2.

Conclusions 33
Having verified in multiple experiments over the course of several months that, unlike YNaR1, AtNaR2 remained fully active at 37 °C and was negligibly inhibited by HAs, we began our successful validation of standard- and low-level DA NOx assays using AtNaR2, complete details of which are published elsewhere (Patton and Kryskalla, 2011).
Conclusions1. Comparability between enzymatic- and cadmium-
reduction (CdR) nitrate determination methods. Paired statistical and graphical analyses of nitrate plus nitrite (NOx) concentrations determined in more than 3,800 seasonally, geographically, and compositionally diverse surface-water and groundwater samples indicate generally comparable results obtained from automated, air-segmented continuous-flow analysis (CFA)-CdR and CFA-YNaR1 reduction methods.
a. Standard-level CFA-CdR and CFA-YNaR1 methods
i. Qualitative assessment of method differences—For the population of 3,181 sample pairs with YNaR1 method NOx concentrations greater than or equal to 0.01 milligram-nitrogen per liter (mg-N/L) (table 7), NOx concentrations determined by CFA-CdR and CFA-YNaR1 methods agreed to within ± 10 percent (table 7, “in-range” category) for about 80 percent of surface-water samples and about 89 percent of groundwater samples. Again with reference to table 7, about 74 percent of in-range YNaR1 NOx results were negatively biased—that is, CFA-CdR method NOx concentrations > CFA-YNaR1 method NOx concentrations.
ii. Statistical differences between methods— Two-population, paired t-test and nonparametric Wilcoxon signed-rank test analyses indicate statistically significant differences for CFA-CdR and CFA-YNaR1 method population means and population distributions at the 0.05 and 0.01 probability levels (tables 8 and 9). These statistical test results are consistent with nega-tive bias indicated by qualitative data treatments described in 1.a.i, above. Note, however, that the National Water Quality Laboratory (NWQL)
reporting level is 0.04 mg-N/L for standard level CFA-CdR NOx, which is slightly greater than mean (table 8) and median (table 10) concentra-tion differences for these populations. Conse-quently, negative bias of this magnitude there-fore is of minor analytical significance.
iii. Standard-level method bias—Negative bias in population means and medians is consistent with temperature-dependent YNaR1 inhibition by high-phenolic-content humic acid (HA) matrix constituents.
b. Low-level CFA-CdR and CFA-YNaR1 methodsi. Surface water—For the population of 761 surface-
water sample pairs with YNaR1 method NO con-centrations greater than or equal to 0.001 mg-N/L (fig.13), paired t-tests indicate that differences between population means were significantly dif-ferent from zero at the 0.05 and 0.01 probability levels. Likewise, paired Wilcoxon signed-rank test population distributions were different at the 0.05 and 0.01 probability levels. Differ-ences between population means (0.04 mg-N/L, table 8) and medians (0.05 mg-N/L, table 10) are greater than NWQL low-level CFA-CdR method reporting level (0.01 mg-N/L); therefore, negative bias (CdR results > YNaR1 results) was analytically significant.
ii. Groundwater—For the population of 218 groundwater sample pairs with YNaR1 method NOx concentrations greater than or equal to 0.001 mg-N/L (fig.13), paired t-tests (table 8) indicate that differences between population means were significantly different from zero at the 0.05 probability level, but not at the 0.01 probability level. Paired Wilcoxon signed-rank tests (table 9) indicate that population distribu-tions were the same at the 0.05 and 0.01 prob-ability levels. Lack of bias indicated by these statistical tests is consistent with population mean (table 8) and median (table 10) differ-ences, and the NWQL low-level CdR method reporting level—all of which share values of about 0.01 mg-N/L.
Table 12. Effect of storage time on the potency of Suwannee River humic acid dissolved in deionized water as an inhibitor of YNaR1 and AtNaR2 nitrate reductases. Analyses performed by the automated discrete analyzer method at 37 °C on November 9, 2005.
[YNaR1, recombinant nitrate reductase from Pichia angusta; AtNaR2, recombinant nitrate reductase from Arabidopsis thaliana; °C, degree Celsius; SR HA, Suwanee River high-phenolic-content humic acid; mg-N/L, milligrams-nitrogen per liter]
Stock SR HA preparation date: 04/20/2005 6/21/2005 7/25/2005 9/13/2005 10/6/2005 11/8/2005Days in solution: 203 141 107 57 34 1Nitrate added (mg-N/L): 5.00 5.00 5.00 5.00 5.00 5.00Nitrate found with YNaR1 (mg-N/L): 1.25 1.38 1.20 1.56 1.87 1.05Nitrate found with AtNaR2 (mg-N/L): 5.09 5.12 5.11 5.03 5.01 4.95

34 Colorimetric Assays of Nitrate in Water—Replacing Cadmium with Nitrate Reductase Enzymes
iii. Low-level method bias—Negative bias in population means and medians in surface-water results for the low-level YNaR1 method is con-sistent with temperature-dependent inhibition by HA matrix constituents.
c. Standard-level CFA-CdR and CFA-YNaR1 methods (acidified samples):i. Statistical differences—For the population of
182 NOx concentrations (fig. 15) determined in acidified samples by standard-level CFA-CdR and CFA-YNaR1 methods, paired t-tests (table 8) showed that the difference between population means for WCA samples (table 1) was not significantly different from zero at the 0.05 and 0.01 probability levels. For FCA sam-ples (table 1), the difference between population means was significantly different from zero at the 0.05 probability level, but not at the 0.01 probability level. The difference between popu-lation means (–0.009 mg-N/L, table 8), however, is not analytically significant. Paired Wilcoxon signed-rank tests (table 9) indicate that popula-tion distributions were the same at the 0.05 and 0.01 probability levels for WCA samples, but were different at both probability levels for the FCA sample population. As was the case for t-tests, calculated bias (0.03 mg-N/L, table 10) was less than the reporting level.
ii. Humic acid (HA) effects in acidified samples—Absence of analytically significant bias in these data might indicate that the conformation or solubility of HAs change to less potent YNaR1 inhibitors in acidified sample matrices.
2. Enzymatic and colorimetic indicator reaction interferences. In general, anions (table 2) and cations (table 11, fig. 20) at concentrations up to 100-times their median concentrations in typical freshwater matrices have negligible effect on the activity of YNaR1 nitrate reductase (NaR). Only magnesium, calcium, and barium reduced the Griess nitrite indicator reaction chromophore equilibrium concentration substantially. Calcium ions exert the great-est suppression at NWQL-median concentrations although barium ions were the most potent indicator reaction sup-pressor on the basis of molar concentration. Other factors being equal, the rate and yield of Griess indicator reaction chromophore are inversely proportional to reaction tem-perature in the range of 10 degrees Celsius (°C) to 50 °C.
3. Humic acid interferences. High-phenolic-content HA are potent inhibitors of YNaR1, corn-seedling, and Aspergillus sp. NaRs at reaction temperatures greater than 20 °C. The extent of inhibition for these enzymes is proportional to the phenolic character of the HA and reaction temperature, increasing as temperature and HA concentration increase in the range of 20–37 °C. Inhibition by HA is negligible for these enzymes at reaction tem-peratures less than 20 °C. In contrast, HAs do not inhibit
AtNaR2 at temperatures ranging between 5–37 °C. These unique characteristics make AtNaR2 the reagent of choice for NWQL automated discrete analysis (DA) NOx deter-mination methods (Patton and Kryskalla, 2011) and for other surface-water and groundwater NOx assays that are most easily performed at or above typical ambient laboratory temperatures.
4. Applicability of enzymatic reduction nitrate methods. This report demonstrates that nontoxic, soluble NaR reducing reagents can be substituted for granular copper-ized cadmium in longstanding U.S. Geological Survey (USGS) and U.S. Environmental Protection Agency (EPA) approved methods. It is noteworthy that these new enzymatic reduction methods use the same colorimetic reagents as approved USGS and EPA CdR methods. This report also provides limited statistical and graphical anal-yses of smaller data sets demonstrating the feasibility of coupling the offline batch enzymatic reduction of nitrate to nitrite followed by colorimetic nitrate determinations by a variety of analytical approaches including:• automated CFA and flow-injection analysis (FIA),• DA, or• bench-top or portable photometers and spectro-
photometers.Guidance provided here should facilitate adoption of
green, enzymatic reduction analytical methods for NOx determi-nations in public-, private-, and academic-sector laboratories.
AcknowledgmentsWe are grateful to Christine McEvoy for technical assis-
tance in the summer of 2003. At that time, she was a chemistry major at the College of Wooster in Wooster, Ohio, and her participation in our research was funded through the USGS Summer Student Intern Program. Authors Kryskalla and Patton thank the Nitrate Elimination Company in Lake Linden, Michigan, for partially funding their 2003 and 2004 research at the NWQL through a U.S. Department of Agriculture Phase-II small business innovation research (SBIR) grant (USDA SBIR # 2002-33610-12300, Environmentally benign automated nitrate analysis) and for continuing collaborative support and providing NADH:NaR from Arabidopsis thaliana in 2005 and 2006.
The report also benefited from reviews by Harold Ardourel, Jeff McCoy, Douglas Stevenson, and John Zorgoski at the NWQL, Nancy Simon at the USGS National Research Program in Reston, Va., Carl Zimmermann and Carolyn Keefe at the University of Maryland Chesapeake Biological Laboratory in Solomons, Md., and others at the USGS Office of Water Quality and the NWQL.
We also acknowledge Mary Olson, Colleen Gupta, Eric Schwab, Chris Klimper, and other past and present members of the NWQL Analytical Services Nutrients Unit for their interest and technical support during the development of automated and manual enzymatic reduction nitrate methods described in this report.

References Cited 35
References Cited
American Society for Testing and Materials, 1999, E29-93a, Standard practice for using significant digits in test data to determine conformance to specifications: Annual book of ASTM standards, Reporting test results, Section 7.4, v. 14.02.
American Society for Testing and Materials, 2001, Annual book of ASTM standards, Section 11, Water (D1193, Standard specification for reagent water): West Conshohocken, Pa., v. 11.01, p. 107–109.
Barbier, G.G., Joshi, J.C., Campbell, E.R., and Campbell, W.H., 2004, Purification and biochemical characteriza-tion of simplified eukaryotic nitrate reductase expressed in Pichia pastoris: Protein Expression and Purification, v. 37, p. 61–71.
Bendschneider, Kenneth, and Robinson, R.J. ,1952, A new spectrophotometric method for the determination of nitrite in sea water: Journal of Marine Research, v 11, p. 87–96.
Bradbury, S.L,. and Jakoby, W.B., 1972, Glycerol as an enzy-me-stabilizing agent: Effects on aldehyde dehydrogenase: Proceedings of the National Academy of Science, v. 69, p. 2373–2376.
Bratton, A. Calvin and Marshall, E.K. 1939, A new coupling component for sulfanilamide determination: Journal of Biological Chemistry, v. 128, p. 537–550.
Campbell, W.H., Kinnunen-Skidmore, T., Brodeur-Campbell, M.J., and Campbell, E.R., 2004, New and improved nitrate reductase for enzymatic nitrate analysis: American Labora-tory, v. 22, no. 10, p. 12.
Campbell, Wilbur H., Song, P, Barbier, G.G., 2006, Nitrate reductase for nitrate analysis in water: Environmental Chemistry Letters, v. 4, p. 69–73.
Colman, Benjamin P. and Schimel, Joshua P., 2010a, Under-standing and eliminating iron interference in colorimetric nitrate and nitrite analysis: Environmental Monitoring and Assessment, v. 165, p. 633–641.
Colman, Benjamin P. and Schimel, Joshua P., 2010 b, Erratum to understanding and eliminating iron interference in colo-rimetric nitrate and nitrite analysis: Environmental Monito-ring and Assessment, v. 165, p. 693.
Davison, W., and Woof, C., 1978, Comparison of different forms of cadmium as reducing agents for the batch determi-nation of nitrate: Analyst, v. 103, p. 403–406.
Draper, N.R., and Smith, Harry, 1966, Applied regression analysis: New York, Wiley, 407 p.
Elliot, C.L., Snyder, G.H., and Cisar, J.L., 1989, A modified AutoAnalyzer II method for the determination of NO3
–N in water using a hollow-Cd reduction coil: Communications in Soil Science and Plant Analysis, v. 20, p. 1873–1879.
Fox, J.B., 1979, Kinetics and mechanisms of the Griess reac-tion: Analytical Chemistry, v. 51, p. 1493–1502.
Fox, J.B., 1985, The determination of nitrite—A critical review: CRC Critical Reviews in Analytical Chemistry, v. 15, p. 283–313.
Gal, Carmen, Frenzel, Wolfgang, and Möller, Jürgen, 2004, Re-examination of the cadmium reduction method and optimisation of conditions for the determination of nitrate by flow injection analysis: Microchimica Acta, v. 146, p. 155–164.
Guevara, I., Iwanejko, J., Dembinska-Kiec, A., Pankiewicz, J., Wanat, A., Anna, P., Golabek, I., Bartus, S., Malczews-ka-Malec, M., and Szczudlik, A., 1998, Determination of nitrite/nitrate in human biological material by the simple Griess reaction: Clinica Chimica Acta, v. 274, p. 177–188.
Hansen, W.R., 1991, Suggestions to authors of the reports of the United States Geological Survey (7th ed.): U.S. Govern-ment Printing Office, p. 119–121.
MacKown, C.T. and Weik, J.C., 2004, Comparison of labo-ratory and quick-test methods for forage nitrate: Crop Science, v. 44, p. 218–226.
Miranda, Katrina, Espey, M.M., and Wink, D.A., 2001, A rapid, simple spectrophotometric method for simultaneous detection of nitrate and nitrite—NITRIC OXIDE: Biology and Chemistry, v. 5, no. 1, p. 62–71.
Moody, John A., and Shaw, Frances L., 2006, Reevaluation of the Griess reaction—How much of a problem is interference by nicotinamide nucleotides?: Analytical Biochemistry, v. 356, p. 154–156.
Moorcroft, M.J., Davis, James, and Compton, R.G., 2001, Detection and determination of nitrate and nitrite— A review: Talanta, v. 54, p. 785–803.
Mori, Hisakazu, 2000, Direct determination of nitrate using nitrate reductase in a flow system: Journal of Health Sci-ence, v. 46, no. 5, p. 385–388.
Mori, Hisakazu, 2001, Determination of nitrate in biological fluids using nitrate reductase in a flow system: Journal of Health Science, v. 47, no. 1, p. 65–67.
Noller, Carl R., 1966, Chemistry of organic compounds, (3d ed.): Philadelphia, W.B Saunders Company, p. 542.
Norwitz, George, and Keliher, P.N., 1985, Study of interfer-ences in the spectrophotometric determination of nitrite using composite diazotization-coupling reagents: Analyst, v. 110, p. 689–694.

36 Colorimetric Assays of Nitrate in Water—Replacing Cadmium with Nitrate Reductase Enzymes
Norwitz, George, and Keliher, P.N., 1986, Study of organic interferences in the spectrophotometric determination of nitrite using composite diazotization-coupling reagents: Analyst, v. 111, p. 1033–1037.
Novak, C.E., 1985, Preparation of water-resources data reports: U.S. Geological Survey Open-File Report 85–480, 331 p.
Nydahl, Folke, 1974, On the reduction of oxygen in aqueous solution by electrolytically precipitated cadmium: Talanta, v. 21, p. 1259–1267.
Nydahl, Folke, 1976, On the optimum conditions for the reduction of nitrate to nitrite by cadmium: Talanta, v. 23, p. 349–357.
Pai, Su-Cheng, Yang, Chung-Cheng, and Riley, J.P., 1990, Formation kinetics of the pink azo dye in the determination of nitrite in natural waters: Analytica Chimica Acta, v. 232, p. 345–349.
Patton, C.J., 1983 Design, characterization, and applications of a miniature continuous flow analysis system—Ph.D. Dissertation, Michigan State University [abs.]: Dissertation Abstracts International, v. 44, p. 778-B.
Patton, C.J., Fischer, A.E., Campbell, W.H., and Campbell, E.R., 2002, Corn leaf nitrate reductase—A nontoxic alterna-tive to cadmium for photometric nitrate determinations in water samples by air-segmented continuous-flow analysis: Environmental Science and Technology, v. 36, p. 729–735.
Patton, C.J. and Kryskall, J.R., 2011, Colorimetric determina-tion of of nitrate plus nitrite in water by enzymatic reduc-tion, automated discrete analyzer methods: U.S. Geological Survey Techniques and Methods, book 5, chap. B8, 34 p.
Patton, C.J., and Rogerson, P.F., 2007, Reduction device for nitrate determination: U.S. Patent 7,157,059 B1 [filed September 18, 2002; issued January 2, 2007].
Patton, C.J., and Wade, A.P., 1997, Chapter 4—Continuous flow analyzers, in Ewing, Galen, editor, Analytical instru-mentation handbook (2d ed.): New York, Marcel Dekker, p. 125–220.
Pinto, Paula C.A.G., Lima, Jose J.F.C., and Saraiva, M. Lucia M.F.S., 2005, An enzymatic analysis methodology for the determination of nitrates and nitrites in water: International Journal of Environmental Chemistry, v. 85, no. 1, p. 29–40.
Pollard, J.H., 1979, A handbook of numerical and statistical techniques: New York, Cambridge University Press.
Senn, D.R., and Carr, P.W., 1976, Determination of nitrate at the part per billion level in environmental samples with a continuous-flow immobilized enzyme reactor: Analytical Chemistry, 46, no. 7, p. 954–958.
Skipper, Lawrie, Campbell, W.H., Mertens, J.A., and Lowe D.J., 2001, Pre-steady-state kinetic analysis of recombinant Arabidopsis NADH:nitrate reductase: Journal of Biological Chemistry, v. 276, no. 29, p. 26998–27002.
Stainton, M.P., 1974, Simple, efficient reduction column for use in the automated determination of nitrate in water: Analytical Chemistry, v. 46, p. 1,616.
U.S. Environmental Protection Agency, 1997, Guidelines establishing test procedures for the analysis of pollut-ants (App. B, Part 136, Definition and procedures for the determination of the method detection limit): U.S. Code of Federal Regulations, title 40, revised as of July 1, 1997, p. 265–267.
U.S. Geological Survey 2002, Policy for storing and report-ing significant figures for chemical data: Office of Water Quality Technical Memorandum No. 2002.11, accessed September 6, 2005, at http://water.usgs.gov/admin/memo/QW/qw02.11.html.
Weishaar, James L., Aiken, George R., Bergamaschi, Briana A., Fram, Miranda S., Fujii, Roger, and Mopper, Kenneth, 2003, Evaluation of specific ultraviolet absorbance as an indicator of the chemical composition and reactivity of dis-solved organic carbon: Environmental Science and Technol-ogy, v. 37, p. 4702–4708.
Wershaw, R.L., Rutherford, D.W., Leenheer, J.A., Kennedy, K.R., Cox, L.G., and Koci, D.R., 2003, Biogeochemical processes that produce dissolved organic matter from wheat straw: U.S. Geological Survey Water-Resources Investiga-tions Report 2003–4213, 14 p.
Willis, R.B., 1980, Reduction column for automated determi-nation of nitrate and nitrite in water: Analytical Chemistry, v. 52, p. 1376–1377.
Willis, R.B., and Gentry, C.E., 1987, Automated method for determining nitrate and nitrite in water and soil extracts: Communications in Soil Science and Plant Analysis, v. 18, p. 625–636.
Wood, E.D., Armstrong, F.A.J., and Richards, F.A., 1967, Determination of nitrate in sea water by cadmium-copper reduction to nitrite: Journal of the Marine Biological Asso-ciation of the United Kingdom, v. 47, p. 23–31.
Zhang, J.Z., Fischer, C.J., and Ortner, P.B., 2000, Compari-son of open tubular cadmium reactor and packed cadmium column in automated gas-segmented continuous flow nitrate analysis: International Journal of Environmental Analytical Chemistry, v. 76, p. 99–113.

Manuscript approved for publication on November 1, 2012
USGS Publishing Service Center staff:Mary Kidd, EditorJoy Monson, Layout
For more information about this publication, contact:National Water Quality Laboratory U.S. Geological Survey P.O. Box 25585 Denver Federal Center Denver, CO 80225-0585For additional information, visit http://nwql.usgs.gov

NH2
NH2
NH2
N
N
N
HN
HN
N+
NO2–
H++
SO2NH2
Sulfanilamide(SAN)
SO2NH2
p-Diazoniumsulfanilamide
N-(1-Napthyl)-ethylenediamine
(NED)
SO2NH2
Azo chromophore(λmax = 543 nanometers)
Patton and Kryskalla—Colorim
etric Assays of N
itrate in Water—
Replacing Cadmium
with N
itrate Reductase Enzymes—
Scientific Investigations Report 2013–5033
Reaction for Colorimetric Determination of Nitrate (as Nitrite) in Water
Nitrate
Nitrate ReductaseNADH
Nitrite