Embed Size (px)
Citation preview

This is an Accepted Manuscript, which has been through the Royal Society of Chemistry peer review process and has been accepted for publication.
Accepted Manuscripts are published online shortly after acceptance, before technical editing, formatting and proof reading. Using this free service, authors can make their results available to the community, in citable form, before we publish the edited article. We will replace this Accepted Manuscript with the edited and formatted Advance Article as soon as it is available.
You can find more information about Accepted Manuscripts in the Information for Authors.
Please note that technical editing may introduce minor changes to the text and/or graphics, which may alter content. The journal’s standard Terms & Conditions and the Ethical guidelines still apply. In no event shall the Royal Society of Chemistry be held responsible for any errors or omissions in this Accepted Manuscript or any consequences arising from the use of any information it contains.
Accepted Manuscript
Analytical Methods
www.rsc.org/methods

pH controlled sensitive and selective detection of Cr(III) and Mn(II) by clove (S.
Aromaticum) reduced and stabilized silver nanospheres†
Priyanka Joshia, Manjula Nair
b and Dinesh Kumar
a*
aDepartment of Chemistry, Banasthali University, Rajasthan-304022, India
bAmerican College of Dubai–36778, UAE
Graphical abstract
Abstract
The colorimetric detection of toxic metal ions based on silver nanoparticles (AgNPs) has
received significant attention due to their distance dependent optical properties. Our study
reports a new, green, selective and sensitive colorimetric detection method for Cr(III) and
Mn(II) by clove silver nanospheres (C-SNSs) synthesized at two different pH values 4.5 and
11.5. At pH 4.5, C-SNSs gradually aggregated in the presence of Cr(III) ions and showed a
*Corresponding author: E-mail: [email protected]
†Electronic supplementary information (ESI) available: Size distribution of C-SNSs at pH 4.5
in the absence and presence of Cr(III) ions and size distribution of C-SNSs at pH 11.5 in the
absence and presence of Mn(II) ions. Zeta potential distribution of C-SNSs at pH 4.5 and
11.5 and zeta potential distribution of C-SNSs at pH 4.5 before (a) and after (b) interaction
with Cr(III) ions and zeta potential distribution of C-SNSs at pH 11.5 before (c) and after (d)
interaction with Mn(II) ions.
pH=4.5 pH=11.5 Clove seed
extract
AgNO3
+
Mn(IICr(III)
C-SNSs C-SNSs
Page 1 of 22 Analytical Methods
123456789101112131415161718192021222324252627282930313233343536373839404142434445464748495051525354555657585960
Ana
lytic
alM
etho
dsA
ccep
ted
Man
uscr
ipt

color change from light yellow to colorless. At pH 11.5, they showed rapid aggregation, not
only with a colorimetric change from dark yellow to reddish brown, but also with an
alteration in morphology of spheres to square pyramidal in the presence of Mn(II) ions.
Cr(III) and Mn(II) ions were detected using colorimetry and spectrometry. Under optimized
conditions, our method showed better selectivity for Cr(III) and Mn(II) ions as compared to
other metal ions. The lowest limit of detections (LODs) of C-SNSs was 0.20 µM for both
Cr(III) and Mn(II), which is significantly lower than the Environmental Protection Agency
(EPA) permissible limits of 1.92 µM for Cr(III) and 0.91 µM for Mn(II).
Introduction
People today are more informed about environmental pollution and health hazards.
Environment contamination by heavy metal ions Hg(II), Cd(II), Pb(II), As(III), Mn(II),
Cr(III), Cr(VI) etc has been a major concern worldwide since decades. Heavy metal ions have
received much attention as they are hazardous, both to human beings and the environment1-4
.
Though some heavy metal ions are essential for normal physiological functions of the human
body, at elevated levels they have an adverse effect on human health and environment. For
example, chromium is one of the trace elements in–vivo and usually presents as trivalent
Cr(III) and hexavalent Cr(VI) ions in the environment. Cr(III) has a great impact on the
metabolism of carbohydrates, fats, proteins, nucleic acids, and the formation of hemoglobin
of red cells5. However, at elevated levels Cr(III) (>50-200 mg dl) can bind to DNA thereby
affecting the cellular structures and damaging the cellular components that may even lead to
mutation and cancer6,7. Both the chromium species enter the environment as a result of
effluent discharge from tanning industries, electroplating, cooling water towers, oxidative
dyeing, chemical industries and steel works8. Manganese is essential for humans as its
deficiency affects metabolism of fats and lipids. Lack of adequate Mn also causes skeletal
abnormalities, bone demineralization, ataxia syndrome, and Perth’s disease9,10
. Over
exposure to manganese can cause manganism and learning disabilities in children11,12
. Hence,
there is an urgent need for a highly sensitive and selective method for the detection of
Cr(III)and Mn(II) ions in both environmental and biological samples13,14
. These heavy metal
ions have been detected previously by various methods like electro analytical sensing15,16
,
electrospray ionization mass spectroscopy (EIMS)17,18
, high performance liquid
chromatography (HPLC)19-21
, inductively coupled plasma mass spectroscopy (ICPMS)22-24
and atomic absorption spectrometry (AAS)25-27
. These are reliable techniques for detection;
however, they have limitations with regard to simplicity, selectivity, portability and analysis
Page 2 of 22Analytical Methods
123456789101112131415161718192021222324252627282930313233343536373839404142434445464748495051525354555657585960
Ana
lytic
alM
etho
dsA
ccep
ted
Man
uscr
ipt

time11,28
. To overcome these problems, nanomaterial based sensors have been developed for
detection of Cr(III) and Mn(II). In this order, unaltered SNSs have been used as the
fluorescence probe for the detection of nanomolar chromium29
. Glutathione stabilized
fluorescent gold nanoclusters have been employed for sensing of Cr(III) and Cr(VI)30
.
Fluorescence quenching immune chromatographic nanosensor has been used for the detection
of the chromium ion31
. Surface changed or unchanged plasmonic nanoparticles have emerged
as useful nanosensors for the selective sensing of Cr(III)and Mn(II)32-37
. Although these
methods are highly selective and sensitive, but they are energy and capital intensive, employ
toxic chemicals, nonpolar solvents and synthetic additives or capping agents, which limits
their applications38
. Detection of metal toxicants in effluents is the main objective of the
sensor. But, if the sensors themselves are toxic in nature, it does not serve the purpose. This
has made researchers turn toward “green” chemistry and bioprocesses39,40
. The key impact of
“green nanoscience” includes ease of availability, non-pathogenicity, reduction in synthetic
steps, easy recovery, low energy requirement, thus making them a preferred choice over the
chemical methods41
. Previously, Ha et al synthesized Xanthoceras Sorbifola Tannin attached
gold nanoparticles (AuNPs) for the sensing of Cr(III) ion with a detection limit of 3 µM42
. In
continuation of researchers’ interest in the development of green nanoparticles43
, we have
synthesized C–SNSs at ambient conditions in aqueous media. The synthesized SNSs are
highly selective for Cr(III) and Mn(II) ions over other alkali metals, alkaline earth and
transition metals with a detection limit of 0.20 µM for both Cr(III) and Mn(II) which is
significantly lower than the EPA permissible limits44,45
. Thus, these findings provide a
promising green analytical method for the detection of Cr(III) and Mn(II) toxic metal ions
simultaneously from aqueous systems.
Experimental
Chemical and Materials
All the solutions were prepared with Milli–Q water. Silver nitrate (AgNO3, 99.8%) was
purchased from Sigma Aldrich. All metal salts, like CaCl2, CdCl2, CuSO4, HgCl2, ZnCl2,
NiCl2, Pb(CH3COO)2, KCl, CoCl2, FeCl3, K2Cr2O7, BaCl2, MnCl2, AlCl3, CrCl3, and NaOH
were procured from Sigma Aldrich and Merck Pvt. Ltd, India. The solutions were prepared
by mixing the required amounts of salts in 100 mL Mill–Q water and further diluted as per
requirement. Glassware was thoroughly cleaned with aqua regia and rinsed with Mill–Q
water prior to use. All chemicals were used as received.
Preparation of C-SNSs
Page 3 of 22 Analytical Methods
123456789101112131415161718192021222324252627282930313233343536373839404142434445464748495051525354555657585960
Ana
lytic
alM
etho
dsA
ccep
ted
Man
uscr
ipt

Clove (Syzigium aromaticum) seeds were purchased from the local market. Seeds were
ground into powder and stirred in a 250 mL beaker with 100 mL of Milli–Q water at 35 ℃
for 2 h. After agitation, the color of the solution changed to dark brown. The extract was
filtered using Whatman No. 1 filter paper (pore size 25 µM), and stored in refrigerator prior
to its use for the synthesis of SNSs.
We synthesized C-SNSs at pH 4.5 and 11.5 with slight modifications in previous report46
by
reducing AgNO3 with clove seed extract at room temperature. To synthesize detection probe
at pH 4.5, 50 mL solution of AgNO3 (1 mM) was mixed with various volumes (50 to 850 µL)
of clove seed extract followed by stirring for a few hours. The solution turned from colorless
to light yellow. Similarly, detection probe was also synthesized at pH 11.5 by adjusting pH
using NaOH. Solution turned from colorless to dark yellow. The detection probe solutions
were stored under ambient conditions until used.
Colorimetric Detection of Cr(III) and Mn(II) Ions
The colorimetric detection of Cr(III) and Mn(II) was carried out by detection probe
synthesized at pH 4.5 and 11.5, respectively. 200 µL aqueous solution of both Cr(III) and
Mn(II) of different concentrations were separately added into 800 µL of respective detection
probe solutions. The detection systems were kept at room temperature for 30 min and then
characterized by dual strategies namely colorimetry and spectrometry.
Instrument
Optical absorption spectra were recorded using a lab India 3000+
UV–vis spectrophotometer
with 1 cm quartz cell by using Mill–Q water as blank for the background correction. Surface
morphology was determined by scanning electron microscopy (SEM), and transmission
electron microscopy (TEM). Zeta potential and average particle diameter were determined on
a nanoseries–ZS90, Malvern instrument.
Result and Discussion
Stability of C-SNSs
In colorimetry, the stability of detection system under different conditions is of great
importance. Therefore, stability of the C-SNSs was evaluated by UV-vis spectroscopy in
terms of pH, volume of clove seed extract and time. First, the stability of C-SNSs was studied
at pH range of 4.5-13 (Figure 1a). The pH adjustment showed a slight change in color of C-
SNSs solution upto pH 11.5. Thereafter, no change in colour was observed upon increasing
the pH to 13. The color distinction was reflected by surface plasmon resonance (SPR)
spectra. The intensity and sharpness of SPR band continuously increased with a blue shift
Page 4 of 22Analytical Methods
123456789101112131415161718192021222324252627282930313233343536373839404142434445464748495051525354555657585960
Ana
lytic
alM
etho
dsA
ccep
ted
Man
uscr
ipt

from 424-407 nm on increasing pH from 4.5 to 11.5. This trend confirms that a stable
dispersion of C-SNSs was formed at pH 11.5. As the initial pH of synthesized SNSs was 4.5
and they were maximally stable at pH 11.5, we used C-SNSs at pH 4.5 and 11.5 to check
their suitability for the colorimetric detection.
Further, to know the effect of volume of clove seed extract on the stability of C–SNSs,
different volumes of clove seed extract (50-850µL) were added to AgNO3 solution. Upon
varying the volume, the color of AgNO3 solution changed from colorless to yellow. These
results were further confirmed by SPR spectra. As shown in Figure 1b, the intensity of SPR
peak was increased on increasing the volume of clove seed extract from 50-450 µL. When
the volume was increased from 650–850 µL an immediate change in color from yellow to
reddish brown was observed with broadening of peak. Therefore, we selected 450 µL of
clove seed extract as the best optimal volume to stabilized C-SNSs.
Finally, an important factor which needed to be controlled during the synthesis of C-SNSs
was the reaction time. As the reaction time was increased from 5-120 min, transparent
solution of AgNO3 started to darken. It is apparent from Figure 1c, that after 5 min, no optical
absorption was shown in the range 400–500 nm, only a shoulder was observed at 385 nm.
With time, shoulder disappeared and a new peak started to appear at 424 nm, which became
sharp at 65 min. The intensity of peak increased with reaction time from 65−120 min without
any significant change in the position. It indicates the reduction of Ag+
ion into Ag atoms was
completed within 65 min.
Page 5 of 22 Analytical Methods
123456789101112131415161718192021222324252627282930313233343536373839404142434445464748495051525354555657585960
Ana
lytic
alM
etho
dsA
ccep
ted
Man
uscr
ipt

0
0.02
0.04
0.06
0.08
0.1
0.12
0.14
300 400 500 600 700 800
Ab
sorb
an
ce (
a.u
.)
Wavelength/nm
407 nm, (pH 11.5)
407 nm, (pH 13)
410 nm, (pH 9)411 nm, (pH 7.5)
417 nm, (pH 6)
424 nm, (pH 4.5)
pH 4.5 6 7.5 9 11.5 13
0
0.02
0.04
0.06
0.08
300 400 500 600 700 800
Ab
sorb
an
ce (
a.u
.)
Wavelength/nm
50 µL
150 µL
250 µL
350 µL
450 µL
650 µL
850 µL
50 µl 150 250 350 450 650 850(b)
(a)
Page 6 of 22Analytical Methods
123456789101112131415161718192021222324252627282930313233343536373839404142434445464748495051525354555657585960
Ana
lytic
alM
etho
dsA
ccep
ted
Man
uscr
ipt

Figure 1. SPR spectra of C-SNSs showing the effect of (a) pH, (b) volume of clove seed
extract, and (c) reaction time on the stability of C-SNSs. Inset images show the change in
color by pH, volume and time, respectively.
Characterization of C-SNSs
UV-vis spectra of AgNO3, clove seed extract, and C-SNSs solutions are shown in Figure 2.
The AgNO3 and clove seed extract did not give any peak in the region of 350-500 nm. A new
SPR band appeared at 424 and 407 nm at pH 4.5 and 11.5 respectively, which confirms that
the Ag+ ions were reduced to C-SNSs in presence of clove seed extract. The size and
morphology of C-SNSs were investigated by TEM image at pH 4.5 (Figure S1a) and SEM
image at pH 11.5 (Figure 3a). The average diameter of C-SNSs observed was 38 nm at pH
4.5 and 24 nm at pH 11.5. Observations are in agreement with the SPR and zeta sizer results
(Figure 2 and Figure S2). It is apparent from TEM and SEM images that particles are
spherical and well dispersed in aqueous phase. Surface charge of C-SNSs was measured by
zeta potential analyzer. Zeta potential of C-SNSs was –35 mV at pH 4.5 which increased to –
46.3 mV at pH 11.5 (Figure S3a&c). This increased charge accumulated upon the surface of
C-SNSs and is responsible for electrostatic stability of C-SNSs47
. On the basis of the present
study and earlier reports, we propose a probable mechanism for the synthesis of C-SNSs
which is shown in Scheme 1. Eugenol is the main constituent of clove seed extract48
. In
0
0.03
0.06
0.09
300 400 500 600 700 800
Ab
sorb
an
ce (
a.u
.)
Wavelength/nm
5 min
20 min
35 min
50 min
65 min
80 min
95 min
120 min
5 min 20 35 50 65 80 95 120
(c)
Page 7 of 22 Analytical Methods
123456789101112131415161718192021222324252627282930313233343536373839404142434445464748495051525354555657585960
Ana
lytic
alM
etho
dsA
ccep
ted
Man
uscr
ipt

eugenol, at ortho and para position of –OH, two electron withdrawing groups methoxy and
allyl are present. Due to the effect of these two groups eugenol is able to release a hydroxyl
proton and get converted into its anionic form. The anionic form of eugenol is further
stabilized by two resonating structures. So, due to inductive effect of two electron
withdrawing groups and tendency to form two stable resonating structures, eugenol is able to
release two electrons simultaneously, one electron from the β-carbon of the resonating
structure and the other from the CH2 group next to the double bond due to increase in charge
density. These two electrons are responsible for the reduction of 2Ag+ ions into 2Ag atoms.
These neighboring Ag atoms collide with each other to form C-SNSs.
Figure 2. SPR spectra of AgNO3 solution, clove seed extract, C-SNSs at pH 4.5 and C-SNSs
at pH 11.5.
0
0.05
0.1
0.15
200 350 500 650 800
Ab
sorb
an
ce
(a.u
.)
Wavelength/nm
310 nm, AgNO3
424 nm, C-SNSs at pH 4.5407 nm, C-SNSs at pH 11.5
271 nm, Clove seed extract
(a) (b)
Page 8 of 22Analytical Methods
123456789101112131415161718192021222324252627282930313233343536373839404142434445464748495051525354555657585960
Ana
lytic
alM
etho
dsA
ccep
ted
Man
uscr
ipt

Figure 3. SEM images of C-SNSs at pH 11.5 in the absence(a); inset shows the spherical
shape of spheres, and presence (b) of Mn(II) ions; inset shows square pyramidal particles.
Scheme 1. Schematic illustration of the formation process of C-SNSs and its interaction with
Cr(III) and Mn(II).
Selectivity of the detection method
The selectivity of detection probe was evaluated for Cr(III) and Mn(II) in the presence of
other environmentally relevant metal ions including Ca(II), Cd(II), Cu(II), Hg(II), Zn(II),
Ni(II), Pb(II), K(I), Co(II), Fe(III), Cr(VI), Ba(II), Mn(II), Al(III) and Cr(III). Each
experiment to determine selectivity was conducted in triplicate.
0
0.02
0.04
0.06
0.08
300 400 500 600 700 800Ab
sorb
an
ce (
a.u
.)
Wavelength/nm
Blank
Ca(II)
Cd(II)
Cu(II)
Hg(II)
Zn(II)
Ni(II)
Pb(II)
K(I)
Co(II)
Fe(III)
Cr(VI)
Ba(II)
Mn(II)
Al(III)
Cr(III)
(a)
Page 9 of 22 Analytical Methods
123456789101112131415161718192021222324252627282930313233343536373839404142434445464748495051525354555657585960
Ana
lytic
alM
etho
dsA
ccep
ted
Man
uscr
ipt

Figure 4. Selectivity of synthesized C-SNSs probe at pH 4.5 for the Cr(III); (a) SPR spectra
of different metal ions, (b) bar diagram show the specificity of C-SNSs based probe for the
Cr(III), error bars represent standard deviation from three repeated experiments, and (c)
optical images of C-SNSs in the presence of different metal ions.
As shown in Figure 4a, at pH 4.5, there is the generation of a new peak at 596 nm upon
addition of Cr(III); the presence of other metal ions did not show any significant change in
SPR spectra. The selectivity of probe towards Cr(III) at pH 4.5 was further quantified by
plotting absorption intensity ratio (A596/424) of C-SNSs against concentration of metal ions
(Figure 4b). The Cr(III) induced value of A596/424 was much larger than observed for other
metal ions, which can be used to show distinctive interaction of Cr(III) with C-SNSs.
0
0.3
0.6
0.9
1
A59
6/A
42
4
Metal ions
(b)
Al(III)
Blank
Ba(II)
Cr(VI)
Fe(III)
Zn(II)
Mn(II)
K(I)
Cr(III)
Pb(II)
Ni(II)
(c)
Co(II)
Hg(II)
Cu(II)
Cd(II) Ca(II)
Page 10 of 22Analytical Methods
123456789101112131415161718192021222324252627282930313233343536373839404142434445464748495051525354555657585960
Ana
lytic
alM
etho
dsA
ccep
ted
Man
uscr
ipt

However, the absorbance ratio for Al(III) ion is higher than other metal ions but significantly
smaller than Cr(III) ion. This indicates that the C-SNSs probe is less selective for Al(III) than
Cr(III) ion. The generation of a new peak and augmentation of value of A596/424 is due to
interaction between Cr(III) and C-SNSs which was further confirmed by change in color
from light yellow to colorless observed by the naked eye as shown in Figure 4c. The possible
mechanism for the detection of Cr(III) ions based on clove seed extract shown in Scheme 1.
Clove seed extract composes phenolic compounds such as, eugenol, gallic acid, flavanoids,
hydroxyl cinnamic acids and hydrolysable tannins49
. Phenolic hydroxyl compounds have
high affinity for Cr(III) ion42
. According to the outer electron configuration of 3d34s
04p
0,
Cr(III) ion has a smaller size, higher effective nuclear charge and stronger chelating tendency
than other metal ions. Hence, it acts as a hard Lewis acid and can easily co-ordinate with the
negatively charged oxygen of poly phenols. Co-ordination causes decrease in zeta potential
of C-SNSs from -35 mV to -2.0 mV (Figure S3b). This large decrease in potential shows
strong binding of Cr(III) with C-SNSs which results in almost complete neutralization of C-
SNSs surface and hence induces aggregation of C-SNSs.
0
0.04
0.08
0.12
300 400 500 600 700 800
Ab
sorb
an
ce (
a.u
.)
Wavelength/nm
Blank
Ca(II)
Cd(II)
Cu(II)
Hg(II)
Zn(II)
Ni(II)
Pb(II)
K(I)
Co(II)
Fe(III)
Cr(VI)
Ba(II)
Al(III)
Cr(III)
Mn(II)
(a)
Page 11 of 22 Analytical Methods
123456789101112131415161718192021222324252627282930313233343536373839404142434445464748495051525354555657585960
Ana
lytic
alM
etho
dsA
ccep
ted
Man
uscr
ipt
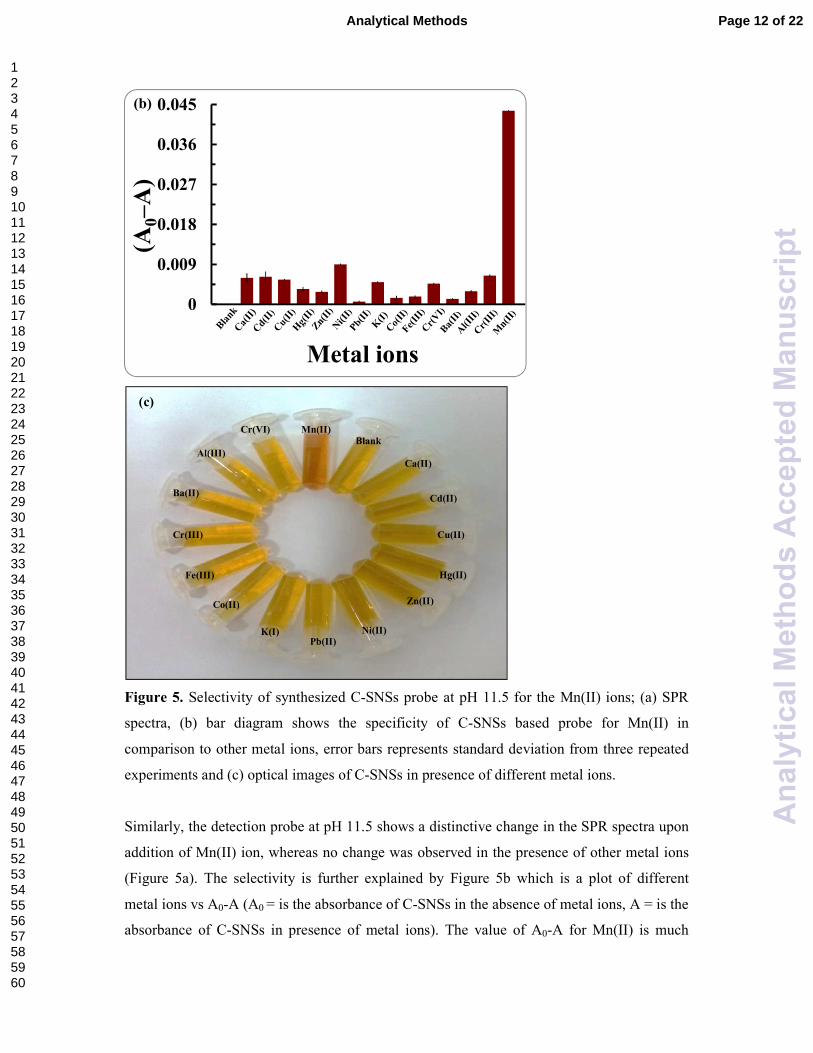
Figure 5. Selectivity of synthesized C-SNSs probe at pH 11.5 for the Mn(II) ions; (a) SPR
spectra, (b) bar diagram shows the specificity of C-SNSs based probe for Mn(II) in
comparison to other metal ions, error bars represents standard deviation from three repeated
experiments and (c) optical images of C-SNSs in presence of different metal ions.
Similarly, the detection probe at pH 11.5 shows a distinctive change in the SPR spectra upon
addition of Mn(II) ion, whereas no change was observed in the presence of other metal ions
(Figure 5a). The selectivity is further explained by Figure 5b which is a plot of different
metal ions vs A0-A (A0 = is the absorbance of C-SNSs in the absence of metal ions, A = is the
absorbance of C-SNSs in presence of metal ions). The value of A0-A for Mn(II) is much
0
0.009
0.018
0.027
0.036
0.045
1
(A0–
A)
Metal ions
(b)
Hg(II)
Zn(II)
Ni(II) Pb(II)
Cr(III)
K(I)
Co(II)
Fe(III)
Cr(VI)
Ba(II)
Mn(II)
Blank
Al(III) Ca(II)
Cd(II)
Cu(II)
(c)
Page 12 of 22Analytical Methods
123456789101112131415161718192021222324252627282930313233343536373839404142434445464748495051525354555657585960
Ana
lytic
alM
etho
dsA
ccep
ted
Man
uscr
ipt

higher than other metal ions which also suggests better selectivity of C-SNSs probe for
Mn(II) ions. It can be seen from Figure 5c that only Mn(II) induced aggregation of C-SNSs
causes color change from dark yellow to reddish brown while co-existing metal ions do not
show color change. The selectivity of C-SNSs for Mn(II) at pH 11.5 is explained on the basis
of electrostatic interaction of Mn(II) with C-SNSs which is responsible for decreasing
interparticle distance to induce aggregation (Scheme 1). Mie theory also states that as the
distance between the particles become smaller than the sum of their radii, SPR band exhibits
low intensity and broadening50,51
. Electrostatic interaction between C-SNSs and Mn(II) ions
is shown by decrease in zeta potential value from -46.6 mV to -15 mV (Figure S3d). The
interaction of Mn(II) changes C-SNSs from spherical to square pyramidal. This morphology
transition indicates that the spherical morphology which was composed completely of ionic
interactions, was disturbed by the addition of Mn(II)52
.
Sensitivity of Probe
To evaluate the lower LODs of the synthesized probe, different concentrations of Cr(III) and
Mn(II) ions were added into the C-SNSs probe solutions.
(a)
0.2
0.4 0.6 0.8
1.0
2.0 Blank to 2µM
Blank
0.1 1.5
Page 13 of 22 Analytical Methods
123456789101112131415161718192021222324252627282930313233343536373839404142434445464748495051525354555657585960
Ana
lytic
alM
etho
dsA
ccep
ted
Man
uscr
ipt

Figure 6. (a) Optical images and (b) SPR spectra of C-SNSs based detection system in the
presence of various concentrations of Cr(III) ranging from 0.1−2.0 µM at pH 4.5, (c) Plot of
A596/424 as the function of concentration of Cr(III) which shows linearity of A596/424 values of
C-SNSs probe solution at 424 nm.
The colorimetric results show that on increasing the concentration of Cr(III) from
0.2−2.0µM, a continuous change in color from light yellow to colorless was observed as
shown in Figure 6a. The LOD for Cr(III) ion is 0.2 µM. However, the reaction rates are
different but the final results are almost same at different concentrations of Cr(III) ions
0
0.02
0.04
0.06
300 400 500 600 700 800
Ab
sorb
an
ce
(a.u
.)
Wavelength/nm
Blank
0.10.20.40.60.81
1.52.0
[Cr(III)]/µM(b)
y = 0.770x + 0.488
R² = 0.9913
0
0.5
1
1.5
2
2.5
0.2 0.8 1.4 2
A5
96
/424
[Cr(III)]/µM
(c)
Page 14 of 22Analytical Methods
123456789101112131415161718192021222324252627282930313233343536373839404142434445464748495051525354555657585960
Ana
lytic
alM
etho
dsA
ccep
ted
Man
uscr
ipt

because the reaction of Cr(III) ions with C-SNSs proceeds until the C-SNSs aggregate
completely.
SPR spectra of the detection system on interaction with various concentrations of Cr(III) ions
at pH 4.5 are shown in Figure 6b. The addition of Cr(III) to the detection system not only
causes an intensity decrease and red shifting of characteristic SPR band but also the
generation of a new sister peak at 596 nm. Finally, this peak disappears at the final
concentration of 2.0 µM. As shown in Figure 4c the Al(III) also showed a change in color of
C-SNSs. We plotted the ratio of A596/424 against the concentration of Al(III) and Cr(III) metal
ions, respectively to quantitatively describe the responsive sensitivity of C-SNSs toward
Al(III) and Cr(III) at pH 4.5. From the ratiometric plot (Figure S4) it is apparent that the
Cr(III) ion above concentration 0.2 µM induces interparticle association of C-SNSs which
leads to a change in their SPR spectra. However, Al(III) showed a slight change at
concentration higher than 0.6 µM. Therefore, the C-SNSs show much higher sensitivity for
Cr(III) than Al(III). These observations could be used for the quantitative measurement of the
Cr(III) in the solution (Figure 6c). The concentration of Cr(III) ions in the range of 0.4–2.0
µM were employed to construct the calibration curve which showed a linear correlation
(R2=0.9913) up to 2.0 µM.
Similarly, a change in color from dark yellow to reddish-brown was observed as the
concentration of Mn(II) increased from 0.2-2.0 µM as shown in Figure7a. The LOD of the
detection system for Mn(II) is 0.2 µM. SPR spectra of the detection system on interaction
with various concentrations of Mn(II) ions at pH 11.5 are shown in Figure 7b. With
increasing concentration of Mn(II), there was a gradual shift observed in the SPR band of C-
SNSs toward a longer wavelength with line broadening and decrease of intensity. Finally, the
peak disappears at the concentration of 2.5 µM. Figure 7c reveals there is a linear relationship
between absorption intensity changes and the concentration of Mn(II) over a range of 0.2−2.5
µM with a linear correlation value (R2) of 0.9909.
Page 15 of 22 Analytical Methods
123456789101112131415161718192021222324252627282930313233343536373839404142434445464748495051525354555657585960
Ana
lytic
alM
etho
dsA
ccep
ted
Man
uscr
ipt

Figure 7. (a) Optical images, (b) SPR spectra of C-SNSs based detection system in the
0
0.04
0.08
0.12
300 400 500 600 700 800
Ab
sorb
an
ce
(a.u
.)
Wavelength/nm
Blank0.10.20.40.60.811.522.5
[Mn(II)]/µM(b)
y = 0.018x + 0.037
R² = 0.9909
0
0.03
0.06
0.09
0 0.5 1 1.5 2 2.5
A0-A
[Mn(II)]/µM
Blank
0.1
0.2
0.4
0.6 0.8
1.0
1.5
2.0
2.5 Blank to 2.5
(a)
(c)
Page 16 of 22Analytical Methods
123456789101112131415161718192021222324252627282930313233343536373839404142434445464748495051525354555657585960
Ana
lytic
alM
etho
dsA
ccep
ted
Man
uscr
ipt

presence of various concentrations of Mn(II) ranging from 0.1 to 2.5 at pH 11.5, (c) plot of
A0-A versus concentration of Mn(II) at pH 11.5.
Table 1 Comparison of the performance of various sensors for Cr(III) and Mn(II)
Detection system Metal ion LOD/µM
(naked eye)
Ref.
PMMA@Au NPs Cr(III) 40 53
Citrate-AuNPs Cr(III), Cr(VI) 4.0 13
NTP@AuNPs Cr(III) 1.4 54
XT-AuNPs Cr(III) 3.0 42
Dopa-AuNPs Mn(II) 5.0 10
Na4P2O7 and HPMC SNSs Mn(II) 0.50 33
C-SNSs Cr(III), Mn(II) 0.20 Present work
The performance of biocompatible C-SNSs based detection system for Cr(III)and Mn(II) ions
also compares with reported sensors (Table 1). The sensitivity and ease of synthesis of our
proposed detection system makes it more advantageous over other systems.
Detection of Cr(III) and Mn(II) ions in tap water samples
To promote the effectiveness of our detection system, the probe prepared at pH 4.5 and 11.5
was tested on a tap water sample collected from household source. Contamination by Cr(III)
and Mn(II) in tap water sample was lower than LOD of synthesized probe, thus the tap water
sample was contaminated with standard solutions of Cr(III) and Mn(II). Figure 8a&b show
the colorimetric response of the detection probe in tap water with Cr(III) and Mn(II). On
increasing the concentration of corresponding metal ion, the probe response linearly
increased. The response of the detection probe was quite similar for both mill-Q water and
tap water which suggests that the Cr(III) and Mn(II) can be detected in tap water without
interfering contaminants. At low concentration the detection system shows a good linearity
with R2 values of 0.9926 and 0.9942 for Cr(III) and Mn(II), respectively (Figure S5a&b). To
further demonstrate the applicability of C-SNSs probe the recovery experiment was
performed with Cr(III)and Mn(II) contaminated tap water (1.5 and 2.0 µM). The average
percentage recovery of the C-SNSs probe was observed in the range of 91.32 to 114.50
(Table 2). This confirms the utility of synthesized C-SNSs probe for the detection of Cr(III)
and Mn(II) ions in real water samples.
Page 17 of 22 Analytical Methods
123456789101112131415161718192021222324252627282930313233343536373839404142434445464748495051525354555657585960
Ana
lytic
alM
etho
dsA
ccep
ted
Man
uscr
ipt

Figure 8. Colorimetric response of Cr(III) ion (a) and Mn(II) ion (b) in tap water samples.
Table 2 Detection of Cr(III) and Mn(II) in tap water sample by our prepared C-SNSs probe
Sample [Mn+]
/µM Cr(III) and Mn(II) found
(mean±E, n=3)
Recovery
(%)
Tap water Blank 0 -
Cr(III) 1.5 1.47 ± 0.10 98±6.6
2.0 1.92±0.05 96±2.5
Tap water Blank 0 -
Mn(II) 1.5 1.39±0.02 92.66±1.34
2.0 2.2±0.09 110±4.5
3. CONCLUSIONS
We have established the use of clove seed extract as a reducing as well as stabilizing agent
for the synthesis of SNSs. The prepared C-SNSs are highly stable in aqueous medium and do
not show any signs of aggregation up to a month. The prepared SNSs were characterized by
UV-vis, TEM, SEM and zeta potential techniques. The shape and size of SNSs was
optimized by varying pH, reaction time and concentration of clove seed extract. The C-SNSs
based detection system has high sensitivity (0.2 µM) for both Cr(III) and Mn(II) ions over
other alkali, alkaline earth and transition metal ions. The metal ion induced aggregation of C-
SNSs causes the change in color from light yellow to colorless for Cr(III) and dark brown to
reddish brown for Mn(II). The synthesized probe does not require any surface modifications
by DNA, thiol containing groups, any fluorescent compounds or dyes, nor does it require
Blank
0.1
0.2
0.4
0.6 0.8
1.0
1.5
2.0 Blank
0.1
0.2
0.4
0.6 0.8
1.0
1.5
2.0
2.5
(a) (b)
Blank to 2.0 µM Blank to 2.5 µM
Page 18 of 22Analytical Methods
123456789101112131415161718192021222324252627282930313233343536373839404142434445464748495051525354555657585960
Ana
lytic
alM
etho
dsA
ccep
ted
Man
uscr
ipt
optimizing temperature conditions for detection. The ease of preparation, biocompatibility
and ability to simultaneously determine two metal ions make it useful and easy to apply. This
work will provide a simple and plausible route in the application of nanoprobe for the
detection of heavy metal ions in tap water samples.
ACKNOWLEDGEMENTS
We gratefully acknowledge support from the Ministry of Human Resource Development
Department of Higher Education, Government of India under the scheme of Establishment of
Centre of Excellence for Training and Research in Frontier Areas of Science and Technology
(FAST), for providing the necessary financial support to carry out this study vide letter No, F.
No. 5-5/201 4-TS.Vll. The authors would like to thank University of Rajasthan, Jaipur
providing SEM facility.
References
1. L. S. Walekar, A. H. Gore, P. V. Anbhule, V. Sudarsan, S. R. Patil and G.B. Kolekar,
Anal. Methods, 2013, 5, 5501-5507.
2. M. Sa’idi, Int. J. Environ. Sci., 2010, 1, 666-676.
3. L. Beqa, A. K. Singh, S.A. Khan, D. Senapati, S. R. Arumugam and P.C. Ray, Appl.
Mater. Interfaces, 2011, 3, 668–673.
4. G. Aragay, G. Alarcon, J. Pons, M. Font-Bardía and A. Merkoci, J. Phys. Chem. C,
2012, 116, 1987–1994.
5. J. Zhang, L. Zhang, Y. Wei, J. Chao, S. Wang, S. Shuang, Z. Cai and C. Dong, Anal.
Methods, 2013, 5, 5549–5554.
6. M. Elavarasi, A. Rajeshwari, N. Chandrasekaran and A. Mukherjee, Anal. Methods,
2013, 5, 6211–6218.
7. A. Fargasova, Ecol. Chem. Eng. S, 2008, 15, 335-348.
8. K. Farhadi, M. Forough, R. Molaei, S. Hajizadeh and A. Rafipour, Sensor. Actuat. B-
Chem., 2012, 161, 880–885.
9. D. C. Dorman, M. F. Struve, R. A. James, B. E. McMnus, M. W. Marshall and B. A.
Wong, Toxicol. Sci., 2001, 60, 242–251.
10. K. B. Narayanan and H. H. Park, Spectrochim. Acta. A, 2014, 131, 132–137.
11. A. B. Bowman, G. F. Kwakye, E. H. Hernández and M. Aschner, J. Trace. Elem.
Med. Biol., 2011, 25, 191-203.
12. USEPA, Manganese, United States Environmental Protection Agency, Integrated
Risk Information System (IRIS), Washington, DC, 1997.
13. Y. Liu and X. Wang, Anal. Methods, 2013, 5, 1442–1448.
Page 19 of 22 Analytical Methods
123456789101112131415161718192021222324252627282930313233343536373839404142434445464748495051525354555657585960
Ana
lytic
alM
etho
dsA
ccep
ted
Man
uscr
ipt

14. Y. Zhou, H. Zhao, C. Li, P. He, W. Peng, L. Yuan, L. Zeng and Y. He, Talanta, 2012,
97, 331–335.
15. J. P. Mettres, R. O. Kadara and C. E. Banks, Analyst, 2012, 137, 896-902.
16. S. A. Miscoria, C. Jacq, T. Maeder and R. M. Negri, Sensor. Actuat. B-Chem., 2014,
195, 294-302.
17. I. Michaud-Soret, A. Adrait, M. Jaquinod, E. Forest, D. Touati and J. M. Latour,
FEBS Letters, 1997, 413, 473-476.
18. E. Weldy, C. Wolff, Z. Miao and H. Chen, Sci. Justice, 2013, 53, 293-300.
19. S. Sadeghi and A. Z. Moghaddum, Anal. Methods, 2014, 6, 4867-4877.
20. H. L. Sun, H. M. Liu and S. J. Tsai, J. Chromatogr. A., 1999, 857, 351–357.
21. R. Kachadourian, R. Menzeleev, B. Agha, S. B. Bocckino and B. J. Day, J.
Chromatogr. B Analyt. Technol. Biomed. Life Sci., 2002, 767, 61–67.
22. A. Calleja, V. Ríos, M. Luque, R. Ostos, A. Grilo, A. M. Cameán and L. Moreno, J.
Toxins, 2014, 1, 1-10.
23. R. E. Wolf, J. M. Morrison and M. B. Goldhaber, J. Anal. At. Spectrom., 2007, 22,
1051–1060.
24. Y. Inoue, T. Sakai and H. Kumagai, J. Chromatogr. A, 1997, 706, 127-136.
25. M. Golasik, M. Herman, W. Piekoszewski, E. Gomółka, G. Wodowski and S. Walas,
Anal. Lett., 2014, 47, 1921–1930.
26. S. K. Soni, P. R. Selvakannan, S. K. Bhargava and V. Bansal, Langmuir, 2012, 28,
10389-10397.
27. M. Sperling, S. Xu and B. Welz, Anal. Chem., 1992, 64, 3101–3108.
28. Y.-X. Gao, J.-W. Xin, Z.-Y. Shen, W. Pan, X. Li and A.-G. Wu, Sensor. Actuat. B
Chem., 2013, 181, 288-293.
29. M. Elavarasi, M. L. Paul, A. Rajeshwari, N. Chandrasekaran, A. B. Mandal and A.
Mukherjee, Anal. Methods, 2012, 4, 3407-3412.
30. H. Zhang, Q. Liu, T. Wang, Z. Yun, G. Li, J. Liu and G. Jiang, Anal. Chim. Acta,
2013, 770, 140–146.
31. Q. Q. Fu, Y. Tang, C. Y. Shi, X. L. Zhang, J. J. Xiang and X. Liu, Biosens.
Bioelectron., 2013, 49, 399–402.
32. R. Hu, L. Zhang and H. Li, New J. Chem., 2014, 38, 2237–2240.
33. G. Wu, C. Dong, Y. Li, Z. Wang, Y. Gao, Z. Shen and A. Wu, RSC Adv., 2015, 5,
20595– 20602.
34. J. Xin, L. Miao, S. Chen and A. Wu, Anal. Methods, 2012, 4, 1259-1264.
Page 20 of 22Analytical Methods
123456789101112131415161718192021222324252627282930313233343536373839404142434445464748495051525354555657585960
Ana
lytic
alM
etho
dsA
ccep
ted
Man
uscr
ipt

35. L. Zhao, Y. Jin, Z. Yan, Y. Liu and H. Zhu, Anal. Chim. Acta., 2012, 731, 75-81.
36. S. I. Hughes, S. S. R. Dasary, A. K. Singh, Z. Glenn, H. Jamison, P. C. Ray and H.
Yu, Sensor. Actuat. B-Chem., 2013, 178, 514–519.
37. Y. Zhou, Y.-S. Li, X. L. Tian, Y. Y. Zhang, L. Yang, J. H. Zhang, S. Y. Wang, X. R.
Lu, H. L. Ren and Z. S. Liu, Sensor. Actuat. B-Chem., 2012, 161, 1108–1113.
38. H. R. Ghorbani, A. A. Safekordi, H. Attar and S. M. R. Sorkhabadi, Chem. Biochem.
Eng. Q., 2011, 25, 317–326.
39. S. S. Ravi, L. R. Christena, N. S. Subramanian and S. P. Anthony, Analyst, 2013, 138,
4370-4377.
40. C. K. Balavigneswaran, T. S. J. Kumar, R. M. Packiaraj and S. Prakash, Appl. Nano.
Sci., 2014, 4, 367–378.
41. M. Gondwal and G. J. N. Panta, Int. J. Pharm. Bio. Sci., 2013, 4, 635–643.
42. W. Ha, J. Yu, R. Wang, J. Chen and Y.-P. Shi, Anal. Methods, 2014, 6, 5720-5726.
43. A. K. Singh, M. Talat, D. P. Singh and O. N. Srivastava, J. Nanopart. Res., 2010, 12,
1667–1675.
44. U.S. EPA, Integrated Risk Information System (IRIS) on Chromium III. National
Center for Environmental Assessment, Office of Research and Development:
Washington, DC, 1999.
45. U.S. EPA, Drinking Water Health Advisory for Manganese. U.S. Environmental
Protection Agency Office of Water, Health and Ecological Criteria Division
Washington, DC, 2004.
46. H. Kaur, S. Kaur and M. Singh, Biologia, 2013, 68, 1048-1053.
47. C. C. Huang and H. T. Chang, Chem. Commu., 2007, (12), 1215-1217.
48. L. Jirovetz, G. Buchbauer, I. Stoilova, A. Stoyanova, A. Krastanov and E. Schmidt, J.
Agric. Food. Chem., 2006, 54, 6303–6307.
49. D. F. Cortés-Rojas, C. R. F. S. Souza and W. P. Oliveira, Asian Pac. J. Trop.
Biomed., 2014, 4, 90-96.
50. M.-C. Daniel and D. Astruc, Chem. Rev., 2004, 104, 293–346.
51. S. K. Ghosh and T. Pal, Chem. Rev., 2007, 107, 4797–4862.
52. N. Vilvamani, S. Deka and T. Gupta, Adv. Mat. Lett., 2013, 4, 252-260.
53. J. Li, C. Han, W. Wu, S. Zhang, J. Guo and H. Zhou, New J. Chem. 2014, 38, 717-
722.
54. Y.-C. Chen, I-L. Lee, Y.-M. Sung and S.-P. Wu, Sensor. Actuat. B-Chem., 2013, 188,
354-359.
Page 21 of 22 Analytical Methods
123456789101112131415161718192021222324252627282930313233343536373839404142434445464748495051525354555657585960
Ana
lytic
alM
etho
dsA
ccep
ted
Man
uscr
ipt

Page 22 of 22Analytical Methods
123456789101112131415161718192021222324252627282930313233343536373839404142434445464748495051525354555657585960
Ana
lytic
alM
etho
dsA
ccep
ted
Man
uscr
ipt


![Analytical evaluation of steviol glycosides by capillary ... · Builder module in Discovery Studio (DS) 3.1 [34]. Docking studies were performed using the CDOCKER module of DS. CDOCKER](https://img.pdfslide.us/doc/110x75/5f0f87377e708231d4449c1e/analytical-evaluation-of-steviol-glycosides-by-capillary-builder-module-in-discovery.jpg)