Embed Size (px)
Citation preview
Loyola University Chicago Loyola University Chicago
Loyola eCommons Loyola eCommons
Dissertations Theses and Dissertations
1972
Analytical Gel Chromatographic Studies on Hemerythrin Analytical Gel Chromatographic Studies on Hemerythrin
Ayyagari Laxminarasimha Rao Loyola University Chicago
Follow this and additional works at: https://ecommons.luc.edu/luc_diss
Part of the Medicine and Health Sciences Commons
Recommended Citation Recommended Citation Rao, Ayyagari Laxminarasimha, "Analytical Gel Chromatographic Studies on Hemerythrin" (1972). Dissertations. 1125. https://ecommons.luc.edu/luc_diss/1125
This Dissertation is brought to you for free and open access by the Theses and Dissertations at Loyola eCommons. It has been accepted for inclusion in Dissertations by an authorized administrator of Loyola eCommons. For more information, please contact [email protected].
This work is licensed under a Creative Commons Attribution-Noncommercial-No Derivative Works 3.0 License. Copyright © 1972 Ayyagari Laxminarasimha Rao
ANALYTICAL GEL CHROMATOGRAPHIC STUDIES ON HE11ERYTHRIN
BY
AYYAGARI LAXMINARAS IMHA RAO
·A THESIS SUBMITTED TO THE FACULTY OF THE GRADUATE SCHOdL
OF LOYOLA UNIVERSITY IN PARTIAL FULFILLl:1ENT OF
THE REQUIREl:1ENTS FOR THE DEGREE OF
DOCTOR OF PHILOSOPHY
(
FEBRUARY 1972
LIBRARY LOYOLA UNIVERSITY MEDICAL CENTER
-
ABSTRACT
Abstract of the dissertation entitled ANALYTICAL GEL CHROMATOGRAPHIC
STUDIES: ON HEMERYTHRIN submitted by Ayyagari Laxminarasimha Rao in partial
fulfillment of the requirements far the degree of Doctor of Philosophy,
February, 1972, Loyola University of Chicago.
This investigation involved the study of protein-protein and protein-
. small ion interactions of hemerythrin by analytical gel chromatography.
Hemerythrin is a non-heme iron-containing oxygen carrier found in certain
marine worms. It is c0mposed of eight identical subunits and can bind
oxygen and other ligands such as azide, thiocyanate, chloride ions, etc.
On tre~tment with sulfhydryl blocking reagents or on dilution this protein I
dissociates into monomers.· The effects of _dilution, various anions, and the
mercurial paramercuribenzoa~e (pMB) on the dissociation equilibrium was
examined by frontal and zonal gel chromatographic procedures. The major
conclusions and original contributions of these studies may be summarized
as follows:
The dissociation constant as obtained by frontal gel filtration
analysis is 1 x 10-42 ±. 2 moles/liter of monomer, which value is in good
agreement with previous ultracentrifugation! and ion-binding data2. However,
in contrast to the reported slow equilibration3 during sedimentation
velocity experiments, frontal gel chromatographic results clearly demon
strated rapid equilibration of the octameric and monomeric species. It is
possible that such a discrepancy is the result of the pressure generated
during high speed ultracentrifugation on the dissociation equilibrium.
Iron-coordinating anions, as expected from earlier studies4 , specifi
cally shift hemerythrin dissociation equilibrium toward the monomeric form
of the protein. Although these effects were relatively minor, they could
be easily detected by changes in the elution volumes. In addition, the
anions were effective in changing the degree of dissociation even at low
ligand con.centrations, at which no spectral change therefore no iron
coordination occurs. Subsequent Hummel and Dreyer types gel filtration
ii
experiments with labelled ions revealed direct binding of ligands to
hemerythrin. Thus it appears that non-iron binding of ions is responsible
for the observed changes in the dissociation behavior of hemerythrin.
Specific application of zonal gel filtration enabled the direct
comparison of the rate of reaction of pMB with sulfhydryl groups of
hemerythrin and the resulting rate of dissociation into subunits. The
results indicate that the octameric form of the protein is the reactive
species. The reaction proceeds probably in a random fashion followed by
reequilibration and dissociation.
Combining the stopped flow technique with frontal gel chromatography
the mercurial was shown to bind to hemerythrin. It was also found that
the bound pMB could further react with the sulfhydryl groups in the
protein. These observations about the mercurial-hemerythrin interactions
have important bearing on the understanding of the reported all-or-none
mechanism6 of the above reaction.
ln'conclusion this investigation demonstrates the utility of analytical
gel filtration for studies on protein interactions. Although it is an
empirical procedure, it appears to be accurate, sensitive, versatile, rapid
and inexpensive.
1
2
3
4 5
6
Langerman, N. R., and Klotz, I. M., Biochemistry..§., 4786 (1969).
Klapper, M. H., and Klotz, I. M. Biochemistry z, 223 (1968).
Klapper, H. M., Barlow, G. H., and Klotz, I. M., Biochem. Biophys. Res.
Comm. 25, 116 (1966).
Keres;tes-Nagy, S., and Klotz, I. M., Biochemistry,!!_, 919 (1965). t
Hummel, J.P., and Dreyer, W. J., Biochem. Biophys. Acta., &1_ (1962).
Keresztes-Nagy, S., and Klotz, I. M., Biochemistry 1, 923 (1963).
iii
LITE
Ayyagari L.N. Rao was born in Mogallu,Andhra State, India on
December 30, 1940. He graduated from A.ndhra Vidyalaya High School,
Hyderabad, India in April, 1955. He received his B.Sc. degree from
Bombay University, India in June, 1960. In 1965, he was awarded the
M.Sc. degree in Biochemistry by the same University. He began his
graduate work in the Department of Biochemistry and Biophysics of
Loyola University School of Medicine in September, 1966, from where
he earned the M.S. degree in 1969. He has been a graduate assistant
in the department from September, 1966 to September, 1970, and
Decemb~r, 1970 to June, 1971.
Mr. Rao was employed as a scientific assistant in the Analy
tical Chemistry and Biochemistry Divisions of the Atomic Energy
Establishment, Trombay, Bombay, India from September, 1962 to March,
1965. He has been a post-doctoral fellow in the Department of
Biochemistry and Biophysics, University of California, Davis, since
November, 1971.
He is an associate member of the American Chemical Society,
AAAS and the Biophysical Society.
iv
This dissertation is gratefully dedicated to my benefactors:
My Father, A. Sunderama Rao,
My Uncle, A. Sambasiva Rao,
and My Cousin, A. v. Chalapati Rao,
for their help and prodding in the pursuit of my doctoral degree.
Without their true affection and understanding, I
would not have been able to obtain graduate education in the
U.S.A.
\
v
ACKNOWLEDGEMENT
l would like to express my appreciation and thanks to my research
advisor, Dr. Steven Keresztes-Nagy. His encouragement has helped
me to surmount the many scientific and personal obstacles which
have occurred during the preparation of this dissertation.
I also would like to express my sincere thanks to the following
persons:
Mr. Albert J. Ianunartino and Mr. Michael C. Cress, for
their invaluable friendship and help
in the laboratory (especially in
sustaining the long night hours).
Miss Nancy E. Egan, for her assistance in the writing
of this manuscript.
Miss Kathleen Jung, for her help in preparing the diagrams.
and Mrs. Eileen Hebenstreit, for her efficient and patient
typing of this dissertation.
vi
TABLE OF CONTENTS
Page
Chapter I Introduction 1 I
Chapter II - Materials and Methods 18
Materials. 18
Isolation and Purification of Hemerythrin. 18
Conversion of Oxyhemerythrin into Coordination Complexes. 19
Preparation of pMB Solution. 20
Determination of Hemerythrin Concentration by Iron Analysis and from Molar-Extinction Coefficients 21
I General Chromatographic Procedures for Dissociation / Studies. 21
Column Calibration Procedure. Z6
Treatment of Elution Data. 26
Gel-Filtration Studies on the Rates of Dissociation and Reaction of Hemerythrin -SH Groups with pMB. 28
Spectrophotometer-Titration Method for Measurement of the Rate of Reaction between pMB and Hemery-thrin -SH Groups. 29
Studies on Mercurial-Hemerythrin Binding with Rapid Mixed Proced~res. 30
Measurement of the Rate of Conversion of Oxy-hemerythrin in the Presence of Chloride Ions. 32
t • Determination of Chloride-Hemerythrin Binding. 32
Scintilla.tion-Counting Procedure Using 36c1 ~ 33
vii
chapter III Experimental Results
A. Calibration of Sephadex Columns
B.l. Dissociation Experiments with Hemerythrinazide on a Sephadex G-100 Column
B.2. Dissociation Experiments with Hemerythrinthiocyanate on a Sephadex G-100 Column
B.3. Dissociation Experiments with Oxyhemerythrin on a Sephadex G-100 Column
C. Dissociation Experiments with Hemerythrin-azide on a Sephadex G-75 Column
D. Examination of the Rate of Equilibrium on the Theoretical Plate Concept
E. Observation of the Eff~ct of Iron-Coordinating Ligands, SCN-, NJ , and 02
F. Studies on the Specific Effect of Chloride Ion
G. Observation on the Effect of Method of Protein Prepa~ation on the Dissociation Properties
H. Studies on the Effect of Some Specif~c NonCoordinating Anions
I. Direct Experimental Evidence for Binding by Chloride at Non-Iron Sites before Coordination with the Iron Atoms
J. Studies on the Nature of Mercurial-Hemerythrin Interactions
1. Binding of pMB to Hemerythrin
2. Comparison of the( rate of dissociation and the rate of reaction on Sephadex G-75 Column
Chapter r.J Discussion
A. Hemerythrin Subunit-Subunit Interactions (Association-Dissociation Equilibrium)
viii
35
35
41
44
46
52
62
68
71
80
86
88
95
103
110
112
B.l. Hemerythrin-Anion Interactions
B.2. Effect of Method of Preparation on the Dissociation Properties
128
131
B.3. Evidence for Non-Iron Binding by Chloride Ions 133
B.4. Nature of the Chloride Binding Site 134
c.l. Hemerythrin-Mercurial Interactions 140
c.2. Evidence on the Mercurial-Reactive Species of Hemerythrin 143
C.3. The 'All-or-None' Behavior of Hemerythrin -SH Groups 145
D. Considerations for the Working Model of Hemerythrin Interactions 149
Chapter V Summary and Conclusions 151
Bibliography 154
Appendices
I. A General· Review of Gel-Chromatographic Concepts 169
II. Calculation of the Centroid Volume from a FrontalElution Diagram.
III. Conversion of cr into its Inverse-Error-Function
180
Complement 184
IV. Calculation of% Dissociation from the Weight-Average Molecular Weight 185
V. Calculation of the Dissociation Constant from the Weight-Average Sieve Coefficient 186
t
VI. Changes in Dissociation Constant by IntrQduction of Errors in Elution Volume and Concentration Terms
VII. Calculation of the % Dissociation and of Reaction from Elution Peak Areas Obtained in Zonal Experiments with a Oxyhemerythrin-pMB Reaction
187
Mixture 188
ix
LIST OF TABLES
Table Page
I. Calibration data of Sephadex G-75 and G-100 Columns at 25°C 38
II. Calibration data in relation to molecular size 39
III. Effect of dilution on the dissociation of hemerythrin-azide as observed on a G-100 column 42
IV. Effect of dilution on the dissociation of hemerythrin-thiocyanate complex 45
V. Dissociation behavior of oxyhemerythrin on a G-100 Column 49
VI. Effect of dilution on the dissociation of. the hemerythrin-azide complex at 25°C (Analysis of the leading boundary) 53
VII. Effect of dilution on the dissociation of the hemerythrin-azide complex at 25°C (Anaiysis of the trailing boundary) 58
VIII. Data on monomeric and octameric molecular radii of hemerythrin-azide complex 61
IX. Experimental data of oxyhemerythrin·and thiocyanate complex to evaluate HETP · 67
X. Comparative dissociation data on hemerythrin-azide and thiocyanate complexes 69
XI. Effect of dilution on the dissociation of oxyhemerythrin with a G-75 Column 70
XII. Dissociation studies of oxyhemerythrin in the presence of 0.5 M c1- on a G-75 Column 71
XIII. Comparative.data on.oxyhemerythrin dissociation in various experimental conditions 72
XIV. Dissociation behavior of a 40 µg/ml oxyhemerythrin in 0.1 M chloride ion 75
XV. Dissociation studies of 46.5 µg/ml oxyhemerythrin in 0.5 M chloride in relation to time 80
x
XVI. Dissociation behavior of a thiocyanate-hemerythrin com-plex obtained by dilution procedure 82
XVII. Dissociation behavior of a hemerythrin-thiocyanate com-plex obtained through the dialysis procedure 82
XVIII. Comparison of the dissociation behavior of chloro-hemerythrin obtained through the aquo complex 85
XIX. Comparative data obtained on a chloroheme~ythrin obtained by two different procedures 86
XX. Effects of some specific non-coordinating ions on the dissociation 9f oxy-hemerythrin 88
XX!. Experimental data of chloride-hemerythrin binding by the Hg (N03) 2-titration procedure 91
XXII. Data on the chloride-hemerythrin binding by using chlorine -36 92
XXIII., The amount of pMB-Hr binding at 25% -SH group reaction 100
XXIV. Gel filtration data on the extent of reaction and dissociation
XXV. Comparative data on the dissociation constant of
107
hemerythrin from various methods 115
XXVI. Various terms for the calculation of the centroid volume 183
I
\ I
xi
LIST OF FIGURES
Figure Page
1. Schematic representation of the 'conformation and 'dissociation' models 8
2. Fe..-o2 binding lS
3. Portal configuration of the sample injection valve 24
4. Schematic of the monitoring set up for Sephadex Columns 27
S. Mixing arrangement for binding experiments 31
6. Calibration plot of Sephadex G-7S Column 36
7. Calibration plot of G-100 Column 37
8. Calibration plots of G-7S and G-100 Columns on the basis of molecular radius 40
9. Change of elution volumes on dilution with hemerythrin-azide complex observed on a G-100 Column 43
10. Concentration derivative curves of G-100 column elution profiles (Hr·-oxy complex) 48
11. Variation of elution rates with protein concentration . (G-100 column experiments) SO
12. Hemerythrin-azide complex elution diagrams on a G-7S Column S4
13. First difference curves of G-7S Column elution profiles (Hr-N3- complex) SS
14. Plot of crw against protein concentration (Hr-N3-experiments on G-7S Column) S6
lS. Variation of elution rates with protein concentration (G-7S Column experiments with Hr-N3-) S9
16, First derivative curves of elution profiles obtained at 200 and 2 µg/ml on a G-7S Column 60
17. Elution profile of a 68 µg/ml Hr-SCN- preparation on a G-75 Column 63
xii
18. Elution profile on a 20 µg/ml oxy-Hr solution on a G-75 Column 64
19. Elution profile of a 68 µg/ml oxy-Hr solution on a G-75 Column 65
20. Spectral conversion of a 40 µg/ml protein in 0.5 M chloride ion 74
21. Effect of chloride on percent spectral conversion of oxy-Hr to Hr-chloride ccmplex 77
22. Effect of protein concentration on spectral conversion of oxy-Hr to chloro-complex 78
23. Two different procedures for making Hr-cl- complex 84
24. Titration profiles of oxy-Hr in chloride-binding ex-periments 90
25. Binding experiments with oxy-Hr with chlorine-36 93
26. Quenching curve for oxy-Hr (18.5 - SO mg/ml) 94
27. Elution of hemerythrin and NaN3- on a G-25 Column 96
28. Elution profile of oxy-Hr on a.G-25 Column pre-equilibrated with pMB 98
29. Elution profile of 0.1 M NaCl on a G-25 Column pre-equilibrated with pMB 99
30. Elution profiles of Hr-cl- on a G-25 Column saturated with pMB 102
31. Elution profiles of a reaction mixture of oxy-Hr and pMB on a G-75 Column 104
32. Comparison of the rate of re~ction of oxy-Hr with pMB and the rate of dissociation 106
33. Elution patterns obtained with two different reaction mixtures of chloro-hemerythrin and pMB 108
xiii
34. Effect of ionic strength and temperature on the dissociation of oxy-Hr 123
35. The amino acid sequence of hemerythrin monomer 136
36. Possible reaction mechanisms for 'all-or-none' behavior of hemerythrin sulfhydryl groups 146
37. A representative first difference curve of the leading
\ \
boundary obtained in a frontal elution experiment 181
xiv
ATP:
HETP:
Hr:
I.D:
O.D:
P.S.I:
P.S.I.U:
PPO:
-SH:
Tris-cac:
pMB:
LIST OF ABBREVIATIONS
adneosine-5'-triphosphate
height equivalent to theoretical plate
hemerythrin
internal diameter
outer diameter
pressure per square inch
guage pressure per square inch
2, 5-diphenyloxazoie
sulfhydryl group
trishydroxymethane-cacodylic acid
paramercuribenzoate
xv
1.
CHAPTER I
INTRODUCTION
Most biochemical research is aimed at gaining new insights into
fundamental biological processes through the correlation of the structure
and function of macromolecules. Some classic problems in which such a
correlation has aided the understanding of the underlying principles of
biochemistry are the genetic code, the behavior of membranes, and the
r~gulation of enzymes. The last problem particularly has been studied
extensively due to the physiological significance of enzymes in con-
trolling the many complex degradative and synthetic pathways. Metabolism
is also regulated through other biochemical functions, such as transport
and supply of small ions and metabolites to the various tissues across
membranes, and energy (ATP) production. In addition to the role of enzyme
control, proteins have been implicated in most of these diverse physiologi-
cal processes. Thus, studies on the structure-function relationship of
proteins have become increasingly important in recent years. Because of
the abundant literature available on enzyme regulation, the present i~vesti-
gation will be restricted to studies on only certain· aspects of nonenzyme-
protein interactions. In both enzymic and nonenzymic proteins the type of i
regulation exerted depends on the type of interaction with the protein
structure.
(
2.
protein structure in its present form of understanding consists of
four levels of organization: primary, secondary, tertiary, and quaternary
levels. The covalent attachment of the amino acids in the polypeptide
chain or chains in a protein is termed the primary structure. The secondary
structure consists of any folding or twisting of the primary sequence due to
hydrogen bonding between the individual amino acids. Forces such as electro
static attraction or repulsion cause further winding or looping of the poly
peptide chain, and this three dimensional arrangement is called the tertiary
structure or conformation of the protein. Quaternary structure is observed
only in proteins which contain more than a single polypeptide chain and is
due to the association of the individual chains through non-covalent bonding.
In ·.nonpolymeric proteins,such as serum albumins, interactions with small
ions, neutral molecules, etc. are generally observed as tertiary level
changes. However, in polymeric proteins these interactions are observed
as quate~nary-structure changes, or changes in the association or dis
sociation of the polypeptide chains. Since the association and dissoci
ation processes are characterized by molecular-weight changes, polymeric
protein interactions at the quaternary level may be followed with techniques
commonly used for measurement of molecular weights.
Among these techniques, ultracentrifugation and electrophoresis have
been most frequently used for protein-interaction studies. Such studies
are now also being carried out with gel-chromatographic technique, which
had been applied so far mainly for the fractionation and purification of
3.
macromolecules. Recent applications of both ultracentrifugation and gel
chro~atography indicate their usefulness in measuring protein dissociation
caused by interactions with solutes (Schachman and Edelstein, 1966;
Fairclough and Fruton, 1966; Wood and Cooper, 1970). The commonly used
depolymerizing agents (urea, guanidinium salts, and detergents) often
force the equilibrium irreversibly to the monomeric species, and their
use in dissociation studies is less desirable, since the protein may
also undergo denaturation. Ansevin and Lauffer (1959) and Guidotti and
Craig (1963) demonstrated that a number of polymeric proteins such as
tobacco mossaic virus protein, hemoglobin, cytochrome, etc. undergo
association and dissociation as a function of concentration, the monomeric
species being favored at low concentrations. Dilution, a mild method, can
be used in dissociating polymeric proteins, but complete conversion to
monom~ric species is·possible only at very low protein concentrations.
Hence, the measurement of dissociation upon dilution becomes limited to
methods in which changes in the molecular weights at very low concen-
trations can be detected. These concentration ranges are usually below
the operating limits of conventional osmometers and light-scattering
instruments. Both ultracentrifugation and gel-filtration techniques have
been shown to be useful at lower ranges of protein concentrations
• (Klapper et.al., 1966; Winzor et.al., 1967). However, ultracentrifuges
require complicated absorption optics and are very expensive instruments.
Theref.ore, gel-filtration technique is being chosen by many workers to
study the molecular-weight changes in proteins. Winzor and Scheraga (1963)
4.
have experimentally shown for the first time all the theoretically pre-
dieted transport features for gel chromatography. Since then, the
dissociation-association phenomenon of several polymeric proteins has
been studied by gel-chromatographic technique (Kakiuchi et.al., 1964;
cowman and Swaisgood, 1966; Henn and Ackers, 1969; Winzor et.al., 1967).
Gel chromatography is, also, a rapid method for studying homogeneity of
proteins, and as such can be used for studying many aspects of protein
interactions. Kellett (1967), in a critical review of the methodology,
has listed the major advantages of gel filtration over ultracentrifugation
for the study of rapidly interacting systems. In addition to such ad-
v~ntages, the flexibility and simplicity of operation of gel-filtration
technique make it the method of choice in this investigation whose major
emphasis will be on interactions at the quaternary level of the protein
s true ttire.
Interactions at this fourth level have been studied in some im-
portant biological proteins such as hemoglobins, hemocyanins, and
hemerythrins, all of which function as oxygen carriers. Among these,
the. hemerythrins are unique in that they provide an almost perfect model
to study subunit interactions since these proteins consist of identical
subunits (Groskopf et.al., 1966), and possess distinct allosteric sites (
(Keresztes-Nagy and Klotz, 1965) for binding with oxygen (Klotz and Klotz,
1955), anions (Keresztes-Nagy and Klotz, 1965), and mercurials (Keresztes-
Nagy and Klotz, 1963). In addition, the macromolecular properties of
hemerythrins have been well characterized (Keresztes-Nagy and Klotz, 1965).
5.
Therefore, hemerythrin will b~ used as a p:ototype macromolecule in the
present investigation of protein interactions.
Hemerythrin, the non-heme oxygen-carrying protein of sipunculid
worms, may be considered as a primitive hemoglobin. It is found in
the blood of these worms circulating through a minute vascular network
(~ 4 µl capacity) and a large coelomic cavity (2-3 ml capacity) located
in the tail portion of the animals. In contrast, hemoglobin, the most
important respiratory pigment of higher vertebrates, is found in very
well developed vascular systems. Hemoglobin is also known to consist
of interacting subunits which give rise to a complex oxygen-transport
function, but unlike in hemerythrin, these subunits are nonidentical.
' Some structure-function correlations have already been carried out in
hemerythrins isolated from various species of sipunculid worms (Klapper
and Klot.z, 1968a; Langerman and Klotz, 1969; Duke et.al., 1971).
During these studies, hemerythrin of the sipunculid worm, ~ I
Golfingia· gouldii, has been found to have a molecular weight of 107,000
' (Klotz and Keresztes-Nagy, 1963) and to contain sixteen iron atoms,
which bind with 8 moles of oxygen (Klotz and Klotz, 1955; Boeri and
Ghiretti-Magaldi, 1957; Klotz and Keresztes-Nagy, 1963). Sulfhydryl-
group titrations with mercurial reagents (Keresztes-Nagy and Klotz,
1963) showed that unreacted sulfhydryl< groups. are necessary for the
structural integrity of hemerythrin, since this reaction caused a
dissociation of the protein into eight subunits. These subunits have
been shown to be identical (each containing two iron atoms, one sul-
6.
fhydryl group, and a molecular weight of 13,500) by both ultracentri
fugation (Klotz and Keresztes-Nagy, 1963), and sequence studies (Groskopf
et.al., 1966). Keresztes-Nagy and Klotz (1965) showed that the sulfhydryl
group-mercurial reaction of hemerythrin may be affected by exchanging the
oxygen at the iron atoms with anions (ligands). Such anionic coordina-
tion to iron has also been observed in other iron-containing proteins.
In hemerythrin, coordination to the iron was seen in both the octameric
and monomeric states (Keresztes-Nagy and Klotz, 1965). The strength and
stoichiometry of the coordination by the various anions has been obtained
from the absorption spectra of the complexes. In both octameric and
~onomeric forms of hemerythrin the iron-ligand ratio was calculated to
be 2:1 (Keresztes-Nagy and Klotz, 1965) .. These studies also show that
each ligand affects the properties of the sulfhydryl groups to a different
extent. In addition, the binding of the anion to the iron was observed to
be stronger in the protein whose sulfhydryl groups had been previously
blocked (Keresztes-Nagy and Klotz, 1965). This interdependence of two
different sites in a protein molecule is an example of the cooperative or
allosteric interactions which have been demonstrated earlier through the
classical studies on aspartate transcarbamylase (Monad, et.al., 1965).
Keresztes-Nagy and Klotz (1965) have postulated two models to explain <
the observed allosteric interactions of hemerythrin; A reactive form of
the protein is assumed to result from both the 'conformational model' and
the 'dissociation model '. ' Evidence is being collected through this and
other investigations (Cress, 1971) for the correct model which can explain
the features of the observed cooperativity between the sulfhydryl and
iron sites in hemerythrin. Klapper and Klotz (1968a) represent these
two models as shown in figure 1.
7.
According to the conformation model, the iron-binding ligands pre
sumably produce change in the conformation of the native octameric protein
to a more reactive form. In contrast, the dissociation model postulates
that the iron-binding ligands produce changes in the equilibrium to pro
duce stable reactive monomers. The assumptions made in this model are:
1) a dynamic equilibrium exists between the native octameric and mono
meric molecules; 2) the anion coordination to the iron shifts this equil
ibrium towards the monomeric protein; and 3) monomeric molecules are the
reactive species. The first two assumptions have been examined by several
worke~s (Keresztes-Nagy and Klotz, 1965; Klapper et.al., 1966; Klapper and
Klotz, 1968a) in an attempt to establish the correct model for the hemery
thrin interactions. In these studies, evidence was found both for the
equilibrium and the effect of coordinating anions on the equilibrium.
However, the nature of the reactive protein species has not yet been well
defined; hence the available data (Egan, 1969; Duke et.al., 1971) could
not be explained on the basis of the dissociation model.
In a general manner, the above studies can be classified into three
broad types. 1) Subunit-subunit interactions (association-dissociation
equilibrium) in hemerythrin; 2) Anionic interactions at specific sites
in the protein; 3) Sulfhydryl group-mercurial reagent interactions.
These guidelines have been kept in mind in the designing of experiments
LINREACTIVE STATE
SH SH
......
......
......
......
'\
REACTIV~H STATE SH
SH
SH SH
SH
0 c5 0 QH OsH
SH
QqHq
Fig. 1· Schematic representation of the "conformation" and "dissociation"models.
SH
00
9.
in the present investigation so that the obtained results can be inte
grated with earlier results to arrive at a working model. The status of
earlier work will now be briefly reviewed in order to evaluate the specific
problems that have been undertaken in this study.
1). First, the evidence for the existence of an association
dissociation equilibrium in hemerythrin will be considered. Both ultra
centrifugation (Klapper et.al., 1966) and hybridization (Keresztes-Nagy
et.al., 1965) methods were employed. The hybridization experiments in
volved electrophoretic studies on succinylated and native hemerythrin.
Succinylation results in molecules with two additional negative charges
for each reacted-lysine residue. If hybridization occurs between the
succinylated and native proteins, octamers with intermediate electro
phoretic mobility should be found. Such hybridization has been shown
experimentally (Keresztes-Nagy et.al., 1965), which proves that the moµo
mers an~ the octamers are in a dynamic equilibrium. Although the co
existence of octameric and monomeric forms has been shown by high-speed
ultracentrifugation experiments, the reversibility and, thus, the dynamic
nature of the equilibrium has not been demonstrated (Klapper et.al., 1966).
In addition, these workers interpreted their sedimentation data to be
indicative of a slow rate of dissociation. However, a controversial ·
problem with ultracentrifugation experiments is the ~a-called 'pressure
effect', which is postulated to cause changes in the partial-molal
volume of the protein species under equilibrium (Joseph and Harrington,
1966; Ikkai and Ooi, 1969; Penniston, 1971). Even though Langerman
10.
(1969) discounts the effect of pressure on the dissociation of hemery
thrin, it is imperative to compare the sedimentation data with other
techniques. Our preliminary experiments (Rao and Keresztes-Nagy, 1968)
were designed to make such a comparison, and in contrast to the ultra
centrifugation data of Klapper et.al. (1966), a fast rate of equilibrium
was observed. But only the advancing profiles of frontal-gel-chromato
graphic-elution patterns were analyzed for this comparison. Recently
Ackers (1970), outlined how to use the trailing boundaries in frontal
elution-chromatography experiments to obtain a better comparison with
sedimentation velocity data. Accordingly, the present studies on sub
unit interactions (dissociation-association equilibrium) were examined
both for the existence of an equilibrium and the rate of attainment of
equi~ibrium.
2-a) Evidence for the effect of anions on the dissociation equili
brium. has also been obtained by two different methods. Klapper and
other workers (1966) used two hemerythrin systems, one containing the
iron-coordinating ligand, thiocyanate, and the other no coordinating
ion, in their ultracentrifugation studies. In these studies, they showed
that the amount of monomeric form appeared to be the function of the presence
or absence of the ligand. At each<concentration studied, more monomer was
found in the thiocyanate-coordinated protein solutions. The ion-binding
procedure of Klapper and Klotz (1968b), also demonstrated that the dis
sociation of hemerythrin is affected by the presence or absence of iron
coordinating ions. The 'dissociation model', if exprsssed in terms of
11.
affinity, assumes that the monomer has a greater affinity for the ligand
than the octameric protein. In other words, the binding of the ligand
should increase with dilution since more monomers are being formed. The
binding studies showed that such an increase in the apparent binding
affinity does occur by dilution.
Both in the ultracentrifugation and binding experiments, the
effects of only one ion, thiocyanate, was studied. This anion is a
non-biological ligand which may catalyze the formation of monomers having
oxidized sulfhydryl groups incapable of reassociation. The extent of
dissociation in the presence of anions other than thiocyanate is small at
high protein concentrations. The operation of the ultracentrifuge is
rather cumbersome at low concentrations. Only recently, Langerman and
Klotz.(1969) applied ·improved Schlieren optics for dissociation studies
on hemerythrin azide by the sedimentation-equilibrium method. Gel-chroma-
tographic technique may be an easier (operationally) procedure for studying
anionic interactions and hence it was one of the aspects examined in our
preliminary studies (Rao and Keresztes-Nagy, 1968). The shift of the
dissociation equilibrium by the iron-coordinating ligands from an un-
reactive (native) state to a reactive state (in which the sulfhydryl
(
groups are more accessible) should be apparent through an increase in the
reactivity and dissociability of the protein. Indeed such an increase has
been found in the reactivity from kinetic studies (Keresztes-Nagy and Klotz,
1965; Fransioli et.al., 1968), and in the dissociability from gel-chroma-
tographic experiments (Rao and Keresztes-Nagy, 1968) .' Both studies showed
12.
that the magnitude of the increase depends on the nature of the coordin
ating anion. In general, greater dissociation was observed with ligands
more strongly bound to the protein, and accordingly, the anions can be
arranged in the order of increasing effect on the dissociation as HzO,
o2
, F-, N3-, cl- and SCN-.
2-b). The first indication that iron-coordinating anions may also
affect some site(s) other than iron atoms came from electrophoretic
studies of Keresztes-Nagy and Klotz (1965). These investigators reported
that the isoelectric point of methemerythrin is shifted in the presence
of chloride ions. More recently, Fransioli (1969) observed an increase in
the rate of reaction of sulfhydryl groups or oxyhemerythrin with mercurial,
as the level of chloride ion in the reaction mixture is increased. Both
the above findings have been explained on the basis of an interaction
between the sulfhydryl groups and a second anion-binding site in the
proteiµ, most probably to its side chains. Fransioli (1969) also postu
lated from -SH group reaction studies that the second site has a greater
effect on the behavior of sulfhydryl group, compared to the effect resulting
from iron coordination. This finding can lead to a hypothesis in which the
ligand effects can be considered as those arising primarily from non-iron
bindings. Changes in the coordina~ion spectra may accordingly be assumed
to occur later in time due to subsequent chloride binding to the iron
atoms. Such a hypothesis appears tenable in view of parallel observations
of Darnall and coworkers (1968) with some specific ions such as per
chlorate, nitrate and sulfate. Garbett et.al. (1971a) recently further
substantiated the existence of non-iron interacting sites for these ions
13 .
. in the hemerythrin molecule. They calculated the binding affinities of
the iron-coordinating ions, thiocyanate, azide, and chloride in the
absence of perchlorate ions. These values are found to be higher than
earlier results of Keresztes-Nagy and Klotz (1965), which were obtained
with perchlorate-containing hemerythrin solutions. Garbett et.al. (197la)
similarly obtained lower values of binding constant for thiocyanate in the
presence of perchlorate and nitrate ions. The conclusion of these
findings is that some specific ions, such as perchlorate and nitrate
ions, interact at non-iron sites in hemerythrin. These sites may possibly
be identical to chloride non-iron binding sites. Therefore, we have
checked this possibility with direct binding experiments on Sephadex G-25
columns in the present investigation.
Both Darnall et.al. (1968) and Garbett and his associates (197la)
reported that the association properties of hemerythrin are altered by
non-coordinating ions, perchlorate, nitrate, and sulfate. An ultracentri-
fugation method was used for observing the dissociation behavior of
oxyhemerythrin in the presence and absence of perchlorate ions. The
amount of dissociation was shown to be decreased by these ions. For
reasons mentioned before, we have also compared this ultracentrifugation
data with our gel-chromatographic experimental results. <
We extended the work on non-coordinating ions (Garbett et.al.,
197la) to coordinating ions, mainly to examine the effects of iron-
complexing ions (such as chloride and thiocyanate) at other possible
sites in the hemerythrin molecule. Furthermore, one may ask the question,
what will be the effects of such non-iron binding on the molecular
14.
properties of hemerythrin? This question has already been answered in
part by Fransioli (1969), who showed that the reactivity of sulfhydryl
groups increases as the chloride level is raised. Therefore, one of the
aims of this study is to provide further information for understanding
anionic interactions. Accordingly, we have studied the dissociation of
oxyhemerythrin at various levels of chloride- ion concentration and ex
amined the behavior of chloride-hemerythrin complex prepared by different
procedures. Also, the rate of iron-coordination was simultaneously
observed and correlated with changes in dissociation.
3). Sulfhydryl-group interactions with mercurial reagents have been
studied in many proteins, and understandably so, since sulfhydryl groups
have been implicated in such diverse functions as catalytic activity
(Boyer, 1959), active-site binding (Coombs et.al., 1964; Riggs, 1952;
1959), and structural stability (Madsen, 1956). Hemerythrin has been no
exception for its share of interest, especially because controversy still
exists regarding the behavior of sulfhydryl groups with mercurials. Most
of the work attempted to delineate the mechanism of oxygen transport, and
the so-called 'all-or-none' behavior of sulfhydryl groups.
a). The frequent presence of sulfhydryl groups in the active
sites of enzymes suggests their involvement also in hemerythrin. Klotz
et.al. (1957) attributed the direct involvement of sulfhydryl groups in
the binding of oxygen from their observations on the iron: sulfhydryl group
and the sulfhydryl group : oxygen ratios. These investigators, hence,
postulated iron-sulfur linkages of the type found in some other nonheme-
15.
iron proteins (Brumby et.al., 1965). But, later studies (Klotz and
Keresztes-Nagy, 1963; Keresztes-Nagy, 1965) showed that the iron and
sulfhydryl groups of hemerythrin are at different sites. In the absence
of urea, the sulfhydryl groups reacted with mercurials and the protein
subsequently dissociated with an accompanied loss of oxygen. Also, no
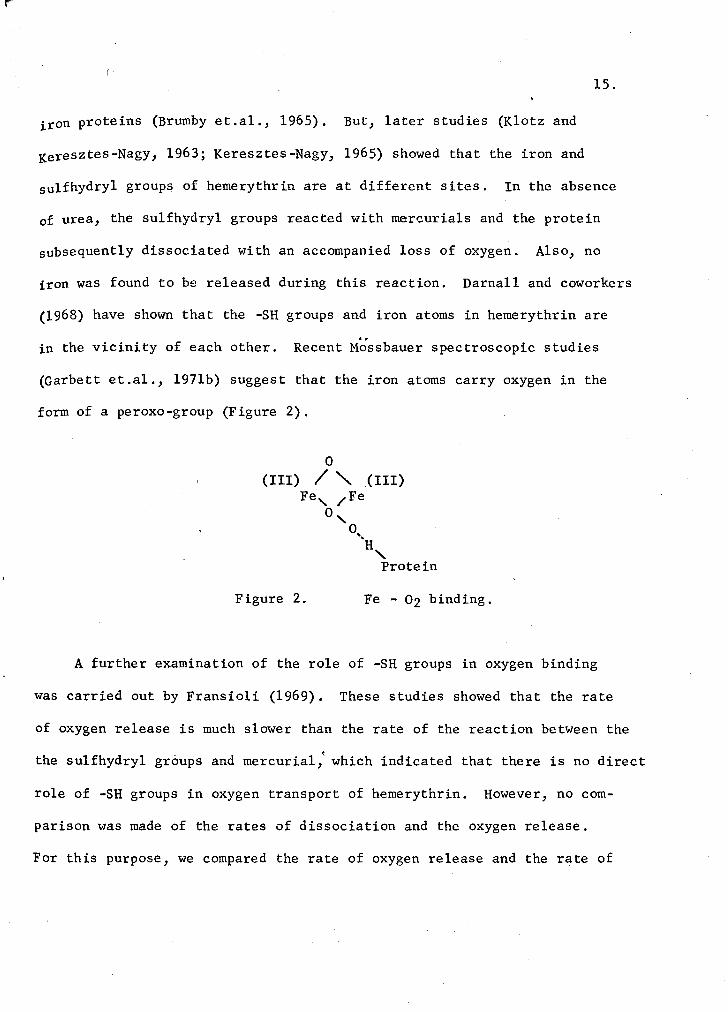
iron was found to be released during this reaction. Darnall and coworkers
(1968) have shown that the -SH groups and iron atoms in hemerythrin are
in the vicinity of each other. Recent M~ssbauer spectroscopic studies
(Garbett et.al., 197lb) suggest that the iron atoms carry oxygen in the
form of a peroxo-group (Figure 2).
0
(III) /' " (III) Fe, /Fe
o, 0, ·H,
Protein
Figure 2. Fe - 02 binding.
A further examination of the role of -SH groups in oxygen binding
was carried out by Fransioli (1969). These studies showed that the rate
of oxygen release is much slower than the rate of the reaction between the
(
the sulfhydryl groups and mercurial, which indicated that there is no direct
role of -SH groups in oxygen transport of hemerythrin. However, no com-
parison was made of the rates of dissociation and the oxygen release.
For this purpose, we compared the rate of oxygen release and the rate of
16.
monomer formation during the mercurial -SH group reaction. This
comparison allowed the evaluation of the indirect participation of the
sulfhydryl groups in the oxygen binding.
b). In addition to any possible role (direct or indirect) in
catalytic functions such as oxygen transport, the sulfhydryl groups have
been shown to be of importance in maintaining the polymeric structure of
proteins. Of greater interest is the 'all-or-none' manner in which
sulfhydryl groups of some proteins react with the mercurial reagents.
such behavior was originally observed by Madsen and Cori (1956) in their
classical studies on phosphorylase. Takenaka and Schwert (1956) observed
the 'all-or-none' reaction with muscle lactic dehydrogenase. In hemery-
thrin, similar behavior was shown by Keresztes-Nagy and Klotz (1963) from
studies with p-chloromercuribenzoate, a mercurial reagent. Experimentally,
the 'all-or-none' dissociation is considered as a 1:1 linear relationship
between the percent of dissociation and the extent of reaction of the
sulfhydryl groups. Such a relationship means that at any instant in the
reaction with the mercurial, undissociated but already reacted octameric
species do not exist, and that the rate of reaction is identical with the
rate of subsequent dissociation. In spite of numerous studies by various
research groups (Egan, 1969; Klapper and Klotz, 1968b; Klapper, 1970; <
Duke et.al., 1971), the mechanism of the 'all-or-none' reaction of hemery-
thrin sulfhydryl groups is not well understood. Any contribution to the
understanding of the sulfhydryl-group interactions will also be important
in choosing the correct model for the allosteric interactions in hemerythrin.
17.
Hence, it was logical to investigate the nature of reactive species of
hemerythrin. For this purpose, comparative studies on the rate of reaction
and dissociation have been carried out in the present study.
It should be noted here that Egan (1969) has postulated a prereaction-
binding step by mercurial in explaining the observed rates of reaction of
sulfhydryl groups of different hemerythrin-ligand complexes. Similarly
Duke et.al. (1971) also reported a rapid binding by mercurial at non-
sulfhydryl sites in the hemerythrin molecule. However, neither of these
studies conclusively proved whether the mercurial-binding step occurs
-before or after the reaction with the sulfhydryl groups. Therefore, by
employing rapid-mixing procedures, we have examined the nature of the
·pre-binding step with gel-chromatographic technique.
In view of the many facets of hemerythrin interactions that have been
studied during the c9urse of this investigation, the specific problems
will be reiterated here. I.) The characterization of the dissociation
equilibrium. II.) The quantitative features of anion binding at iron and
non-iron sites. III.) The examination of the postulates offered for the
'all-or-none' behavior of hemerythrin sulfhydryl groups.
!:" ..
18.
CHAPTER II
MATERIALS AND METHODS
MATERIALS:
All chemicals and reagents were obtained from commercial sources
and were used without further purification or modification. The marker
proteins were also purchased from commercial sources.
Both Phoenix (Texas) and Chromatronix (California} columns have
been used. The sizes and modifications (if any) are mentioned in the
various experimental procedures.
Buffer solutions were made from commercial Tris (hydroxymethyl)
aninomethane (pK 8.2) and ca~odylic acid (dimethyl arsenic acid, pK 6.2).
Chlorine-36 (essentially carrier free) was obtained from General
Nuclear Inc., Houston, Texas, in the form of hydrochloric acid.
Golfingia gouldii were purchased from Marine Biological Laboratories,
Woods Hole, Mass.
Isolation and purification of hemerythrin:
Preparation of oxyhemerythrin was carried out in the cold room
. ' using the following procedure, adapted from the original method of Klotz
et.al. (1957). Live worms were slit in the abdomen and the coelomic fluid
was collected. Visceral debris was removed along with fibrin by filtering
through glasswool after whipping with a glass rod for several minutes.
(' 19.
The filtrate was transferred into glass centrifuge tubes and centrifuged
for 20 minutes at 0°C and 2,000 rpm. The supernatant plasma was discarded
and the erythrocytes were washed and centrifuged with 2.5% cold saline
solution until the supernatant was clear. The intervening white layer of
fat was removed and discarded before laking the cells in triple-distilled
water at 5°C. The cell debris was removed by centrifugation at 0°C and
2,000 rpm for 2 hours. The supernatant, which contains the oxygen-carrying
protein of the worms, was transferred to plastic centrifuge tubes for
centrifuging at 30,000 rpm and 0°C for 2 hours. This process removed the
remaining fat from the supernatant solution, which was then dialyzed
against one liter of cold 20% ethanol for 12 hours. The red crystals of
oxyhemerythrin so obtained were washed 3-4 times with the dialysate and
the supernatant was discarded. The centrifuge tube containing the
crystalline protein was then stoppered and frozen till further use.
Conversion of oxyhemerythrin into coordination complexes:
Aquomethemerythrin: 40-50 mg of crystalline oxyhemerythrin were
dissolved in 10 ml of 0.01 M pH 7.0, Tris-cacodylic acid buffer. The
solution was centrifuged for 15 minutes at 0°C and 10,000 rpm and any
undissolved solid material was discarded. A small amount (5-10 mg) of
sodium fluoride was added until the(violet-pink color of the oxyhemerythrin
solution changed to the pale yellow color of methemerythrin fluoride com
plex. The protein was dialyzed against a liter of O.OlM, pH 7.0 Tris
cacodylate buffer for 6 hours. The dialysate solution was changed 3-4
20.
times, at 4-6 hour intervals. The resulting aquoprotein was then examined
in a Beckman DB-G spectrophotometer, for comparison with the previously
reported absorption spectra (Keresztes-Nagy and Klotz, 1965).
Other complexes of hemerythrin:
The aquohemerythrin prepared as mentioned above, was converted into
the chloro complex by dialyzing against Tris-cacodylate buffers containing
0.05M sodium chloride before the final dialysis against 0.5M c1-.
For the series of experiments carried out in increasing concen-
trations of chloride ion, the oxyprotein solution was equilibrated at
room temperature with the buffer solution containing the chloride ion for
15-25 minutes.
Similarly, in the experiments with non-iron-coordinating ions
(Clo4-, Br-, CH3coo-) equilibration was performed with buffer solution
containing O.lM of the ion to be used.
Preparation of pMB solution.
40-50 mg of p-chloromercuribenzoate was dissolved in 20 ml of
O.OlM, pH 7.0, Tris-cacodylate buffer by vigorous stirring. The solution
is centrifuged at O~ and 10,000 rpm for 15-20 minutes, to remove any un-
dissolved pMB, and other solid impur~ties. The supernatant was then made .
up to volume to give the required concentration with the Tris-cacodylate
buffer. The solution was stored at 0-5°C in an amber-colored container to
protect against light.
21.
The concentration of the pMB solution was obtained from its
extinction coefficient (4.8 x 10³, Boyer, 1954) at 250 nm.
Determination of hemerythrin concentration by iron analysis and from
molar-extinction coefficients:
The iron content of the hemerythrin solutions was determined by
the ortho-phenanthroline method. A 1:10 dilution of the protein solution
was made by adding 2.70 ml distilled water to 0.30 ml of hemerythrin. To
this diluted protein, 5.0 ml of 0.88 M hydroxylamine hydrochloride were
added. The iron, which is quantitatively released in the acidic environ-
ment, was spectrophotometrically read at 510 nm as an iron-ortho-
phenanthroline complex. From the absorbance of the iron-complex, the
concentration of the protein was obtained with the aid of a calibration
graph (Keresztes-Nagy, 1962). Keresztes-Nagy and Klotz (1965) had earlier
reported a specific absorbance of 2.73 for hemerythrin at 280 nm. Accord-
ingly, the protein solutions were read in a 1.0 cm cell against the
dialysate at 280 nm and the concentrations were calculated from the
specific absorbance. At this wave length,the tryptophan, tyrosine, and
phenylalanine residues in the protein specifically absorb and hence, the
protein concentrations determined at 280 nm reflect the total protein (
absorbance. The near UV and visible peaks which, ip general, appear
between 330 and 500 nm depend on the ligand concentration.
General chromatographic procedures for dissociation studies:
A small amount of water is added to a vertically mounted Chroma-
22.
tronix column [1.5 cm (internal diameter) X 65 cm] and the outlet plunger
was closed with a teflon plug. A 1-2 cm height of swollen Sephadex G-25
coarse gel was added to protect the bed support.
The Sephadex gel was prepared by soaking the dry Sephadex in an
excess amount of Tris-cacodylate buffer (0.01 M; pH 7.0) for three days
after the removal of fine particles by decantation. The column was
filled with the slurry (2:1 ratio of buffer to gel particles) and after
the settling of some gel particles, the outlet plunger was opened and the
buffer was allowed to flow slowly. The remaining slurry was then added
so that the column was finally filled to a bed height of approximately
· 50 cm, taking care that the gel particles were never allowed to settle
completely before the addition of more slurry. The outlet was closed off
again and the jacket·was installed. The bed support of the inlet plunger
consisted of a 10 micron filter membrane; a 40 micron (pore size) teflon
cloth was then introduced into the top of the column. The bed support
ensures the uniform application of sample solutions. The excess solvent
was removed by gently pushing the plunger into the column until it was
horizontally flush with the gel particles. The inlet plunger was fixed
in this position by tightening the screws on the collar of the plunger-.
The inlet-plunger tubing was connect~d to the sample injection valve.
The sample injection valve, in turn, was connected to the Chromatronix
pump, which had previously been purged with compressed air and the solvent
reservoir filled with buffer. Compressed air at a pressure of 80 guage
pressure per square inch (P.S.I.G.) was fed into the pump. The,
23.
connections were made by high-pressure teflon tubing (0.138 cm O.D.,
0.068 I.D .) and Chromatronix-Cheminert fittings which allowed pressure-
tight joints and insured uniform flow. The gel particles were washed
several hours so that the gel bed could come to an equilibrium height.
The sample injection valve had two alternate flow paths, and the solvent
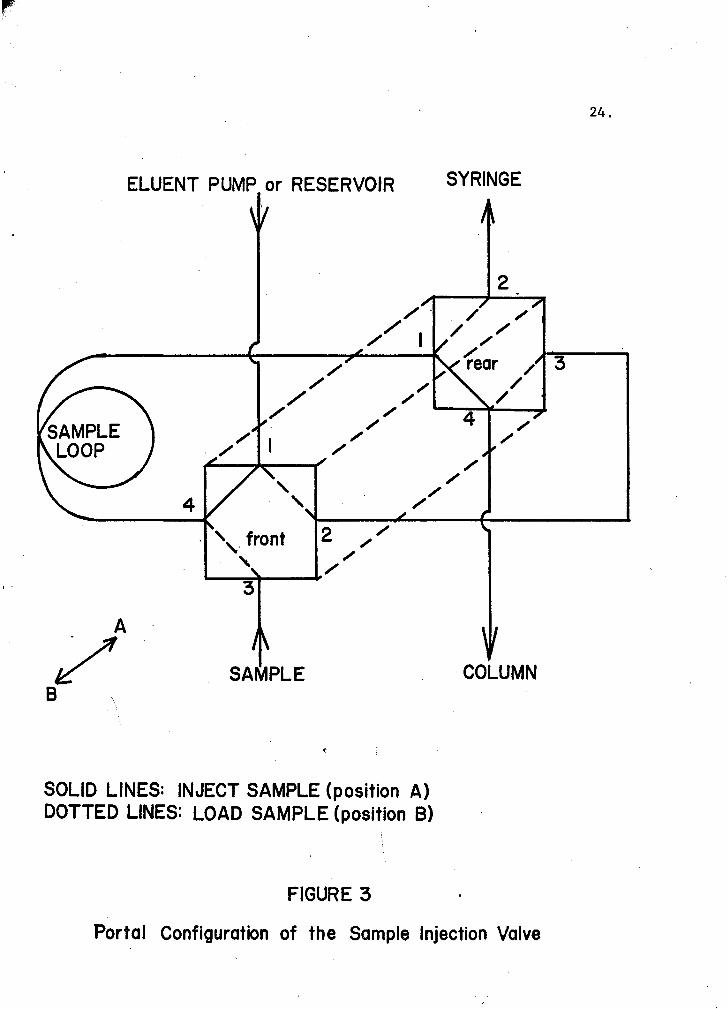
could be switched from one to another by the push bar on the valve. The
portal configuration of the sample injection valve appears in Figure 3.
A brass pressure gauge (0-50 P.S.I.G.) was connected via a "tee"
to the tubing which fed the solvent to the injection valve. The guage
was isolated from the system to avoid the introduction of dead volume in
the inlet tubing of the column. Both 12 ml/hr. and 24 ml/hr. flow rates
were used in the investigation. The outlet plunger was connected to a
Beckman flow cell (0.3 ml capacity, 0.1 cm light path) by 20 cm teflon
tubing (0.1 ml-dead volume) and the effluent solution was measured in a
10 ml burette. The concentration of the sample solution determined the
wave length chosen, such that the absorbance value was between 0.1 to 1.0
absorbance units. At low concentrations where the absorbance values are
below 0.1, a scale-expansion unit was used to amplify the absorbances. The
absorbances were recorded with a 10 inch linear-log recorder. The stock
protein was diluted very accurately to obtain the required hemerythrin '
concentration. With the aid of the laboratory vacuum, teflon loops were
filled with this diluted-protein sample whose volume (20-30 ml) was
sufficient to produce an absorbance plateau in the elution profile. The
solution profile obtained from such large samples is called frontal-elution
chromatograms. The mixing of the sample with the solvent during sample
A
/ B
ELUENT PUMP or RESERVOIR SYRINGE
2
/ / /
/ /
4
/ / /
/ / ./ /
' '
SAMPLE
2 / /
/ /
/
/ /
/
/ /
COLUMN
SOLID LINES: INJECT SAMPLE (position A) DOTTED LINES: LOAD SAMPLE (position 8)
FIGURE 3
Portal Configuration of the Sample Injection Valve
24.
25.
application was avoided by also connecting an empty loop (0.8 ml volume)
at the end of the sample loop. The exclusion volume of the column in each
experiment was obtained by introducing 0.1 ml of blue dextran (1 mg/ml)
into the sample loop. The sample loop was then connected to the injection
valve and the protein sample together with the blue dextran was applied on
the column by pushing "in" the push bar of the valve. After the sample was
applied on the column, the push bar is pulled "out". The wave length at
which the protein was monitored and the scale expansion for recording the
absorbances were selected according to the protein concentration. For
example, a 100 µg/ml solution was monitored at 280 nm, where its absorbance
was 0.27. At the same wave length a 10 µg/ml solution would yield a 0.027
absorbance value and hence, such a solution was monitored at 210 nm, where
it gave an absorbance of 0.3. The scale expansion unit was used for
solutions which have low absorbance values when measured at 210 nm. Am
plifications of 2 to 5-fold were used for solutions in the range of 10-
25 µg/ml protein concentration. The elution pattern was recorded at a
chart speed of 12 inches/hour. Since with the sample injection valve, the
sample was applied on the column without any change in flow rate, the
elution profiles could be directly evaluated for centroid volumes (V).
In the experiments in which the effect of various anions was
under consideration, the column is preequilibrated with the buffer solution
containing the particular ion. The concentration of the ion used was 0.1 M
except in the case of chloride ion, which was varied from 0.1 to 0.5 M.
26.
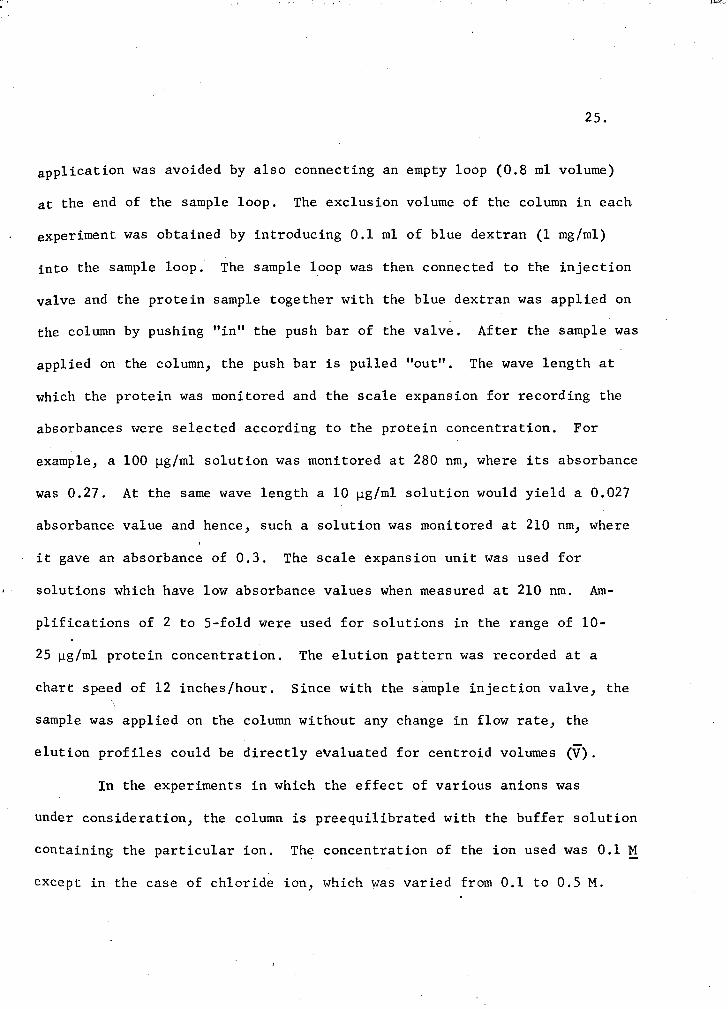
All the dissociation experiments were maintained at 25° with a Braun
Thermomix II regulator. Schematically, the monitoring set up is shown
in Figure 4.
column calibration procedure:
Marker proteins having molecular weights in the range between the
hemerythrin octameric and monomeric values of 107,000 and 13,500 were used
for calibration purposes. Elution volumes were calculated from the in-
flection points (1/2 C0 , the plateau concentration) of elution diagrams
which were obtained by the application of 15 ml samples at a concentration
of 1-2 mg/ml.
The exclusion volume (V0 ), and the total bed volume (Vt) were
derived through the application of 15-20 ml (mg/ml) of blue dextran and
potassium chromate (K2Cro4) solutions to the column. The internal volume
(Vi) of the column was calculated from the relation Vi =Vt - Vo. The
partition coefficients (diffusion coefficients) are defined as Ve-Vo Vi
(Appehdix I) and were evaluated from the elution volume values of the
standard marker proteins.
Treatment of elution data:
The weight-average partition 'coefficients (aw) for hemerythrin at
the various protein concentrations corresponding to the plateau region
of the elution diagram were obtained by measuring the centroid position
(V) of the ascending edges of the elution boundaries according to the
relationship derived by Ackers and Thompson (1965): = V - Vo
Vi where V = 1
co Co J Vdc. 0
First moments (Longsworth, 1943) of the '
27. .·· .. ..
·'
Fig. 4. Schematic of the monitoring set up
for Sephadex Columns. z
wQ .....Jl-w O..U>. ~IJ.J=.J
<(~~ CJ)_
JO
c .2 0-cr: c:: c w c Q)
C o.E )( ..c:
~ er: ..c: G> 0 O:!:a>C
IJ.Ju 3: -s :::
oC
(!) I
CD c
er: U)
f1 rn ~L- CiJ .gr-
I
I I
( ,.
28.
leading edges were used as the centroid volumes in the frontal elution
experiments at different protein concentrations. Sample calculations are
shown in Appendix II.
The properties of the elution patterns were examined in terms of
Gilbert's postulates (1955) for interacting systems as outlined by Winzor
and Scheraga (1963). To facilitate comparison of our data with previous
sedimentation velocity studies (Klapper et.al., 1966), we prepared first
derivative curves of the elution patterns, and plotted versus the elution
rates [the ratio of the elution volume (V) of the derivative peaks to
the total volume of the column (Vt)J of the slow and fast components of
the trailing boundaries against the plateau protein concentrations.
Gel-filtration studies on the rates of dissociation and reaction of
hemeyrthrin - SH groups with pMB.
The reaction was started in 4.0 ml spectrophotometric cuvettes by
mixing hemerythrin and pMB in a 1:2 mole ratio, the actual concentrations
-5 4 being 6.0 x 10 and 1.2 x 10- M respectively. The progress of the
mercaptide-bond formation was followed by measuring the increase of
absorbance at 250 nm in a Beckman DU spectrophotometer (Boyer, 1954).
At appropriate intervals, 0.10 ml aliquots were removed from the cuvette
and injected through a Chromatronix valve to the top of a 1.2 x 60 cm
Chromatronix column packed with Sephadex G-75 gel. The column was water-
jacketed so that the temperature was maintained at 8°C. A constant flow-
rate of 60.0 ml per hour was assured by a Chromatronix-surgeless-positive
29.
displacement pump. The effluent was monitored at 250 nm by a DBG Beckman
double-beam spectrophotometer equipped with 0.3 ml volume, 1.0 cm light
path flow cell. The temperature of the column and the effluent were
maintained constant with a Wilkins-Anderson low temperature bath. Schemat
ically, the monitoring set up is identical to that represented in Fig. 4.
Spectrophotometric-titration method for measurement of the rate of
reaction between pMB and hemerythrin-SH groups.
The specific absorbance of 250 nm of the mercaptide-bond formation
(Boyer, 1954) was followed in a Beckman DU spectrophotometer. The cell
compartment was kept at 8° with the aid. of a Neslab Tanison circulation
thermostat (Model T 23) in conjunction with a Neslab portable bath cooler
(Model PBC-4). The reaction was started by addition of pMB solution into
a 3.0 ml hemerythrin sample and absorbance readings were taken against a
blank protein solution to which the same volume of buffer as that of the
mercurial was added.
The extent of dissociation at various time intervals of the reaction
between pMB and the hemerythrin-SH groups was measured by making an addi
tional reaction solution, as explained above, from which aliquots could
be removed at various time intervals<.
The final state of the reaction mixtures, at different ratios of
mercurial and the protein, was estimated by allowing the samples to
equilibrate for several (6-8)-hours at room temperature. The percent
dissociation was obtained from the areas of the octameric and monomeric
peaks monitored at 280 nm,
30.
The end point of the reaction inall the above experiments was I
evaluated from the known extinction coefficient of the mercaptide bond
(7.2 x 10³, Fransioli, 1969).
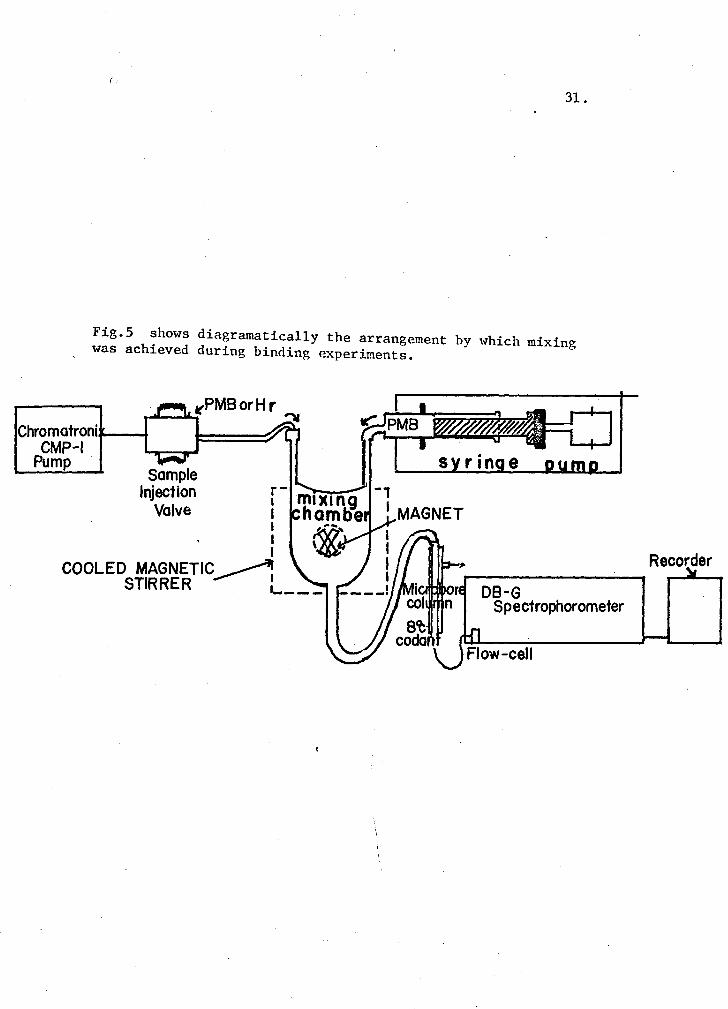
Studies on mercurial-hemerythrin binding with rapid-mixing procedures:
A 0.9 x 35 Sephadex, G-25 (coarse) column was used to demonstrate
mercurial-hemerythrin binding, in a procedure similar to Hunnnel and Dreyer
(1962). The column was preequilibrated with the desired level of pMB
before a 0.2 ml protein sample was applied with the Chromatronix injection
valve. A flow-rate of 60 ml/hr was maintained with the CMP-1 pump, and
the effluent was monitored in a microflow-cell (0.3 ml cap~city, 1 cm light-
path) at 250 nm.
In a similar manner, the binding was measured by frontal analysis
in which the protein.and pMB are mixed instantaneously before application
to the column. A 0.4 x 50 cm microcolumn (Chromatronix) was packed with
swollen Sephadex G-25 (coarse). The temperature of the column was main-
tained at 8°C by circulating ice water using the Braun Thermonix II
regulator. Continuous mixing of the mercurial and the hemerythrin solution
was achieved in a 0.-3 ml glass mixing chamber by using both CMP-1 pump
(Chromatronix) and a syringe pump a~ 12 ml/hr. The reaction mixture was
applied on the column through the outlet of the mixing chamber and the
effluent was continuously measured at 250 nm as explained earlier. Fig. 5
shows diagramatically the arrangement by which the mixing was achieved
during these experiments.
31.
Fig.5 shows diagramatically the arrangement by which mixing was achieved during binding experiments.
Chromatroni..,__ ... CMP-1
Pump · Sample
Injection Valve
08-G Spectrophorometer
Recorder
()
32.
Measurement of the rate of conversion of oxyhemerythrin in the presence
of chloride ions:
The oxyprotein was diluted into the buffer containing the required
amount of chloride, and the rate of conversion of the absorption spectra
to that of the chloro-complex was measured in a Cary-15 spectophotometer.
A blank containing the same concentration of chloride ion was used to
measure the appearance of the characteristic 385 nm peak and the 370 nm
trough in the spectra of the oxy-protein. The conversion was assumed to
be 100% when the oxy-protein diluted into the chloride ions developed the
same spectra as that of a chloro-complex obtained through dialysis pro
cedure (both solutions of identical protein concentration). At high
protein concentration, 1 cm quartz cells were used; and 10 cm quartz
cells were used to obtain spectra of equal magnitude at low protein con
centrations.
Determination of chloride-hemerythrin binding:
This procedure is identical to that of the mercurial~hemerythrin
binding, except in the monitoring of the effluent. A 0.9 x 25 cm column
was packed with Sephadex G-25 (coarse) gel and equilibrated with 0.003 M
chloride containing 0.01 M Tris-cacodylate buffer (pH 7.0). 1.0 ml oxy
hemerythrin, made in the same buffer, was applied through the injection
valve. The chloride in each 0.8 ml fraction was measured (Schales and
Schales, 1941) by titrating an aliquot with Hg (N03)2 to a purple-violet
colored end point. Diphenyl carbazone (4% alcohol) indicator and 0.1 N
HN03 were used in these titrations with a "Micro-Metric syring8 pump. A.lter
33.
a few preliminary experiments, the above procedure was modified to estimate
more conveniently the concentration of bound and free chloride. Instead of
having the chloride level in the protein sample identical to that of the
eluting buffer, higher levels were used to prepare the oxyhemerythrin
solutions. Also, the amount of sample applied on the column was increased
to 1.7 ml to obtain larger areas of protein-bound chloride. The excess
chloride was measured from the peak area at the elution position of the
salt. Various concentrations of the protein were applied to obtain the
number of moles of chloride bound to each mole of oxy-hemerythrin. These
values were then utilized in a Scatchard plot (Scatchard, 1949) to evaluate
both the number of binding sites and the strength of this binding.
S . ·11 . . d · 36c1 cinti ation-counting proce ure using :
In this procedure, the equilibrating buffer contained a small amount
of labelled chloride (36cl). The concentration of the stock radioisotope,
36cl, was determined with standard Hg(N03) 2 solution after the acidic
isotope solution(~ 4 N H36cl) was neutralized to pH 7.0 with concentrated
NaOH. An aliquot of this stock Na36c1 was then added to the buffer such
that the labelled chloride represents approximately one half of the total
chloride (0.0018 M 36
c1 in 0.003 M total chloride). Qxy-hemerythrin .samples
at various protein concentrations were prepared by ~sing 0.003M labelled
chloride in a total of 0.006 M chloride. 25.odrop fractions were collected
directly into glass scintillation vials and 10.0 ml of the scintillation
toulene-PPO solution (Sg PPO -1 liter toluene - 200 ml Biosolv-BBS-3,
Beckman) was added to each fraction. The amounts of bound and •free
34.
chloride was measured from the radioactivity of the fractions with a
Beckman LS-250 Scintillation spectrometer (counting conditions: gain 360
Ext. Std. 0.765; variable discriminator 0-8.12). The counts (CPM) were
corrected for quenching by the protein from a quenching curve.
A small aliquot of the stock was diluted to contain 5 x 10⁻²
µci/ml, and 0.1 ml of this dilution was added to each of several vials
containing 10 ml of the fluor. Various concentrations of oxy-hemerythrin
were added (0.5 ml) to these vials and counted for 10 minutes in the
spectrometer. The counting efficiencies at each protein concentration
were determined from the reduction in the counts (~10,000 cpm) of the
blank vial which contained no protein. From the External Standard Ratio
(ESR) values the quenching curve could be plotted, from which the %
efficiency was evaluated in measuring the isotope of each fraction
obtained in the binding studies.
35.
CHAPTER III
EXPERIMENTAL RESULTS
A. Calibration of Sephadex Columns:
The elution volume obtained in either a zonal or frontal chroma
tographic experiment may be utilized in evaluating both the weight
average molecular weight and the average molecular radius of the macro
molecular species under study. But first, the elution-volume value has
to be converted into a more useful parameter, the partition coefficient.
This term in turn is related to some of the physical characteristics
of standard marker proteins. In recent literature, the partition
coefficient is also known as the molecular-sieve coefficient (cr) and is
defined as shown in Chapter II. The experimentally derived elution
volumes and the calculated sieve coefficients of the marker proteins are
listed in Table I. Calibration graphs were obtained by plotting the sieve
coefficients against the logarithm of the molecular weights of the marker
proteins. These plots (Figs. 6 (G-75) and 7 (G-100) are linear
(cr = AlogM-f-B), as predicted by established chromatography theories (see
Appendix I). The values of the calibration constants A and B were 0.675
and 3.320 for the G-75 column, and 0.625 and 3.168 for the G-100 column.
The weight-average molecular weights of hemerythrin solutions were
then obtained by extrapolation of the experimentally derived elution
volume (molecular sieve coefficient, cr) to its correspending molecular
<>6 Fig. 6 . Calibration plot of Sephadex G-75 Column
O·
a
0·2
O·O w 4·0 4·2 4. 4 4. 6 4. 8 °'
I o g ( M)
0 .
Fig. 7 . Calibration Plot of G-100 Column
cp 0
b
q-. 6
(\J . 0
37.
Q an
ClO • v
v • v
0 . Qv 0
CJ')
0
38.
TABLE I
Calibration data of Sephadex G-75 and G-100 columns at 25°C.
Marker protein Elution volume in ml.
G-75 G-100
Bovine Serum Albumin 31.80 25.95
Ovalbumin 35.90 29.80
a-chymotrypsinogen 48. 70 37.10
Myoglobin 52.40 39.80
Cytochrome c - 56.70 43.25
Molecular-sieve coefficient
G-751 G-1002
0.048 0.15
0.130 0.25
0.385 0.44
0.451 0.51
0.545 0.60
Weight-average Molecular
Weight3 log (M) (M)
67,000 4.8261
45,000 4.6532
22,500 4.3522
17,800 4.2504
13,000 4.1139
1. Exclusion volume (V0 ) and internal volume (Vi) are 29.4 and 50.0 ml
respectively.
2. Exclusion volume and internal volume are 20.2 and 38.4 ml respectively.
3. Values of Determann (1969).
weight in the calibration graphs.
Conjugated proteins and highly asymmetric macromolecules are known
to deviate from a linear relationship between the molecular weight and
elution volume. For this reason, many workers (Ackers, 1964; Siegel and
Monty, 1965; Giddings et.al., 1968) believe that the molecular size rather '
than the molecular weight is best correlated with the elution volume.
Ackers (1967) derived a linear relationship between the molecular radius,
a, and the inverse-error-function complement of the column sieve co
efficient, (erfc-1 cr): a = a0 + b0 (erfc-1 cr), in which a0 and b0 are
. )
39.
column-calibration constants (not the same as A and B). Such a relation
assumes that the gel pores can accomodate all random types of molecular
sizes. The experimentally derived sieve coefficients are converted into
their inverse-error-function complements (sample conversion shown in
Appendix III), which are then plotted against molecular radii of the
marker proteins. Table II lists the values of erfc-lcr and the molecular
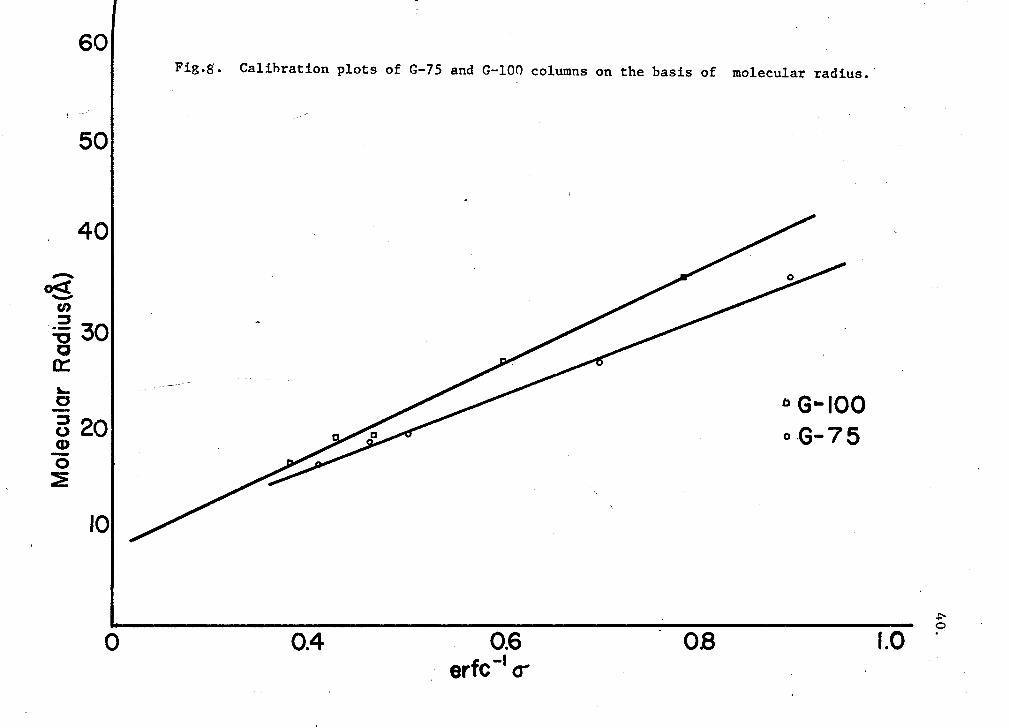
radii; Fig. 8 illustrates the linear relationship between these two
parameters. The column-calibration constants, a 0 and b0 , were 8.3 and 19
for the G-75 column and 7.5 and 24.4 for the G-100 column.
TABLE II
Calibration data in relation to molecular size
Marker protein Sieve coefficient
(cr) (1-cr) erfc-1cr G-75 G-100 G-75 G-100 G-75 G-100
Bovi!le Serum Albumin 0.048 0.150 0.952 0.850 1.398 1.180
Ovalbumin 0.130 0.250 0.870 0.750 1.071 0.813
cx-chymotrypsin 0.385 0.440 0.615 0. 560 0.614 0.546
Myoglobin 0.450 o. 510 0.550 0.490 0.534 0.466
Cytochrome c 0.545 0.600 0.455 0.400 0.428 0.371 -
From the column calibration constants a 0 and b0 , the octameric and mono-
meric molecular radii were obtained. On the G-75 column those were
15.0 + 0.5 A0 and 42.6 ± 0.5 A0, and on the G-100 column 16.2 + 0.5 A0
and 35.4 + 0.5 A0 respectively.
60
50
40
-oS U')
:::J :0 30 Q a: ....
i 201 -0 ::E
10
0
Fig.g. Calibration plots of G-75 and G-100 columns on the basis of molecular radius.·
~
0.4 0.6 erfc-• a-
0 G .. 100 o.G-75
OB 1.0 ~ 0
41.
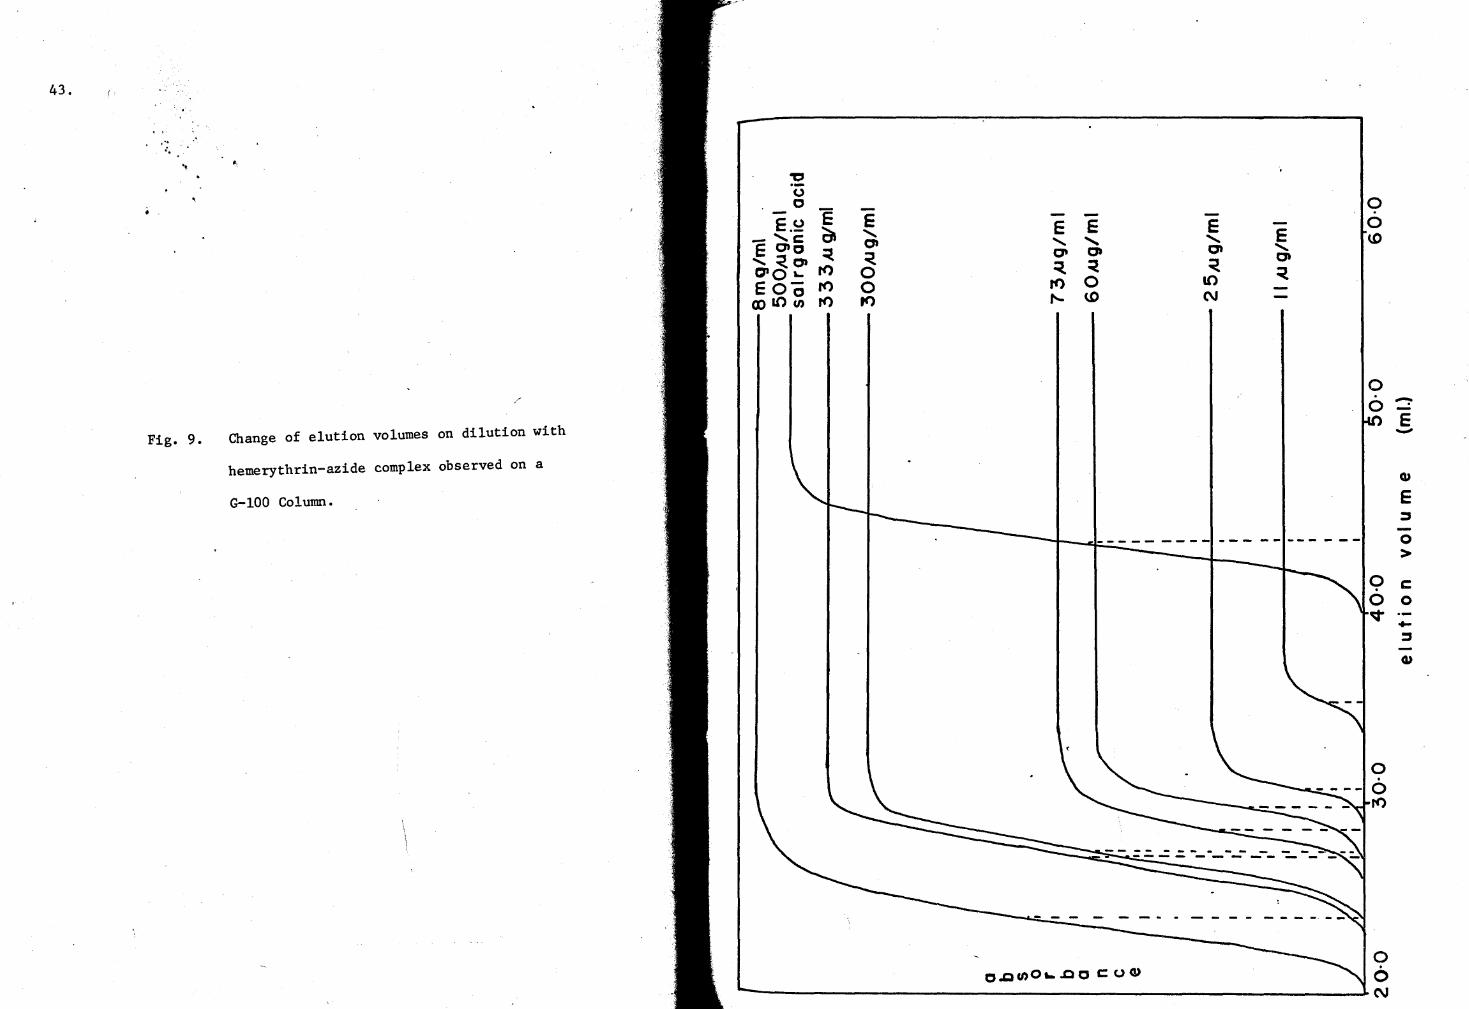
A general note on the dissociation experiments: The results of the
various dissociation experiments as presented in this chapter are organ-
ized on a logical rather than a chronological basis. The compilation
might appear discontinuous, especially because both Sephadex G-75 and
G-100 columns have been used for the study of hemerythrin interactions.
In addition, different ligand complexes of hemerythrin, were also used
in this study.
The reproducibility of the elution-volume values of experiments
similar to those in the present study had been previously (Rao, 1969)
reported to be on the order of ± 0.10 ml (± 1000 in molecular weight
value). We are aware of the small deviation (a 100 fold deviation) in
the equilibrium constant data due to such errors in the measurement of
the elution volumes(Appendix VI).
B. 1. Dissociation Experiments with Hemerythrin-azide on a Sephadex
G-100 Column:
This set of experiments was performed to demonstrate the useful-
ness of analytical-gel-chromatography method. Therefore the elution
diagrams obtained at various concentrations of hemerythrin (see Chapter II
for ,actual procedure) were examined bnly for the dissociation behavior of .
the protein. The position of the elution at any concentration was
evaluated from the centroid volume of the leading boundary of the frontal-
elution experiment (see Appendix I for related Theory and Appendix II for
a sample derivation of the centroid volume). The data from these experi-
ments are presented in Table III. The sieve coefficients of the completely
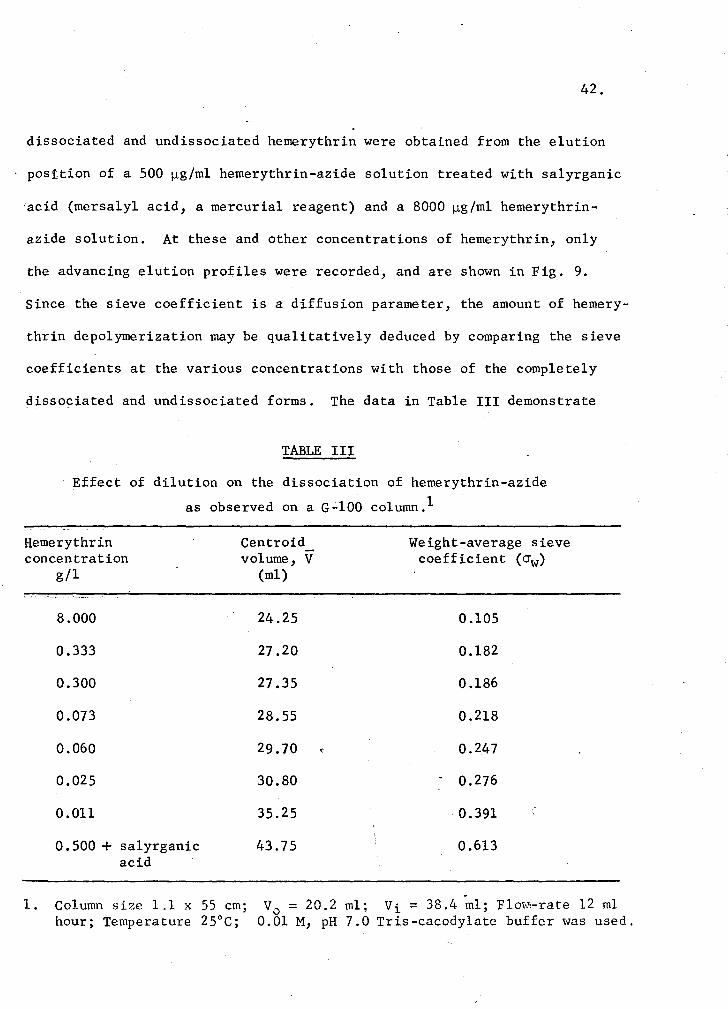
42.
dissociated and undissociated hemerythrin were obtained from the elution
position of a SOO µg/ml hemerythrin-azide solution treated with salyrganic
'acid (mersalyl acid, a mercurial reagent) and a 8000 µg/ml hemerythrin-
azide solution. At these and other concentrations of hemerythrin, only
the advancing elution profiles were recorded, and are shown in Fig. 9.
Since the sieve coefficient is a diffusion parameter, the amount of hemery-
thrin depolymerization may be qualitatively deduced by comparing the sieve
coefficients at the various concentrations with those of the completely
dissociated and undissociated forms. The data in Table III demonstrate
TABLE III
Effect of dilution on the dissociation of hemerythrin-azide
as observed on a G-100 column.1
Hemerythrin concentration
g/l
Centroid volume, V
(ml)
Weight-average sieve coefficient (crw)
1.
8.000
-0.333
0.300
0.073
0.060
0.025
0.011
0.500 + salyrganic acid
Column size 1.1 x SS cm; hour; Temperature 2S°C;
24.2S O.lOS
27.20 0.182
27.3S 0.186
28.S5 0.218
29.70 0.247
30.80 0.276
35.25 . 0.391
43.75 0.613
V0
= 20.2 ml; Vi = 38.4 ml; Flow:-rate 12 ml 0.01 M, pH 7.0 Tris-cacodylate buffer was used.
43.
. .. .. .. .,
"" ·-0 0
E.~ E E -'c C;s ....... E E ato <
Ct .......
'~o <. O'
O'Q '- f() 0 ~
Eoo f() 0 f()
CX) U') Cl) f() f() ~
/
Fig. 9. Change of elution volumes on dilution with
hemerythrin-azide complex observed on a
G-100 Column.
E E ....... ....... E 0 0 .......
< ~ 0
0 U') <. U) C\I
-- - - - -- - - - -
0 0 U)
0 0
0 . 0 v
0 . 0 f()
~ -E -Q)
E ::I
0 >
c 0
.... ::I
Q)
44.
that the value of the sieve coefficient is increased as the protein con
centration is lowered. This observation can also be seen from the
advancing boundaries of the elution profiles (see Fig. 9). The elution
position shifted with decreasing concentration towards the monomeric
(completely dissociated) elution position. Only a single plateau was
found in the ascending elution profiles of these experiments (Fig. 9).
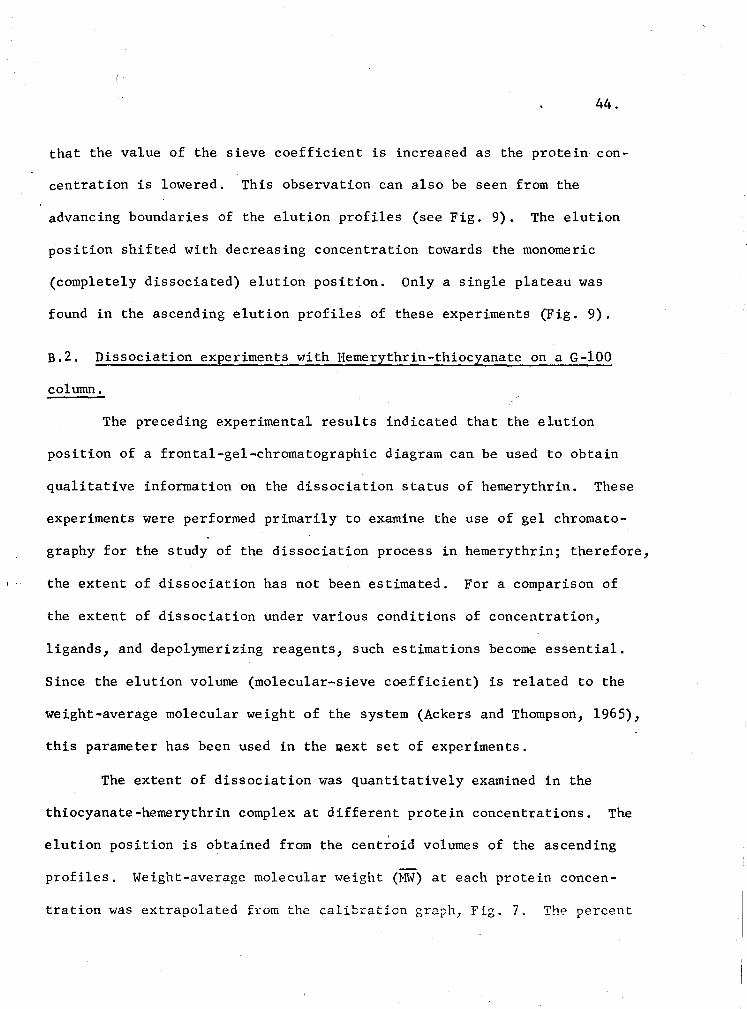
B.2. Dissociation experiments with Hemerythrin-thiocyanate on a G-100
column.
The preceding experimental results indicated that the elution
position of a frontal-gel-chromatographic diagram can be used to obtain
qualitative information on the dissociation status of hemerythrin. These
experiments were performed primarily to examine the use of gel chromato
graphy for the study of the dissociation process in hemerythrin; therefore,
the extent of dissociation has not been estimated. For a comparison of
the extent of dissociation under various conditions of concentration,
ligands, and depolymerizing reagents, such estimations become essential.
Since the elution volume (molecular-sieve coefficient) is related to the
weight-average molecular weight of the system (Ackers and Thompson, 1965),
this parameter has been used in the ~ext set of experiments.
The extent of dissociation was quantitatively examined in the
thiocyanate-hemerythrin complex at different protein concentrations. The
elution position is obtained from the cent~oid volumes of the ascending
profiles. Weight-average molecular weight (MW) at each protein concen
tration was extrapolated from the calibration graph, Fig. 7. The percent
4S.
of dissociation was then calculated from these values and from the known
octameric (Mp) and monomeric (Mm) hemerythrin molecular weights by using
the following equation:
MW = , where Cm + Cn = C0 ,
the plateau concentration (concentration of protein applied on the column).
Intermediate species between monomers and octamers are assumed not to
exist. Table rv lists the elution volumes and the calculated percent of
dissociation (Appendix IV shows a sample calculation).
TABLE IV
1 Effect of dilution on the dissociation of hemerythrin-thiocyanate complex .
Protein Weight-average Percent Concentration
Centroi~. 2 Volume, v, Molecul~r weight, Dissociation
(g/l) (ml) MW
0.328 27.0 72,400 37.6
O.lOS 29.l S0,120 61.2
0.072 29.9 42.6SO 69.2
0.047 30.6 37,600 74.S
0.026 32.4 26,900 8S.8
1. Prepared by overnight dialysis against 0.1 M KSCN- containing 0.01
pH 7.0 Tris-cacodylate buffer. Dialysate used for column elution.
2. A G-100 (1.0 x SS cm) column of exclusion volume (V0 ) = 17.3 ml was used in these experiments.
M,
46.
B.3. Dissociation Experiments with Oxyhemerythrin on a Sephadex G-100
Column.
Experimental data with the oxyprotein were obtained in the same way
as that of hemerythrin-thiocyanatec-complex. Recent reviewers of chroma
tographic theories (Winzer, 1969; Ackers, 1970) suggest the use of both
advancing and trailing boundaries of frontal elution profiles. Accord
ingly, the centroid volume of the ascending boundary is used to obtain
the weight-average molecular weight of the protein species, and the
descending boundary information is used to reveal the type of equilibrium
in hemerythrin. In 1955, Gilbert (1955) presented a theory for the
behavior of rapidly interacting (dissociating) systems on transport
methods. In 1963, Winzor and Scherega (1963) showed experimentally all
the postulates of this theory; since then gel-chromatographic data have
been checked for these postulates by many investigators.
With oxy-hemerythrin, a lower range of protein concentrations had
to be used since at higher concentrations the extent of the dissociation
was small, and it was difficult to observe the changes in the elution
volume. Table V lists the centroid volumes of the asc~nding boundaries
and shows that the value of V increased with increasing dilution. This
finding indicates that the weight-average molecular weight decreased with
decreasing protein concentrations (Winzor, 1969).
The weight-average molecular weight was estimated for each protein
concentration from the weight-average partition coefficients and the
calibration constants of the column. From the weight-average molecular
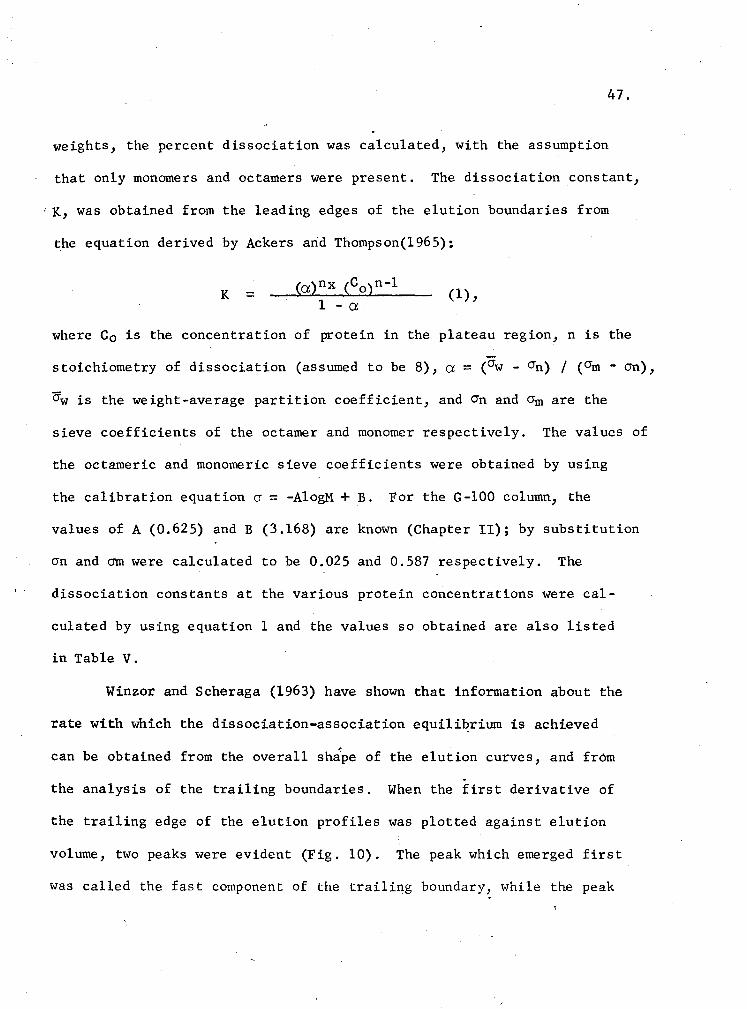
47.
weights, the percent dissociation was calculated, with the assumption
that only monomers and octamers were present. The dissociation constant,
' K, was obtained from the leading edges of the elution boundaries from
the equation derived by Ackers and Thompson(l965)~
K 1 - a
(1),
where C0 is the concentration of protein in the plateau region, n is the
stoichiometry of dissociation (assumed to be 8), a = (crw - CTn) I (am - cm),
crw is the weight-average partition coefficient, and crn and crm are the
sieve coefficients of the octamer and monomer respectively. The values of
the octameric and monomeric sieve coefficients were obtained by using
the calibration equation cr = -AlogM + B. For the G-100 column, the
values of A (0.625) and B (3.168) are known (Chapter II); by substitution
crn and am were calculated to be 0.025 and 0.587 respectively. The
dissociation constants at the various protein concentrations were cal-
culated by using equation 1 and the values so obtained are also listed
in Table V.
Winzor and Scheraga (1963) have shown that information about the
rate with which the dissociation-association equilibrium is achieved
< • can be obtained from the overall shape of the elution curves, and from
-the analysis of the trailing boundaries. When the first derivative of
the trailing edge of the elution profiles was plotted against elution
volume, two peaks were evident (Fig. 10). The peak which emerged first
was called the fast component of the trailing boundary, while the peak
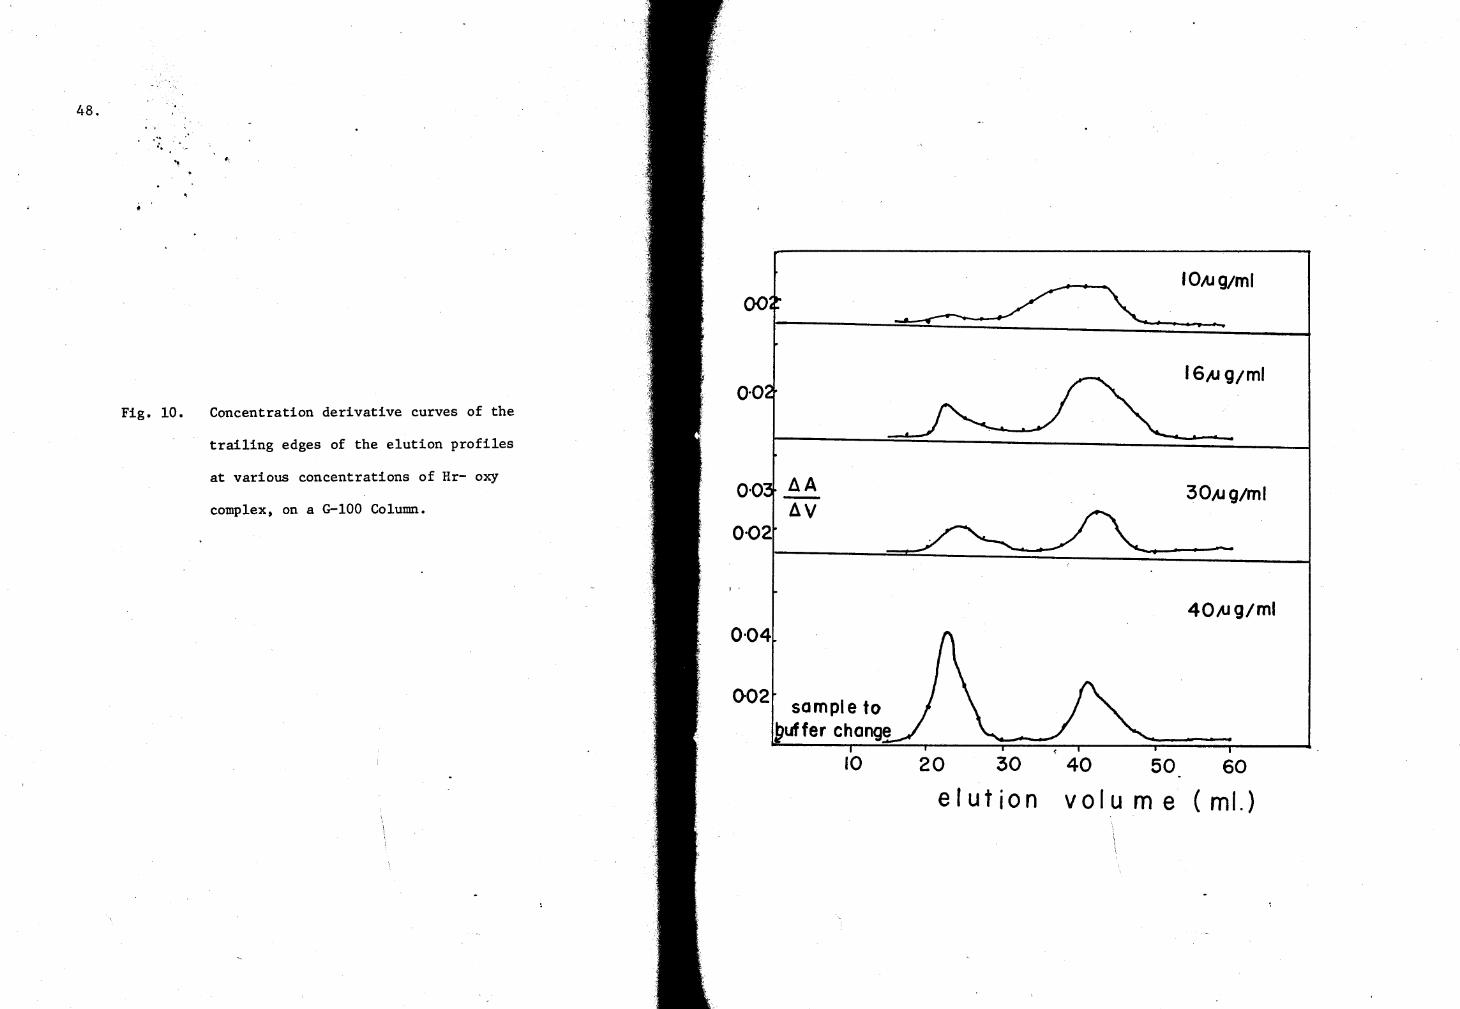
48.
. .. .. .. .,
00
O·O Fig. 10. Concentration derivative curves of the
trailing edges of the elution profiles
at various concentrations of Hr- oxy O·O
complex, on a G-100 Column.
0·02
0·04
002
AA -AV
sample to puffer change
10 20 30
elution
IOAJg/ml
I • I f-.
16,ug;ml
30,ug/ml
40,ug/ml
40 50 60
v o I u m e ( ml.}
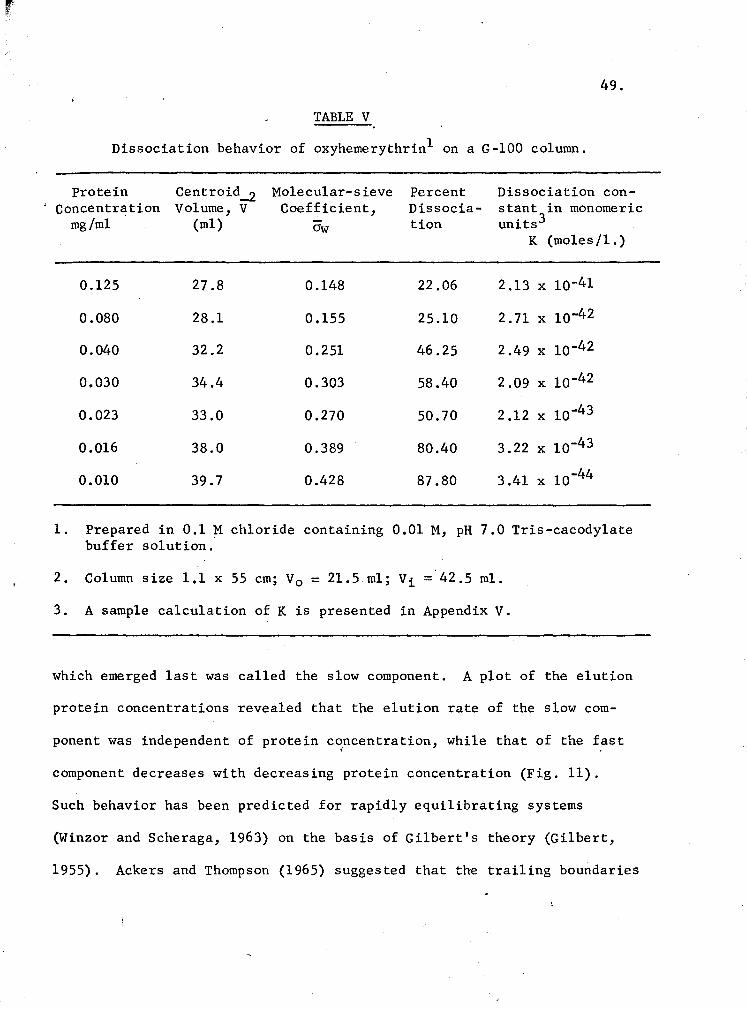
49.
TABLE V
Dissociation behavior of oxyhemerythrin1 on a G-100 column.
Protein Concentration
mg/ml ,
0.125
0.080
0.040
0.030
0.023
0.016
0.010
Centroid_z Volume, V
(ml)
27.8
28.l
32.2
34.4
33.0
38.0
39.7
Molecular-sieve Coefficient,
crw
0.148
0.155
0.251
0.303
0.270
0.389
0.428
Percent Dissociation
22.06
25.10
46.25
58.40
50.70
80.40
87.80
Dissociation constant in monomeric units3
K (moles/l.)
2.13 x lo-41
2.71 x lo-42
2.49 x 10-42
2.09 x lo-42
2.12 x lo-43
3.22 x lo-43
3.41 x lo-44
1. Prepared in 0.1 M chloride containing 0.01 M, pH 7.0 Tris-cacodylate buffer solution.
2. Column size 1.1 x 55 cm; V0 = 21.5 ml; Vi =·42.5 ml.
3. A sample calculation of K is presented in Appendix V.
which emerged last was called the slow component. A plot of the elution
protein concentrations revealed that the elution rate of the slow com-
ponent was independent of protein concentration, while that of the fast < •
component decreases with decreasing protein concentration (Fig. 11).
Such behavior has been predicted for rapidly equilibrating systems
(Winzor and Scheraga, 1963) on the basis of Gilbert's theory (Gilbert,
1955). Ackers and Thompson (1965) suggested that the trailing boundaries
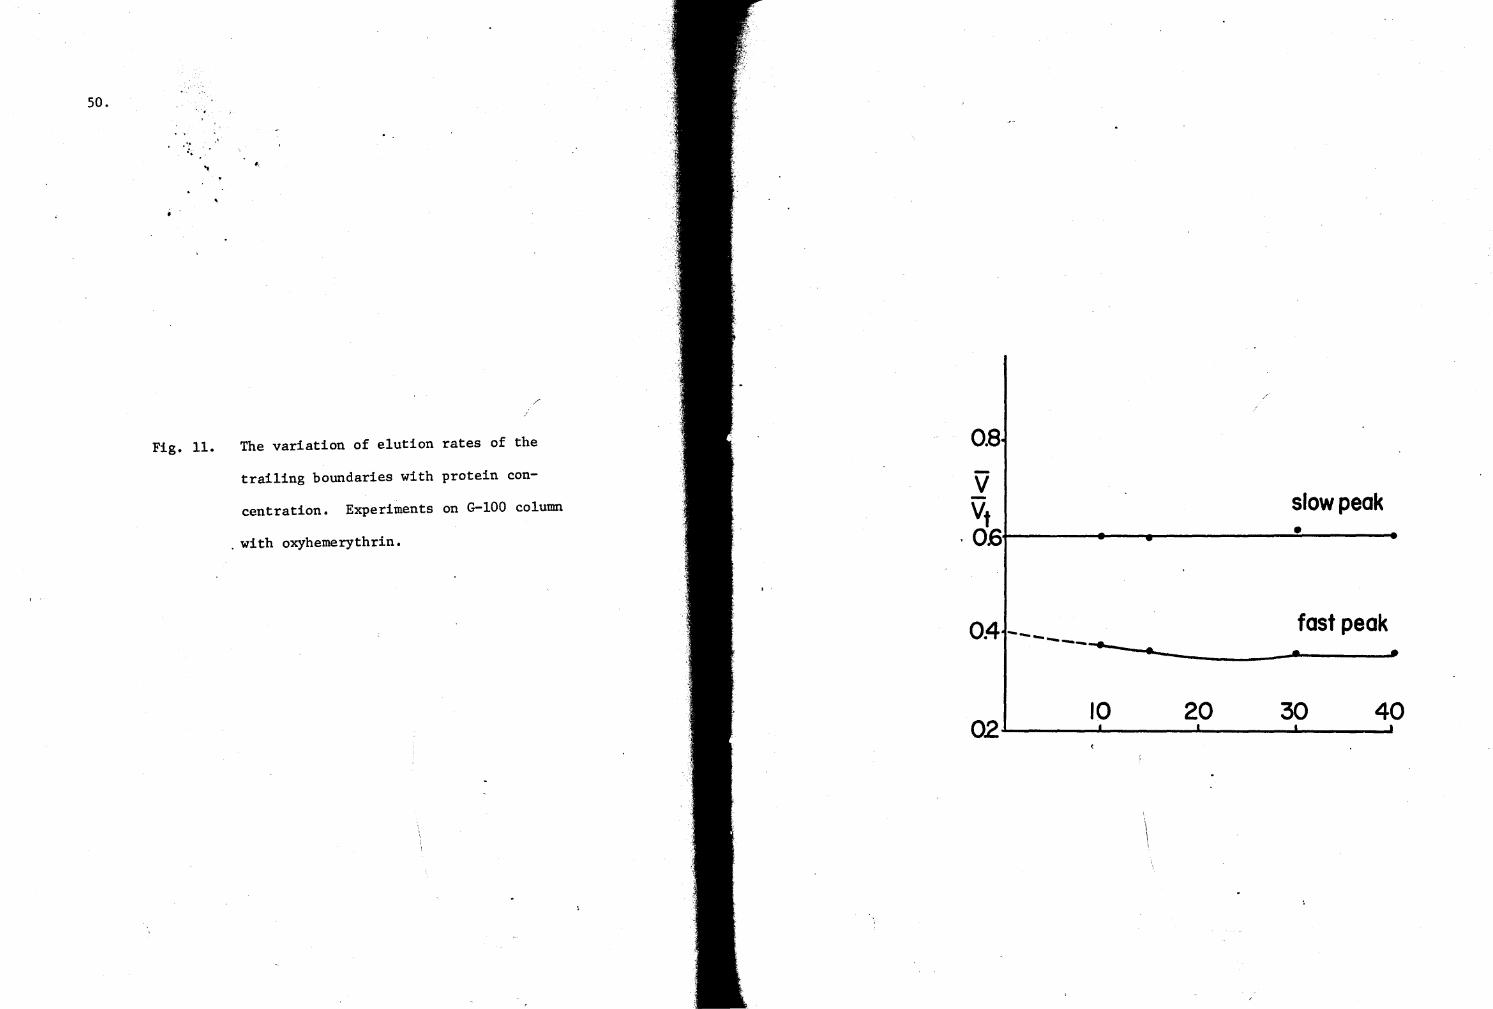
so. ' .
. ·· .. .. .. .,
. '
/
Fig. 11. The variation of elution rates of the 0.8
slow peak trailing boundaries with protein con-
centration. Experiments on G-100 column v -Vt . os.t-~~-41~---~~~~~~·=-~~--. with oxyhemerythrin.
0.4 ---------~ -------··--------------~·i....-______ __..
fast peak
10 20 30 40 02---------'-------'-~--...J.....----~
\
(,•
51.
can be further used to calculate the dissociation constant of the
equilibrating species. For these calculations, one must first estimate
·the position of the minimum in the derivative curve of the trailing
boundary. Together with the values of the octameric (crn) and monomeric
(crm) sieve coefficients, the elution volume at the minimum position
(Vmin) can then be used in the following equation (Ackers and Thompson,
1965):
K = n-1
n (Cmin) (2)
where ~ = (crm - v'min) I (v'min - crn) and Cmin is the concentration at
the minimum position of the trailing-boundary-derivative curve. V'min
has been defined by Ackers and Steare (1967b) as v'min = (Vmin - V0 -S)/Vi
where S is the volume of the protein sample applied on the column.
However, dissociation constants from the trailing boundaries could
not be calculated for oxyhemerythrin, because the position of the minimum
was difficult to measure in the derivative curves. This difficulty may
be due to the profiles obtained on the G-100 column or to the nature of
the hemerythrin complex used in these studies.
~herefore, the next set of dissociation experiments was performed (
on a Sephadex G-75 column, so that the trailing boundaries would not be
as diffuse as those on a G-100 column. Also, a greater dissociating
complex, hemerythrin-azide (Rao and Keresztes-Nagy, 1968) was used.
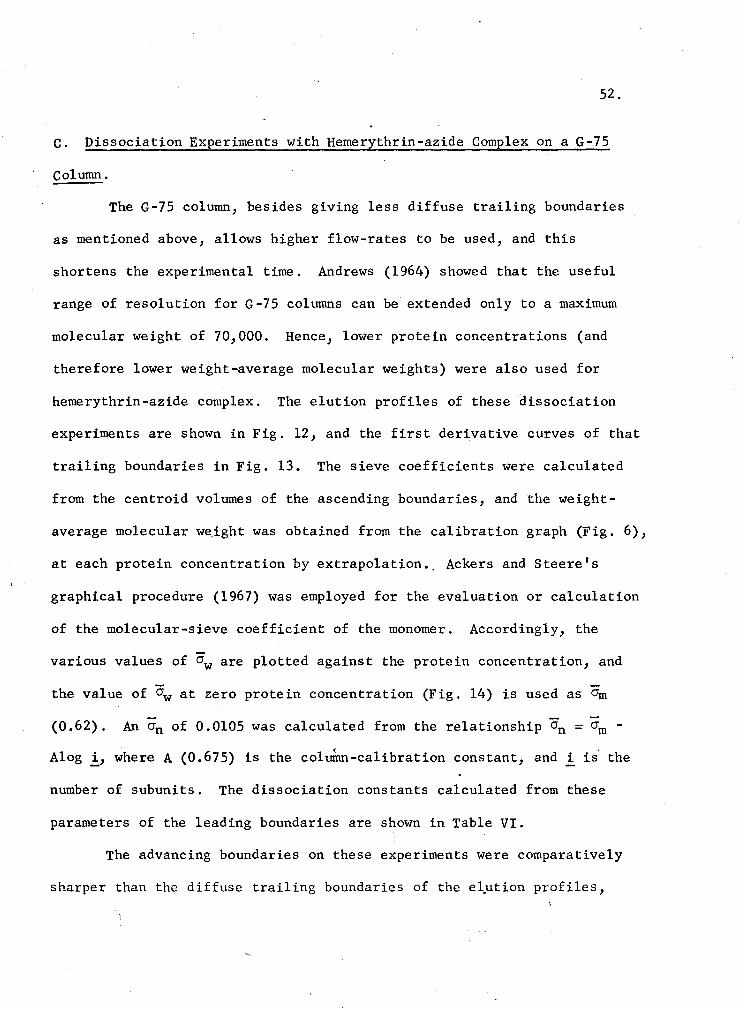
52.
c. Dissociation Experiments with Hemerythrin-azide Complex on a G-75
Column.
The G-75 column, besides giving less diffuse trailing boundaries
as mentioned above, allows higher flow-rates to be used, and this
shortens the experimental time. Andrews (1964) showed that the useful
range of resolution for G-75 columns can be extended only to a maximum
molecular weight of 70,000. Hence, lower protein concentrations (and
therefore lower weight-average molecular weights) were also used for
hemerythrin-azide complex. The elution profiles of these dissociation
experiments are shown in Fig. 12, and the first derivative curves of that
trailing boundaries in Fig. 13. The sieve coefficients were calculated
from the centroid volumes of the ascending boundaries, and the weight
average molecular w~ight was obtained from the calibration graph (Fig. 6),
at each protein concentration by extrapolation •. Ackers and Steere's
graphical procedure (1967) was employed for the evaluation or calculation
of the molecular-sieve coefficient of the monomer. Accordingly, the
various values of crw are plotted against the protein concentration, and
the value of crw at zero protein concentration (Fig. 14) is used as crm
(0.62). An an of 0.0105 was calculated from the relationship (jn =am -
Alog .!_, where A (0.675) is the col~n-calibration constant, and .!. is· the
number of subunits. The dissociation constants calculated from these
parameters of the leading boundaries are shown in Table VI.
The advancing boundaries on these experiments were comparatively
sharper than the diffuse trailing boundaries of the e~ution profiles,
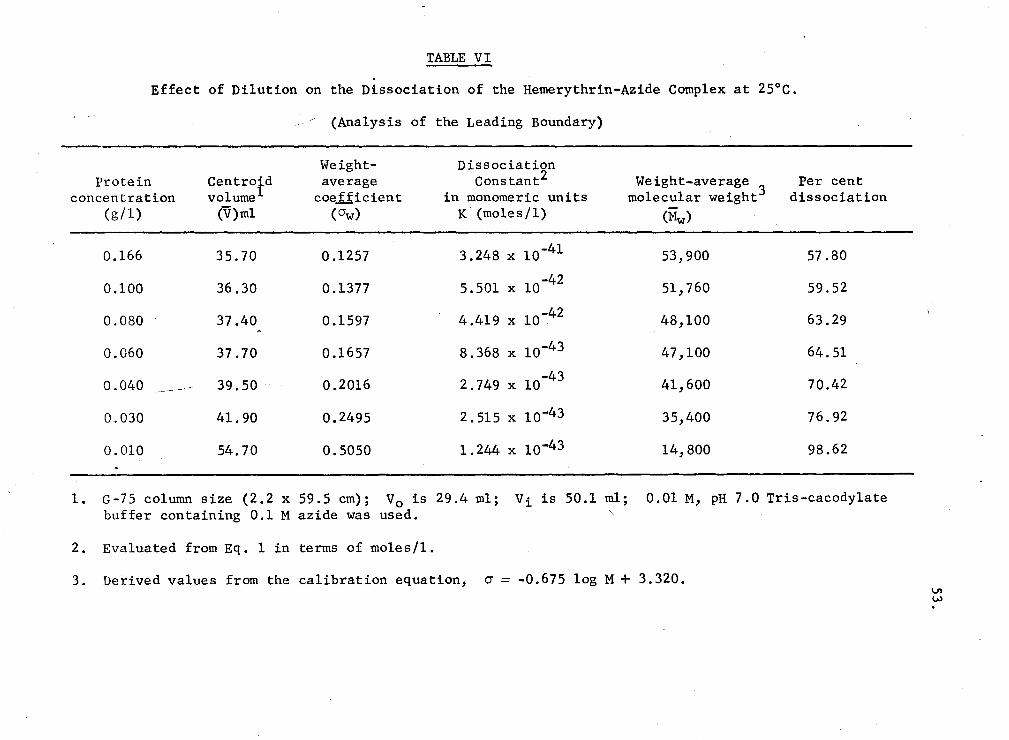
TABLE VI
Effect of Dilution on the Dissociation of the Hemerythrin-Azide Complex at 25°C.
(Analysis of the Leading Boundary)
Weight- Dissociation Protein Centroid average Constant2 Weight-average Per cent
concentration volume1 coefficient in monomeric units molecular weight3 dissociation (g/l) (V)ml (O"w) K, (moles /1) (Mw)
0.166 35.70 0.1257 3.248 x lo-41 53,900 57.80
0.100 36.30 0 .1377 5.501 x lo-42 51,760 59.52
0.080 37.40 0.1597 4.419 x lo-42 48,100 63.29
0.060 37.70 0.1657 8.368 x lo-43 47,100 64.51
0.040 ----- 39.50 0.2016 2.749 x lo-43 41,600 70.42
0.030 41.90 0.2495 2.515 x lo-43 35,400 76.92
0.010 54. 70 0.5050 1. 244 x lo-43 14,800 98.62
1. G-75 column size (2.2 x 59.5 cm); V0 is 29.4 ml; Vi is 50.l ml; 0.01 M, pH 7.0 Tris-cacodylate buffer containing 0.1 M azide was used.
2. Evaluated from Eq. 1 in terms of moles/l.
3. Derived values from the calibration equation, cr = -0.675 log M + 3.320. \J1 w
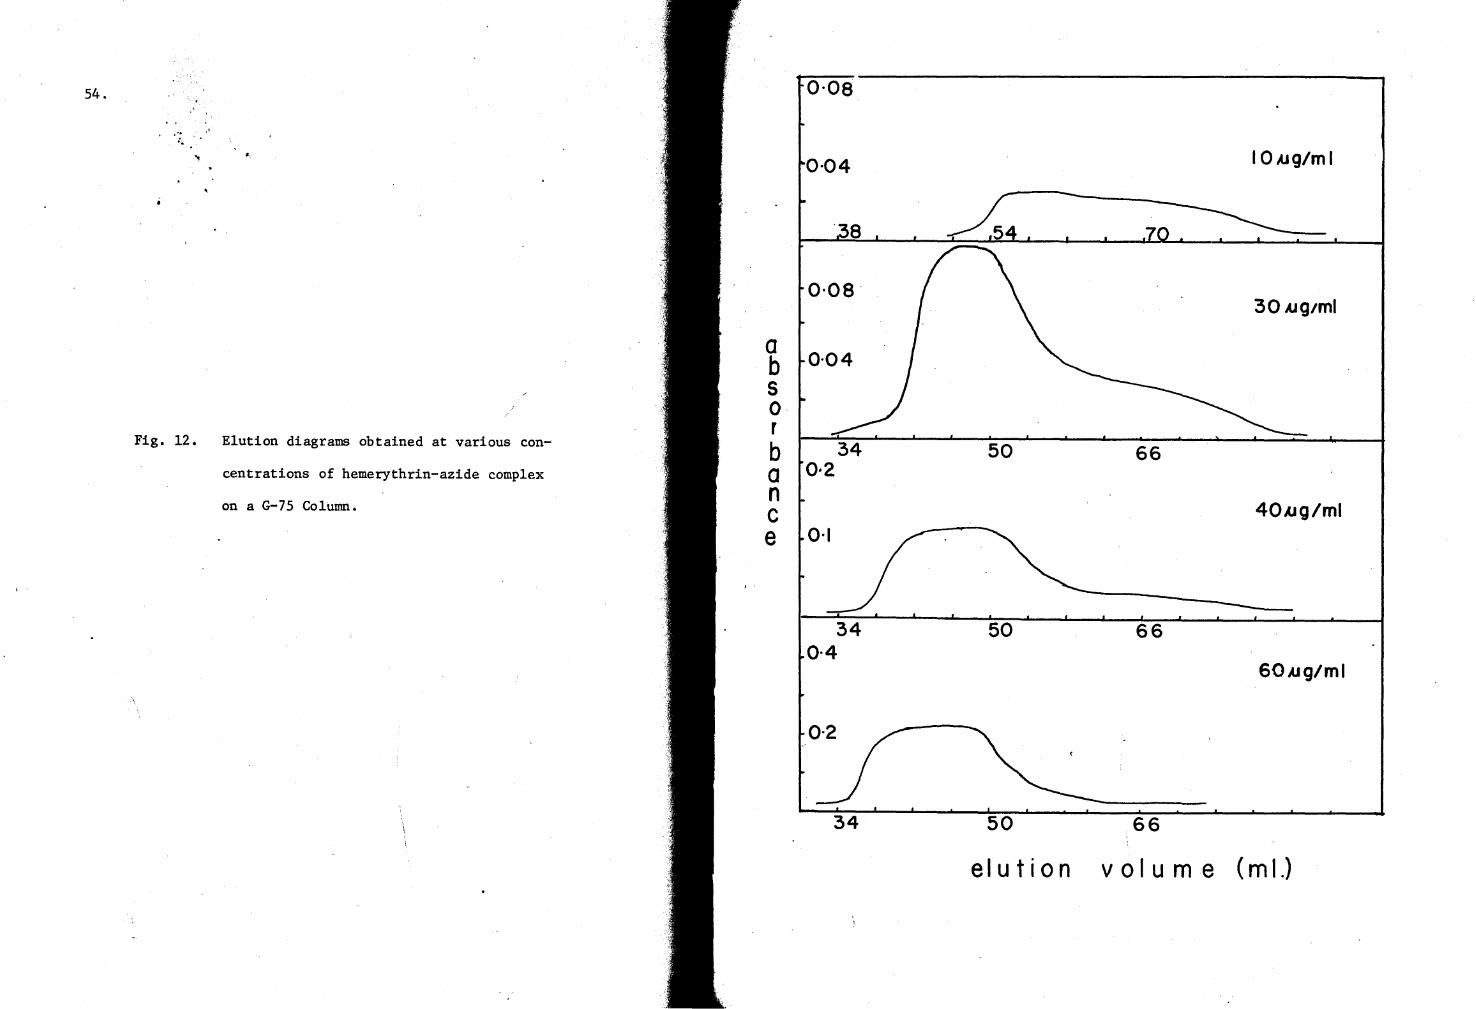
54. ' .. ... .. ..
.. ..
Fig. 12. Elution diagrams obtained at various con-
centrations of hemerythrin-azide complex
on a G-75 Column.
0·08
0·04
. 8
o·oa·
i 0·04 s 0 r b 34 a 0·2 n c e 0·1
34 0·4
34
I 0.og/ml
30 .og1ml
50 66
40.og/ml
50 66
60.og/ml
50 66
elution volume (ml.)
55. ' .
. .. .. .. .,
Fig. 13. First difference curves of the trailing
boundaries of the elution diagrams shown in
Fig. 12. V is obtained through a geometrical
analysis (Longsworth, 1943) as the first moment
of the gradient curve of the advancing boundary.
The peak positions of the fast and slow peaks are
utilized to obtain the migration rates. Vmin is
the position of the minimum in the gradient
curve.
/lA -.6V
0·02
I OAJg/ml
0·01
70 76 82
0·02
30AJg/ml
0·01
67 72 77
0-04
0·02 4 OA.1g1ml
0·06 67 72 77
0·03 60,u91ml
69 73 77 .
e I u t i o n v o I u m e ( m I.)
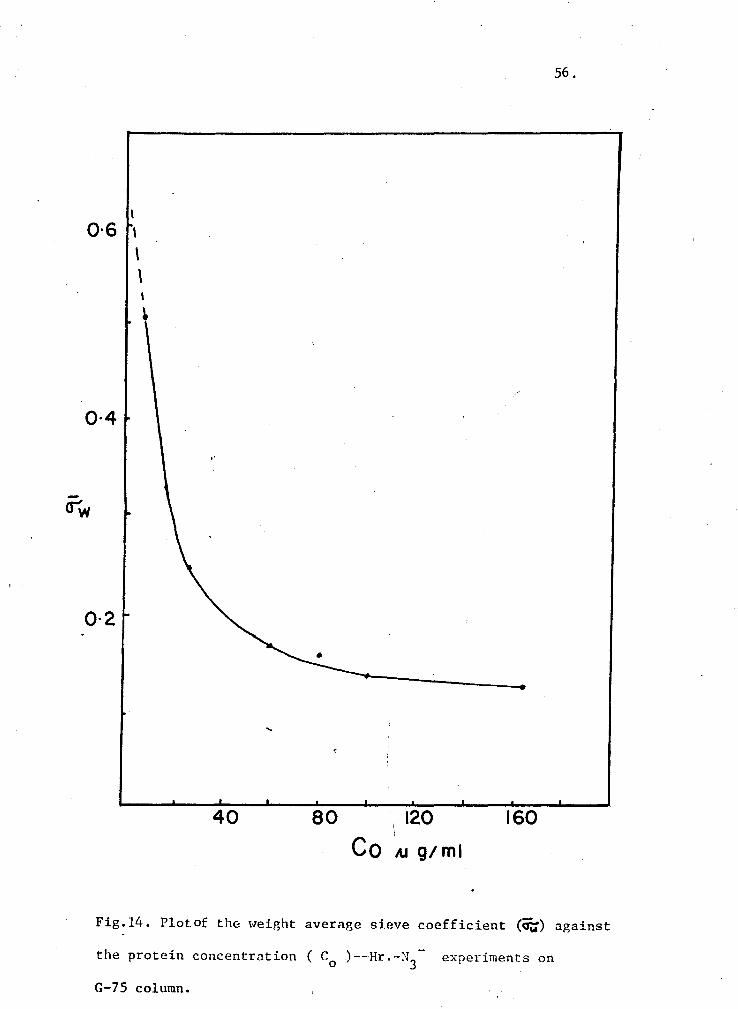
-
I
0·6 ' \ \
0·4
<r'w
0·2
"
40 80 \ 120
Co A.I g1 ml
160
56.
Fig.14. Plot.of the weight averap,e sieve coefficient (Ow) against
the protein concentration ( C0
)--Hr.-N3
- experiments on
G-75 column.
57.
as in the case of the oxyhemerythrin experiments on the G-100 column.
However, it was still possible to estimate the minimum position in most
of the derivative curves (Fig. 13) of the trailing boundaries, unlike
that in the oxyhemerythrin boundaries.
Ackers and Thompson's procedure (1965) for the stoichiometry of
dissociation (n) was used according to the following equation:
n = 3 V1 min - CYin - 2 crn (3)
3 V ' min - 2 crm - cm
The values of 'n' so obtained are presented in Table VII. From the
position of the minimum in the derivative curves of hemerythrin-azide
dissociation experiments, the dissociation constants were also evaluated
(Table VII).
The trailing-poundary derivative curves were examined for the
rate of equilibrium in hemerythrin-azide comple~. And, according to
Gilbert's postulates (1955), a rapid rate of equilibrium is observed in
these experiments (Fig. 15). Fig. 16 shows the trailing boundary-
derivative curve of 2 µg/ml hemerythrin-azide solution in comparison to
the curve obtained at 20 µg/ml concentration. Only a single slow peak
(in the derivative curve) i~ observed at the 2 µg/ml protein concentration
• As indicated earlier, the column-partition parameter, the sieve
coefficient, can also be evaluated in terms of the size of the molecular
species being studied. By using the calibration equation a = a0 + b0
[erfc-1 (cr)], we obtained the molecular radii of the monomeric and
octameric forms of hemerythrin. Table VIII contains t~ese values. It
was of interest to compare such values with those obtained on a Sephadex
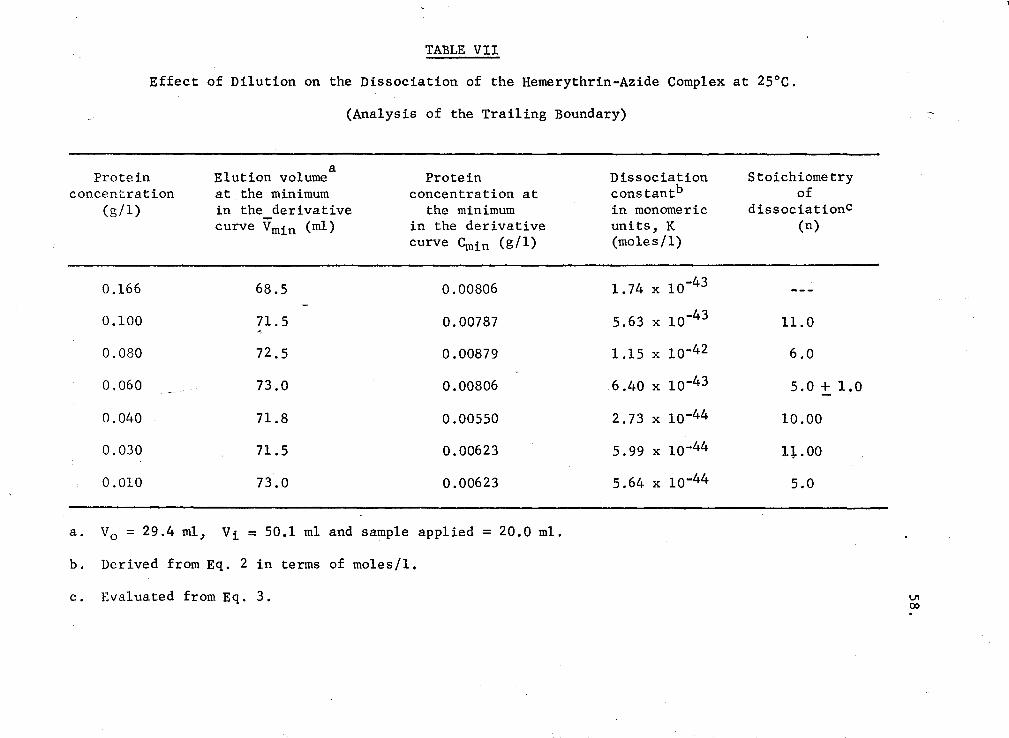
TABLE VII
Effect of Dilution on the Dissociation of the Hemerythrin-Azide Complex at 25°C.
(Analysis of the Trailing Boundary)
Protein concentration
(g/l)
0.166
0.100
0.080
0.060
0.040
0.030
0.010
. a Elution volume at the minimum in the derivative curve Vmin (ml)
68.5
71.5
72.5
73.0
71.8
71.5
73.0
Protein concentration at
the minimum in the derivative curve Groin (g/l)
0.00806
0.00787
0.00879
0.00806
0.00550
0.00623
0.00623
a. V0 = 29.4 ml, V1 = 50.l ml and sample applied = 20.0 ml.
b. Derived from Eq. 2 in terms of moles/l.
c. Evaluated from Eq. 3.
Dissociation constantb in monomeric units, K (moles/l)
1.74 x 10-43
5.63 x 10-43
1.15 x lo-42
6.40 x lo-43
2.73 x lo-44
5.99 x lo-44
5.64 x lo-44
Stoichiometry of
dissociationc (n)
11.0
6.0
5.0 + 1.0
10.00
1i.oo
5.0
V1 00
'
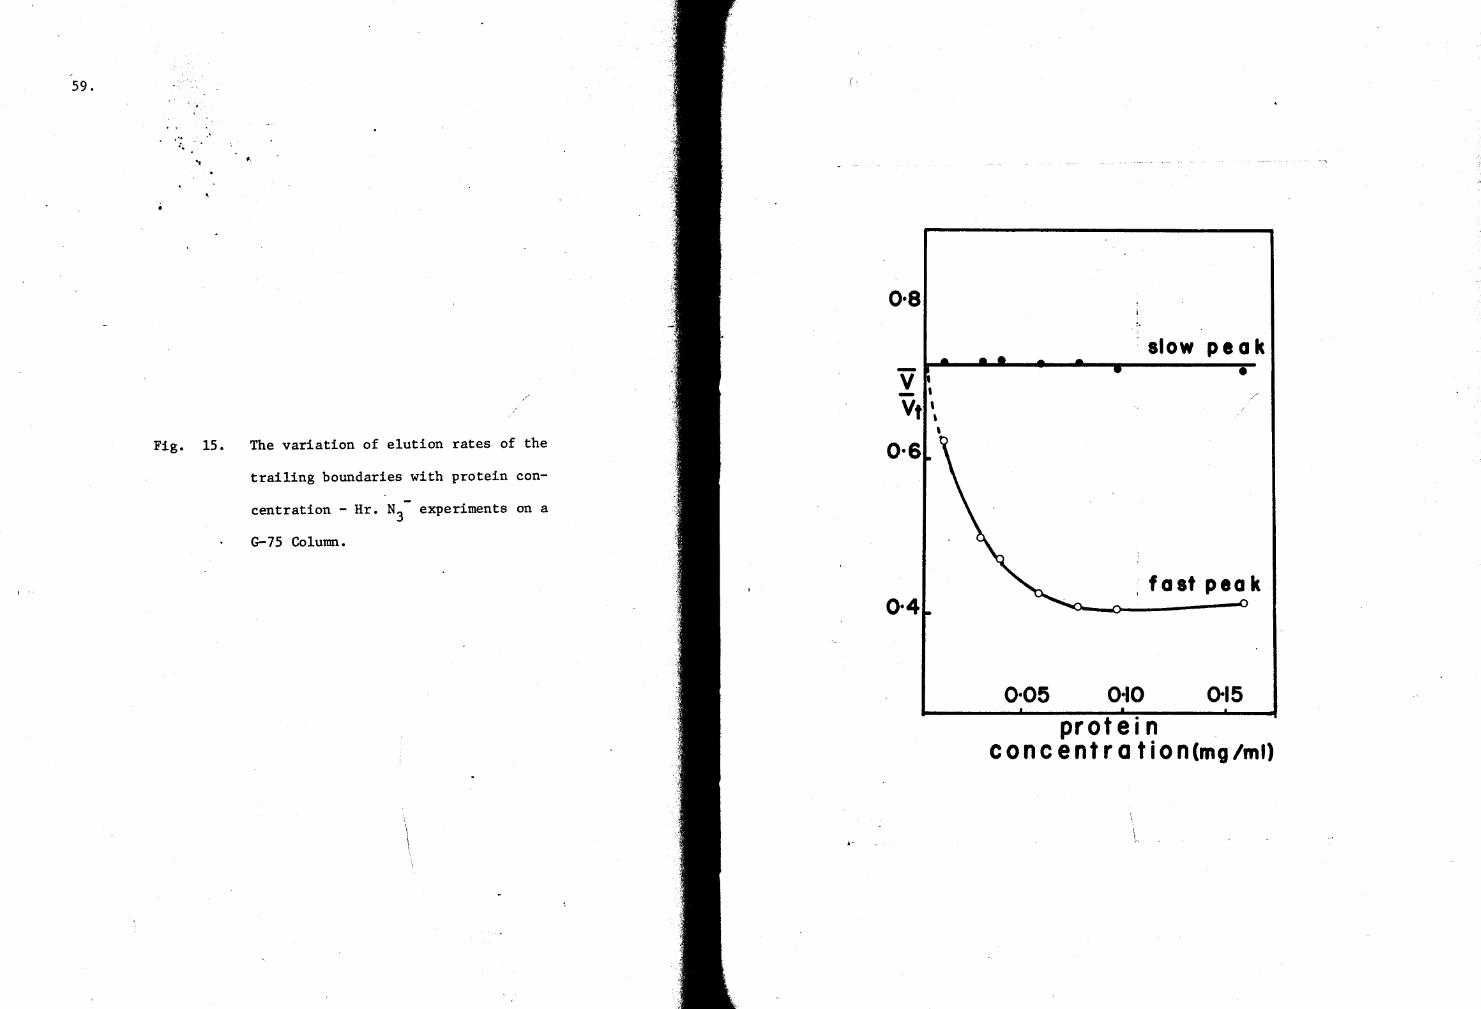
,
59. '
... " .. .. .,
0·8
slow peak -v - '
• Vt',
' Fig. 15. The variation of elution rates of the 0·6 trailing boundaries with protein con-
centration - Hr. N3- experiments on a
G-75 Column.
fast peak 0·4
0·05 0·10 0-15 protein
c on c e n t r a t i o n (mg /m I)
\,
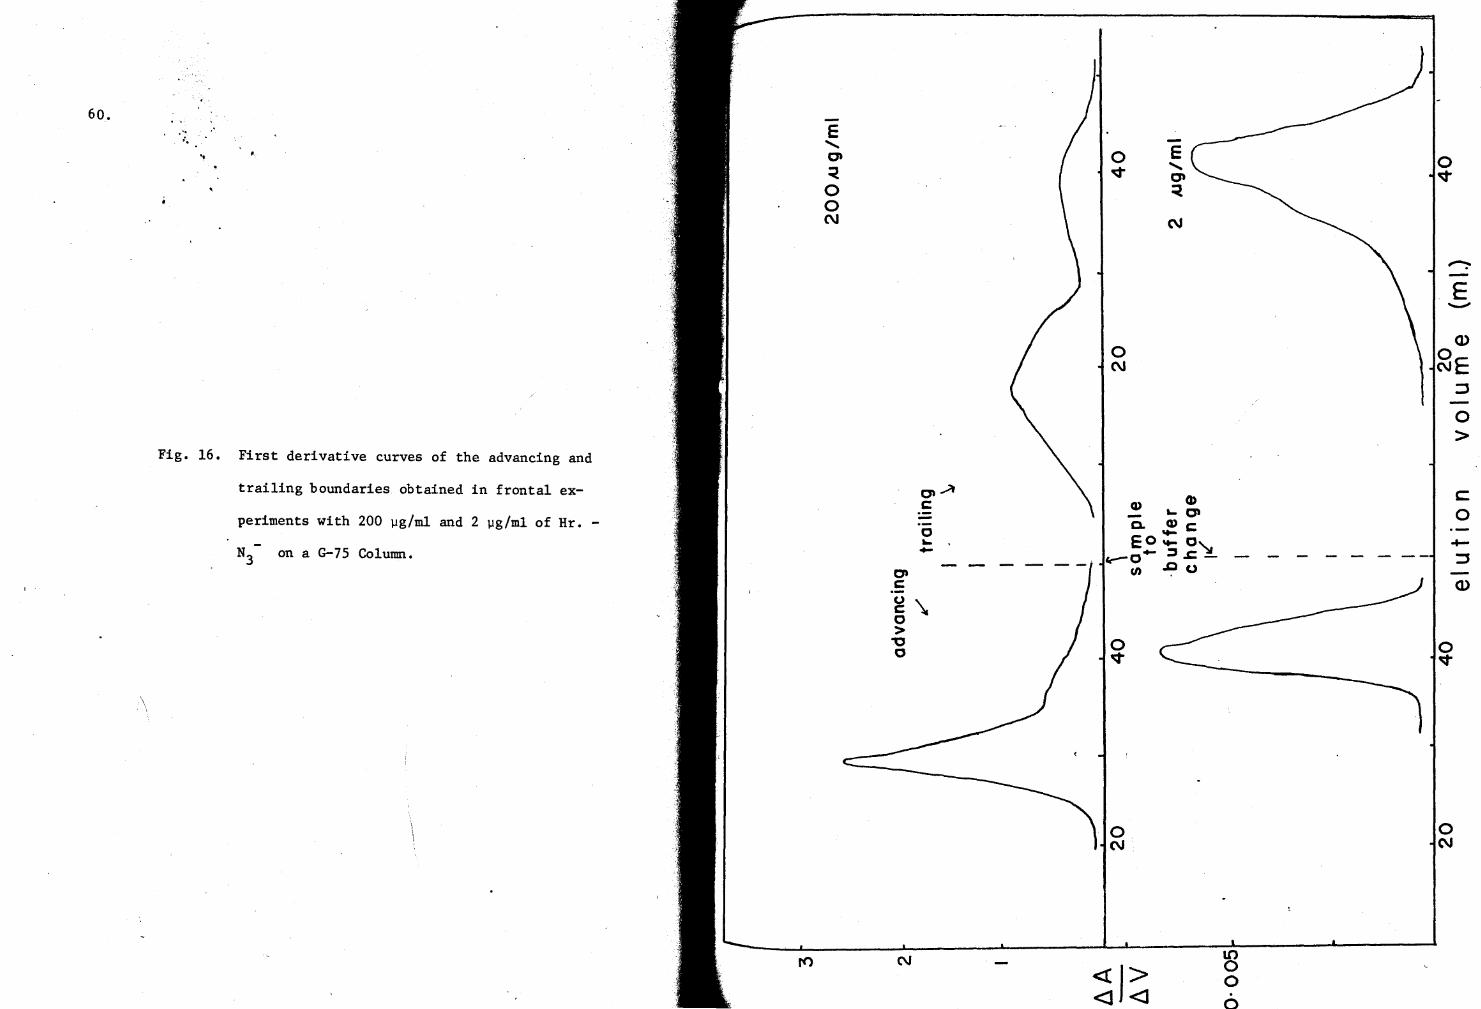
60.
\
... '• .. .,
Fig. 16. First derivative curves of the advancing and
trailing boundaries obtained in frontal ex-
periments with 200 µg/ml and 2 µg/ml of Hr. -
N3- on a G-75 Column.
\.
E ....... 0
< 0 0 C\I
o....::t c ·--0 ... -
Cl c ()
\ c 0 > -0 0
E 0 ....... v 0 < C\I
0 C\I
G> .! ... 0 c. Q) c .... eo .... o~
~o- ::t .s= -en .c u
0 v
0 C\I
<CJ> <l <l
LO 0 0 . 0
0 v
~
E -Q)
2E :J
0 >
c: 0
....... ::s
0 v
0 C\I
Q)
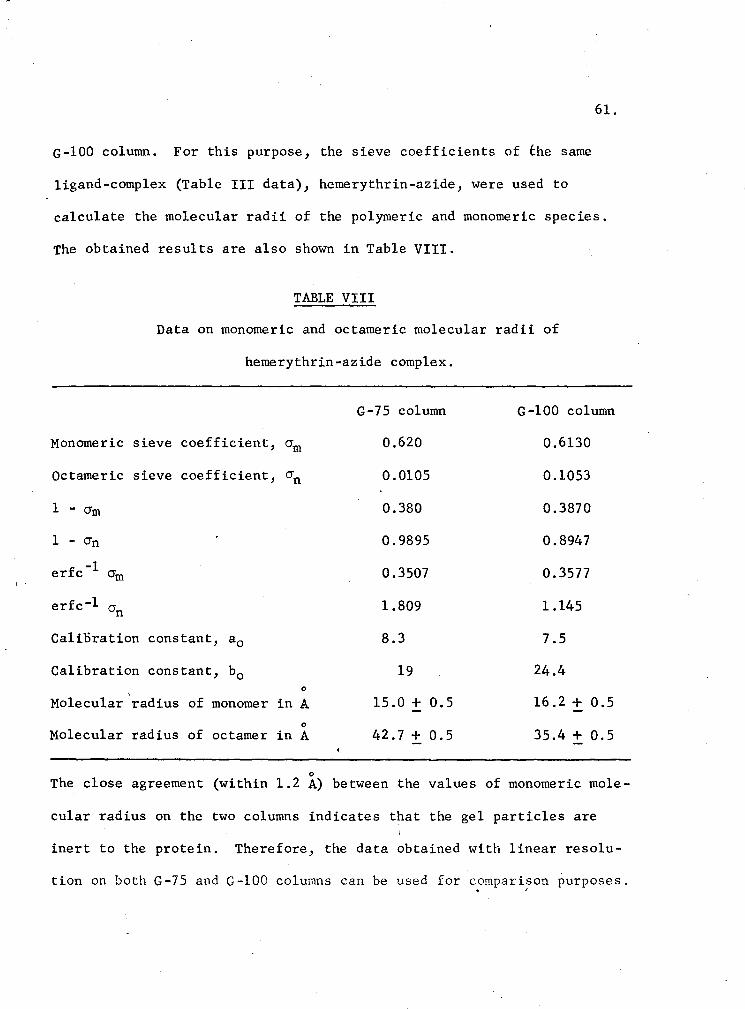
61.
G-100 column. For this purpose, the sieve coefficients of the same
ligand-complex (Table III data), hemerythrin-azide, were used to
calculate the molecular radii of the polymeric and monomeric species.
The obtained results are also shown in Table VIII.
TABLE VIII
Data on monomeric and octameric molecular radii of
hemerythrin-azide complex.
G-75 column G-100 column
Monomeric sieve coefficient, O"m 0.620 0.6130
Octameric sieve coefficient, crn 0.0105 0.1053
1 - O"m 0.380 0.3870
1 - O"n 0.9895 0.8947
erfc-l O"m 0.3507 0.3577
erfc-1 O"n 1.809 1.145
Calil:iration constant, ao 8.3 7.5
Calibration constant, ho 19 24.4 0
Molecular radius of monomer in A 15.0 + 0.5 16.2 + 0.5 0
Molecular radius of octamer in A 42.7 + 0.5 35.4 + 0.5
0
The close agreement (within 1.2 A) between the values of monomeric mole-
cular radius on the two columns indicates that the gel particles are
inert to the protein. Therefore, the data obtained with linear resolu-
tion on both G-75 and G-100 columns can be used for comparison purposes. • I
62.
D. Examination of the Rat~ of Equilibrium on the Theoretical Plate
Concept:
At this point, it may be recalled that there is a contradiction
in the findings of this investigation and those of Klapper et.al. (1966)
about the rate of hemerythrin equilibrium. With this discrepancy in mind,
we examined some of the aged (90 days arter preparation of the protein)
solutions of hemerythrin-thiocyanate. The elution profile at a protein
concentration of 68 µg/ml is shown in Fig. 17. One can see the presence
of a peak at the beginning of the descending portion of the elution
diagram, which may represent the monomers whose sulfhydryl groups have
been oxidized. Such 'crippled' monomers have also been reported by
Langerman (1969) by the disc-electrophoresis method. The change of an
-SH group to a S03 group is attributed to the o~idizing properties of
the thiocyanate ion.' The above dissociation experiment with aged
hemerythrin-thiocyanate solution indicates that.the consideration of the
nature of the ligand is also important in the interpretation of elution
boundaries for the rate of equilibrium. Therefore, the dissociation of
oxyhemerythrin was examined at various concentrations, and without the
solubilizing salt, sodium chloride, a known iron-complexing ligand. At
very low protein concentrations (< 20 µg/ml), the boundary shape is
different than those obtained with hemerythrin-thia.cyanate and oxyhemery
thrin (no salt) at higher protein concentration (68 µg/ml). Figuresl8
and 19 show the elution profiles at 20 µg/~l and 68 µg/ml concentrations
respectively. The behavior at low oxyhemerythrin concentrations may be
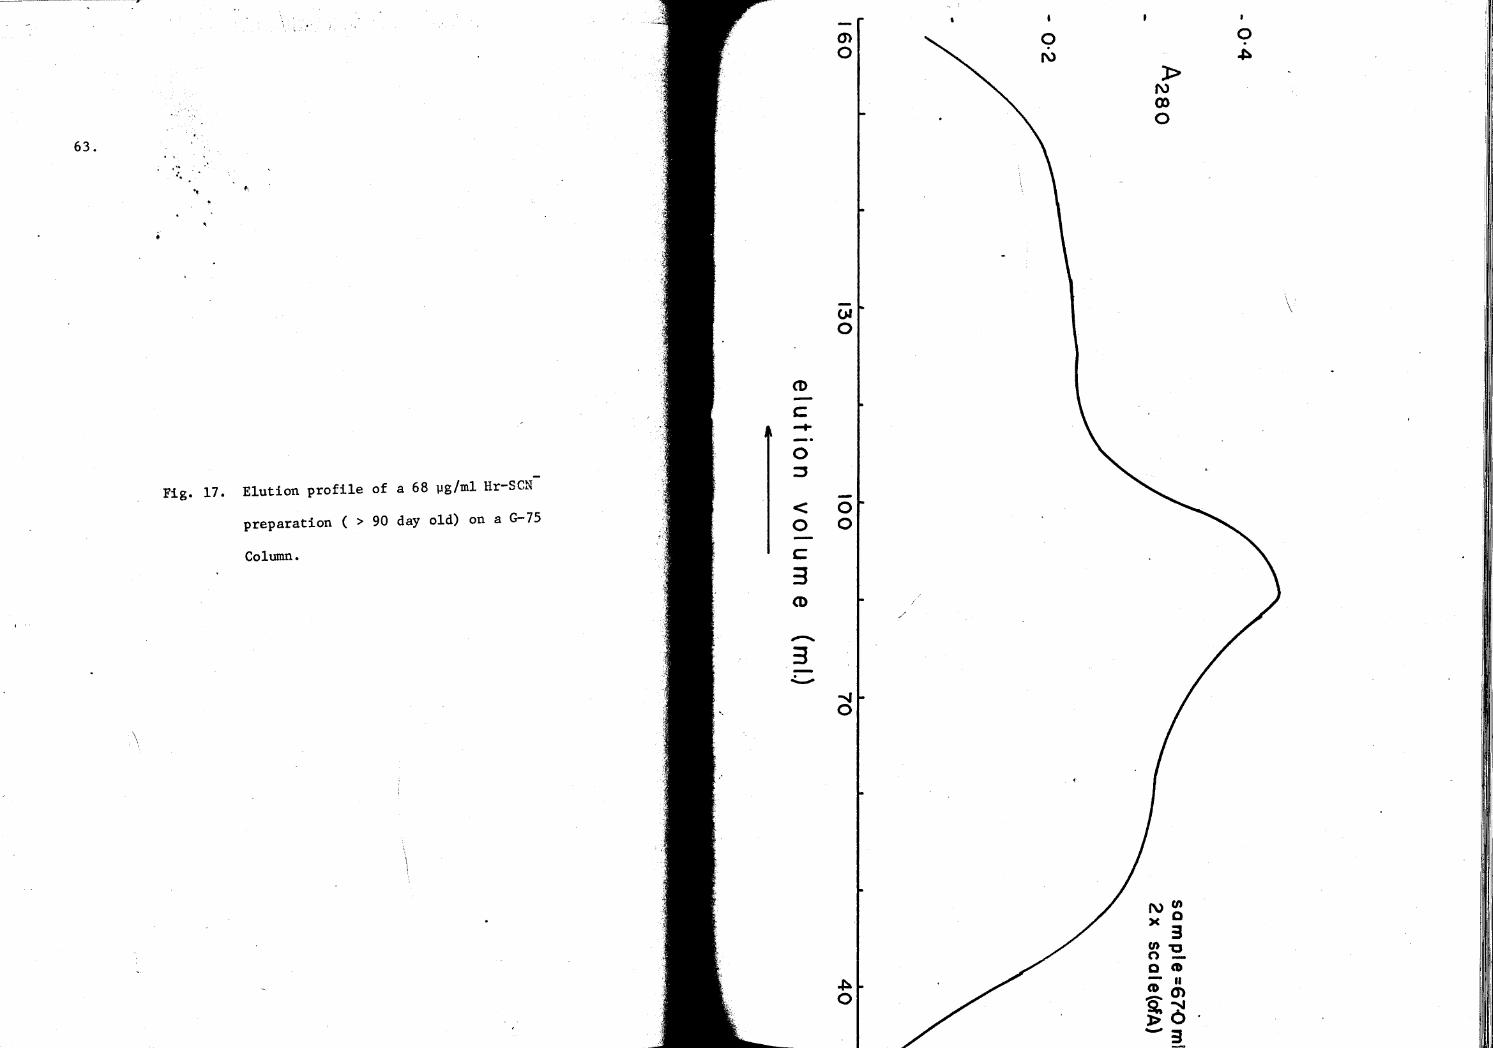
63. ... '• .. ~'
Fig. 17. Elution profile of a 68 µg/ml Hr-SCN-
preparation ( > 90 day old) on a G-75
Column.
\
CD
c ~
0 ::J
< 0
c 3 (I)
,-.,
3
O'> 0
(>I
0
0 0
~ 0
~ 0
/
l> f\)
en 0
N (I) )( Q
3 (I) 't:J 0 -Q t'D - II CD en '5' "'-.J ~o -3
0 . ~
\
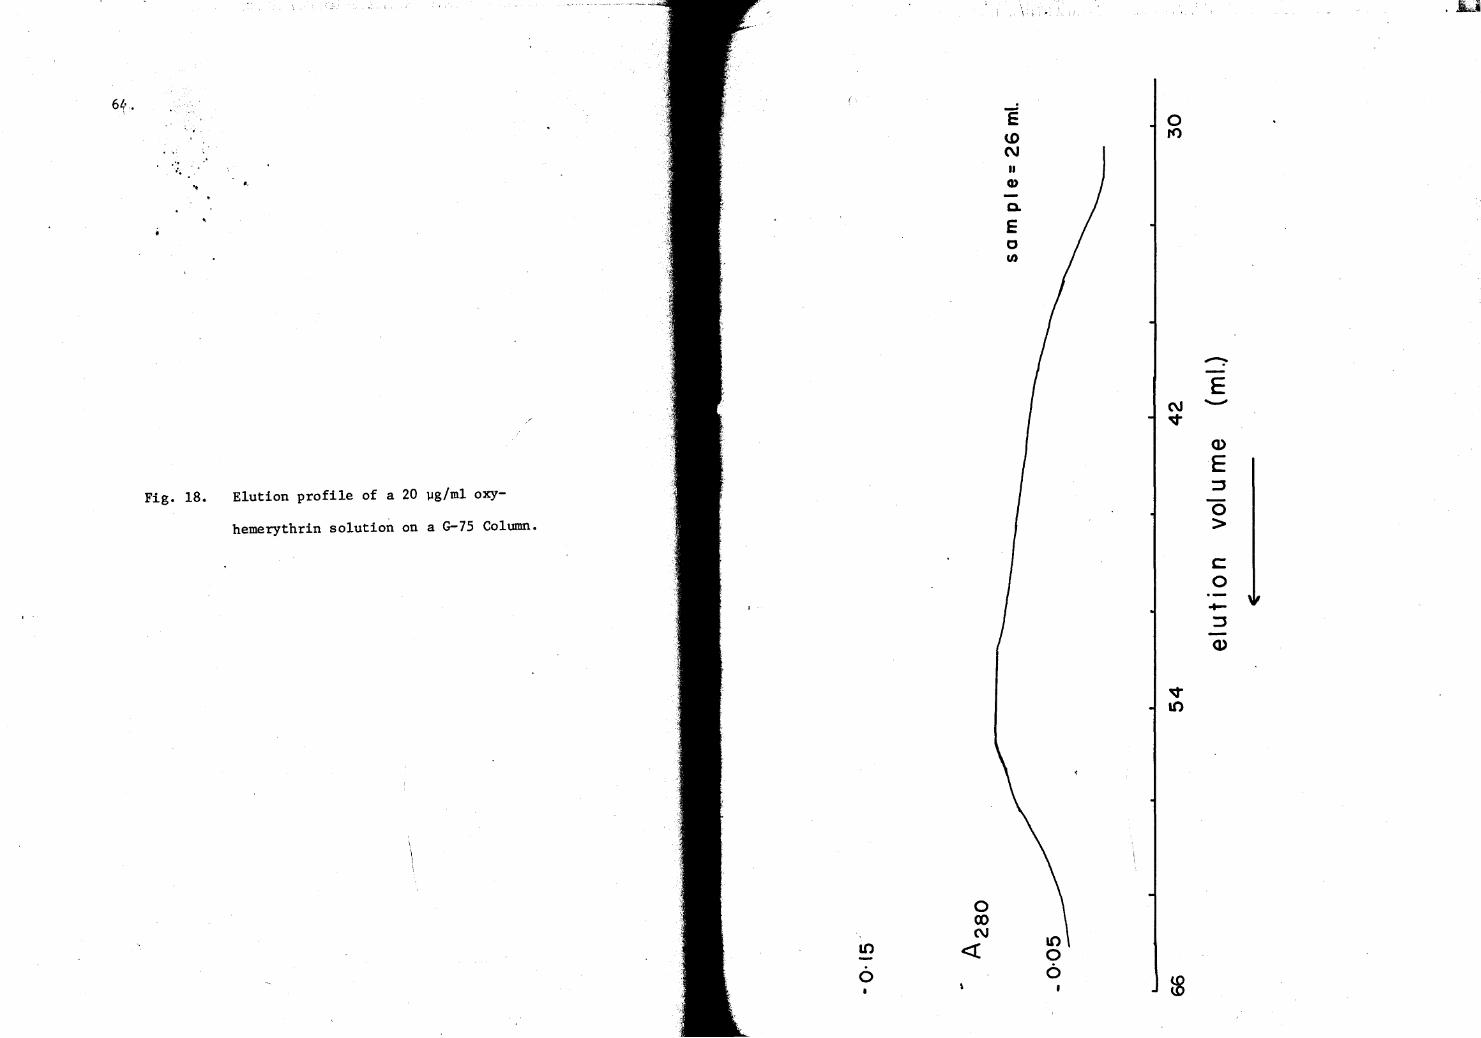
6~.
' . ..• " ..
.. .,
Fig. 18. Elution profile of a 20 µg/ml oxy-
hemerythrin solution on a G-75 Column.
LO
0
0 co C\J
<(
e U> C\J II Q)
E 0 Cl>
I ; '•
0 r<>
C\J v
v LO
~
E -Q)
E :J
0 >
c: 0
....... :J -Q)
kl ~ .......
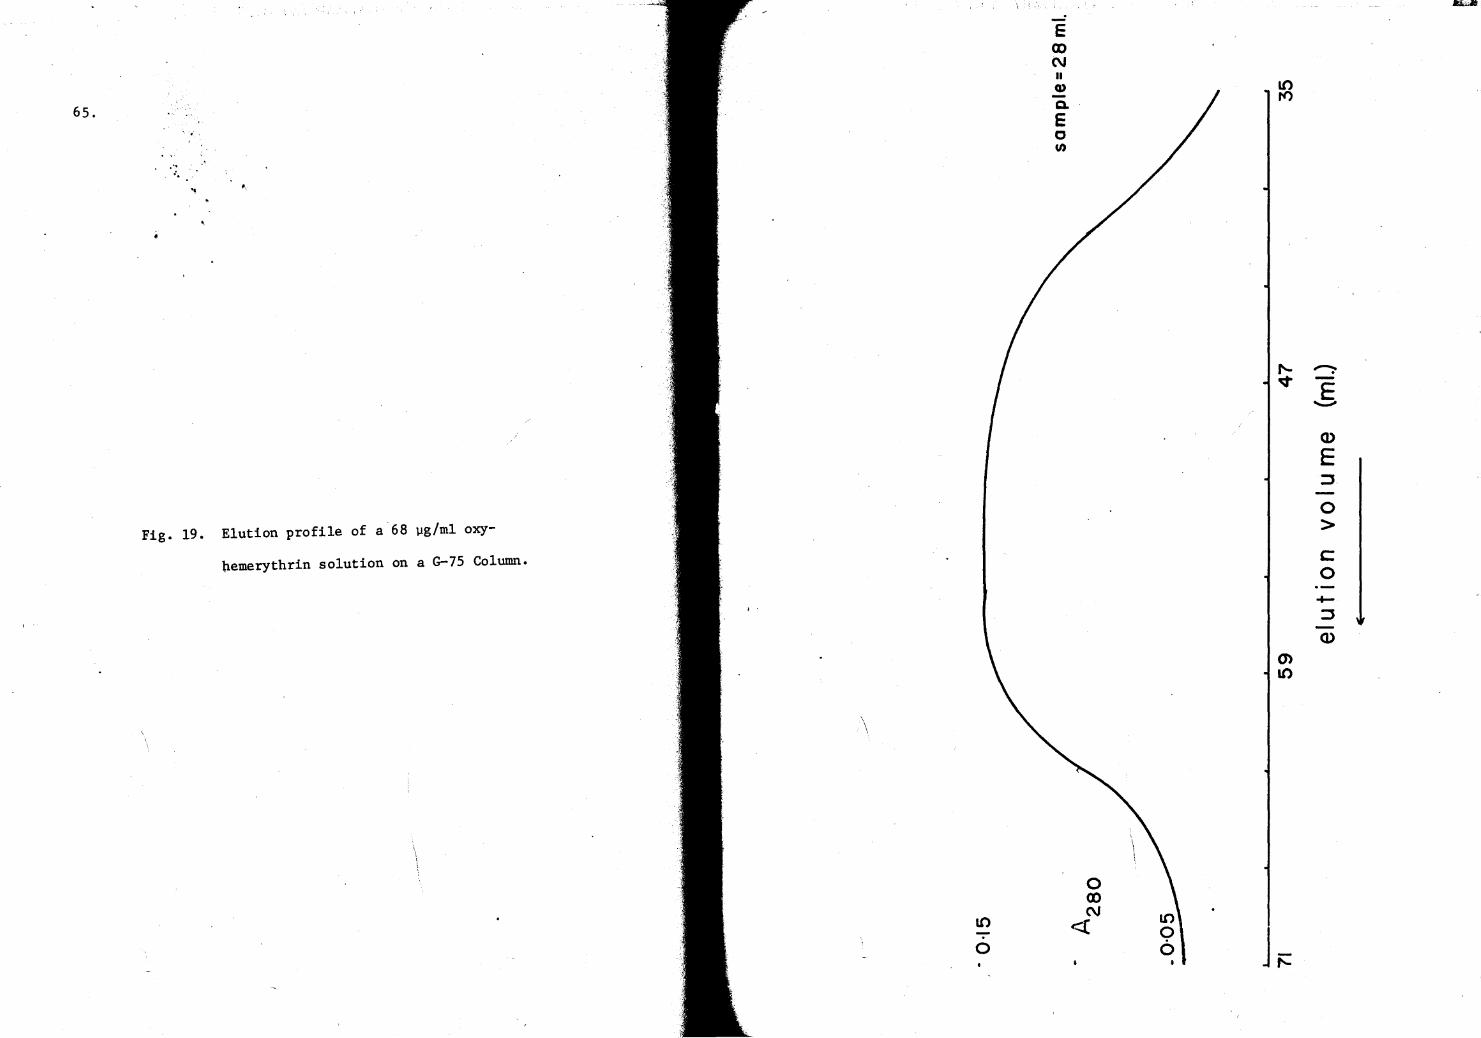
65.
... .. .. . .
Fig. 19. Elution profile of a 68 µg/ml oxy-
pemerythrin solution on a G-75 Column.
\ i ·"
\ \
l() -0
E CX> C\J II Q)
CL
E c U>
""" '""=" v E .........
Q)
E :l.
0 > c: 0
+-:l -Q)
O'> l()
0 CX> C\J
<(
"""
~.
interpreted as that of an intermediate type of equilibrium. Recently,
further experiments (Tan and Keresztes-Nagy, 1971) confirmed this
intermediate rate of equilibration for oxyhemerythrin at very low con-
centrations.
Information about the rate of equilibration of the dissociation
of octameric hemerythrin may also be derived from the spread of the
derivative curve of the leading boundary, and from the elution time.
From the spread .of the derivative curve and the length of the column,
one can obtain the number of theoretical plates; from the elution time
one can estimate how long the protein remains on each of these plates.
In a frontal-elution-type experiment, the spread of the derivative
curve is measured as the width of the base of the peak. This value is
then used to calculate the total number of theoretical plates of the
column by using the equation derived by Morris and Morris (1963):
[ 4V ] 2 p =
. e w '
where p = total number of theoretical plates
Ve = elution volume of the protein \
w = width of the elution peak
These parameters were evaluated for<the dissociation experiment of
hemerythrin-thiocyanate (68 µg/ml, Fig. 17), and the oxyhemerythrin
experiment (68 µg/ml, Fig. 19). Table IX contains the values of these
parameters. The values of height equivalent to theoretical plate (HETP)
were obtained from the column-bed heights, and were found to be 0.33 mm
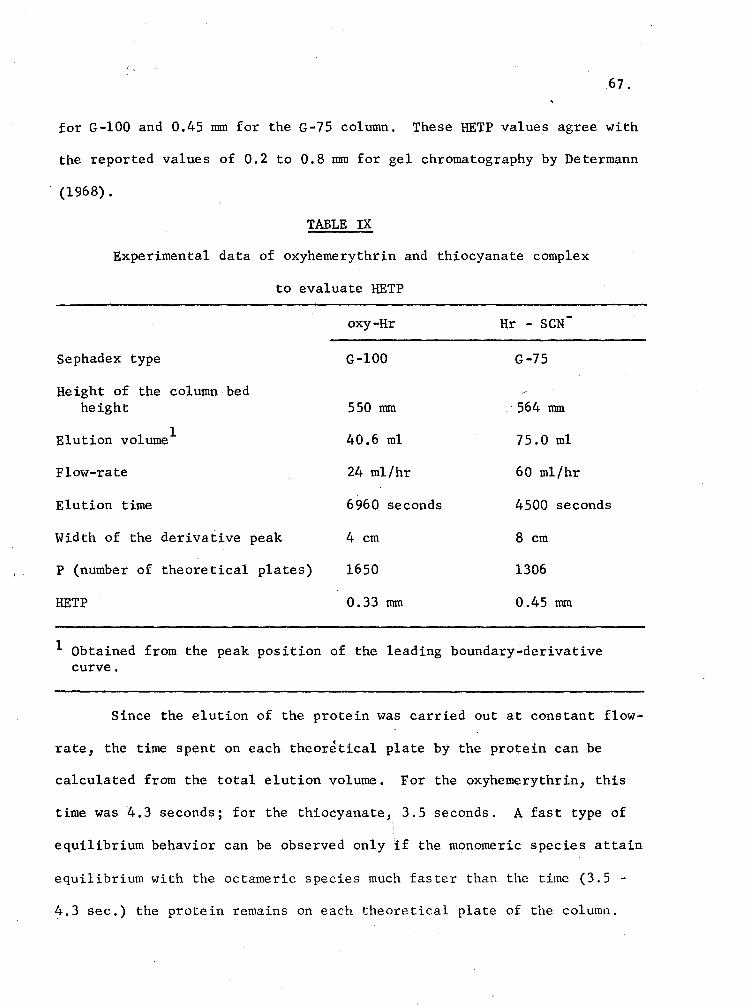
.67.
for G-100 and 0.45 nnn for the G-75 column. These HETP values agree with
the reported values of 0.2 to 0.8 nnn for gel chromatography by Determann
(1968).
TABLE IX
Experimental data of oxyhemerythrin and thiocyanate complex
to evaluate HETP
Sephadex type
Height of the column bed height
Elution volume1
Flow-rate
Elution time
Width of the derivative peak
P (number of theoretical plates)
HETP
oxy-Hr
G-100
550 nun
40.6 ml
24 ml/hr
6960 seconds
4 cm
1650
0.33 mm
Hr - SCN
G-75
564 nnn
75.0 ml
60 ml/hr
4500 seconds
8 cm
1306
0.45 nun
1 Obtained from the peak position of the leading boundary~derivative curve.
Since the elution of the protein was carried out at constant flow-
rate, the time spent on each theoretical plate by the protein can be
calculated from the total elution volume. For the oxyhemerythrin, this
time was 4.3 seconds; for the thiocyanate, 3.5 seconds. A fast type of
equilibrium behavior can be observed only if the monomeric species attain
equilibrium with the octameric species much faster than the time (3.5 -
4.3 sec.) the protein remains on each theoretical plate of the column.
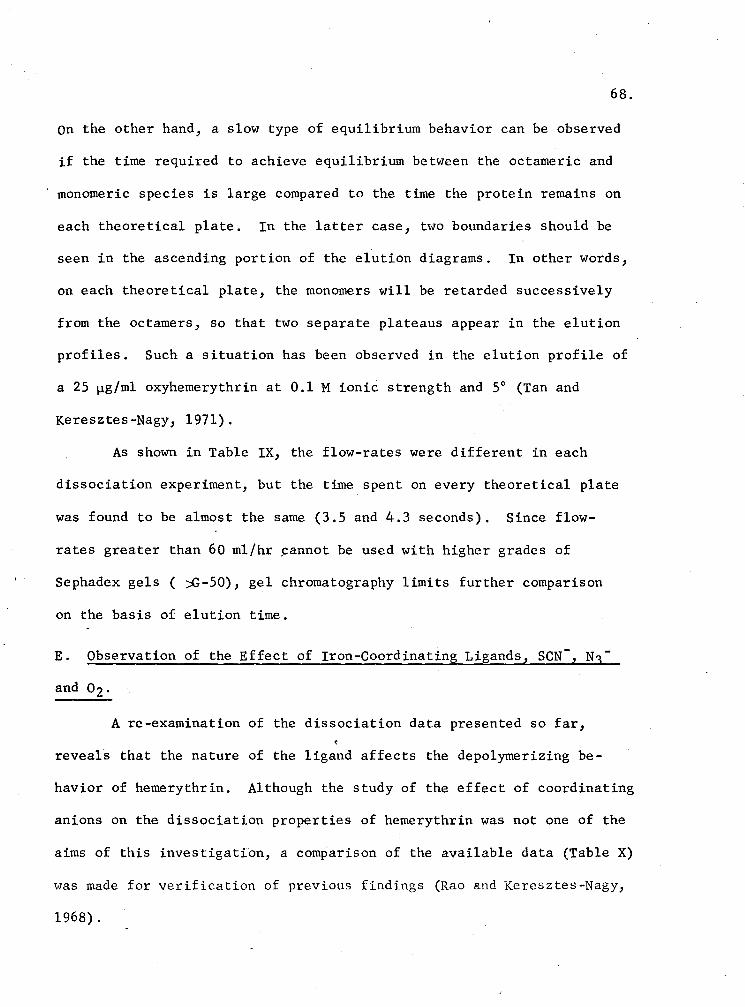
68.
on the other hand, a slow type of equilibrium behavior can be observed
if the time required to achieve equilibrium between the octameric and
monomeric species is large compared to the time the protein remains on
each theoretical plate. In the latter case, two boundaries should be
seen in the ascending portion of the elution diagrams. In other words,
on each theoretical plate, the monomers will be retarded successively
from the octamers, so that two separate plateaus appear in the elution
profiles. Such a situation has been observed in the elution profile of
a 25 µg/ml oxyhemerythrin at 0.1 M ionic strength and 5° (Tan and
Keresztes-Nagy, 1971).
As shown in Table IX, the flow-rates were different in each
dissociation experiment, but the time spent on every theoretical plate
was found to be almost the same (3.5 and 4.3 seconds). Since flow
rates greater than 60 ml/hr ~annot be used with higher grades of
Sephadex gels ( :;::G-50), gel chromatography limits further comparison
on the basis of elution time.
E. Observation of the Effect of Iron-Coordinating Ligands, SCN , N3-
and o2 .
A re-examination of the dissociation data presented so far,
reveals that the nature of the ligand affects the depolymerizing be
havior of hemerythrin. Although the study of the effect of coordinating
anions on the dissociation properties of hemerythrin was not one of the
aims of this investigation, a comparison of the available data (Table X)
was made for verification of previous findings (Rao and Keresztes-Nagy,
1968).
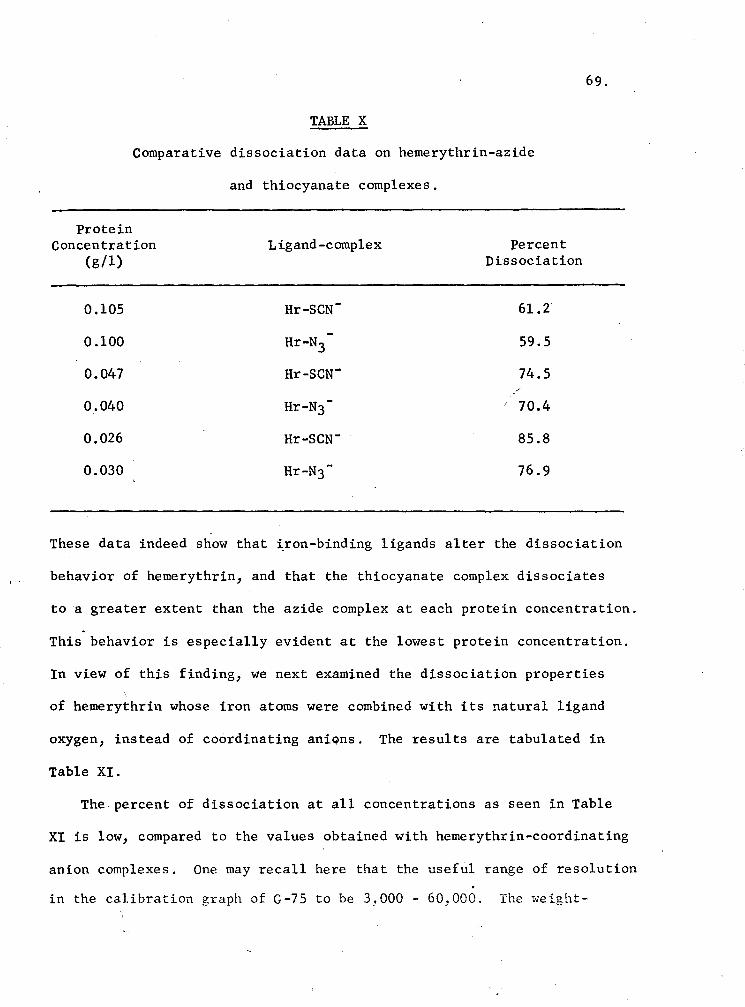
TABLE X
Comparative dissociation data on hemerythrin-azide
Protein Concentration
(g/l)
0.105
0.100
0.047
0.040
0.026
0.030
and thiocyanate complexes.
Ligand-complex
Hr-N3-
Hr-N3-
Percent Dissociation
61.2
59.5
74.5 /
I 70.4
85.8
76.9
69.
These data indeed show that ~ron-binding ligands alter the dissociation
behavior of hemerythrin, and that the thiocyanate complex dissociates
to a greater extent than the azide complex at each protein concentration . .
This behavior is especially evident at the lowest protein concentration.
In view of this finding, we next examined the dissociation properties
of hemerythrin whose iron atoms were combined with its natural ligand
oxygen, instead of coordinating aniqns. The results are tabulated in
Table XI.
The percent of dissociation at all concentrations as seen in Table
XI is low, compared to the values obtained with hemerythrin-coordinating
anion complexes. One may recall here that the useful range of resolution
in the calibration graph of G-75 to be 3,000 - 60,000. The weight-
(,
70.
TABLE XI
Effect of dilution on the dissociation of 0xyhemerythrin1
with a G-75 column (2.2 x 59.5 cm)
Protein Centroid Weight-average Percent Concentration Volume 2, V Molecular weight Dissociation
(mg/ml) (ml) ',
0.176 36.0 102,000 5
0.100 39.7 93,300 13
0.086 40.4 88,900 20
0.068 40.6 87,000 23
0.040 41.4 81,300 28
0.034 42.0 78,500 31
0.027 42.3 71, 000 39
0.020 two apparent plateaus fn the ascending boundary
1. Prepared in 0.01 M Tris-cacodylate (pH 7.0) buffer.
2. The exclusion volume (V0 ) = 33.7 ml.
average molecular weights obtained in these experiments are obviously
in the non-linear portion of the G-75 column calibration plot. Therefore, <
the calculated percent of dissociation must not be considered as an
absolute value at any oxyhemerythrin concentration.
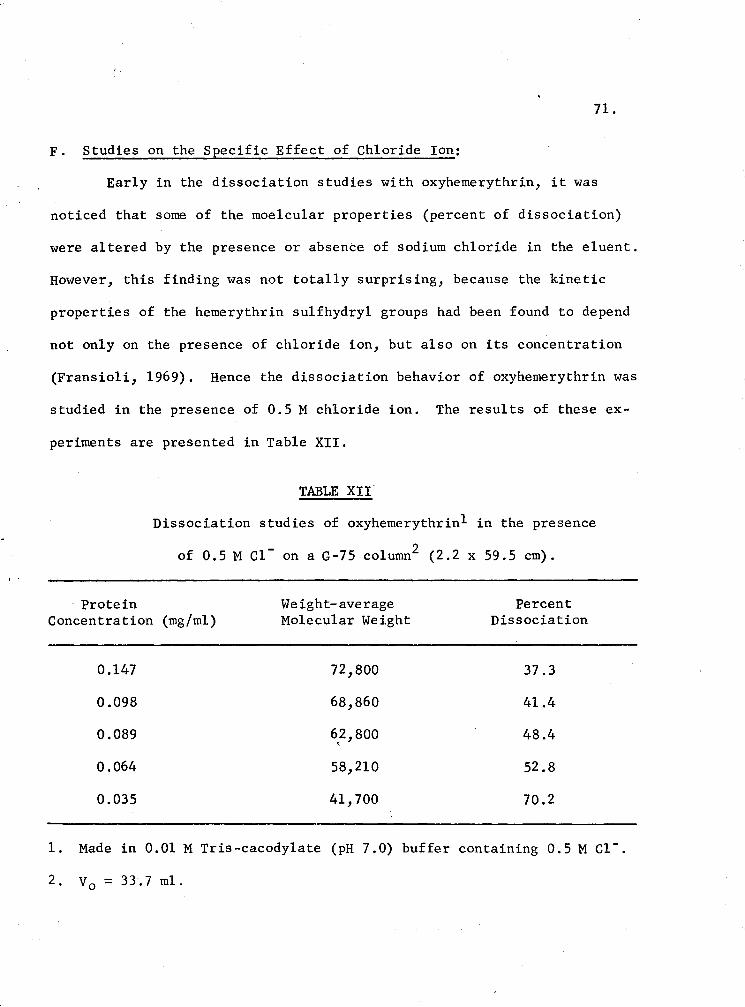
71.
F. Studies on the Specific Effect of Chloride Ion:
Early in the dissociation studies with oxyhemerythrin, it was
noticed that some of the moelcular properties (percent of dissociation)
were altered by the presence or absence of sodium chloride in the eluent.
However, this finding was not totally surprising, because the kinetic
properties of the hemerythrin sulfhydryl groups had been found to depend
not only on the presence of chloride ion, but also on its concentration
(Fransioli, 1969). Hence the dissociation behavior of oxyhemerythrin was
studied in the presence of 0.5 M chloride ion. The results of these ex-
periments are presented in Table XII.
TABLE XII
Dissociation studies of oxyhemerythrinl in the presence
of 0.5 M Cl- on a G-75 column2 (2.2 x 59.5 cm).
Protein Weight-average Percent Concentration (mg/ml) Molecular Weight Dissociation
0.147 72,800 37.3
0.098 68,860 41.4
0.089 62,800 48.4 <
0.064 58,210 52.8
0.035 41,700 70.2
1. Made in 0.01 M Tris-cacodylate (pH 7.0) buffer containing 0.5 M cl-.
2. V0 = 33~7 ml.
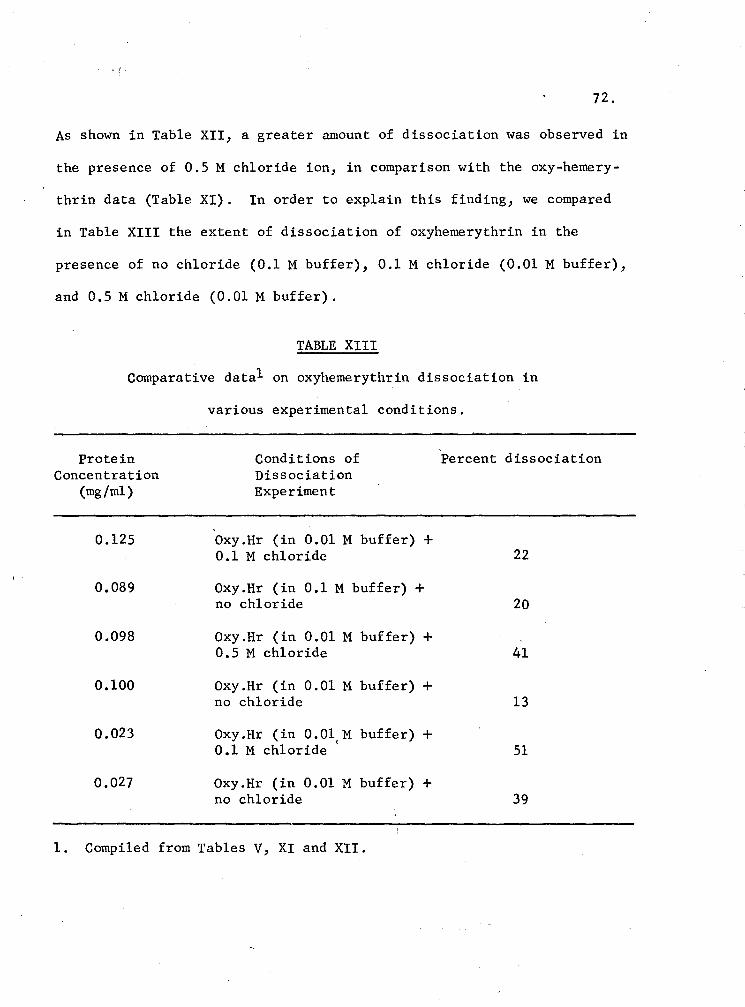
. (
72.
As shown in Table XII, a greater amount of dissociation was observed in
the presence of 0.5 M chloride ion, in comparison with the oxy-hemery-
thrin data (Table XI). In order to explain this finding, we compared
in Table XIII the extent of dissociation of oxyhemerythrin in the
presence of no chloride (0.1 M buffer), 0.1 M chloride (0.01 M buffer),
and 0.5 M chloride (0.01 M buffer).
TABLE XIII
Comparative datal on oxyhemerythrin dissociation in
various experimental conditions.
Protein Conditions of Percent dissociation Concentration Dissociation
(mg/ml) Experiment
0.125 Oxy.Hr (in 0.01 M buffer) + 0.1 M chloride 22
0.089 Oxy.Hr (in 0.1 M buffer) + no chloride 20
0.098 Oxy.Hr (in 0.01 M buffer) + 0.5 M chloride 41
0.100 Oxy.Hr (in 0.01 M buffer) + no chloride 13
0.023 Oxy.Hr (in 0.01 M buffer) + <
0.1 M chloride 51
0.027 Oxy.Hr (in 0.01 M buffer) + no chloride 39
1. Compiled from Tables V, XI and XII.
73.
These data indicate that as the chloride concentration is in
creased to 0.5, the depolymerization of hemerythrin increases, a finding
in agreement with kinetic data of Fransioli (1969). However, one must
also consider the effects on hemerythrin dissociation due solely to the
increase in the ionic strength of the solutions. For this purpose, the
data obtained with oxyhemerythrin made in 0.1 M buffer solution and in
the absence of chloride ion are also included in the above Table XIII.
Some increase in the percent of dissociation was found, which was most
likely due to the increase in ionic strength from 0.01 M to 0.1 M and
the lower protein concentration used (0.089 mg/ml instead of 0.100 mg/ml).
Therefore, any further increase in the dissociation in 0.1 M chloride
can only be explained on the basis of specific effects by the chloride
ion. In spite of higher protein concentration (0.125 mg/ml) an increase
in the dissociation was observed in 0.1 M chloride. Similarly, the
increase in the percent of dissociation in the presence of 0.5 M chloride,
mus~ be due to the specific effects of chloride ion and not because of
the increase in the total ionic strength. The dissociation was examined
at 0.5 M chloride, since this is the level of chloride at which the iron
chloride coordination is known to be not less than 90%. For a further
understanding of the experimental data listed in Table XIII, one must,
therefore, observe the extent of coordination that can occur in oxy
hemerythrin in the mere presence of chloride ion. Such an observation
can be easily carried out by following the changes in the iron-coordina
tion spectra of oxyhemerythrin (See Chapter II). As"shown in Fig. 20,
Cl> 0 c c
..Q ... ·0
(/)
..Q 0
0.30 (
0.15
300
74.
Fig. 20· Spectral Conversion
of a 40 µg/ml protein in 0.5 M
~hloride ion.
1';,intermediate stages 2
3f-chloro complex spectra
380nm
400 A (nm)
500
75.
the spectral changes progress with time·and the final coordination spectra
of the oxyhemerythrin in 0.5 M chloride was found to be exactly identical
with that of a chloride-hemerythrin complex made by the standard dialysis
procedure (Keresztes-Nagy and Klotz, 1965). In spite of the identical
spectral nature of these two hemerythrin complexes, the possibility that
they might possess dissimilar dissociation properties cannot be ruled out.
The percent dissociation of a 40 µg/ml oxyhemerythrin solution at three
different stages of spectral conversion was therefore examined. Table
XIV lists the experimental conditions and the results of these experiments.
TABLE XIV
Dissociation behavior of a 40 µg/ml oxyhemerythrinl in 0.1 M
Experimental conditions
Sample applied at 60 ml/hr innnediately after preparation
Sample applied at 24 ml/hr innnediately after preparation
Sample applied at 24 ml/hr one hour after preparation
chloride ion.
Time after Centroid dilution Volume2
into chloride (ml) (mts)
43 42.5
85 42.6
140 42.4
Weight- Percent Average Dissoci-M0lecular at ion Weight
55,100 56.0
54,500 56.4
56,000 55.8
1. Prepared in 0.01 M (pH 7.0) Tris-calcodylate buffer medium.
2. V0 = 32.0 ml. A G-75 column (2.2 x 49.5 cm) is used.
Percent Spectral Con-version
36
67
100
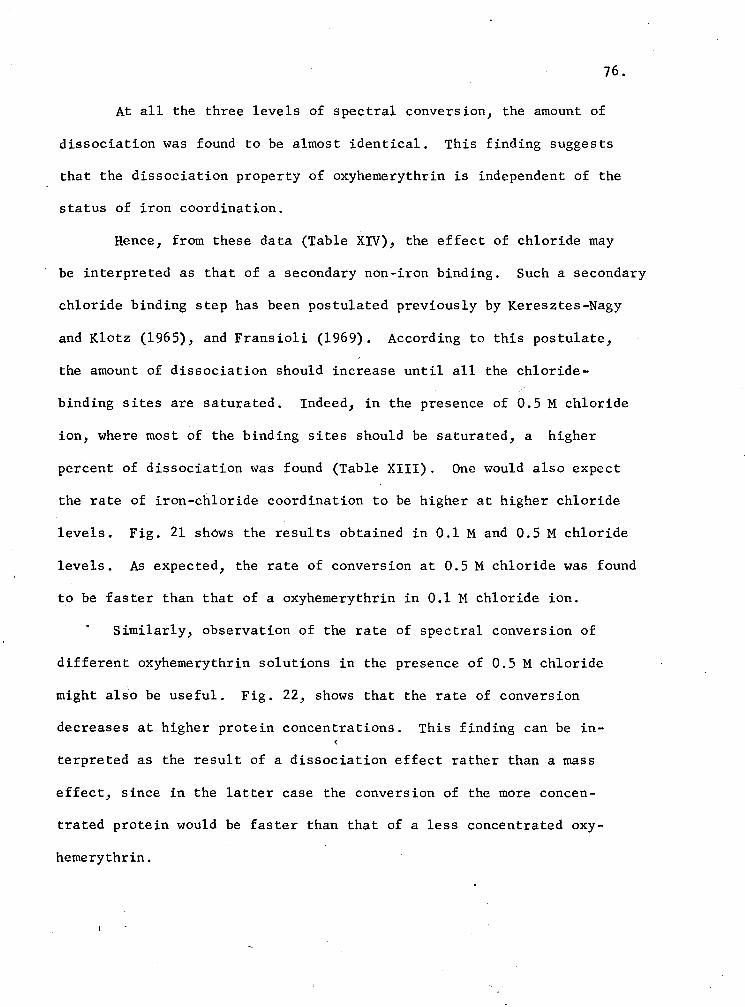
76.
At all the three levels of spectral conversion, the amount of
dissociation was found to be almost identical. This finding suggests
that the dissociation property of oxyhemerythrin is independent of the
status of iron coordination.
Hence, from these data (Table XIV), the effect of chloride may
be interpreted as that of a secondary non-iron binding. Such a secondary
chloride binding step has been postulated previously by Keresztes-Nagy
and Klotz (1965), and Fransioli (1969). According to this postulate,
the amount of dissociation should increase until all the chloride
binding sites are saturated. Indeed, in the presence of 0.5 M chloride
ion, where most of the binding sites should be saturated, a higher
percent of dissociation was found (Table XIII). One would also expect
the rate of iron-chloride coordination to be higher at higher chloride
levels. Fig. 21 shows the results obtained in 0.1 Mand 0.5 M chloride
levels. As expected, the rate of conversion at 0.5 M chloride was found
to be faster than that of a oxyhemerythrin in 0.1 M chloride ion.
Similarly, observation of the rate of spectral conversion of
different oxyhemerythrin solutions in the presence of 0.5 M chloride
might also be useful. Fig. 22, shows that the rate of conversion
decreases at higher protein concentrations. This finding can be in
terpreted as the result of a dissociation effect rather than a mass
effect, since in the latter case the conversion of the more concen
trated protein would be faster than that of a less concentrated oxy
hemerythrin.
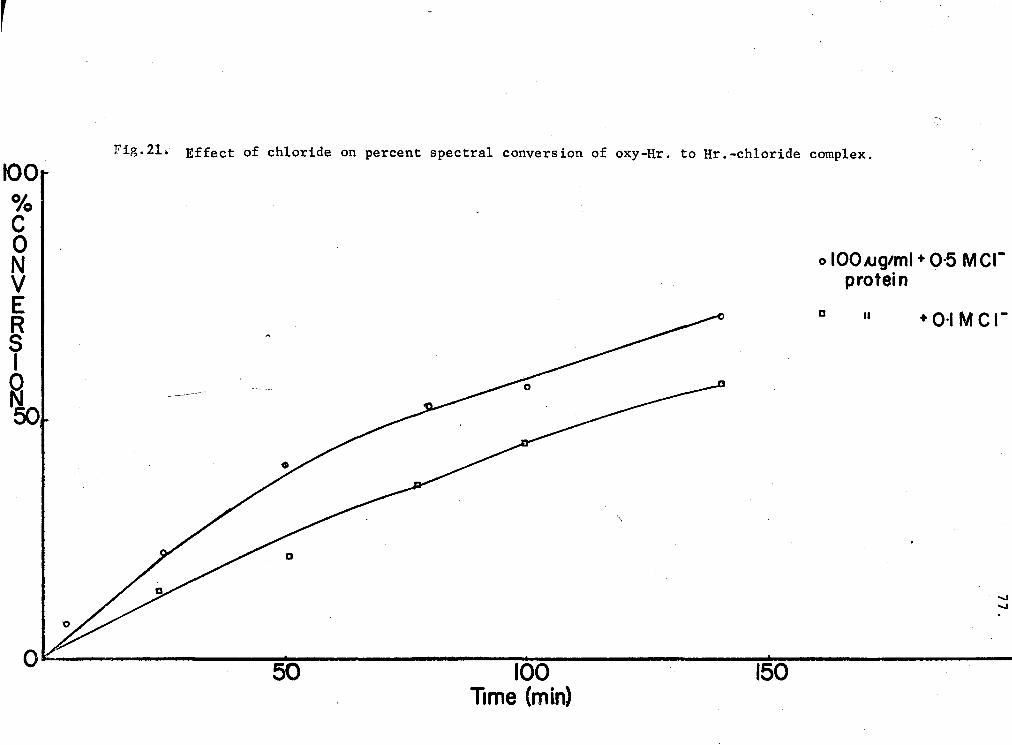
r
100 O/o c 0 N v E R s I
2 50
Fig.21. Effect of chloride on percent spectral conversion of oxy-Hr. to Hr.-chloride complex.
\
D
o 100,ucyml + 0·5 MCIprotein
D II + O·I MC 1-
" "
0 50 100 150 Time (min)
~ l
;•'.1
100
O/o c 0 N v E 150 R s I
~
· ..
Fig· 22 Effect of protein concentration on percent spectral conversion of oxy Hr. to
chloro complex.
. 50 100 Time (min)
0 30 A.Jg/ml
0 70A.Jg1 ml
A 380 A.Jg/ml
150 -...J 00
79.
So far, we have considered experimental data which strongly in-
dicate the binding of chloride ion at sites other than the iron atoms
in oxyhemerythrin. One may also deduce from the observed independence
of the dissociation effect (in relation to the amount of iron-chloride
coordination, Table XIV), that the non-iron sites bind with greater
speed. In addition, this binding has been shown to have a greater
effect on the -SH group reactivity, than the iron-chloride binding
(Fransioli, 1969).
However, direct evidence for such a fast chloride binding at
sites other than the iron atoms is lacking. Therefore, this investi-
gation sought to provide the evidence from direct binding experiments
on G-25 columns. But before the results of these experiments are
examined, it might be worthwhile to examine the evidence obtained from
some experiments performed as an extension on the observations of the
coordination spectral conversion studies.
As indicated earlier, the dissociation properties of oxyhemery-
thrin are affected by chloride ions independently of the changes at the
iron atoms (oxygen release and iron-chloride coordination). Nonethe-
less, does the conformation (in relation to dissociation properties)
< remain the same after complete iron-chloride coordination (100%
spectral conversion)? An answer to this question is provided by the
data in Table XV. The amount of dissociation of a 46.5 µg/ml oxy-
hemerythrin in 0.5 M chloride has been examined, long after complete
oxy-chlorohemerythrin spectral conversion was achieve\}.
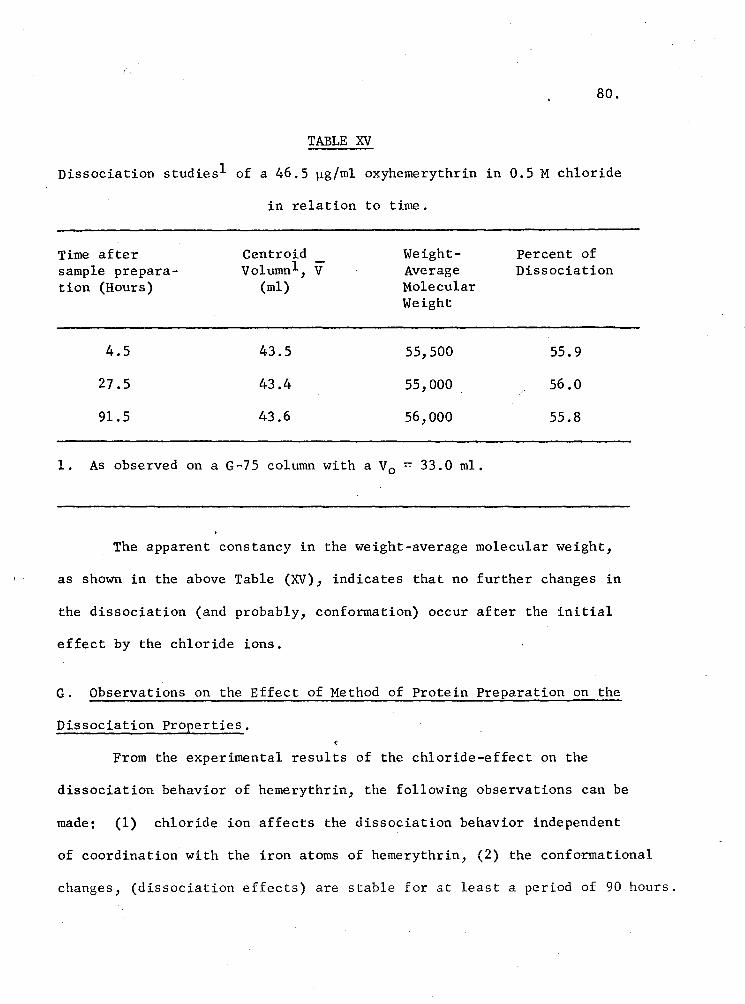
80.
TABLE XV
Dissociation studies! of a 46.5 µg/ml oxyhemerythrin in 0.5 M chloride
in relation to time.
Time after Centroid Weight- Percent of sample prepara- Volumnl, v Average Dissociation tion (Hours) (ml) Molecular
Weight
4.5 43.5 55,500 55.9
27.5 43.4 55,000 56.0
91.5 43.6 56,000 55.8
1. As observed on a G-75 column with a Vo = 33 .0 ml.
The apparent constancy in the weight-average molecular weight,
as shown in the above Table (XV), indicates that no further changes in
the dissociation (and probably, conformation) occur after the initial
effect by the chloride ions.
G. Observations on the Effect of Method of Protein Preparation on the
Dissociation Properties.
From the experimental results of the chloride-effect on the
dissociation behavior of hemerythrin, the following observations can be
made: (1) chloride ion affects the dissociation behavior independent
of coordination with the iron atoms of hemerythrin, (2) the conformational
changes, (dissociation effects) are stable for at least a period of 90 hours.
81.
With respect to earlier evidence (Keresztes-Nagy and Klotz,
1965; Fransioli, 1969; Table x1 This chapter), of chloride effects
on the dissociability and reactivity of sulfhydryl groups through
iron-coordination, what do those observations mean? In other words,
are the conformations which arise from chloride-iron binding and from
chloride binding at other sites in the protein moeity one and the
same? The fact that their coordination spectra became identical with
time does not indicate identical conformations.
Indirect evidence that the conformations are not the same has
already been furnished by some of our experiments with the thiocyanate-
hemerythrin complex. Originally, these experiments were performed to
obtain a hemerythrin-thiocyanate complex whose sulfhydryl groups are
in the reduced state, since thiocyanate ion tends to oxidize the sul-
fhydryl groups during dialysis and with time. We tried to prepare a
complex with this ion by simple dilution of the oxyprotein into the
thiocyanate-containing buffer. Due to the rapid exchange of oxygen
with thiocyanate ion, a hemerythrin complex having the same spectral
characteristics as that derived from the dialysis procedure (Keresztes-
Nagy and Klotz, 1965), was obtained within 20-30 minutes after dilution.
The percent of dissociation of one such hemerythrin-thiocyanate
preparation was examined at several protein concentrations. The
results are shown in Table XVI. \ ' I
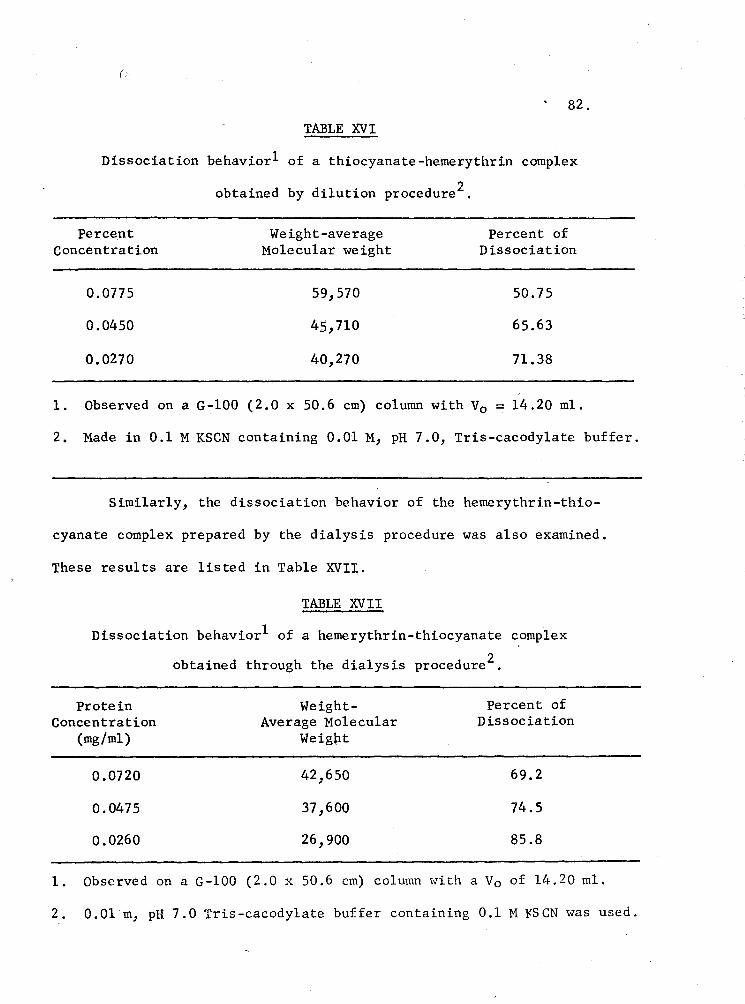
(!
82.
TABLE XVI
Dissociation behaviorl of a thiocyanate-hemerythrin complex
obtained by dilution procedure2 .
Perce.nt Weight-average Percent of Concentration Molecular weight Dissociation
0.0775 59,570 50. 75
0.0450 45, 710 65.63
0.0270 40,270 71.38
1. Observed on a G-100 (2.0 x 50.6 cm) column with V0 = 14.20 ml.
2. Made in 0.1 M KSCN containing 0.01 M, pH 7.0, Tris-cacodylate buffer.
Similarly, the dissociation behavior of the hemerythrin-thio-
cyanate complex prepared by the dialysis procedure was also examined.
These results are listed in Table XVII.
TABLE XVII
Dissociation behavior1 of a hemerythrin-thiocyanate complex
obtained through the dialysis procedure2 .
Protein Concentration
(mg/ml)
0.0720
0.0475
0.0260
WeightAverage Molecular
Weigtit
42,650
37 ,600
26,900
Percent of Dissociation
69.2
74.5
85.8
1. Observed on a G-100 (2.0 x 50.6 cm) column with a V0 of 14.20 ml.
2. 0.01 m, pH 7.0 Tris-cacodylate buffer containing 0.1 M KSCN was used.
83.
As can be seen from Tables XV and XVI, at each (almost identical)
concentration, the percent dissociation of the thiocyanate complex
obtained by the dialysis procedure was significantly different from
that of the complex obtained by the direct dilution method. Note that
both these preparations possessed identical iron-coordination spectra.
The changes in the dissociation properties could have been brought
about by thiocyanate linkages at sites other than the iron atoms.
The above results, therefore, show that identical coordination
spectra of hemerythrin (proteins) do not necessarily represent the
identical nature of their conformations.
Returning to the question concerning the nature of the chloro-
hemerythrin complex prepared by different procedures, it is entirely
possibly that, irrespective of identical coordination spectra, the
conformations may be different.
Fig. 23 shows the two different methods by which chloro complex
was obtained. The oxygen of the oxyform is rapidly exchanged with
fluoride ions, as shown in scheme II, and the complex is then dialized
against chloride-containing buffer to yield a chloro complex. Aqua
form is the intermediate-ligand complex in this procedure. The aqua-<
Hr has been found to produce the same chloride complex, either by
dialysis or dilution with 0.5 M chloride, since they showed identical
dissociation behavior at identical protein concentrations, as shown in
Table XVIII.
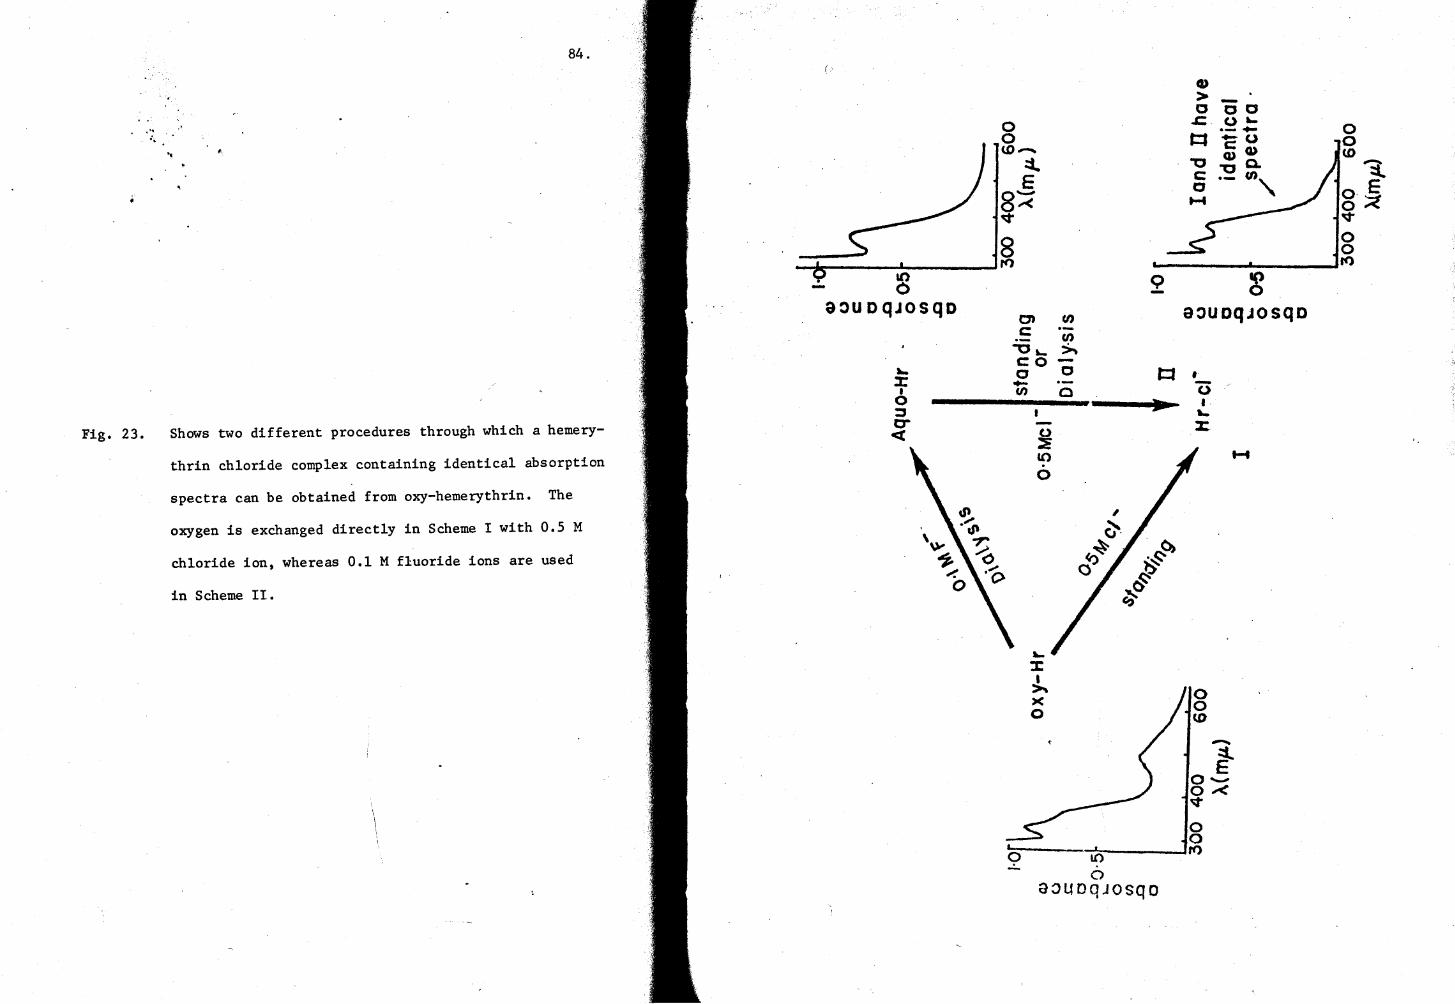
84.
'
... '• .. ..
Fig. 23. Shows two different procedures through which a hemery-
thrin chloride complex containing identical absorption
spectra can be obtained from oxy-hemerythrin. The
oxygen is exchanged directly in Scheme I with 0.5 M
chloride ion, whereas 0.1 M fluoride ions are used
in Scheme II.
(•
0 0 w-
:t.. E
8:<" v
8 __ *"' ______ __.._ ______ __.rt)
. - 8 S:>UDQJOSQD
... :c • 0 :J 0-<t:
O> c
-u 'co 0 -U>
0
~ U)
0
... :c • ~ )(
0
U>
Cl> ~ -0 ·-0
9 -
l:l ,.
l()
0 a~uoqJosqo
Q,)
> -0 cc .c (,) ...
·-+- 0 ~ - (,) 0 CG> "tJ Q) Q.
(.0
c: "tJ -a:. 0 ·- Cl>' g·~ ......
v 0 0 l'C')
8 a~uoqJosqo
, -(,) I ....
:r .....
0 0 <D -~ o-o.-< v 0 0 rt)
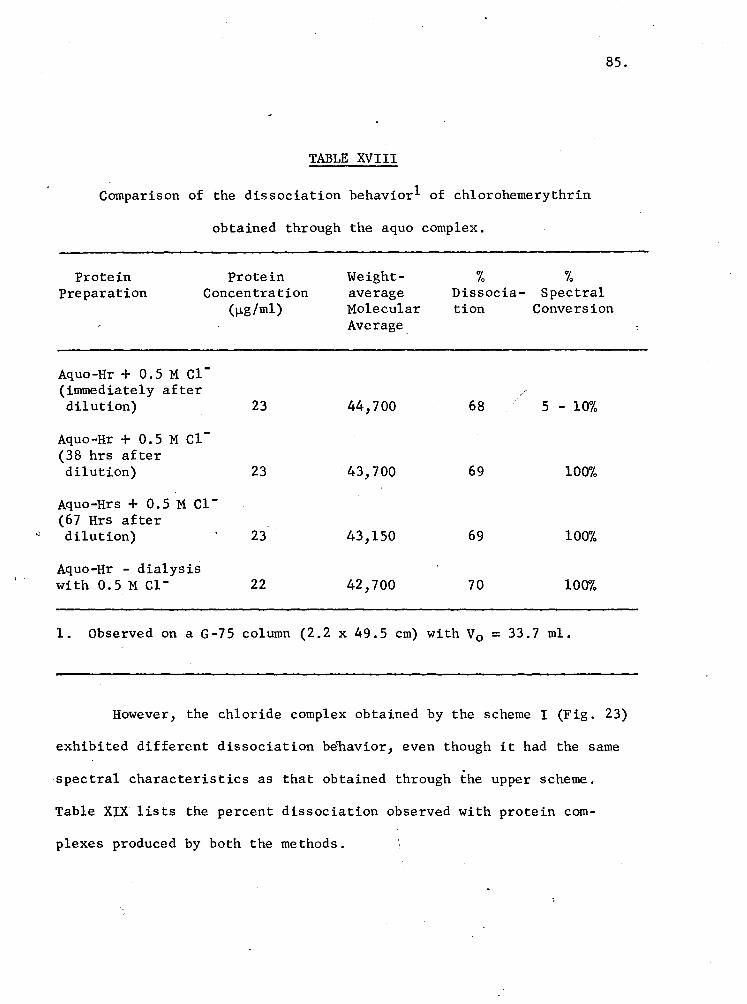
85.
TABLE XVIII
Comparison of the dissociation behaviorl of chlorohemerythrin
obtained through the aqua complex.
Protein Protein Weight- % % Preparation Concentration average Dissocia- Spectral
(µg/ml) Molecular ti on Conversion Average
Aqua-Hr+ 0.5 M Cl-(innnediately after ,. /
dilution) 23 44,700 68 5 - 10%
Aqua-Hr+ 0.5 M Cl-(38 hrs after dilution) 23 43,700 69 100%
Aqua-Hrs+ 0.5 M Cl-(67 Hrs after
(! dilution) 23 43,150 69 100%
Aqua-Hr - dialysis with 0.5 M c1- 22 42,700 70 100'70
1. Observed on a G-75 column (2.2 x 49.5 cm) with V0 = 33. 7 ml.
However, the chloride complex obtained by the scheme I (Fig. 23)
exhibited different dissociation b~havior, even though it had the same
spectral characteristics as that obtained through the upper scheme.
Table XIX lists the percent dissociation observed with protein com-
plexes produced by both the methods.
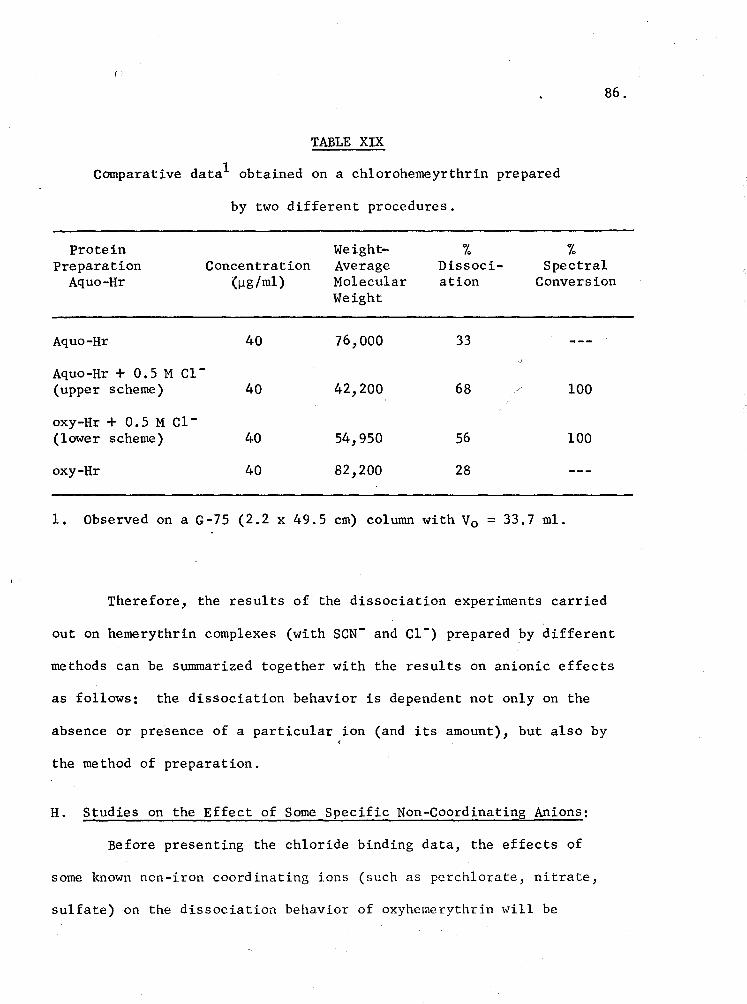
(;
86.
TABLE XIX
Comparative data1 obtained on a chlorohemeyrthrin prepared
by two different procedures.
Protein Preparation
Aquo-Hr Concentration
(µg/ml)
WeightAverage Molecular Weight
% Dissociation
% Spectral
Conversion
Aquo-Hr 40 76,000 33
Aquo-Hr + O. 5 M Cl -(upper scheme) 40 42,200 68 100
oxy-Hr + 0.5 M c1-(lower scheme) 40 54,950 56 100
oxy-Hr 40 82,200 28
1. Observed on a G-75 (2.2 x 49.5 cm) column with V0 = 33. 7 ml.
Therefore, the results of the dissociation experiments carried
out on hemerythrin complexes (with SCN- and Cl-) prepared ?Y different
methods can be sunnnarized together with the results on anionic effects
as follows: the dissociation behavior is dependent not only on the
absence or presence of a particular ion (and its amount), but also by <
the method of preparation.
H. Studies on the Effect of Some Specific Non-Coordinating Anions:
Before presenting the chloride binding data, the effects of
some known non-iron coordinating ions (such as perchlorate, nitrate,
sulfate) on the dissociation behavior of oxyhemerythrin will be
87.
considered. This is done in order to call attention to the similarity
in the present observations with non-iron chloride bindings and the
specific binding by perchlorate and other ions, also at non-iron sites
(Darnall et.al., 1968; Garbett et.al., 197la).
Darnall and coworkers (1968) have shown with ultracentrifugation
technique that the non-coordinating ions (perchlorate, nitrate, and
sulfate) reduce the dissociation of hemerythrin octamer. Previously,
we have confirmed the effect of perchlorate ion on dissociation by gel
chromatographic experiments (Rao, 1969). Now, two more ions, acetate
and bromide, have been examined for their effects on the dissociation
of oxyhemerythrin. The concentration of the ion used was 0.1 M, and
the protein was diluted into the ion-containing buffer to a concen
tration of approximately 25 µg/ml. Table XX lists the results of these
dissociation experiments. For comparison purposes, the observed extent
of dissociation of a 22 µg/ml aquo-Hr is also included in this table.
Recently, Garbett et.al. (197la) have provided evidence that
perchlorate ion (more than the other non-coordinating ions, nitrate and
sulfate) decreases the dissociation of hemerythrin by binding to, most
probably, the histidine residues in the protein. From the results in
Table XX, acetate and bromide appare<ntly do not affect the properties
the same way as the perchlorate ion.
It is hoped that the binding-experimental data can be presented
here in perspective with the specific binding of non-coordinating
ions.
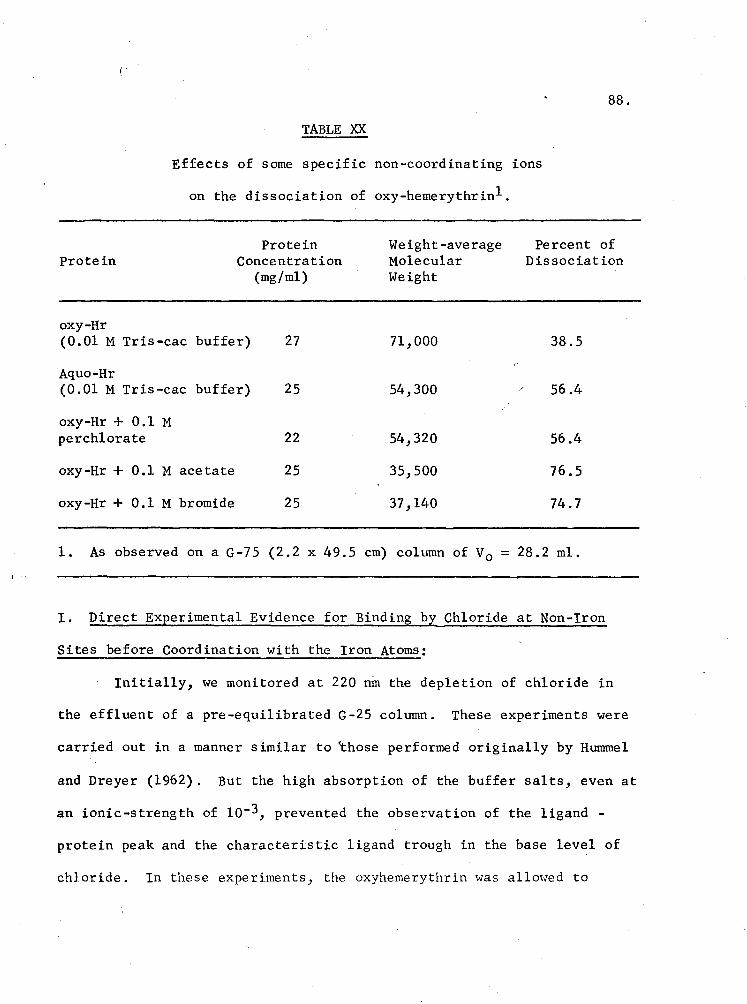
(;
TABLE XX
Effects of some specific non-coordinating ions
on the dissociation of oxy-hemerythrinl.
88.
Protein Protein
Concentration (mg/ml)
Weight-average Molecular Weight
Percent of Dissociation
oxy-Hr (0.01 M Tris-cac buffer) 27 71, 000 38.5
Aquo-Hr (0.01 M Tris-cac buffer) 25 54,300 /~ 56 .4
oxy-Hr + 0.1 M perchlorate 22 54,320 56.4
oxy-Hr + 0.1 M acetate 25 35,500 76.5
oxy-Hr + 0.1 M bromide 25 37,140 74.7
1. As observed on a G-75 (2.2 x 49.5 cm) column of V0 = 28.2 ml.
I. Direct Experimental Evidence for Binding by Chloride at Non-Iron
Sites before Coordination with the Iron Atoms:
Initially, we monitored at 220 nm the depletion of chloride in
the effluent of a pre-equilibrated G-25 column. These experiments were
carried out in a manner similar to ~hose performed originally by Hummel
and Dreyer (1962). But the high absorption of the buffer salts, even at
an ionic-strength of lo-3, prevented the observation of the ligand -
protein peak and the characteristic ligand trough in the base level of
chloride. In these experiments, the oxyhemerythrin was allowed to
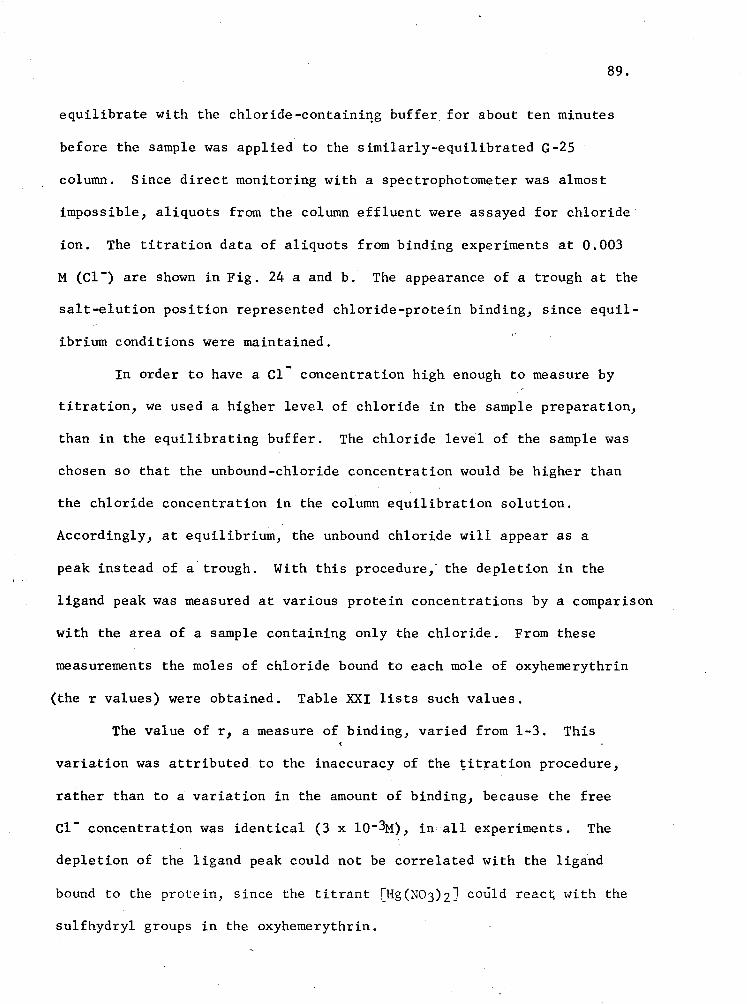
89.
equilibrate with the chloride-containi~g buffer for about ten minutes
before the sample was applied to the similarly-equilibrated G-25
column. Since direct monitoring with a spectrophotometer was almost
impossible, aliquots from the column effluent were assayed for chloride
ion. The titration data of aliquots from binding experiments at 0.003
M (Cl-) are shown in Fig. 24 a and b. The appearance of a trough at the
salt-elution position represented chloride-protein binding, since equil
ibrium conditions were maintained.
In order to have a Cl concentration high enough to measure by
titration, we used a higher level of chloride in the sample preparation,
than in the equilibrating buffer. The chloride level of the sample was
chosen so that the unbound-chloride concentration would be higher than
the chloride concentration in the column equilibration solution.
Accordingly, at equilibrium, the unbound chloride will appear as a
peak instead of a trough. With this procedure; the depletion in the
ligand peak was measured at various protein concentrations by a comparison
with the area of a sample containing only the chloride. From these
measurements the moles of chloride bound to each mole of oxyhemerythrin
(the r values) were obtained. Table XX! lists such values.
The value of r, a measure of binding, varied from 1-3. This
variation was attributed to the inaccuracy of the titration procedure,
rather than to a variation in the amount of binding, because the free
Cl- concentration was identical (3 x l0-3M), in all experiments. The
depletion of the ligand peak could not be correlated with the ligand
bound to the protein, since the titrant [Hg(N03)2J could reac4 with the
sulfhydryl groups in the oxyhemerythrin.
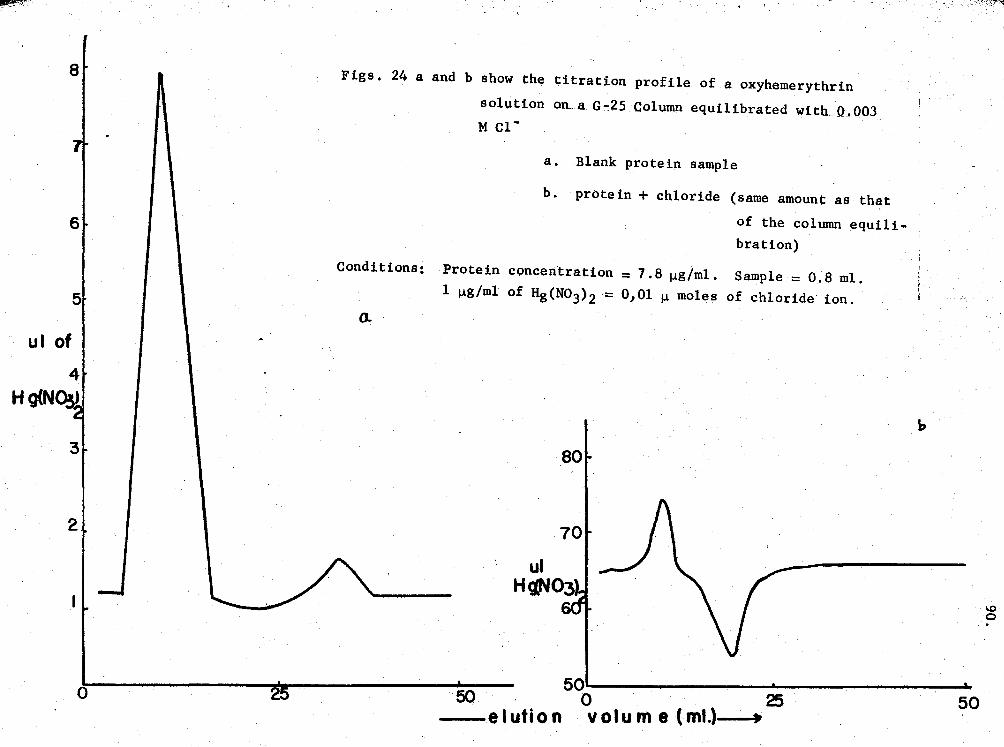
11'§1!1', ... ~.
8 Figs. 24 a and b show the titration profile of a oxyhemerythrin
solution on_ a G-25 Column equilibrated with_ Q_. 003 M Cl-
a. Blank protein sample
... ·;~~t~
b. protein+ chloride (same amount as th~t
of the column equili-6~ I I bration)
5
ul of
4 Hg(NCA>
3
2.
0
Conditions: Protein concentration = 7 .8 µg/ml. Sample = 0.8 ml.
1 µg/ml of Hg(N03) 2 = 0,01 µ moles of chloride ion.
0.
80
70
"
50'-------------------------------------~ 50 0 25 50
--elution volume (ml.) •
l.O 0 .
91.
TABLE XXI
Experimental data of chloride-hemerythrin binding by the Hg(N03)2
titration procedure
oxy-hemerythrin Amount of Number of moles of chloride concentration chloride
mg/ml µmoles of depleted (µmoles)
mole of oxy-hemerythrin ( r )
octamer
34 0.54 1.14 2 .11
29 0.45 0.72 L61
24 0.38 0.42 1.10
22* 0.35 1.15 3.29 + o.s
17 0.27 0.21 0. 78
16.5* 0.26 o. 7 5 2.88
12.6 0.20 0.08 0.04
Experimental conditions: The G-25 column was equilibrated with 0.003 M (Cl-)
*
Blank chloride sample contained a 0.006 M Cl-.
Sample size 1.7 ml; Aliquots from titration 100 µl.
Each fraction collected = 0.5 ml (
A different stock oxyhemerythrin solution was used in these experiments.
Because of these limitations of the method, we adopted a scin-
tillation-counting procedure using labelled chloride. A series of binding
experiments were performed at various oxyhemerythrin concentrations, and
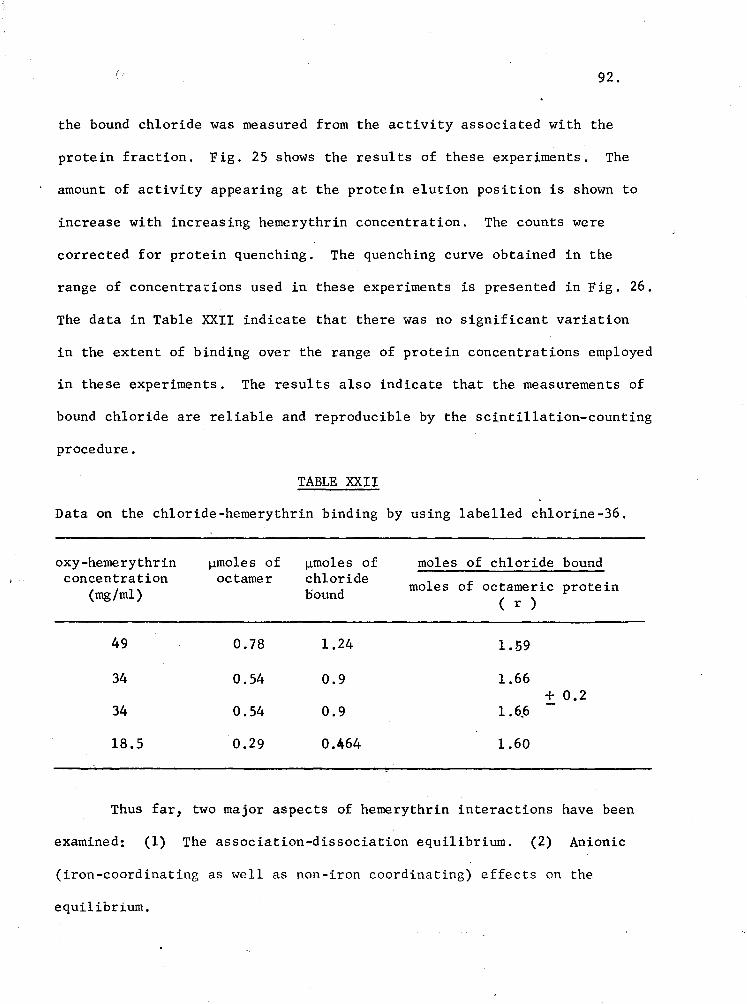
(; 92.
the bound chloride was measured from the activity associated with the
protein fraction. Fig. 25 shows the results of these experiments. The
amount of activity appearing at the protein elution position is shown to
increase with increasing hemerythrin concentration. The counts were
corrected for protein quenching. The quenching curve obtained in the
range of concentrations used in these experiments is presented in Fig. 26.
The data in Table XXII indicate that there was no significant variation
in the extent of binding over the range of protein concentrations employed
in these experiments. The results also indicate that the measurements of
bound chloride are reliable and reproducible by the scintillation-counting
procedure.
TABLE XX!!
Data on the chloride-hemerythrin binding by using labelled chlorine-36.
oxy-hemerythrin µmoles of µmoles of moles of chloride bound concentration octamer chloride moles of octameric protein (mg/ml) lfound
( r )
49 0.78 1.24 1.59
34 0.54 0.9 1.66 + 0.2
34 0.54 0.9 1.6_6
18.5 0.29 0.464 1.60
Thus far, two major aspects of hemerythrin interactions have been
examined: (1) The association-dissociation equilibrium. (2) Anionic
(iron-coordinating as well as non-iron coordinating) effects on the
equilibrium.
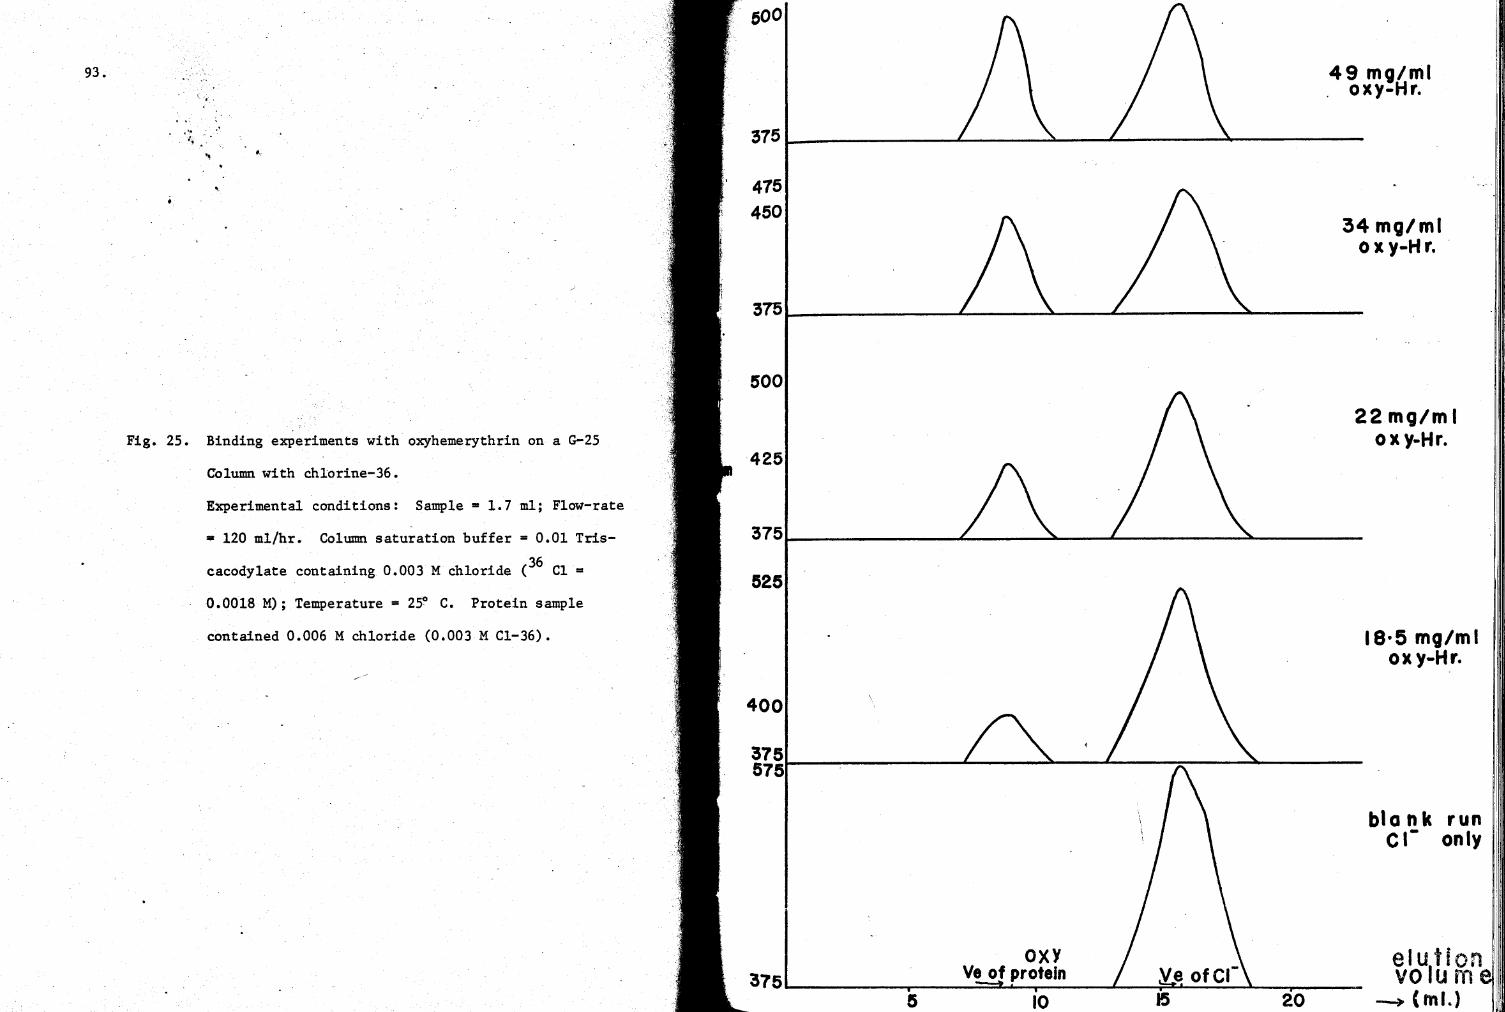
93. .. . . . .
..• . ·' .. ., f!,
Fig. 25. Binding experiments with ox:yhemerythrin on a G-25
Column with chlorine-36.
Experimental conditions: Sample= 1.7 ml; Flow-rate
= 120 ml/hr. Column saturation buffer = 0.01 Tris-
36 cacodylate containing 0.003 M chloride ( Cl =
0.0018 M); Temperature= 25° C. Protein sample
contained 0.006 M chloride (0.003 M Cl-36).
500
375
475 450
500
425
525
400
20
49 mg/ml . oxy-Hr .
34 mQ/ml ox y-H r.
22 mg/m I ox Y-Hr.
18·5 mg/ml ox y-Hr.
blank run Cl- only
elu1tfon
1
vo um 1
--> (ml.) ..
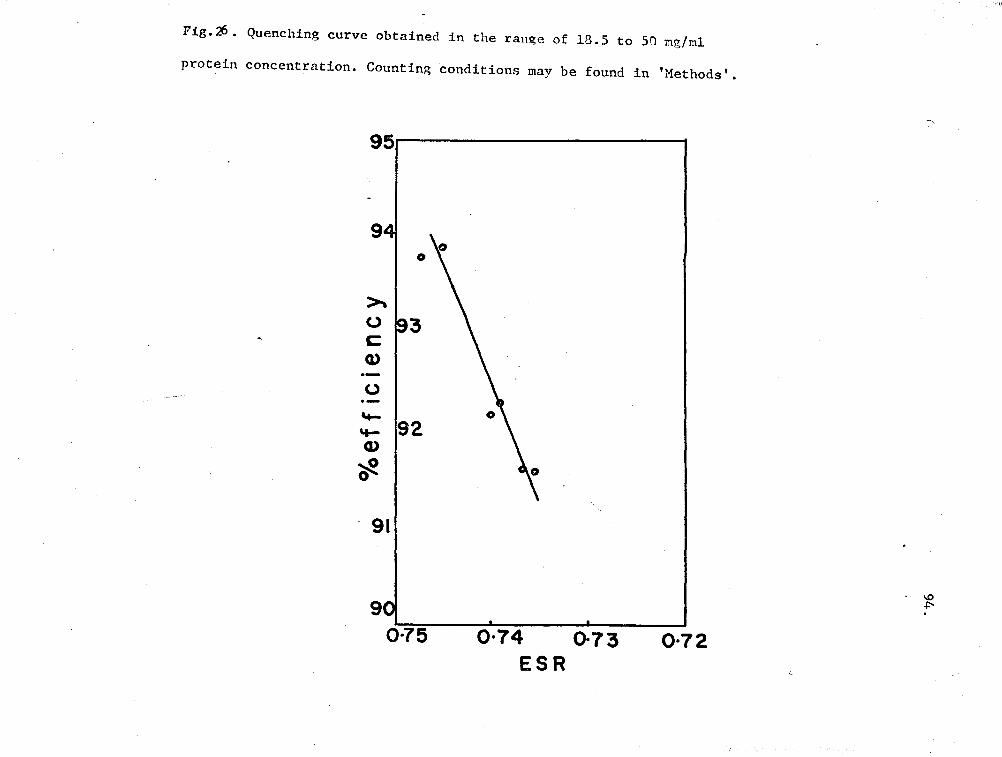
II"''
Fig.26. Quenching curve obtained in the range of 18.5 to Sf'l mg/ml
protein concentration. Counting ·conditions may be found in 'Methods'.
95.--~~~~~~~~--
9 0
>-0 193 c Q)
-0 ·-'4-'+- 192 Q)
~ 0
91
9 0·75 0·74 0-73 0·72
ESR
\,C)
+:--
,,n~
95.
Since the sulfhydryl groups of hemerythrin have been previously
shown (Keresztes-Nagy and Klotz, 1965; Egan, 1969; Duke, et.al., 1971)
to affect both of the above interactions, an examination of the nature
of the sulfhydryl-mercurial reaction and its influence on the observed
equilibrium and anion binding was logical, if not absolutely essential.
Furthermore the use of gel chromatography for such an examination
appeared to be advantageous since the reactants could possibly be
separated from the reaction mixture as compared to the conventional
spectrophotometeric procedure (Boyer, 1954).
Therefore, the sulfhydryl group-mercurial interactions were next
studied with gel-chromatographic technique.
J. Studies on the Nature of Mercurial-Hemerythrin Interactions:
(1) Binding of pMB to hemerythrin.
A slowly-reacting complex of hemerythrin, such as the oxy
hemerythrin was used and the chromatographic elution was carried out
at 5 - 8°C with excess mercurial concentrations. A 0.9 x 35 cm
Sephadex G-25 column pre-equilibrated with pH 7.0; 0.01 M Tris
cacodylate buffer which was also used for the elution of 0.2 ml samples.
Fig. 27 shows the resolution between oxyhemerythrin (2.7 x lo-5 M) and
NaN3- sample. The elution was monitored at 250 nm and the area under
the protein peak was measured and found to be 7.3 sq. ems. A 60 ml/hr
flow rate was used for rapid measurements of mercurial-protein reaction.
The exclusion volume, measured with a blue dextran sample, was found to
be 7.0 ml and the elution positions of the protein an& salt were 8.0 ml
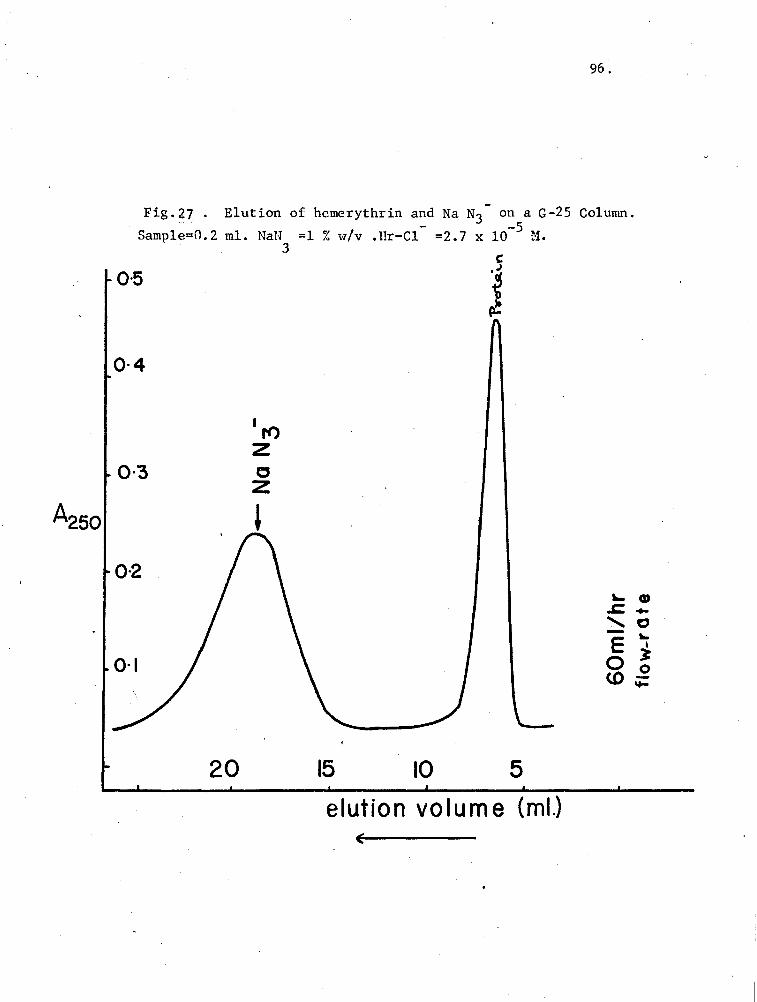
96.
Fig.?7 . Elution of hemerythrin and Na N3- on a G-25 Column. - -5 Sample==0.2 ml. NaN =1 % w/v .Hr-Cl =2.7 x 10 M.
0·5
0·4
0·"3
20
I rt')
z c z
'
3
15 10 5
elution vo I um e (ml.)
'- CD .c ... ....... CJ - ... E i 0 0 w ;:
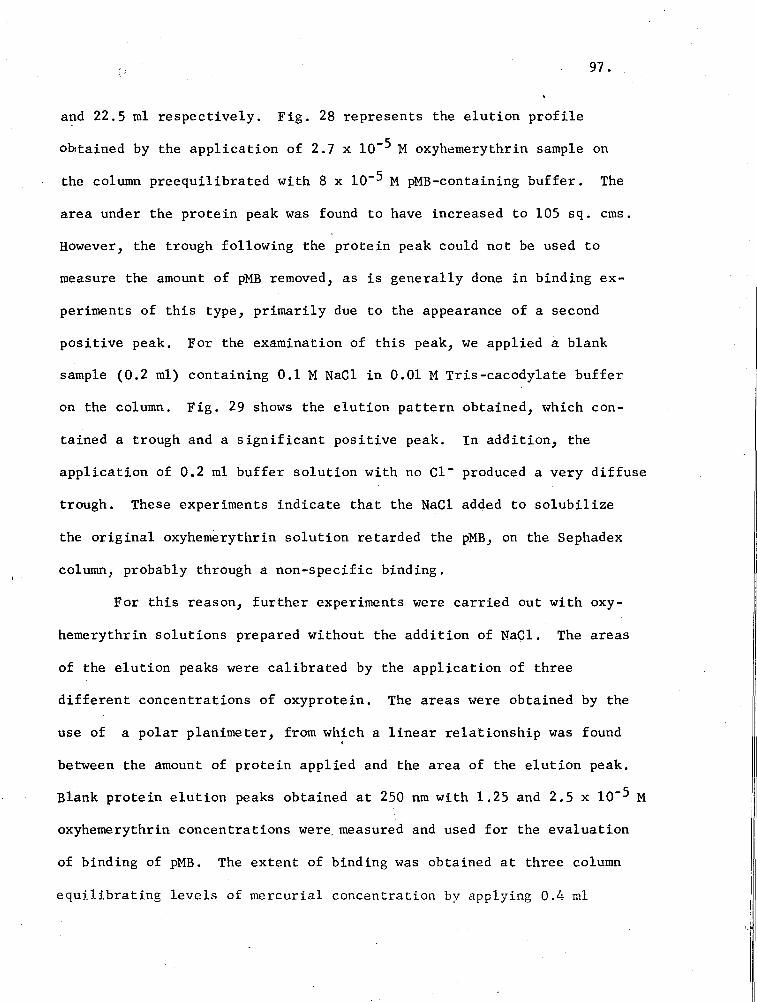
(' 97.
and 22.5 ml respectively. Fig. 28 represents the elution profile
o~tained by the application of 2.7 x 10⁻⁵ M oxyhemerythrin sample on
the column preequilibrated with 8 x lo-5 M pMB-containing buffer. The
area under the protein peak was found to have increased to 105 sq. ems.
However, the trough following the protein peak could not be used to
measure the amount of pMB removed, as is generally done in binding ex-
periments of this type, primarily due to the appearance of a second
positive peak. For the examination of this peak, we applied a blank
sample (0.2 ml) containing 0.1 M NaCl in 0.01 M Tris-cacodylate buffer
on the column. Fig. 29 shows the elution pattern obtained, which con-
tained a trough and a significant positive peak. In addition, the
application of 0.2 ml buffer solution with no c1- produced a very diffuse
trough. These experiments indicate that the NaCl added to solubilize
the original oxyhemerythrin solution retarded the pMB, on the Sephadex
column, probably through a non-specific binding.
For this reason, further experiments were carried out with oxy-
hemerythrin solutions prepared without the addition of NaCl. The areas
of the elution peaks were calibrated by the application of three
different concentrations of oxyprotein. The areas were obtained by the
use of a polar planimeter, from which a linear relationship was found <
between the amount of protein applied and the area of the elution peak.
Blank protein elution peaks obtained at 250 nm with 1.25 and 2.5 x lo-5 M
oxyhemerythrin concentrations were. measured and used for the evaluation
of binding of pMB. The extent of binding was obtained at three column
equilibrating levels of mercurial concentration by applying 0.4 ml
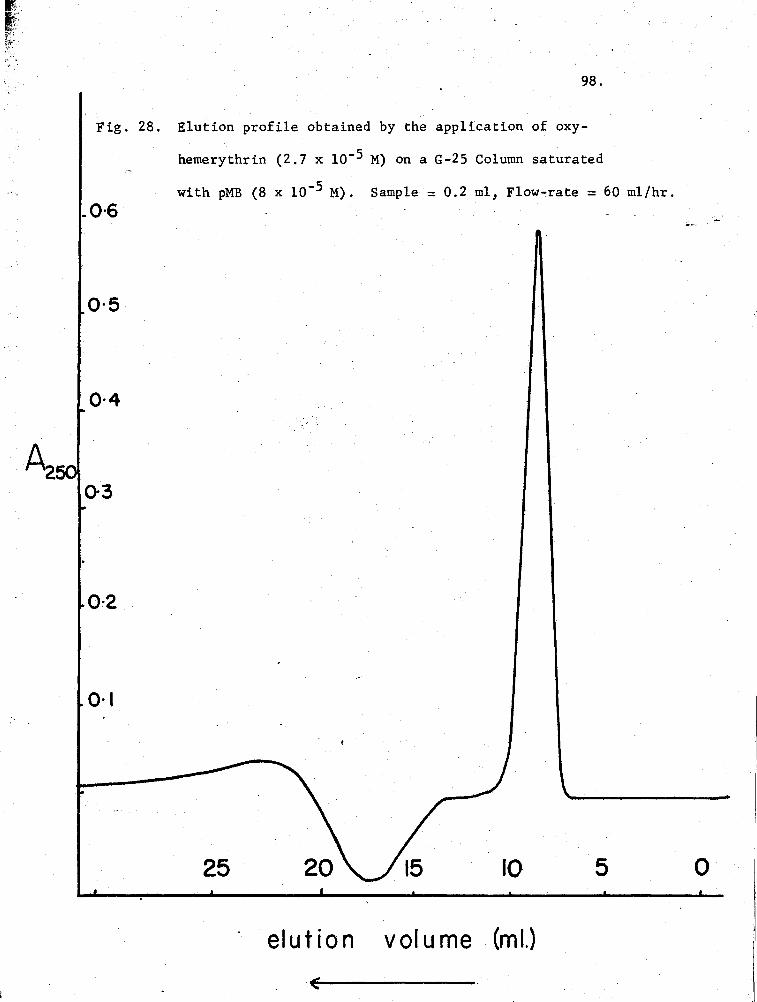
I> ;
' ,
rz'!"
,, . ;,. ..
98.
Fig. 28. Elution profile obtained by the application of oxy
hemerythrin (2.7 x lo-5 M) on a G-25 Column saturated
with pMB (8 x 10⁻⁵ M). Sample= 0.2 ml, Flow-rate= 60 ml/hr . . 0·6
0·5
0·4
0·3
0·2
O· I
25 5
elution volume (ml.)
0
. 0·2
_ O·l
_Q·O
35 30 25
elution
20 15
volume
/
10
(ml.)
99 .
Fig.29. Elution profile obtained by the application of 0.2 ml -5
5
of 0.1 M NaCl on the G-25 column saturated with 8 x 10 M p~B
solution. Flow-rate=60 ml/hr. 0.01 M Tris-cacodylate buffer
was used.
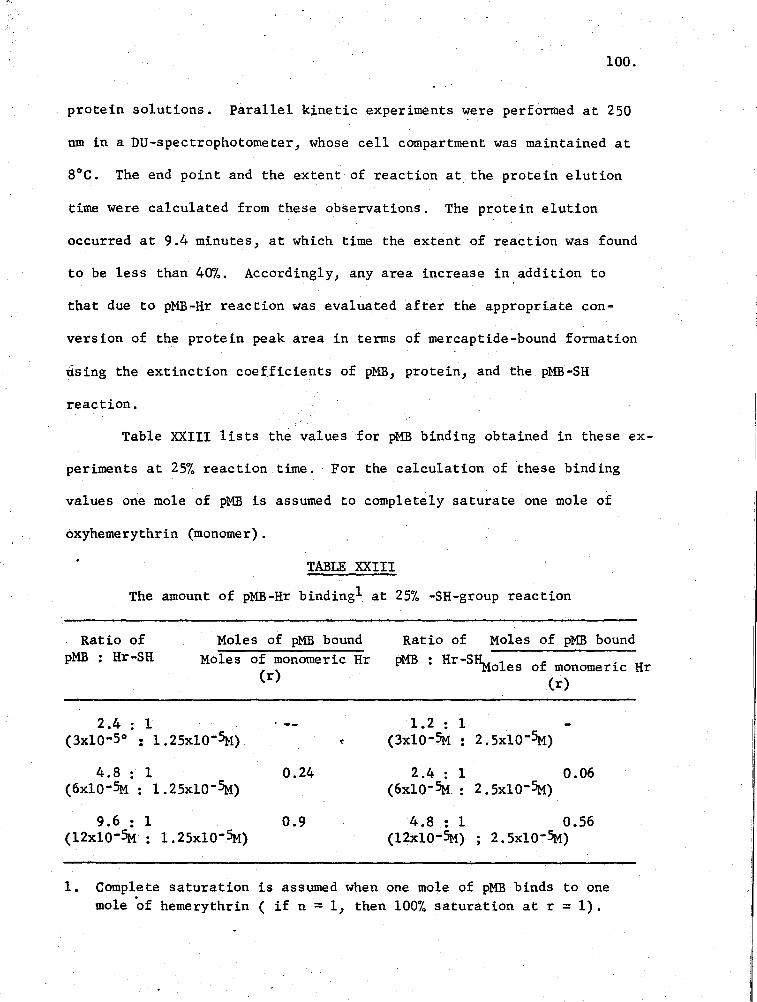
100.
protein solutions. Parallel kinetic experiments were performed at 250
nm in a DU-spectrophotometer, whose cell compartment was maintained at
8°C. The end point and the extent of reaction at the protein elution
time were calculated from these observations. The protein elution
occurred at 9.4 minutes, at which time the extent of reaction was found
to be less than 40%. Accordingly, any area increase in addition to
that due to pMB-Hr reaction was evaluated after the appropriate con-
version of the protein peak area in terms of mercaptide-bound formation
rising the extinction coefficients of pMB, protein, and the pMB-SH
reaction.
Table XXIII lists the values for pMB binding obtained in these ex-
periments at 25'7o reaction time. For the calculation of these binding
values one mole of pMB is assumed to completely saturate one mole of
oxyhemerythrin (monomer).
TABLE XXIII
The amount of pMB-Hr bindingl at 25% -SH-group reaction
Ratio of pMB : Hr-SH
2.4 : 1
Moles of pMB bound Moles of monomeric Hr
(r)
. --(3xlo-5° : 1.25x10-~)
4.8 : 1 0.24 (6xlo-5M : l.25x10-~)
9.6 : 1 0.9 (12x10-~ : l.25x10-5M)
Ratio of Moles of pMB bound
pMB : Hr-S~oles of monomeric Hr (r)
1.2 : 1 (3xlo-5M 2.5x10-~)
2.4 : 1 0.06 (6x10⁻⁵M 2.5x10-~)
4.8 : 1 (12xl0-5M)
0.56 2.sx10-5M)
1. Complete saturation is assumed when one mole of pMB binds to one mole of hemerythrin (if n = 1, then 100% saturation at r = 1).
101.
It is clear from these results that binding of pMB to hemerythrin
also can be observed as an increase in the area of the protein peak. In
zonal type of experiments, the total increase in area represents both
binding and reaction. Hence it was difficult to recognize the.progress
in reaction resulting from pMB binding to oxy-Hr. Therefore, frontal
chromatographic experiments were performed in an attempt to find out if
the bound fraction of pMB can lead to any further reaction of the hemery
thrin -SH groups. For this purpose, P!ecooled pMB and hemerythrin
solutions are pumped into a mixing chamber, as explained in 'Experimental
Methods'. Constant mixing was allowed with the help of a small spinbar
and the reaction was initiated by pumping both pMB and the hemerythrin
chloride at the same instant. The eluting buffer contained 0.1 M NaCl
so as to obtain a resolution between the protein and the mercurial
elutions. Just before the elution of the pMB, the flow was stopped but
the monitoring of the solution in the flow-cell was continued. This
continuation permitted the measurement of the reaction in the absence
of any free pMB; hence, any further increase in the absorbance at 250 nm
will be directly proportional to the mercaptide-bound formation, the
bound mercurial being utilized in the process. The temperature of the
cell compartment was allowed to ri~e to 25°C. The amount of reacti~n by
the bound pMB was evaluated from the final absorbance value. Represen
tative elution profiles are shown in Fig. 30. The increase in the
absorbance after the stoppage of flow as illustrated in this Fig.
indicates that additional reaction has occurred. Since free pMB could
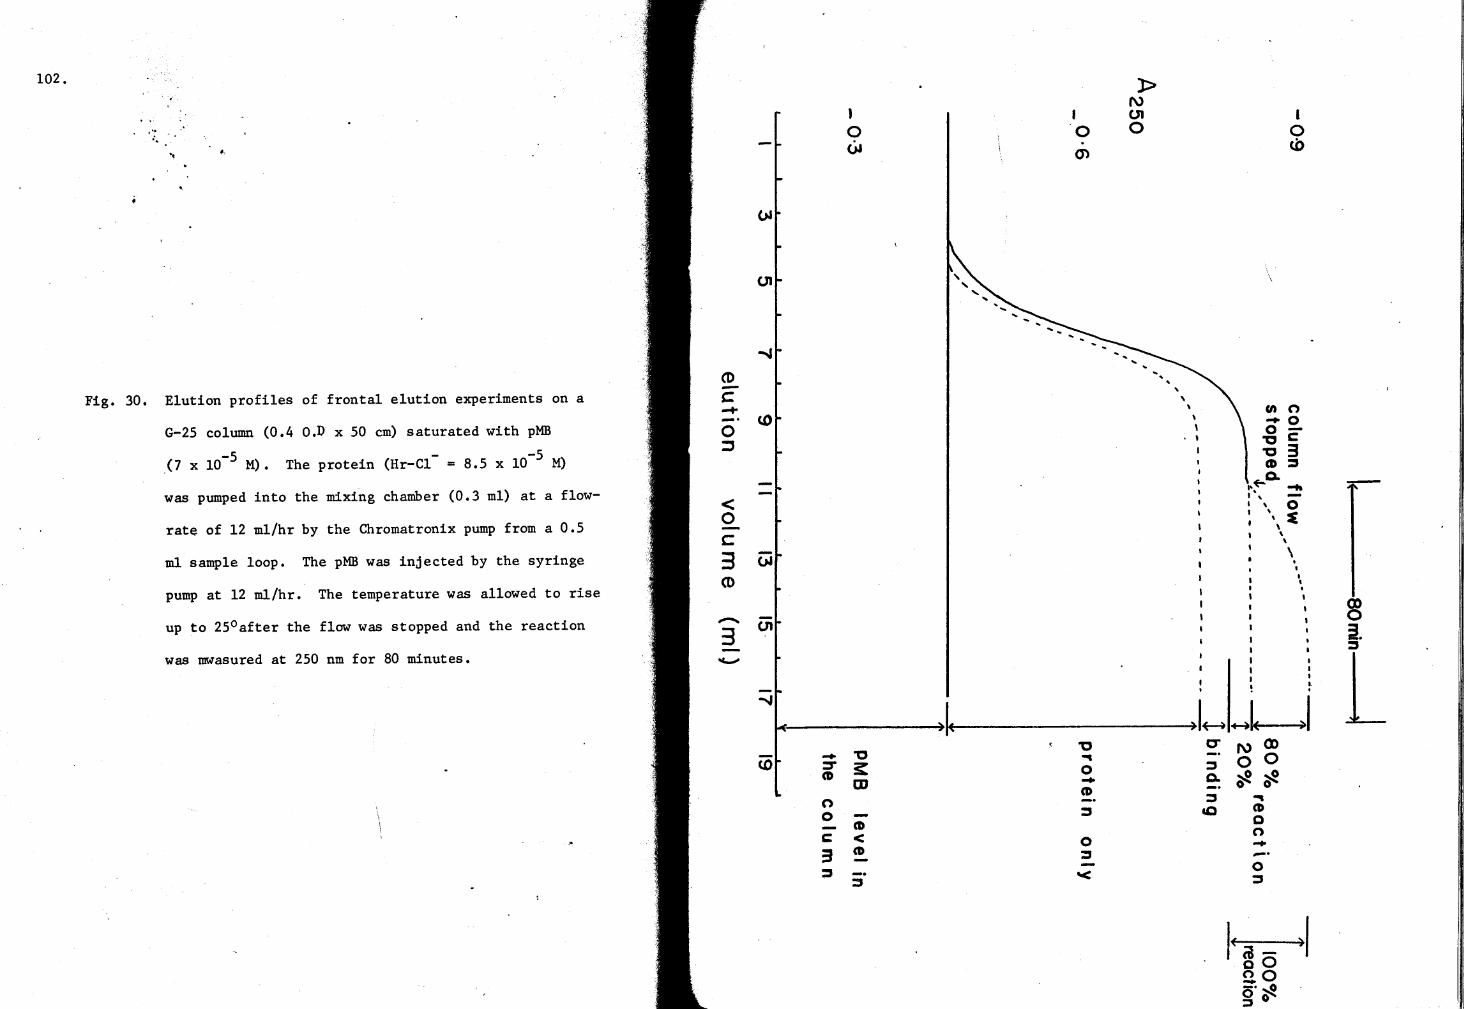
102.
.·• " .. .. .,
Fig. 30. Elution profiles of frontal elution experiments on a
G-25 column (0.4 o.D x 50 cm) saturated with pMB
(7 x 10⁻⁵ M). The protein (Hr-Cl- = 8.5 x 10⁻⁵ M)
was pumped into the mixing chamber (0.3 ml) at a flow-
rate of 12 ml/hr by the Chromatronix pump from a 0.5
ml sample loop. The pMB was injected by the syringe
pump at 12 ml/hr. The temperature was allowed to rise
up to 25°after the flow was stopped and the reaction
was mwasured at 250 nm for 80 minutes.
CD c ....
< 0 c 3 (t)
........ 3
c.o
(.11
c.o
1 I 0 0 (>I m
I( 'tJ .... 0 -CD
- 'tJ ~ 3:: CD m
::;:, n 0
CD 0 :J
c < 3 CD
:J :J '<
)> N OI 0
' ' \ \
\
)I~ C"
~ Q.
::;:, &Q
l 0 w
\
"' n -o o"g c "g 3 CD ~ Q.
•·t° .... I' -I \ 0 I \ ~ I \
' ' \ .
I I
' • ' I
I
I . . ~hi I\) Q)
0 0 ~ 0 ~ 0 ....
CD 0 n --· 0 ::;:,
f < (11 -oO
)I uo -· 0 o~ :l
103.
not be present in the flow-cell with the protein the further reaction
must be due to bound fraction of the mercurial.
(2) Comparison of the rate of dissociation and the rate of reaction
on Sephadex G-75 column.
In the binding experiments explained so far, the dissociation
state of the protein was not known and hence it was difficult to
attribute the pMB binding completely to the octameric species. However,
if correlation could be made between the extent of reaction and percent
dissociation, it will be possible to find out which form is the reactive
species of hemerythrin. This is also important in deciding about the
correct model as previously mentioned. For the purpose, a 6-hour
reaction-time sample was applied to a Sephadex G-75 column and monitored
according to the procedure explained in Chapter II. The column length
was selected such that the octamers were resolved from monomers. The
elution profile obtained in such an experiment is shown in Fig. 3la.
The percent reaction was calculated from the decrease in the elution
peak (250 nm) area of a blank-pMB solution. Similarly, the percent
dissociation was obtained from the octameric and monomeric peak areas.
(See Appendix VII for these calculations). The results indicated that (
while the extent of reaction is 83%, only 60% dissociation was observed.
Such an observation suggests that the octamers are reactive species.
Further proof was obtained from detailed comparative studies on the rate
of reaction and dissociation.
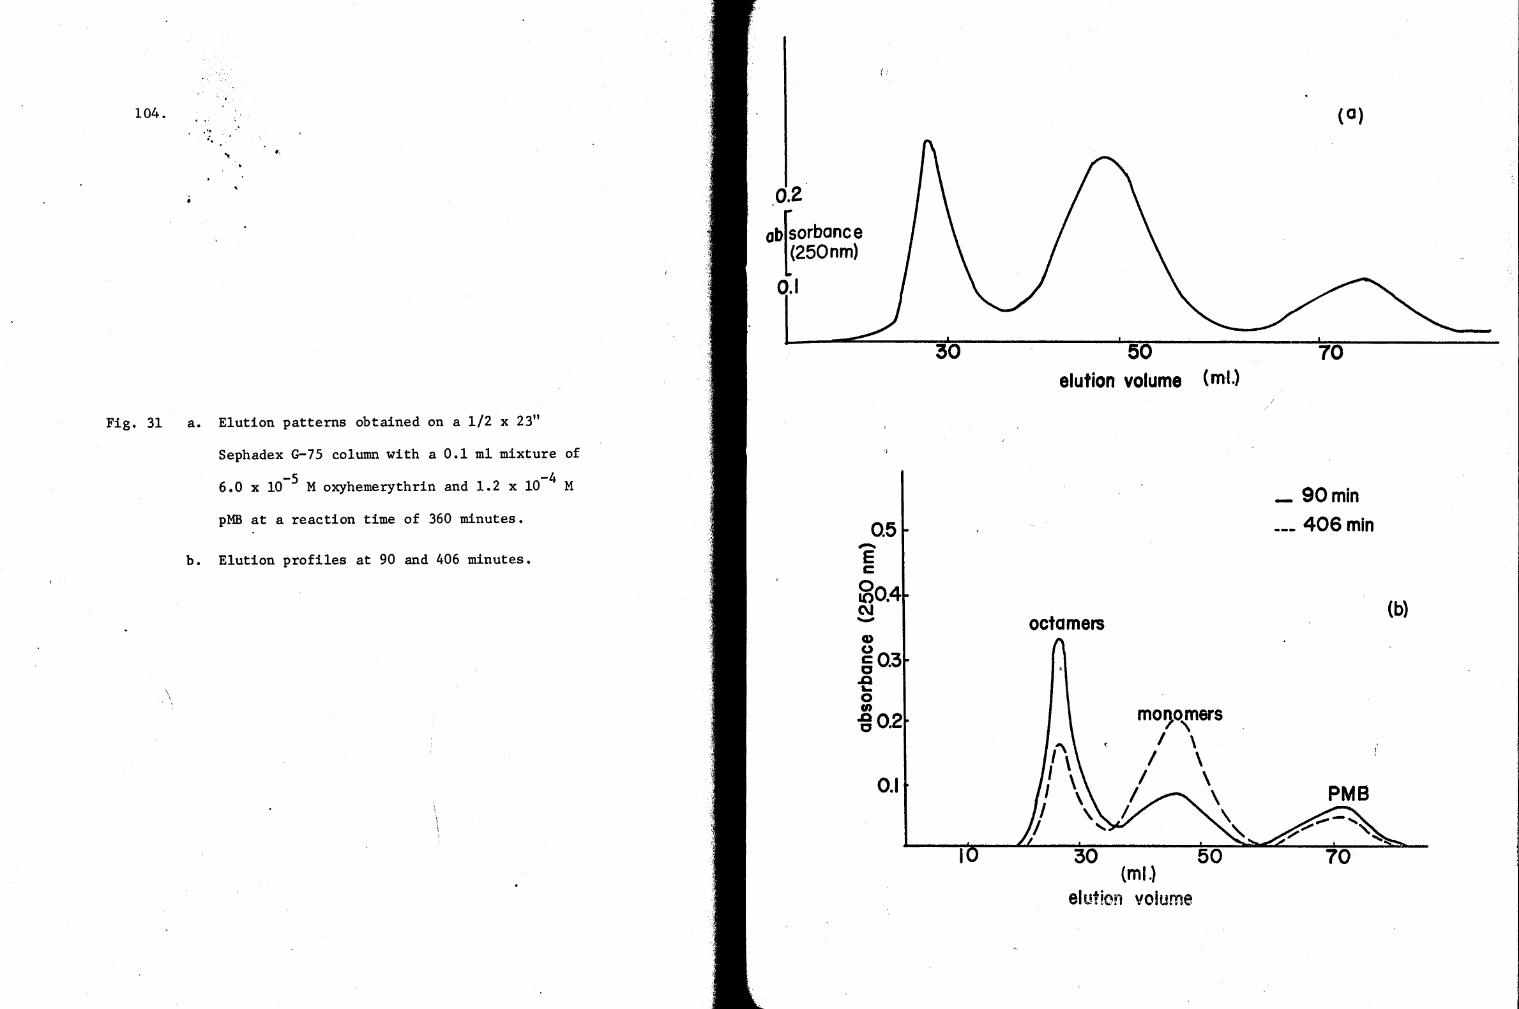
104. . .. :.
.. •,
Fig. 31 a. Elution patterns obtained on a 1/2 x 23"
Sephadex G-75 column with a 0.1 ml mixture of
5 -4 6.0 x 10- M oxyhemerythrin and 1.2 x 10 M
pMB at a reaction time of 360 minutes.
b. Elution profiles at 90 and 406 minutes.
\ \
(:
.0.2
abf sorbonc e l(250nm)
0.1
0.5 -E c
0 1()0.4 C\J -Q) u §0.3
.Q ... 0 (I)
.go.2
0.1
30 50 elution volume (mt)
octamers
f' I \ I \ I ',
I ' 30
(ml.)
elution voiume
50
(0)
70
_ 90min ___ 406 min
PMB
70
(b)
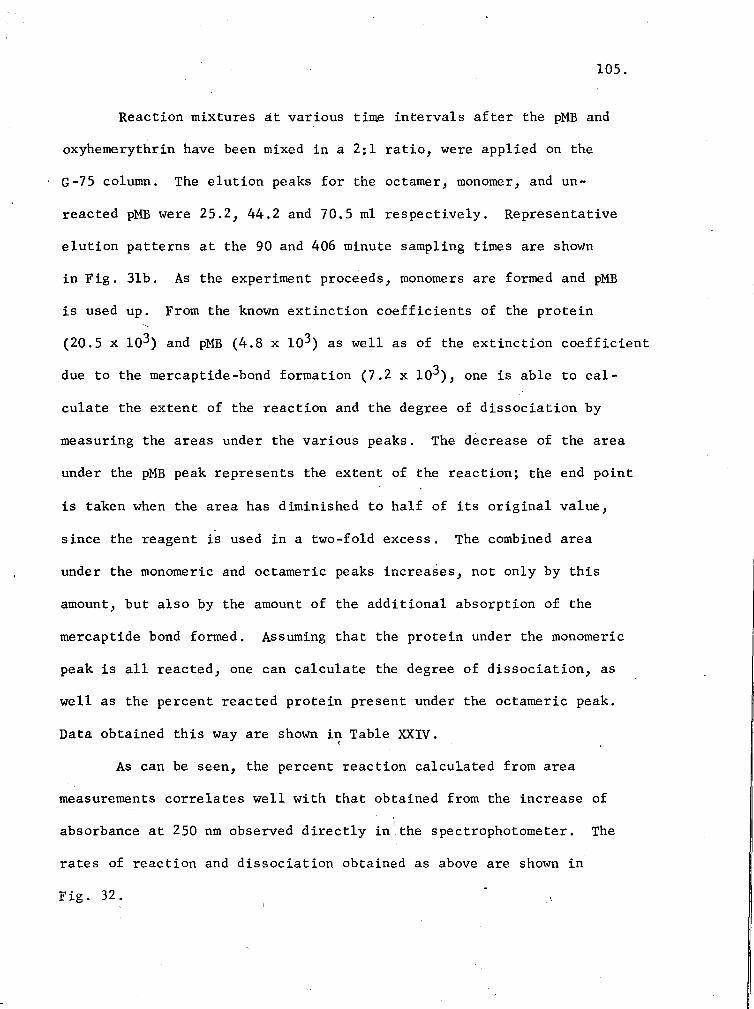
105.
Reaction mixtures at various time intervals after the pMB and
oxyhemerythrin have been mixed in a 2:1 ratio, were applied on the
G-75 column. The elution peaks for the octamer, monomer, and un-
reacted pMB were 25.2, 44.2 and 70.5 ml respectively. Representative
elution patterns at the 90 and 406 minute sampling times are shown
in Fig. 3lb. As the experiment proceeds, monomers are formed and pMB
is used up. From the known extinction coefficients of the protein
(20.5 x 10³) and pMB (4.8 x 10³) as well as of the extinction coefficient
due to the mercaptide-bond formation (7.2 x 10³), one is able to cal-
culate the extent of the reaction and the degree of dissociation by
measuring the areas under the various peaks. The decrease of the area
under the pMB peak represents the extent of the reaction; the end point
is taken when the area has diminished to half of its original value,
since the reagent is used in a two-fold excess. The combined area
under the monomeric and octameric peaks increases, not only by this
amount, but also by the amount of the additional absorption of the
mercaptide bond formed. Assuming that the protein under the monomeric
peak is all reacted, one can calculate the degree of dissociation, as
well as the percent reacted protein present under the octameric peak.
Data obtained this way are shown in Table XXIV. <
As can be seen, the percent reaction calculated from area
measurements correlates well with that obtained from the increase of
' absorbance at 250 nm observed directly in the spectrophotometer. The
rates of reaction and dissociation obtained as above are shown in
Fig. 32.
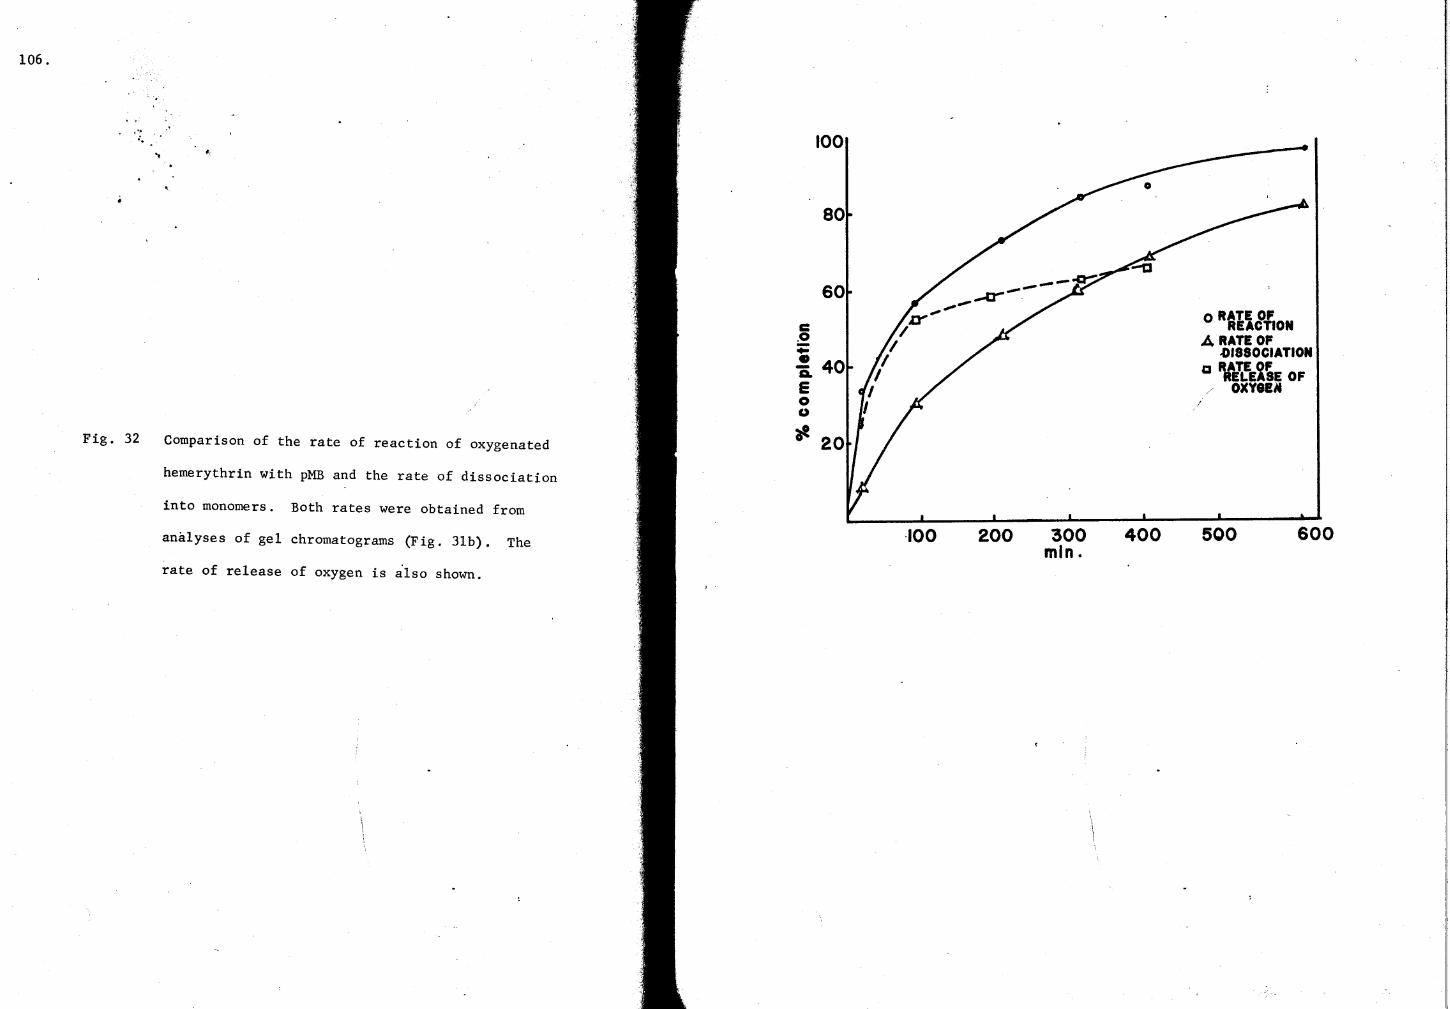
106.
'
... " '• .. ..
c .0 -.. • Q. E 0 0
Fig. 32 Comparison of the rate of reaction of oxygenated
"" hemerythrin with pMB and the rate of dissociation
into monomers. Both rates were obtained from
analyses of gel chromatograms (Fig. 3lb). The
rate of release of oxygen is also shown.
100
60
40
20
·100 200 300 min.
400
o RATE OF REACTION
A RATE OF .OISSOCIATION
a R/ETCEi~E OF OXY8Elt
I
500 600
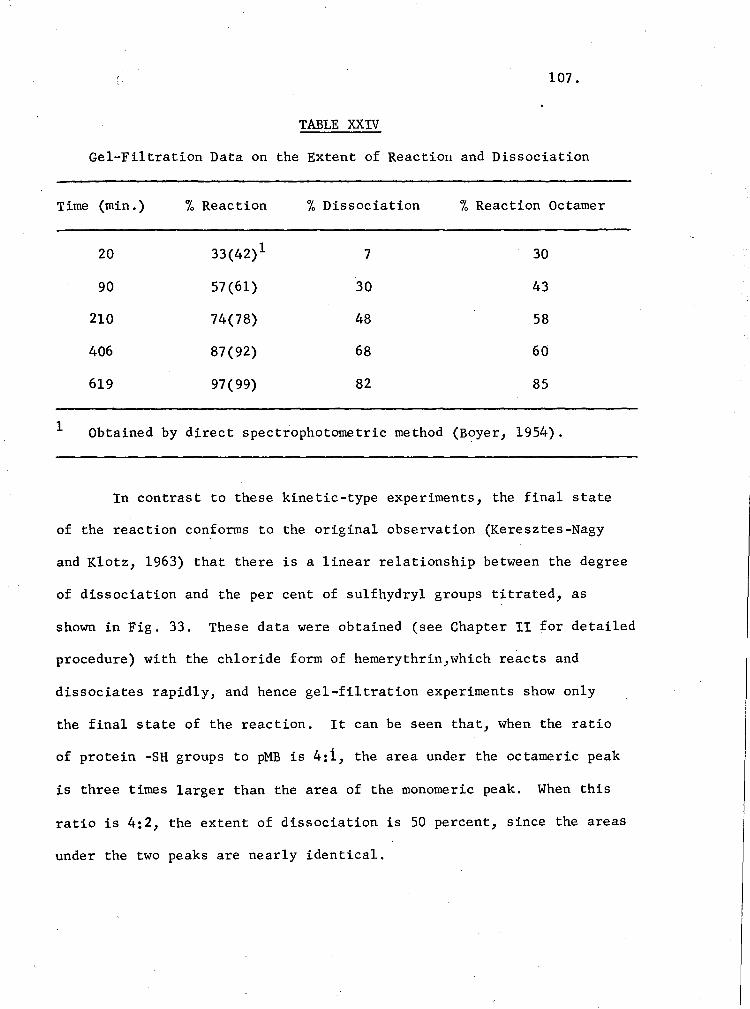
107.
TABLE XXIV
Gel-Filtration Data on the Extent of Reactiou and Dissociation
Time (min.) % Reaction % Dissociation % Reaction Octamer
20 33(42) 1 7 30
90 57(61) 30 43
210 74(78) 48 58
406 87(92) 68 60
619 97( 99) 82 85
1 Obtained by direct spectrophotometric method (Boyer, 1954).
In contrast to these kinetic-type experiments, the final state
of the reaction conforms to the original observation (Keresztes-Nagy
and Klotz, 1963) that there is a linear relationship between the degree
of dissociation and the per cent of sulfhydryl groups titrated, as
shown in Fig. 33. These data were obtained (see Chapter II for detailed
procedure) with the chloride form of hemerythrin,which reacts and
dissociates rapidly, and hence gel-filtration experiments show only
the final state of the reaction. It can be seen that, when the ratio
of protein -SH groups to pMB is 4:1, the area under the octameric peak
is three times larger than the area of the monomeric peak. When this
ratio is 4:2, the extent of dissociation is SO percent, since the areas
under the two peaks are nearly identical.
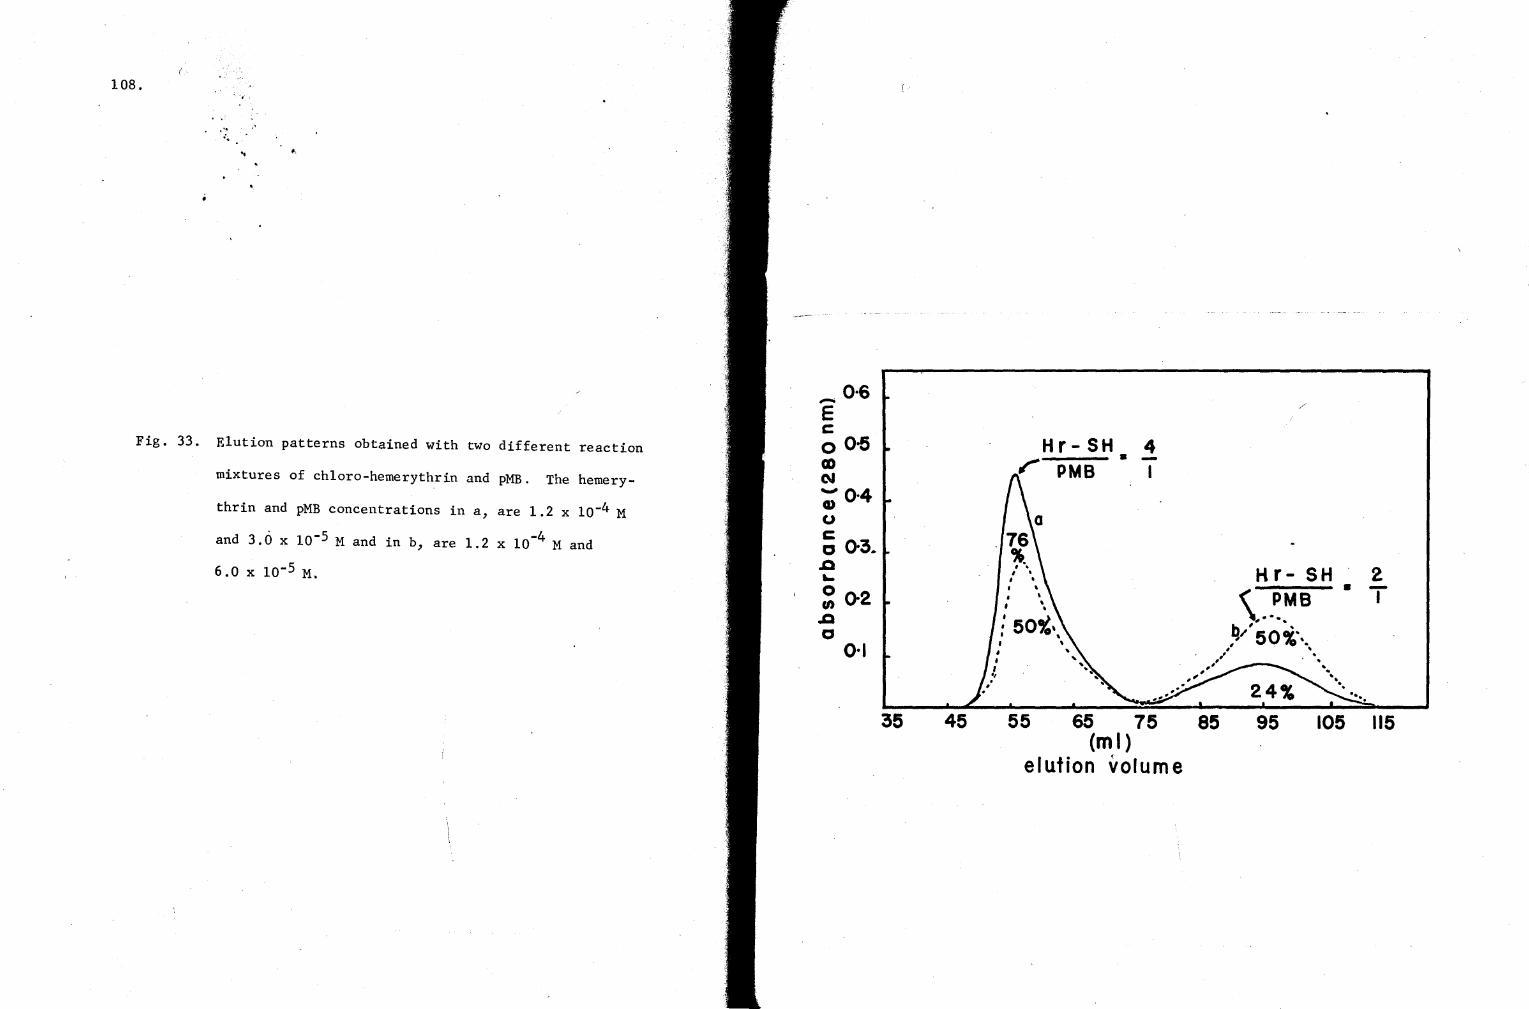
108.
Fig. 33.
. .. :.
.. . .
Elution patterns obtained with two different reaction
mixtures of chloro-hemerythrin and pMB. The hemery
thrin and pMB concentrations in a, are 1.2 x 10⁻⁴ M
and 3.0 x 10-S Mand in b, are 1.2 x 10⁻⁴ Mand
6.0 x 10⁻⁵ M.
-0·6 E c 0 0·5 a>
"' -0.4 Cl> u c c 0-3 .
.Q ... ~ 0-2 .a c
O·I
35 45
Hr- SH 4 _,.,- PMB •
/
Hr- SH
\ .. ~MB ~,.,so~; ..
-- . '
2 . -I .. . , .
•' , ,,
55 65 75 85 95 105 115 (m I)
elution volume
109.
The observed rate of reaction was also compared with the rate of
release of oxygen from oxyhemerythrin. The monitoring was carried out
at 500 nm as explained in Chapter II, and the theoretical 100% oxygen
loss was evaluated from the extinction coefficient of aquo complex
being formed through oxygen release. The % release was then computed
from this expected absorbance of aquo form, and the absorbance of the
initial oxyhemerythrin. The rate of release of oxygen found in such
a manner is also plotted in Fig. 32.
/
110.
CHAPTER IV
DISCUSSION
The present investigation has been undertaken with the basic
aim of studying protein interactions with gel chromatography. There-
fore, we have used this technique wherever possible, in exploring the
molecular properties of the model protein, hemerythrin, as outlined in
the preceding chapter. Before the interpretation of the observed data
on hemerythrin, the advantages and disadvantages of the employed
analytical method will be considered.
In view of the extensive reviews available on frontal-gel chrom-
atography (Ackers and Steere, 1967; Winzer, 1969; Ackers, 1970), we
will discuss here only some of its salient features. The first, and
major, advantage of frontal elution procedure for the hemerythrin
dissociation experiments, is that the elution volume is obtained as a
steady-state parameter (Gilbert, 1966). In the leading boundary of a
frontal-elution experiment the concentration of the protein rises
from zero to a maximum, C0 • Addition of a further volume of protein
(concentration, Co) at the plateau region results in the elution of <
protein whose concentration is identical to that applied on the column.
Therefore, the column is in a steady-state condition. Hence, the
amount of protein on the column ( V x C0 ) is a steady-state parameter.
Winzer (1969) used 'steady-state' data to derive equilibrium constants
by rationalizing similar derivations of Archibald (1947) for the
ultracentrifuge.
111.
The other advantages of the employed chromatographic technique
pertain to the sample application and direct monitoring of the protein
species. Large samples could be applied by the Chromatronix injection
valve without changes in flow-rate. Thus any possible stress (pressure)
effects on the Sephadex gel particles (which are known to exhibit
anomalous resolution characteristics at high hydrostatic pressures;
Determann, 1969) were eliminated. Direct monitoring of the effluent
through the flow-cell could be carried out even at microgram levels of
protein, by using 10-20 fold scale expansion on the linear-log recorder.
However, because of the high electrical_noise to signal ratios at large
scale expansions, only 2-5 expansion of the 0.0 - 1.0 absorbance scale
is reconnnended.
On the other hand, gel-chromatographic procedure could also be
used in conjunction with other detection methods, such as enzymatic
assay or radioactive-labelling procedures. We have already employed
the latter method in some of our studies (anion-hemerythrin interactions)
by using radioactive chlorine-36. The enzymatic-assay procedure was
recently shown to be useful at les& than microgram concentrations of
protein (Keresztes-Nagy and Orman, 1971). Studies· at such low levels
of protein are almost impossible with light scattering and ultracentri
fugation. Keeping in mind these general connnents about gel chromato
graphy, experimental data obtained on hemerythrin interactions will now
be discussed.
112.
A. Hemerythrin Subunit - Subunit Interactions (Association-Dissociation
Equilibrium.)
Preliminary experiments on the G-100 column (Tables III and IV)
illustrate the usefulness of frontal-chromatographic technique to the
study of dissociation equilibrium in hemerythrin. These studies also
indicate the existence of a dissociation equilibrium, since the ascending
elution boundary was found to shift with protein concentration. Such
behavior has been previously ascribed to a reversible equilibrium by
Ackers and Thompson (1965). The reversibility of hemerythrin-dissocia
tion equilibrium has already been established with ion-exchange and ge1-
filtration procedures (Rao and Keresztes-Nagy, 1968).
For a comparison of the dissociation studies of hemerythrin by
frontal-gel chromatography with sedimentation-velocity experiments
(Klapper et.al., 1966), one must analyze the trailing boundaries of the
elution profiles. The boundaries obtained with the Sephadex G-100
column were too diffuse, and the minimum position in the derivative
curve could not be easily distinguished. Therefore, the major part
of the comparison was carried out with results obtained on a Sephadex
G-75 column.
Tables V and VI, list the calculated values" of 'K' from results
obtained on this column with oxy-hemerythrin and hemerythrin-azide
complexes. A careful inspection of the results presented in these
Tables reveals that, in addition to a variation, there appears to be a \
113.
trend in the values of dissociation constant for the equilibrium in
hemerythrin. At low protein concentrations the value of 'K' was found
to be comparatively smaller than the values at higher concentrations.
We, at the present time, attribute this trend to the difficulty in
obtaining the absolute values of elution volume (sieve coefficient).
Langerman and Klotz (1969) showed that a 2 percent experimental error
in the calculation of monomeric hemerythrin concentration would cause
a 100 percent variation in the value of dissociation constant.
Similarly, we considered a 15 percent error in the measurement of
protein concentration, and the value of the dissociation constant was
calculated to be fifteen-fold higher than the value of 'K' without the
error (Appendix VI). Errors in the measurement of low protein concen-
tration could sometimes amount to 15-20 percent; accordingly, the values
of dissociation constant would reflect the corresponding variation in
'K'. In addition, this constant is dependent to the 8th power on the
concentration of monomeric species. Therefore, the observed variation
in 'K' does not seem to be excessive in view of such considerations.
T~e exclusion properties of G-75 required the use of a range of
hemerythrin concentrations low enough to yield weight-average molecular t
weights of less than 60,000. In general, the range of hemerythrin
concentrations employed in these experiments was lower than that used
in other studies (Klapper et.al., 1966; Klapper and Klotz, 1968b,
Langerman and Klotz, 1969). Lower values of 'K' were obtained, most
probably, because of the range of hemerythrin concentration used in
our studies. These values, together with the values derived from
114.
sedimentation-velocity, sedimentation-equilibrium, and ion-binding
studies are presented in Table XXV. As shown in this Table, the value
of the dissociation constant obtained in the present study, seems to
be in general agreement with the values obtained by other methods.
Recently, lactate dehydrogenase has been shown to have an octamer
-32 monomer system with a dissociation constant in the range of 10
(Millar et.al., 1969). This value may be considered to be in agreement
with the hemerythrin-dissociation constant. In addition, a recent
compilation of equilibrium constants of subunit association of various
proteins (Klotz et.al., 1970), indicates that gel-chromatographic
method can provide results comparable to those obtained by the ultra-
centrifugation technique.
A comparison of the results presented in Tables VI and VII also
shows that the values of 'K' vary depending on whether they are ob-
tained from analysis of the elution profile's trailing or leading
boundary. This disparity is primarily due to difficulty in judging
the correct position of the minimum (V i ) in the derivative curves. mn
As can be seen from Eq. 2, small errors in the measurement of Vmin
(and therefore of Cmin) can lead to large errors in the value of 'K'.
Cox (1971) has reported similar difficulties in detecting the exact
position of the gradient minimum in computer simulations of ultra-
centrifugation studies. In spite of such possible errors, the derived
values of 'K' from the leading and trailing boundaries are in reasonably
good agreement (Tables VI and VII).
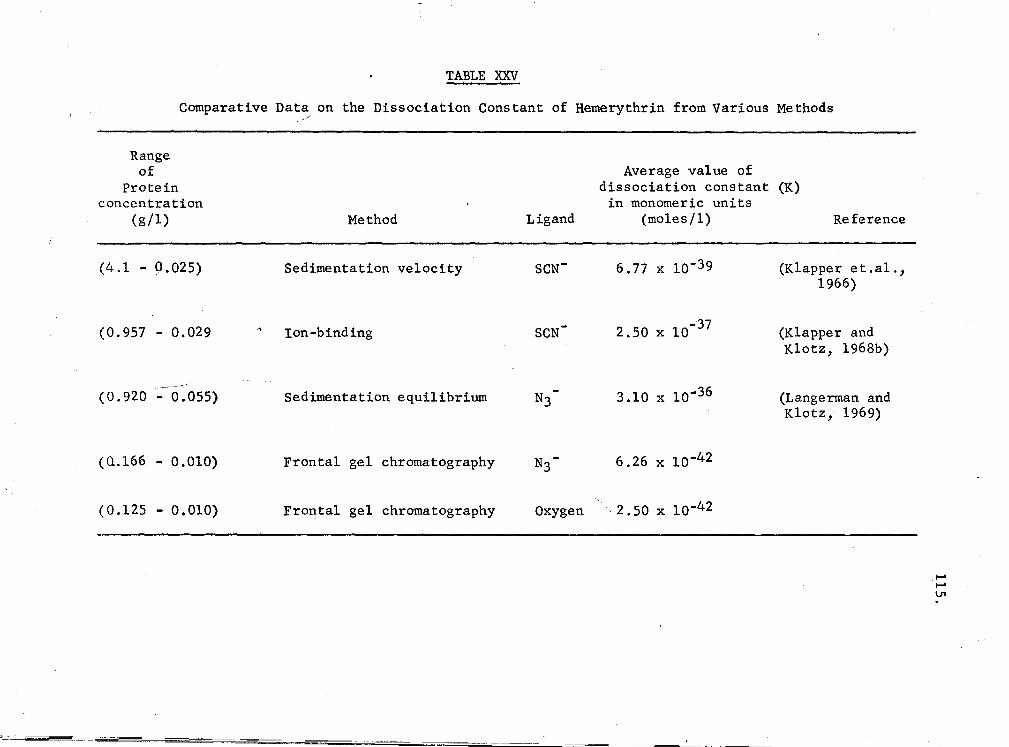
TABLE XXV
Comparative Dat~ on the Dissociation Constant of Hemerythrin from Various Methods
Range of
Protein concentration
(g/l)
(4.1 - 9.025)
(0.957 - 0.029
(0.920 - 0.055)
(Cl.166 - 0.010)
(0.125 - 0.010)
Method
Sedimentation velocity
Ion-binding
Sedimentation equilibrium
Frontal gel chromatography
Frontal gel chromatography
Ligand
SCN-
SCN-
N3
N3-
Average value of dissociation constant (K)
in monomeric units (moles/l) Reference
6. 77 x lo-39
2.50 x 10-37
3.10 x lo-36
6.26 x lo-42
(Klapper et.al., 1966)
(Klapper and Klotz, 1968b)
(Langerman and Klotz, 1969)
Oxygen , 2.50 x lo-42
,.... ,.... V1
116.
The general agreement between our values of 'K' and those ob-
tained with other methods becomes more obvious if one considers the
thermodyamic parameter, free energy change ( t:J:;0
), for the dissociation
equilibrium. /£, 0 is obtained from the relation L'G~-RTlnK and was found
to be positive and small (6.70 Kcal/mole of monomer). Langerman and
Klotz reported a standard free-energy change of 6 Kcal/mole for the
formation of one mole of monomer from octamer. Therefore, we can con-
elude that the observed variation in the value of 'K' is not a real
variation, and hence gel-chromatographic procedure appears to have an
accuracy equal to that of the other methods.
However, our earlier temperature-effect studies (Rao, 1969)
indicated that the gel-chromatographic method to be a more sensitive
technique than ultracentrifugation. We observed a small enthalpy
change of+ 1.3 Kcal/mole of monomer for the octamer dissociation.
Langerman and Klotz (1969) could not observe any changes in the
dissociation of hemerythrin with temperature and hence reported no
enthalpy changes for the process. Only recently, by the use of micro-
calorimetric procedure, Langerman and Sturtevant (1971) were able to
measure the enthalpy changes for the hemerythrin equilibrium. They
reported a value of 1 ± 0.5 Kcal/moie of monomer, which agrees
remarkably well with our findings.
The value of the dissociation constant is not the only informa-
tion which can be obtained from analysis of the trailing edges of the
elution patterns. One can also estimate the stoichiometry of dis-
sociation (n) and analyze the boundaries in terms of Gilbert's theory
'I II
117 ..
(1955). As can be seen from Table VII, the values of 1n 1 obtained
varied between 5 and 12. This variation was also due to difficulties
inherent in the estimation of the position of Vmin· However, the average
of all values of 'n' in Table VII is 8.0 + 1.0 which justifies our
earlier assumption of 'n' equal to 8. These results provide the first
direct experimental evidence that the dissociation of hemerythrin is an
all-or-none process and does not involve significant stable concentrations
of any intermediates. Similar previous evidence was derived from sedi-
mentation-equilibrium studies (Langerman and Klotz, 1969) and was based
on the fit of experimental data to theoretical equations for an octamer-
monomer equilibrium.
In studies on interacting-protein systems at equilibrium, the
behavior of the elution profiles obtained in frontal-gel chromato-
graphy will be dependent on both the equilibrium position and on the
rate of re-equilibration relative to the rate of separation of the inter-
acting protein species. The presence of a dissociation equilibrium in
native hemerythrin has already been established (Keresztes-Nagy and
Klotz, 1965, Klapper et.al., 1966). In contrast to these studies, gel-
chromatography method has been shown not to affect the reversibility
of the equilibrium (Rao and Keresztes-Nagy, 1971). Therefore, both the
rate of equilibration and the equilibrium position were observed with
gel chromatography. The dissociation equilibrium of hemerythrin may be
k represented as (Hr) 8 _.Kr48 Hr, where kf and kr are the forward and
reverse rate constants. In a slow rate of re-equiU,bration (kf and kr
118.
are small) after the shift caused by dilution is complete, both the
ocatmeric and monomeric components would emerge at th~ir respective
elution positions and the proportion of the respective components would
depend on the time required for elution.
However, if kf and kr are very large, equilibrium is achieved
rapidly in comparison to the elution time. This results in only a
partial or no resolution between the equilibrating components. The
advancing boundary of a frontal elution experiment in such a system
will be hyper-sharp and correspondingly the trailing boundary will be
diffuse compared with that of a non-dissociating protein elution profile.
In a general manner, the hyper-sharpening effect may be said to be
caused by the tendency for the larger molecular species to move faster
than the dissociated species. A continuous concentration distribution
has to be assumed in the advancing boundary as it begins to migrate
through the column. At each concentration level, the amounts of monomer
and polymer are readjusted; accordingly, at any particular moment, due
to diffusion, the region ahead of the mean position becomes lower in
concentration than the region behind it. Therefore, the species behind
the mean region migrate faster and the species ahead_ of it migrate slower. <
Thus in the newly acquired position, the polymeric species are in an
environment of lowered concentration which causes further dissociation.
Again, readjustment between the polymeric and monomeric species occurs
and the process is continually repeated, with the final effect of partial
opposition to diffusion spreading. This situation results in a boundary
119.
which is considerably sharper than that for an ideal solute with the
same elution volume. This effect operates in a reverse manner on the
trailing boundary. Here the effect of dispersion into a region of
lowered concentration seems to broaden the trailing edge by promoting
dissociation. Diffusion aids this process and thus non-enantiographic
(non-symmetrical) elution profiles are considered to be characteristic
of a rapidly equilibrating systems.
In a third possible situation, both kf and kr have values nearly
equal to the time for separation in chromatography experiments, whereby
the patterns become complicated.
Excellent theoretical discussions on gel-chromatographic data of
rapidly interacting systems are presently available in which equations
of free migration were adapted to frontal-elution parameters (Gilbert,
1966; Nichol et.al., 1967; Ackers and Thompson, 1965; Ackers, 1967b).
The equations which have been used in the calculation of dissociation r
data are listed in Appendix I. The qualitative aspects of boundary
shapes of associating systems have been experimentally shown by Winzer
and Scheraga (1963), by employing the first-derivative curves to
demonstrate small deviations from ideal enantiographic (symmetrical)
elution profiles. Bethune and Kegeies (1961) have also put forward a
theory for a rapidly polymerizing system involving aggregates greater
than dimers. For such a system, they predict that there should be in-
flection points (bimodality) in the trailing edge of the elution pattern.
120.
This has been experimentally confirmed by other workers (Winzor and
Scheraga, 1963; Ackers and Thompson, 1965). On the basis of both of
these theories, the behavior of the frontal-elution profiles of the
hemerythrin-dissociation experiments prove that the native equilibrium
is of a rapid nature in relation to the elution time. In the frontal
chromatography experiments of hemerythrin-azide on the G-75 column, a
single leading boundary was always observed, whereas two boundaries
would be expected for a slowly equilibrating system. In addition, the
trailing boundaries show only partial resolution, which agrees with the
Gilbert theory (1955, 1959) for rapidly equilibrating systems. Further
more, the fast and slow components of the trailing boundaries should not
be identified as octameric and monomeric components (as was done in the
sedimentation on velocity experiments of Klapper et.al., 1966). This is
evident since the elution rate of the fast peak is dependent on protein
concentration (see Figs. 11 and 15), as is also predicted by theory
(Gilbert, 1955, 1959).
It can be seen from figures 10 and 11 that a rapid equilibrium
is present in oxyhemerythrin also, which finding is in agreement with
the rate observed with hemerythrin-azide complex. Since, protein
protein interactions, in general, have been known to be relatively fast,
the hemerythrin dissociation equilibrium would be expected to be fast.
Our results, indeed, confirm such an expectation.
Although the gel-chromatographic data we have obtained is in
agreement with the results of other workers (Klapper and Klotz, 1968b,
121.
Langerman and Klotz, 1969) on the dissociation constant 'K' and the
stoichiometry of dissociation (n), there is a contradiction in regard
to the rate of hemerythrin association-dissociation equilibrium.
Earlier (Klapper et.al., 1966) it has been reported that the rate with
which equilibrium is achieved was relatively slow under almost identical
experimental conditions of temperature, pH, and ionic strength as those
employed in this present study. These investigators claimed that the
fast and slow components could be completely resolved; that the sedi-
mentation constant of the fast component was independent of the protein
concentration; and that the area under the slow sedimenting peak was
constant. From such observations, they concluded that the attainment
of equilibrium between the octameric and monomeric species is relatively
slow. Consequently, these two components are expected to be separable on
the basis of molecular weight in transport exp~riments.
In contrast, as indicated earlier, a rapid type of equilibrium was
found in our gel-chromatographic experiments in which the equilibrating
components could not be separated.
One can speculate about the discrepancy between the gel-filtration
and ultracentrifugation studies. It is possible that in the ultra-<
centrifuge the dissociation of hemerythrin could become irreversible
owing to either oxidation or denaturation of the monomeric species.
Unfortunately, the reversibility of dissociation under the conditions
of ultracentrifugation has not yet been experimentally demonstrated,
as was done with the gel-filtration method (Rao) 1969). Langerman and
122.
Klotz (1969) reported that the partial:specific volume of octamer
and monomer was essentially identical. Therefore, we hypothesize
a transition state in the dissociation of octamer to monomer as an
alternate explanation for the observed discrepancy. According to this
hypothesis, the nature of the change in the partial-specific volume
would be reflected in a decrease in the rate of equilibration at
pressures generated during high-speed ultracentrifugation (Josephs and
Harrington, 1966). Finally, the possibility cannot be ruled out that
partial resolution of octameric and monomeric hemerythrin in the ultra
centrifuge has been mistakenly identified as complete separation of the
t\\Ocomponents.
In some gel-chromatographic experiments elution-behavior char
acteristic of other types (intermediate and slow) of equilibrium have
also been observed. The elution profile of a 20 µg/ml oxyhemerythrin
(Fig. 18) was found to be different in both the advancing and trailing
boundaries. This behavior corresponds to an intermediate rate of
equilibrium. Recently, other investigators (Tan and Keresztes-Nagy,
1971) have shown such an intermediate equilibrium in oxyhemerythrin
solutions at low protein concentrations ( < 25 µg/ml) and low pH
conditions (between 5 and 6).
Furthermore, these workers (Tan and Keresztes-Nagy, 1971) could
also show, in preliminary experiments with oxyhemerythrin at higher
ionic strength (0.25 µ) and low temperature (10°) conditions, the
requirements of a slow rate of equilibrium (Fig. 34). Accordingly,
two distinct plateau regions were observed in the leading bou~dary,
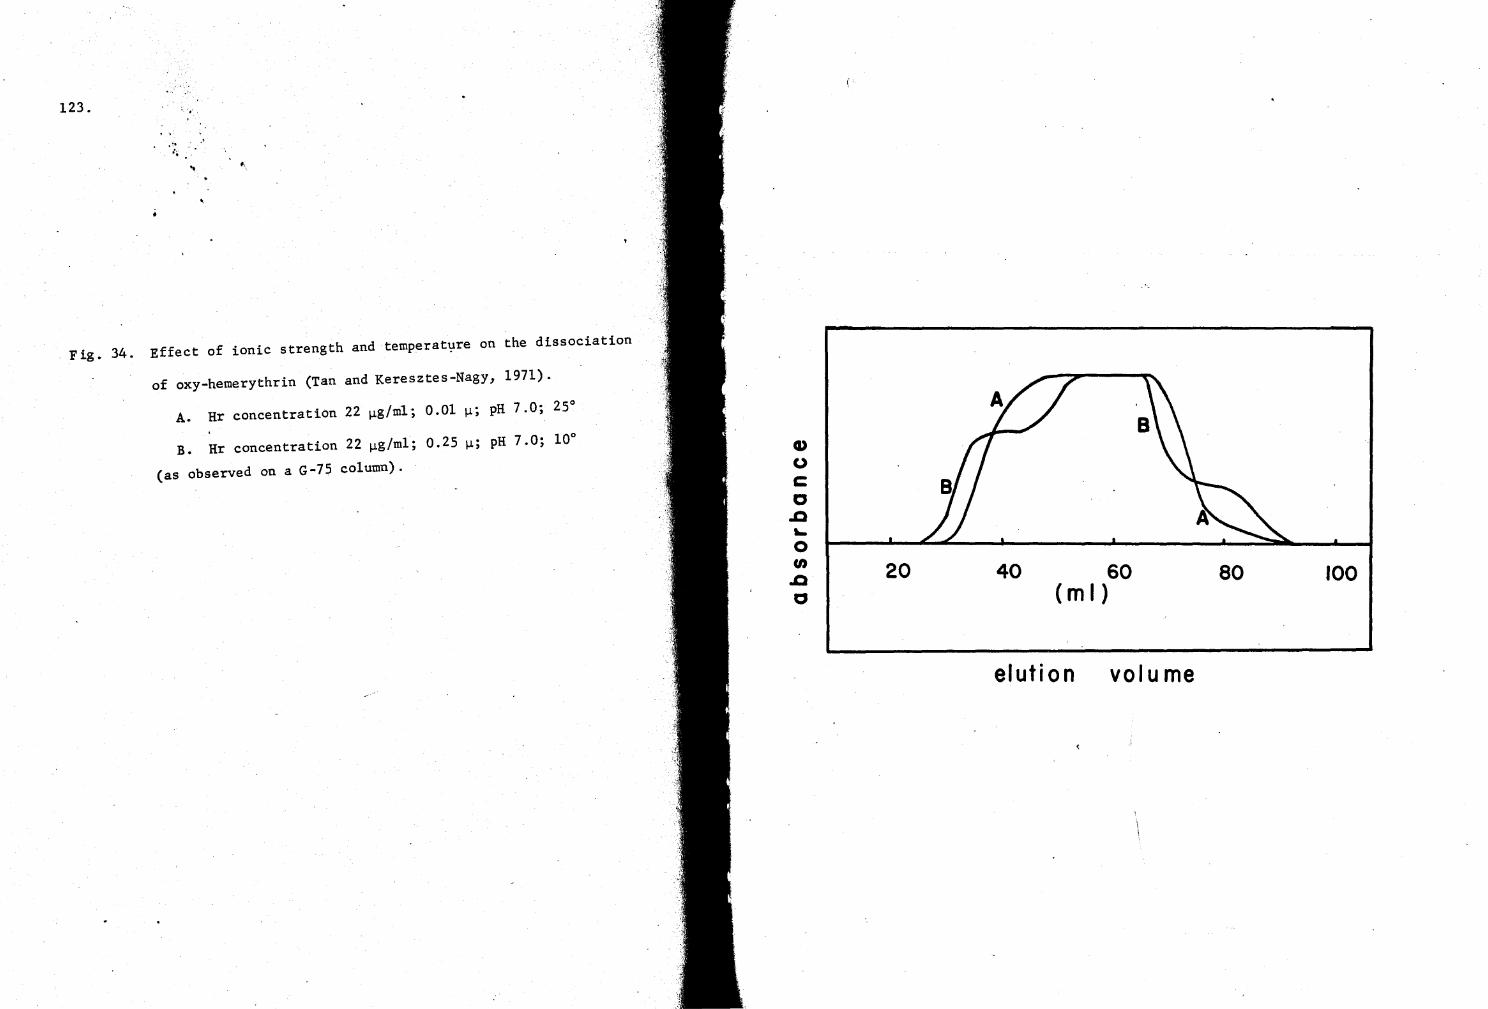
123. •''
... .. . .
Fig. 34. Effect of ionic strength and temperat~re on the dissociation
of oxy-hemerythrin (Tan and Keresztes-Nagy, 1971).
A. Hr concentration 22 µg/ml; 0.01 µ; pH 7.0; 25°
B. Hr concentration 22 µg/ml; 0.25 µ; pH 7.0; 10°
(as observed on a G-75 column).
CD CJ c c .0 .... 0
"' .0 c
20 40 60 { m I )
elution volume
80 100
124.
amd complete resolution of both trailing and leading boundaries
into two components could be achieved. The elution volumes of these
components corresponded to the octameric and monomeric species.
Such experiments indicate that gel-chromatography technique can
be used for studying the various types of equilibrium. From this
observation, we conclude that the contradiction with the ultracentri
fuge experimental finding is not due to an artifact of the frontal
elution-gel-chromatographic procedure.
The calculations of the time spent by the protein species on
each theoretical plate of both G-75 and G-100 columns enabled the
evaluation of hemerythrin equilibrium in terms of resolution time.
Accordingly, the equilibration between the oxy-hemerythrin subunits
and octamers is found to be faster than 4.3 seconds. Similarly, the
hemerythrin-thiocyanate and hemerythrin-azide equilibria (rapid rate)
are faster than 3.5 seconds (Table IX). The equilibration (inter
mediate) of oxyhemerythrin monomers and ocatmers at concentrations less
than 20 µg/ml is probably equal to the resolution time on each
theoretical plate of the column (3-4 seconds). Likewise, the equil
libration (slow rate) of the 25 µg/ml oxy-hemerythrin in 0.25 µ and
10° (Tan and Keresztes-Nagy, 1971) would have to be slower than 3-4
seconds. In view of such short intervals of time allowed on each
theoretical plate in a G-75 or G-100 column, it is difficult to recon
cile the slow nature of the equilibrium observed by Klapper and other
workers (1966), with the sedimentation-velocity procedure.
125.
As explained. in Chapter III, the sieve coefficients are best
correlated with the size parameter, molecular shape, and hence such a
relation was obtained in an empirical calibration of both G-75 and G-
100 columns with standard-marker protein molecules. Representative
plots are shown in Fig. 8 in which the linear relationship a = a0 + o0
erfc-1 (cr) was observed. At very low hemerythrin concentrations, the
equilibrium is shifted toward monomers, as shown by the higher values
of sieve coefficient. The radius of monomeric -hemerythrin was derived
by the above linear relationship between the molecular radius and the
sieve coefficient. The values so obtained are 15.A0 on G-75 and 16,2 A0
on G-100 columns. The close agreement between these values was un-
expected since exponents of ultracentrifugation and light-scattering
technique have suggested interactions between the column media and the
protein being studied. Certainly the inert nature of column media
(Sephadex) is indicated by our results on molecular radii of monomers.
If we can assume that the monomeric hemerythrin is a sphere
(Keresztes-Nagy and Klotz, 1965), an entirely plausible assumption for
protein subunits, the molecular weight of the hydrated subunit may be
47\Na3 evaluated by the equation Mmax = 3 v=--- From the partial-
specific volume, v (0. 735, Keresztes-Nagy, 1962), and N, Avogadro's
number, the value calculated for Mmax is 14,620. This value is, at
best, an upper limit since both molecular assymetry and the amount of
hydration have to be considered.
126.
The apparent molecular radius of the hemerythrin octamer mole-
cule was also evaluated from the calibration equation to be 42.6 A0 and
35.4 A0 on the G-75, and G-100 columns respectively. Due to the non-
linear resolution of Sephadex G-75 at high molecular weights (Andrews,
1964), it is most likely that the resolution will also be non-linear
at high molecular radii (beyond 36 A0 or 70,000 MW). Therefore, we
have used only the value obtained with the G-100 column in the calcul-
ation of octameric molecular weight. The octameric molecular weight of
113,000 derived from the G-100 column data is in agreement with the
earlier reported value of 107,000 (Keresztes-Nagy and Klotz, 1963).
For most proteins, the partial-specific volume lies in the range
of 0.71 - 0.75, but the assumption that the frictional ratio (a measure
of hydration, and m,olecular shape) is the same for hemerythrin and
marker protein is less justified. Bovine seru~ albumin is now known
not to be a spherical molecule, but rather an ellipsoid (Squire et.al.,
1968), and it is likely that other marker proteins also may not be
spherical molecules.
Both Ackers (1970) and Winzor (1969) suggest the complementary
use of data obtained from two different analytical methods. Accord-
• ingly, the diffusion coefficient was calculated from gel-filtration
value for the molecular radius (a) and the sedimentation coefficient
(S2o,w) obtained on ultracentrifuge (Keresztes-Nagy, 1962). The
reported values of octameric and monomeric sedimentation coefficients
127.
are 6.8 x lo-13 sec and 2.1 x lo-13 sec. These values were used to-
gether with the diffusion coefficients of octamer and monomer which
were calculated from the equation
R T D 20' w = --N_,,6_7\_Y)_a __
' where~ is the viscosity, T the absolute temperature, and R is the gas
constant. A value of 5.17 x lo-7 cm2 /sec was obtained for the diffu
sion coefficient of the octamer, and a value of 7.61 x lo-5 cm2 /sec was
obtained for the monomeric diffusion coefficient. The anhydrous mole-
cular weights were derived from the relation
RT s20 w M = --·---------'-----
D 20, w (l~j)
where J represents ·the density of water at 20°C, and v the partial-
specific volume. The molecular-weight values so obtained are 101,000
and 14,600 for the octameric and monomeric hemerythrin respectively.
The" previously established values of 107,000 and 13,500 (Keresztes-Nagy
and Klotz, 1965) agree well with these values. Any variation of the
derived values can be explained on the basis that the estimated value
of the Stokes radius depends not only on the precision of the elution-<
volume measurement, but also on the accuracy of the calibration data
of marker proteins.
In spite of an adequate correlation between sieve coefficients
and molecular Stokes radii, the most conunon application of gel fil-
tration has been to estimate the molecular weight from the primary
128.
experimental parameter, the elution volume. This is illustrated by the
vast amount of literature on protein molecular weights derived from
elution volumes; for many molecular species, direct correlation with
molecular weights was observed. In the present study also, good
correlation has been found between the molecular weight of the dissoci-
ated hemerythrin obtained from calibration graph of marker proteins,
and the previously determined value of 13,500 (Klotz and Keresztes-Nagy.
1963). As indicated earlier, the equilibrium between the octameric and
monomeric hemerythrin is a rapid process; consequently, at any protein
concentration the weight-average molecular weight can be used to cal-
culate the percent dissociation, which is a measure of the shift in the
equilibrium. Accordingly, the measurement of weight-average molecular
weights at various conditions (which might influence the dissociation-
equilibrium of hemerythrin) has been further utilized in understanding
the nature of ligand-protein interactions.
B. 1. Hemerythrin-Anion Interactions.
That iron-binding ligands do indeed influence the degree of
dissociation was demonstrated previously by sedimentation-velocity
experiments (Klapper et.al., 1966) and ion-binding studies (Klapper (
and Klotz, 1968b). In the present investigation, three different
ligands were examined at various protein concentrations. The data
in Table X shows that the dissociability of the protein differs with
the various hemerythrin-anion complexes. At an identical protein
129.
concentration of 100 µg/ml, thiocyanate complex was 61.2% dissociated,
the azide form 59.5%, and the oxy form 13% (Table XI). Further com-
parison of the extent of dissociation of these three complexes at 30
µg/ml concentration also indicates that the presence of ligands shifts
the equilibrium toward liganded monomers. This behavior agrees with
earlier experiments on ligand effect with hemerythrin-azide complex
(Keresztes-Nagy and Klotz, 1965), in which monomer had greater affinity
for the ligand (L) than the octamer. This stronger binding of the
monomeric protein can be explained by the following scheme:
(Hro2) 8
+
8L
H
K -;::::::====:!.... 8 Hr 02
+
8L
K' ll so2 + (HrL)s 8 Hr L + 8 02
In accordance with such a scheme, iron-complexing ligands have been
shown to affect the reactivity of the sulfhydryl groups with mercurial
reagents (Fransioli, 1969). Similarly in the present investigation,
the effects of ligands on the dissQciability have been demonstrated.
A study of the ligand effect of various ions was not intentionally
pursued, and hence results obtained on both G-75 and G-100 columns
will be used. Such a compilation would be justifiable if only the ' \
data obtained in the linear portion of the calibration graphs are
130.
utilized. An examination of those results, listed in Table X, reveals
that the effect on the dissociation of octameric hemerythrin depends on
the nature of complexing ligand. Accordingly, different degrees of dis-
association were found with the oxythiocyanate and azide complexes at
almost identical concentrations. In contrast, no difference was ob-
served between the dissociation of azide and aquo complexes of hemery-
thrin (Langerman and Klotz, 1969) by sedimentation-equilibrium technique.
This disadvantage of ultracentrifugation once again confirms our con-
tention that gel-chromatographic procedure is well suited for protein
interaction studies.
Our studies on the various hemerythrin complexes also indicate
that thiocyanate ion influences the dissociation of hemerythrin to the
greatest extent. This observation parallels the finding of greater
destabilization of the native macromolecular ion formations of DNA
(Hamaguchi and Geidusche, 1962), collagen (Gustavson, 1956), gelatin
(Be~lo et.al., 1956) and myosin (Tonomura et.al., 1962), in the
presence of thiocyanate ions. In these cases, the destabilizing effect
was explained on the basis of the "salting-in" properties of SCN-
(Schmidt, 1938). Such general "salting-in" effects of ligands may
< have to be considered, even in hemerythrin. The effect of SCN- on the
dissociation has been so far attributed only to the specific binding at
the iron site. Nevertheless, thicyanate binding at other sites might
also alter the dissociation. Therefore, one has to distinguish the
effects due to coordination and possible non-specific binding (non-
131.
covalent linkages, as those postulated for "salting-in" effects) for
the interpretation of effects on dissociation. We tried to achieve this
distinction by studying the changes in dissociation in the presence of
thiocyanate ion which occur before iron coordination. But, the rate
of thiocyanate coordination (measured by the conversion of owy-hemery-
thrin absorption spectra to that of a thiocyanate-hemerythrin complex)
was found to be very rapid. Therefore, the effect of thiocyanate ion on
the dissociation could not be studied before the iron-thiocyanate com-
plexing occurred.
B.2. Effect of Method of Preparation on the Dissociation Properties.
To our surprise, we found that hemerythrin solutions prepared by
dilution into thiocyanate-containing buffers exhibited a dissociation
behavior different ·than the thiocyanate-hemerythrin complex obtained
by dialysis of oxyhemerythrin itself. Table XVI gives the extent of
dissociation at three different protein concentrations. The complex
prepared by direct exchange dissociated to a lesser extent than the
complex prepared by dialysis (Table XVII). A further comparison with
the dissociation of oxyprotein (Table XI, 27 µg/ml) reveals that the
preparation obtained by the direct exchange has greater dissociation. (
These results suggest that thiocyanate ions can also alter the con-
formation (by non-covalent linkages) to produce a form different than
that produced in the dialysis procedure. At the present time, we do
not know if these conformations would become identical with time.
132.
This unexpected effect of thiocyanate on the dissociation pro-
perties of hemerythrin presented a serious problem because it raised
questions about the nature of stock oxyhemerythrin solutions. These
were routinely being made with sodium chloride. The properties of
the protein so obtained might possibly have been affected by chloride
ions. Therefore, the extent of dissociation was examined in the presence
and absence of chloride ions. These results were compared with those
obtained from a oxy-hemerythrin solution made in 0.1 M buffer. Data
presented in Table XIII clearly show that the protein preparations made
in the presence of chloride ions exhibited higher amount of dissociation.
In general, the dissociation was found to depend on the chloride con-
centration. Accordingly, the dissociation of oxyhemerythrin containing
0.1 M chloride was higher than that of oxyhemerythrin itself and lower
than that of oxyprotein in 0.5 M c1- (Table XIII). Since we did not have
a control experiment at 0.5 M buffer, the effect of ionic strength can-
not.be deduced from the observed dissociation at 0.5 M cl-.
In the above experiments, the extent of iron coordination and the
effect of time on the altered conformations are not known. Therefore,
the rate of chloride-iron complexing has been examined. Even though (
the rate of the oxy to c~loro-Hr spectral change is slower than that
of the oxy to thiocyanate-complex, considerable conversion occurs in
the presence of chloride ions. The conversion-rate studies at 0.1 and
0.5 M chloride levels indicate the conversion to be dependent on the
ionic strength (Fig. 21). Especially at the lower protein concen-
trations; the rate of oxy to chloro-spectral conversion was observed
133.
to be fast (Fig. 22). This finding suggests that the conversion is a
dissociation effect and not a mass effect, since in the latter case the
rate of conversion at high protein concentration would have to be faster
than at low concentrations. The faster rate at low concentrations may
be attributed to an easier accessibility of iron atoms in the monomeric
species (This point is also made in the discussion of mercurial-
hemerythrin interaction studies.)
B. 3. Evidence for Non-Iron Binding by Chloride Ions.
The oxyprotein whose properties have been altered by chloride
ions does not seem to undergo further conformational changes with time,
since the amount of dissociation remained constant (See Table XV).
Furthermore, the dissociation behavior was observed to be independent
of the amount of iron-chloride coordination (spectral conversion,
Table XIV). Therefore, the effect of chloride was ascribed to non-
covalent binding which is independent of iron-chloride linkage. How-
ever, the effect of chloride may also be explained on the basis of
changes in the solvent structure. For this reason, we performed direct
\ binding experiments with oxyhemerythrin on Sephadex (G-25) columns.
Initially, titration procedpre (Schales and Schales, 1941) was
employed for estimating the chloride levels in the effluent of the
zonal-chromatographic-binding experiments (Hunnnel and Dreyer, 1962).
Chloride was detected at the elution position of oxyhemerythrin, which
was an indication of the presence of chloride-protein complex. But, .
the extent of binding could not be accurately measured mainly because
134.
of the titrant used in these experiments. The mercuric ion of the
titrant, Hg(N03)2, could react with the sulfhydryl groups to produce
·errors in the titration values (Table XXI). A more reliable method of
evaluating the binding ratios was therefore developed. This was a
scintillation-counting procedure which measured the amount of chloride
in the effluent. At various protein concentrations, the amount of
chloride binding was measured and excellent reproducibility was attained
(See Table XXII). At a free chloride concentration of 0.003 M, 1.6
moles of chloride were found to complex with oxyhemerythrin. · At this
level of chloride ion, coordination to the iron-atoms can be considered
negligible (Keresztes-Nagy and Klotz, 1965). Therefore, we concluded
from the observed results (at 0.003 M chloride) that binding at non-iron
sites is preferred to the iron-chloride binding.
B. 4. Nature of the Chloride Binding Site:
Non-iron binding of chloride to oxyhemerythrin most probably,
occu~s at the free imidazole, g-amino and guanido groups of the basic
amino acids. Recent work (on dissociation and reactivity of hemerythrin)
on some specific non-coordinating ions (Garbett et.al., 197la) suggest
that the arginines near the cysteine residue may be involved in binding <
these ions. At this point, we are unable to distinguish this non-
coordinating ion-binding site from the chloride-binding site. In all
likelihood, both of these sites are identical; the protective effects
of non-coordinating ions such as perchlorateJ nitrate, and sulfate
135.
arising because of their bigger ionic size in comparison with that of
chloride. Therefore, the arginine residues No. 48 and No. 49 (See Fig. 35),
by virtue of the very close proximity tocysteine (No. SO) and other amino
acids of the active site,may be assumed to be the chloride-binding sites.
As mentioned earlier these amino acids are already implicated in binding
with perchlorate ions. (Garbett et.al., 197la).
Preliminary experiments on the extent of dissociation of hemery
thrin in the presence of 0.1 M perchlorate, acetate, and bromide ions
did not provide any new information about the postulated binding site
for chloride and non-coordinating ions. However, the percent dis
sociation of oxy-hemerythrin in the presence of perchlorate was found
to be identical to that of an aquo-hemerythrin at a protein concen
tration of 27 µg/ml (Table XIX). This observation agrees with previous
work of Darnall et.al. (1968), who showed that the circular dichroic
spectra (and therefore presumably the conformation) obtained in the
presence of 0.1 M perchlorate ion is essentially the same as that of
metaquohemerythrin. Bromide ion has been recently shown to coordinate
with the iron atoms of hemerythrin (Garbett et.al., 1969); therefore,
the effect on the dissociation may be similar to those of the other
iron-coordinating ions (Keresztes-Nagy and Klotz, 1965). The greater
percent of dissociation in the presence of acetate ion is probably an
electrostatic effect. Chiancone and Gilbert (1965) postulated such
electrostatic effects for the dissociation of oxyhemoglobin in the
presence of acetic acid.
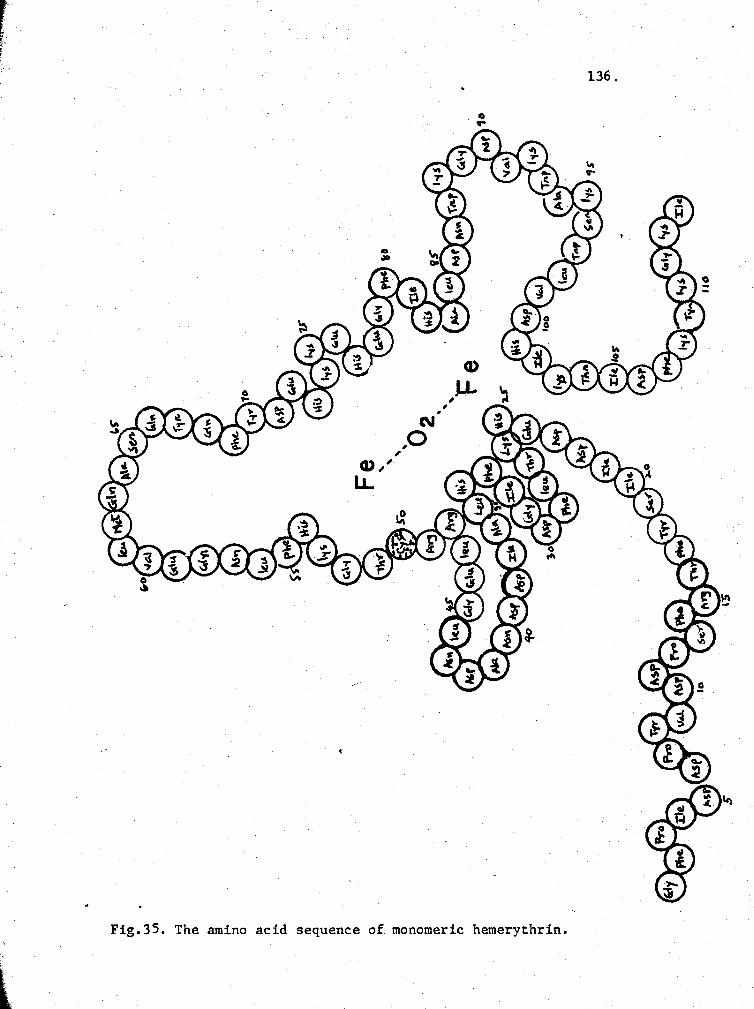
r ' ' !. ~. '
,
l
N ,0 ,
Q),' LL
, , .
Cl ..
Q)
J.,.L
Fig.35. The amino acid sequence of monomeric hemerythrin.
136.
137.
The mechanism of the allosteric effects of iron-binding anions
has been interpreted by two models (Keresztes-Nagy and Klotz, 1965);
one ~nvolves a conformational change, while the other involves the
dissociation of the protein, but both result in the formation of a
reactive form of the molecule. Previous evidence has mainly favored
the dissociation model (Klapper et.al., 1966; Langerman, 1969), but
more recent experiments suggest a mechanism which may involve both
conformational change and dissociation. This evidence will be con-
sidered in greater detail in the discussion of hemerythrin-mercurial
interactions.
Recognizing the effects of chloride through a non-iron-binding
site, both on the reactivity and dissociability, one may propose that
subtle, but stable, conformational changes are caused in the presence of
this ion. This proposal is supported by the experimental results with
chloro-complex made through dialysis and direct-exchange procedures
(Fig. 23). The dialysis procedu~e involves the release of oxygen with
fluoride ion (0.1 MF-) and the further conversion of the resulting aquo-
hemerythrin by the dialysis against 0.5 M chloride. The dissociation \
behavior of this protein was found to be different than that made by
dilution of the protein in the presence of 0.5 M chloride (Table XIX).
Interestingly, these two preparations of hemerythrin possess identical
spectral characteristics. Results presented in Table XVIII, show that
once the character of iron is affected (such as by the formation of
aquo complex), further changes (such as dialysis or the presence of •,
138.
0.5 M chloride) bring about the same effect (e.g. dissociation). These
results can be rationalized by assuming that chloride in the absence
of fluoride preferentially binds at a site other than the iron. The
conformation arising from this binding appears to be stable (Table XV).
Our assumption for such a preferential binding seems credible if one
considers the rate of exchange of oxygen by chloride and fluoride ions.
Fluroide ions release the oxygen of oxyhemerythrin much faster, in spite
of their lower affinity for the iron-atoms, in comparison with chloride
ions (Duke et.al., 1971; Garbett et.al., 197la). Such a situation arises
only, if the iron atoms are available for exchange of oxygen to fluoride
ions and not to the chloride ions. Recent evidence (Garbett, et.al.,
197la) does indicate that the environment around the iron atoms is
essentially non-polar, and hence in an aqueous media (as that of our
experimental system) the iron atoms are not exposed to the surface. If
this is the case, the ions which can enter the crevice in the protein
structure (to release the oxygen) will be the fluoride ions since their
ionic radius is smaller than that of chloride (Weast, 1968). Accordingly,
the presence of fluoride ions would force the formation of a complex
with the iron atoms, in contrast to the non-iron complexing by chloride
ions.
However, the above hypothesis does not explain why the rate of
release of oxygen is faster with thiocyanate and azide ions than with
chloride ions. Both SCN and N3
are larger in ionic size than chloride.
Therefore, these ions may cause faster conformational changes to release
, f
139.
the oxygen. _In an alternate explanation for the observations with p-
and Cl-, none of the oxygen atoms can be visualized projecting out of
the non-polar environment of the iron. The bigger size of azide and
thiocyanate ions might therefore influence the accessibility of oxygen
for these ions. The faster release of oxygen by fluoride may then be
attributed to specific effects of fluoride ions, such as its ability to
form a non-electrolytic complex with ferric iron from ferric chloride
(Hutchinson, 1959).
Interpretation of new findings on hemerythrin on the basis of
physiological function has not always been possible, except in the above
mentioned binding of chloride. Vascular hemerythrin transports oxygen
from the high-oxygen pressure of sea water to the coelom. The coelomic
hemerythrin, in turnJ constitutes a transfer system between the vascular
hemerythrin and the tissues (retractor muscles). The hemerythrin non-
iron binding sites are probably saturated in the presence of sea-water,
whic~ is isoionic with the coelomic fluid (red corpuscles). As the
retractor muscles retract, high pressures (14-79 mm PSI) are exerted on
the body cavity, and the coelomic fluid is circulated (Prosser and Brown,
1961). Tissue pressures are generally lower, and in the mud at low tide <
the worm is undoubtedly exposed to lower oxygen concentrations. A
modular role can be exerted by chloride in low o2 conditions by releasing
oxygen at a faster rate. We have shown in this investigation that the
rate of oxygen release is higher in the presence of chloride ions, and
140.
that the conformation is altered by saturation (bi~ding) with the chloride.
Therefore, it is very likely that chloride does have a physiological
function in the transport of oxygen by hemerythrin.
Before discussing further data obtained on hemerythrin inter-
actions through gel-chromatographic procedures other than frontal-gel-
chromatographic technique and zonal-binding experiments, the major as-
pects studied so far can be listed as (1) evaluation of the dissociation
constant'K'; (2) calculation of the stoichiometry of dissociation 'n';
(3) interpretation of the rate of reequilibration of the dissociation
reaction; (4) estimation of the size (radius) of the octameric and mono-
meric molecules; (5) observation of the ligand effect by the extent of
dissociation; (6) direct evidence for non-iron binding by chloride ion.
C.l. Hemerythrin-Mercurial Interactions:
The knowledge gained from the chloride binding experiments was
extended to understand the much studied reaction of hemerythrin sulfhy-
dryl groups with mercurial reagents. From spectrophotometric kinetic
data, Egan (1969) proposed a pre-reaction-binding step at non-sulfhydryl
groups in the protein, which is assumed to be slow and hence rate-
limiting. Similarly, Duek et.al. (1970) postulated rapid binding of pMB
to sites other than the sulfhydryl groups from steady-state binding ex-
periments and sedimentation velocity data. Therefore, in an effort to
determine the nature of the pMB-Hr binding, gel-filtration experiments
were performed in a Sephadex G-25 column. The measurement of binding in
the presence of minimum reaction was facilitated by empluying hiph column
I I
141.
flow-rate (60 ml/hr), low temperature (8°C) and a slower-reacting hemery-
thrin species (oxy-form). On a short column able to completely resolve
hemerythrin and pMB, the extent of binding was calculated from
the area of the peak at the protein-elution position. About 0.5 moles
of pMB were found to bind with each mole of oxy-hemerythrin. The elution
profile of this experiment exhibited two positive peaks; the more re-
tarded peak was tentatively identified as that of pMB-chloride complex.
Such pMB-chloride binding was not unexpected, since it may be postulated
from known interactions of phenyl compounds with anions (Stengle and
Baldeschwieler, 1966). However, the retardation of pMB-Cl- complex in
comparison with the salt-elution position of the column was interesting,
if npt completely surprising, since the Sephadex material has been known
to bind with aromatic substances (Geolette, 1960). Accordingly, the
column material might have interacted with the pMB which would delay the
elution process of the pMB-chloride complex. Additional studies in this
direction are being planned to quantitatively investigate pMB inter-
actions with chloride, fluoride, etc. Results of such experiments can
be expected to aid the interpretation of the kinetics of mercurial re-
action with the various hemerythrin-ligand complexes.
Therefore further experiments were carried out in the absence ·of
chloride ion. The extent of binding was evaluated at 25 percent
reaction and at three levels of pMB concentrations. A higher amount of
binding was observed at higher mercurial and lower protein concentrations
(Table XXIII). The extent of reaction was estimated to be less than 40%
142.
from the frontal-chromatographic concentrations at two different levels
of pMB. However, binding may also contribute to the increase in
absorbance of 250 run from which the percent reaction is calculated.
Furthermore, in these experiments we were not able to distinguish if
the pMB binding it happens before or after the reaction with the sul
fhydryl groups. Also, it is important to know if the bound pMB could
then react with the sulfhydryl groups of hemerythrin.
Such knowledge about the fate of the pMB is crucial for the inter
pretation of the observed kinetics of pMB-hemerythrin reactions.
Recently, Klapper (1970) reported that monomeric methemerythrin has 6
binding sites for pMB. These binding measurements were made 3 minutes
after the mixing of pMB and protein. However, more recently, Cress
(1971) observed that approximately 30 percent of the sulfhydryl
mercurial reaction is completed within one minut~ of mixing of the
reactants. Therefore, theoretically, one can suggest some binding of
pMB by the monomers in the next two minutes (which was the time interval
remaining before the binding measurements). Furthermore, Klapper (1970)
did not show the bound mercurial's ability to partake in the reaction
with sulfhydryl groups. Any such evidence would be important for the
understanding of the complex kinetics of hemerythrin-sulfhydryl and pMB
reaction. In an attempt to achieve this evidence, oxyhemerythrin and
pMB were rapidly mixed prior to G-25 column (0.3 x 50 cm) application
and by arresting the column flow just before mercurial elution to
ensure the absence of unreacted pHB. Under these cond~tions, any
143.
additional reaction occurring after stopping the colunm elution must
arise from the mercurial bound to the hemerythrin which has not yet
reacted with the sulfhydryl groups. In one experiment, such an increase·
in the absorbance at 250 nm was observed, which indicates that the
bound pMB was able to react with the sulfhydryl groups. We are presently
not able to ascribe the binding of pMB as the cause for the kinetic
complexities of the reaction. It should be noted, nevertheless, that
the usage of the micro-bore column, and the rapid mixing of reactants
in a small-volume mixing chamber with the very high flow rates (> 60
ml/hr) from two pumps, does allow the study of relatively rapid re-
actions between small and large molecules,
C.2. Evidence on the Mercurial-Reactive Species of Hemerythrin.
The first two hypotheses of the dissociation model (which was
extended to explain the allosterism of the iron atoms and sulfhydryl
groups), the existence of a native equilibrium between the octameric
and monomeric hemerythrin, and the effect of iron-binding ligands on
this equilibrium have been shown to be valid by both the previous
(Keresztes-Nagy et.al., 1965; Klapper and Klotz, 1968; Langerman and
Klotz, 1969) and the present investi&ations. The third hypothesis of.
the dissociation model, which predicts that the -SH-groups of the mono-
meric hemerythrin are more reactive than the octamers is of considerable
interest, since it's validity has not yet been conclusively proven. This
hypothesis assumes that the rate of dissociation is equal to the rate of
I l
I . I I I
I
144.
reaction. If such is the actual case, then one has to visualize con-
formational changes arising from the mercurial binding to octamer, which
eventually expose the sulfhydryl groups to react with pMB and dissociate
innnediately into subunits. In actuality, this might not be the situation
since recently Cress (1971) showed that the sulfhydryl groups of mono-
mers are not more reactive than those of octamers. Therefore, the
octameric hemerythrin are probably the reactive species. For further
proof of the octameric reactive species, we compared the rate of reaction
with the rate of dissociation.
Previously, gel chromatography was mostly limited to studies on
complex formation or binding. Therefore, the present application of
gel chromatography for observing both the· dissociation and the rate of
reaction suggests its usefulness in many other unexplored biochemical
reactions.
For the past several years, Boyer's (1956) spectrophotometric-
titration procedure was used for reaction-rate measurements. Parallel
ultracentrifugation experiments (Duke et.al., 1970) could only estimate
the amount of dissociation at the. completion of reaction, since these
studies were time consuming. Once again, we were able to use gel chroma-
• tography to study the rate of reaction as well as the rate of dissociation
were evaluated from the same elution profiles. At various stages of the
reaction, aliquots were applied on the column.
145.
Inspection of Fig. 32 clearly indicates that the rate of dis
sociation falls behind the rate of reaction. Consequently at any time
during the reaction, a considerable portion of the octameric species is
associated with pMB, as shown on the last column in Table XXI. These
findings are not in agreement with the proposition of the dissociation
model (Keresztes-Nagy and Klotz, 1965) that the sulfhydryl groups are
reactive only in the monomeric form, and thus dissociation is a pre
requisite for the reaction of the sulfhydryl groups in hemerythrin with
pMB. /
C.3. The 'All-or-None' Behavior of Hemerythrin -SH Groups.
The disagreement between the extent of the reaction and the degree
of dissociation is a temporary one since the latter eventually would
catch up the with former even in the case of the oxygenated hemerythrin.
That the final state indeed corresponds to the originally observed
'all-or-none' type is demonstrated with the chloro complex of the pro
tein (Fig. 33).
What is then the reaction mechanism which leads from reacted
octamers to segregation into unreacted octamers and reacted monomers,
when less than stoichiometric amounts of mercurial are used? One
possibility is that the reaction of the octamers, i~self, is an 'all
or-none' type resulting in two distinct populations of octameric
molecules (Mechanism 1, Fig. 36); one with all eight cysteinyl residues
reacted, and another with no reacted sulfhydryl groups. This type of
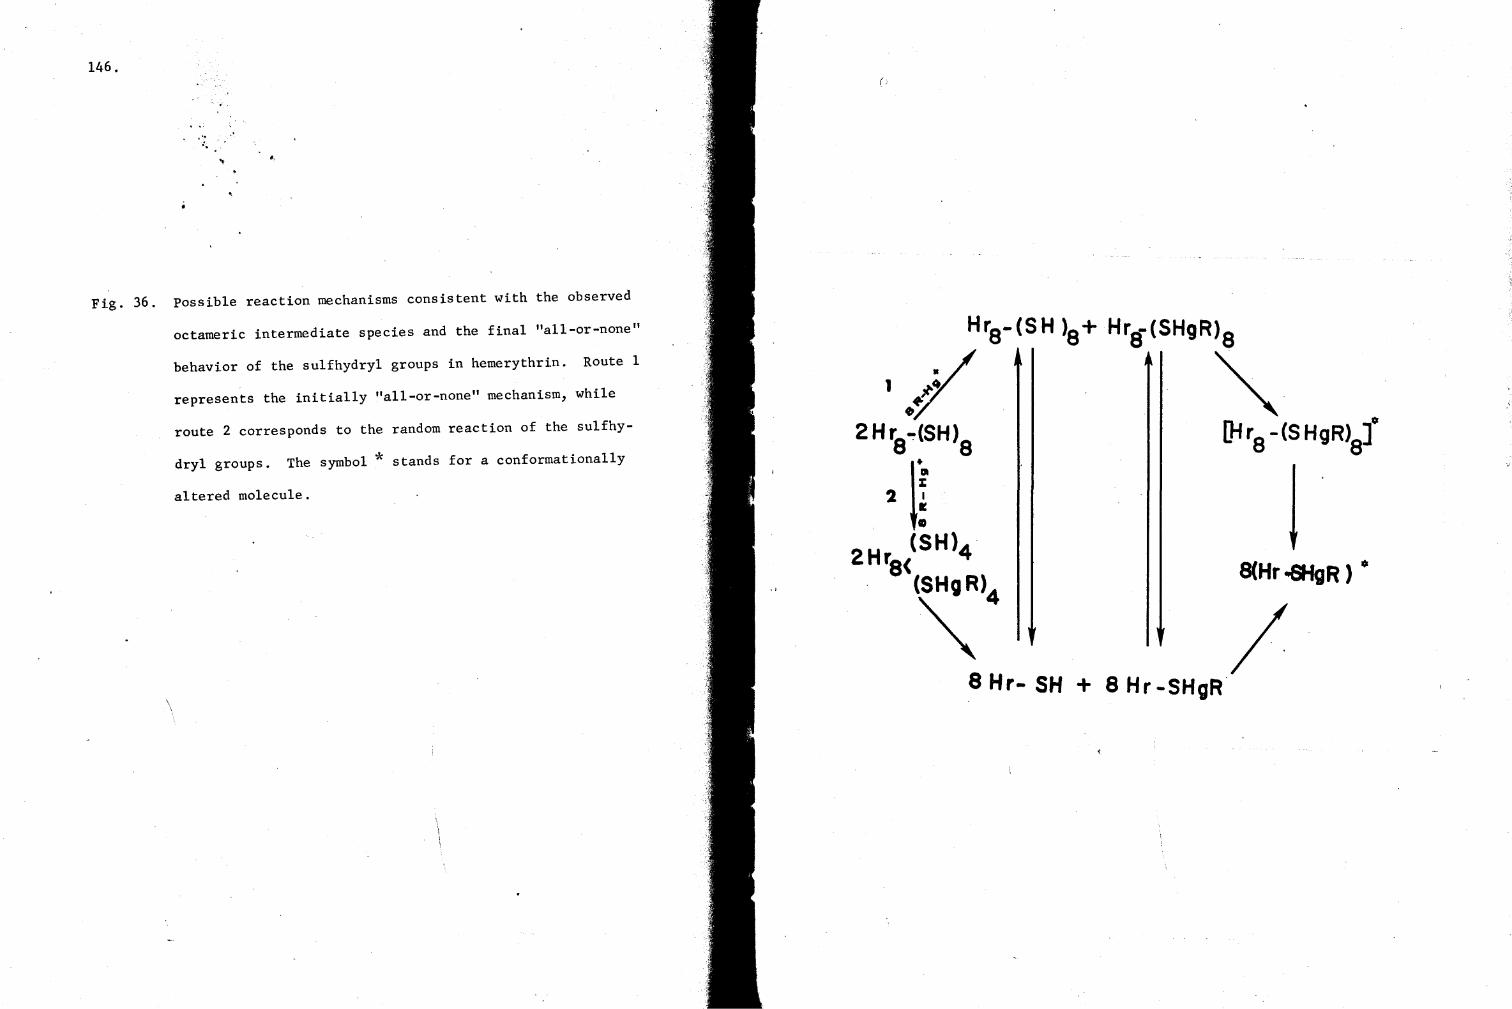
146. ()
... " .. .. ,.,
Fig. 36. Possible reaction mechanisms consistent with the observed
octameric intermediate species and the final "all-or-none"
behavior of the sulfhydryl groups in hemerythrin. Route 1
represents the initially "all-or-none" mechanism, while
route 2 corresponds to the random reaction of the sulfhy-
dryl groups. The symbol* stands for a conformationally
altered molecule.
S(Hr ..sligR ) 0
\ 8 Hr- SH +
/ 8 Hr-SHgR
147.
reaction was first proposed for phosphorylase (Madsen and Cori, 1956)
and may be the result of a "zipper" or ''wedge" mechanism (Madsen and
Gurd, 1956; Boyer, 1958) or it may be due to an isomerization of the
octamers to expose all -SH groups in only one isomeric form. Such a
two-state model was proposed by Monod, Wyman and Changeux (1965) to
explain the allosteric behavior of enzymes. The completely reacted
octamers then would undergo secondary conformational changes leading to
an irreversible dissociation by a relatively slow rate. Accordingly,
the overall rate of dissociation may be slower than the rate of the
reaction, as is the case with oxygenated hemerythrin.
Alternatively, the 'all-or-none' final state may be the result of
a second mechanism (Fig. 36) according to which the reaction itself is
random; meaning that initially all the octamers react more or less to
the same extent. In this case, only a si~gle population of octameric
molecules would be produced in contrast to the above discussed mechanism.
The randomly reacted octamers then would dissociate into reacted and
unreacted monomers, of which the latter ones would reassociate to yield
completely unreacted octamers. After the initial step the two mechanisms
may become undistinguishable, because, for a time, the reacted monomers
may also re associate and segregate. , This is assumed since blockage of
the sulfhydryl groups alone may not necessarily result in irreversible
dissociation and further conformational changes might take place before
the reacted octamers irreversibly depolymerize.
(' 148.
It may be possible to distinguish between the two mechanisms
experimentally since the charges on the completely reacted, partially
reacted, and completely unreacted octamers are expected to be different
from one another. Hence, if a mixture of react~d and unreacted oxy-
hemerythrin octamers (Table XXIV, last column) cannot be resolved into
two species by electrophoresis or ion-exchange chromatography, the
reaction itself would be originally of the random type. However, finding
two species in such a mixture, corresponding to completely reacted and
unreacted octamers, would not conclusively prove mechanism 1, since this
state could have come about by secondary reequilibration. From the
dissociation and reaction-rate studies, it is already possible to conclude
that the 'all-or-none' final state arises via the formation of reacted
octamers which would dissociate into monomers with a relatively slow
rate. Thus, the major conclusion from the rate studies is the definite
invalidation of the third hypothesis in the dissociation model.
The role of sulfhydryl groups in the oxygen-carrying function of
hemerythrin was evaluated by comparing the rate of reaction with the
rate of oxygen-release (Fig. 32a). A rapid release of oxygen is observed
in comparison with the rate of dissociation. Previously, Fransioli (1969)
found that the rate of reaction of -SH groups and pMB is faster than the
rate of oxygen release. This apparent contradiction about the oxygen
release can be explained by considering both our and Fransioli's (1969)
experimental conditions. We employed a lower oxyhemerythrin concen
-5 tration (6.0 x 10 M) in comparison with that of previous experiments
(;
149.
-4 (5 x 10 M). The ratio of pMB:Hr was almost identical in both cases
(2:1). Therefore, greater amount of monomers would be present in the
protein solution of our reaction mixture. If, as we mentioned earlier,
the oxygen in the monomeric hemerythrin is more easily accessible than
in the octamers, one can expect to observe a faster rate of o2 release
at lower protein concentrations. In general, the rate of oxygen loss
can be explained by implicating an indirect role for free sulfhydryl
groups in the oxygen transport of hemerythrin. Accordingly, once the
sulfhydryl groups are reacted with mercurial, oxygen is gradually
released. Such indirect role of sulfhydryl groups in maintaining
catalytic functions is not uncommon in proteins.
D. Considerations for the Working Model of Hemerythrin Interactions:
A closer examination of the rate of reaction curve (Fig. 32)
shows that about 30% of the reaction occurs rapidly in the first 9-10
minutes. Such an initial fast phase 0£ reaction has also been observed
by other investigators (Egan, 1969; Duke et. al., 1971, Cres.s, 1971).
Among these, one groups of workers (Duke et.al., 1971) indicated that
the mercurial binding at non-sulfhydryl sites is faster than with the
sulfhydryl groups. Earlier hypothesis ·of Egan (1969) also proposes <
similar binding in the mode of a surface denaturation by pMB. Such a
binding can be assumed to gradually unfold the molecule so that all the
sulfhydryl groups are eventually exposed for reaction with pMB. The
initial fast reaction may be attributed to the presence of some fasti\
reacting sulfhydryl species. However, recent experiments of Duke et.al.
150.
(1971) discount the hypothesis for fast-type sulfhydryl groups. These
workers suggest the rapid binding of pMB at non-sulfhydryl groups as
the contributing factor in the initial fast portion of the mercurial-
hemerythrin reaction. Such a rapid binding of pMB may not be of any
consequence, since the ability of the bound pMB to react has been
already observed. (A more detailed treatment may be found in the work
of Cress (1971)).
Alternatively, one can also explain the initial phase of the
hemerythrin-pMB reaction on the basis of a small amount of reactive
species in equilibrium with the rest of the inactive species. As the
reaction proceeds, conformational change allows further reaction of
the mercurial. The results of the present study indicate that the
octameric hemerythrin is the reactive species. In such a hypothesis,
some proportion of the octameric hemerythrin must contain the reactive
-SH groups, and hence a different conformation. Anion binding is
assumed to shift the equilibrium of both the reactive and unreactive
octameric species towards the monomers.
Fr~m the present investigation, we conclude that any model
postulated for hemerythrin interactions must involve octamers as the
t reactive species, and the ligand interactions at both the iron and non-
iron sites. The relevance of pMB pre-reaction binding cannot yet be
predicted as to its effect on the kinetics of pMB-hemerythrin sulfhy-
dryl reaction. Therefore, further investigation of this problem can be
of great importance to an understanding ~f the behavi?r of sulfhydry!
groups in other biologically important proteins.
151.
CHAPTER V
SUMMARY AND CONCLUSIONS
This investigation used gel-chromatography technique as an
analytical tool to investigate certain thermodynaric and kinetic
problems involving protein interactions. The effects of dilution,
various anions, and the sulfhydryl-group blocking reagent, paramer
curibenzoate, on the association and dissociation of the model protein,
hemerythrin, were studied. The major conclusions and original con
tributions of this dissertation may be summarized as follows:
(1). The standard free energy for the dissociation of hemery
thrin octamer into subunits is about 6 Kcal per mole of monomer; this
value agrees well with previous measurements by sedimentation-equili
brium (Langerman and Klotz, 1969) and ion-binding techniques (Klapper
and Klotz, 1968a).
(2). The octamers and monomers cannot be separated from their
equilibrium mixture because the association-dissociation equilibrium
is rapidly established. This contrasts with the sedimentation-velocity
experimental finding (Klapper et. al.<, 1966) of a slowly established
equilibrium.
(3). From analysis of elution boundaries, we have concluded
that the stoichiometry of dissociation is equal to the number of sub
units (i.e. 8). Thus, no stable intermediates, such as dimer or
152.
tetramer, need be taken into account when making equilibrium calculations.
A similar conclusion was reached on the basis of the sedimentation-equil
ibrium studies already mentioned.
(4). Iron-coordinating anions, as expected from earlier studies,
specifically affect hemerythrin-dissociation equilibrium, in general
favoring the monomeric form of the protein. In regard to detecting
minor shifts in the degree of dissociation as the function of various
parameters such as specific ligands, temperature, etc., gel filtration
proved to be more sensitive than ultracentrifugation.
(5). In contrast to earlier beliefs, the binding of the anion
to the metal (iron) in hemerythrin with concomitant spectral changes
has been shown not to be the major factor affecting protein conformation
and dissociation. These effects could be demonstrated at low ligand
concentrations not connected to any spectral change, as well as higher
concentrations prior to, and independent of, any spectral transitions.
(6). Subsequently, we have shown that at least chloride ion, the
ligand most studied, binds to hemerythrin (with stronger affinity) at
a site other than the iron.
In this study, the Hummel and Dreyer gel-chromatography procedure
(1962) was used in conjunction with radioactive chloride to detect
binding.
(7). The binding of pMB to hemerythrin, as opposed to its reaction
with cysteinyl residues, was shown both by the zonal-Hummel and Dreyer
153.
technique (1962) and frontal-elution chrdmatography. Combining this
latter procedure with stopped-flow method, we obtained evidence that
the bound pMB can react with the sulfhydryl groups in hemerythrin.
(8). Finally, we have also studied the rate of reaction of pMB
with the protein sulfhydryl groups and compared it with the rate of
dissociation into the monomeric form. We were able to observe these
two rates simultaneously, employing zonal-gel-filtration techniques.
We have concluded that, contrary to previous suggestions (Keresztes
Nagy and Klotz, 1965), it is the octameric form of the protein which
reacts with the mercurial, most probably in a random fashion, followed
by reequilibration and dissociation resulting in the observed all-or
none behavior.
154.
BIBLIOGRAPHY
Ackers, G. K. (1964). ''Molecular Exclusion and Restricted Diffusion
Processes in Molecular-Sieve Chromatography". Biochemistry, l'
723-730.
Ackers, G. K. (1964). Ph.D. Thesis, John Hopkins University, Baltimore,
Maryland.
Ackers, G. K. (1967a). "A New Calibration Procedure for Gel Filtration
Columns". J. Biol. Chem., 242, 3237-3238.
Ackers, G. K. (1967b). ''Molecular Sieve Studies of Interacting Protein
Systems. I. Equations for Transport of Associating Systems". J.
Biochem., 242, 3026-3034.
Ackers, G. K. (1970). "Analytical Gel Chromatography of Proteins".
Adv. Prat. Chem., 24, 343-446.
Ackers, G. K. and Steere, R. S. (1967). "In Methods in Virology"
(K. Maramorosch and H. Koprowski eds.) II. Academic Press, \
New York, P. 325-365.
Ackers, G. K. and Thompson, T. E. (1965). "Determination of Stoichio-
metry and Equilibrium Constants for Reversibly Associating Systems
By Molecular Sieve Chromatography". Proc. Natl. Acad. Sci. U. S.
,?l, 342-349.
155.
Albertsson, P.A. (1960). "The Partition of Cell Particles and Macro-
molecules". Academic Press, New York.
Andrews, P. (1964). "Estimation of the Molecular Weights of Proteins
by Sephadex Gel-Filtration". Biochem. J., 91, 222-233.
Andrews, P. (1965). "The Gel Filtration Behavior of Proteins Related
to Their Molecular Weights Over a Wide Range". Biochem. J., 96,
595-606.
/
Ansevin, A. T. and Lauffer, M.A. (1959). "Native Tobacco Mosaic Virus
Protein of Molecular Weight, 18,00011• Nature, 183, 1601-1602.
Archibald, W. ~· (1947). "A Demonstration of Some New Methods of
Determining Molecular Weights from the Data of the Ultracentrifuge".
J. Phys. and Colloid Chem., 51, 1204~1214.
Bello, J., Riese, M. C. A., and Vinograd, J. R. (1956). ''Mechanism of
Gelation of Gelatin. Influence of Certain Electrolytes on the
Melting Points of Gels of Gelatin and Chemically Modified
Gelatins". J. Phys. Chem., 60, 1299-1306.
Bethune, J. L. and Kegeles, G. (1961). "Countercurrent Distributiort .
of Chemically Reacting Systems. I. Polymerization". J. Phys.
Chem., 65, 433-438.
Boeri, E. and Ghiretti-Magaldi. (1957). "The Properties of Hemerythrin".
Biochem. Biophys. Acta., 23, 489-493.
156.
Boyer, P. D. (1954). "Spectrophotometric Study of the Reaction of
Protein Sulfhydryl Groups with Organic Mercurials". J. Afn.. Chem.
soc.' 72_, 4331-433 7.
Boyer, P. D. (1959). "Sulfhydryl and Disulfide Groups of Enzymes".
The Enzymes Vol.!, 2nd ed. (Boyer, P.D.; Lardy, H. and Myrback,
K., eds). Academic Press, New York. 511-588.
Brumby, P. E., Miller, R. W. and Massey, V. (1965). "The Content and
Possible Significance of Labile Sulfide in Some Metalloflavo
proteins'. J. Biol. Chem., 240, 2222-2228.
Cann, J. R. (1970). In "Interacting Macromolecules 1 • P. 123-133,
Academic _Press, New York.
Cardenas, J. M. and F. Wold. (1968). "Studies on Rabbit Muscle Enolase.
Evidence for Two Identical Polypeptide Chains and Two Substrate
Binding Sites in the Active Enzyme". Biochemistry, ]_, 2736-2741.
Casassa, E. F. (1967). "Equilibrium Distribution of Flexible Polymer
Chains between a Macroscopic Solution Phase and Small Voids". J.
Polymer. Sci. B 773.
Chiancone, E. and Gilbert, G. A. (1965). "Dissociation of Hemoglobin
into Subunits. I. Oxyhemoglobin: Effect of Acetic Acid. J.
Biol. Chem., 240, 3866-3867.
Coombs, T. L., Omote, Y. and Vallee, B. L. (1964). "The Zinc Binding
Groups of Carboxypeptidase A". Biochemistry, ~-' 653-661.
157.
Cox, D. J. (1971). "Computer Simulation of Sedimentation in the
Ultracentrifuge V. Ideal and non-Ideal Monomer-Trimer Systems 11•
Arch. Biochem. Biophys., 142, 514-526.
Cowman, R. A. and Swaisgood, H. E. (1966). "Temperature Dependent
Association-Dissociation of Streptococcus Loci's Intracellular
Proteinase". Biochem. · Biophys. Res. Corrnn., 23, 799-803.
Cress, M. C. (1971). Private Corrnnunication of Unpublished Data.
/
Darnall, D. W., Garbett, K. and Klotz, I. M. (1968). "Specific Anion
Binding Effects on the Reactive Site of Hemerythrin". Biochem.
Biophys. Res. Corrnn., 32, 264-271.
Determann, H. (1968). "Gel Chromatography". Springer-Verlag, New
York. P. 71.
Determann, H. (1969). "Gel Chromatography". 2nd Edition. Springer
Verlag, New York. P. 108.
Duke, J., Barlow, G. H., and Klapper, M. H. (1971). "The Reaction of
p-Mercuribenzoate with Methemerythrin". Biochim. Biophys. Acta.,
229, 155-166.
Egan, N. E. (1969). "Kinetic Investigation of the Reaction of p
Mercuribenzoate with Sulfhydryl Groups ·in Hemerythrin". M. S.
Thesis, Loyola University, Chicago, Illinois.
158. (
Fairclough, G. F. and Fruton, J. S. (1966). "Peptide-Prote:i,n Inter-
action as Studied by Gel Filtration". Biochemistry, ~' 673-683.
Fransioli, M. G., Egan, N. E., Keresztes-Nagy, S. (1968). Abstracts
of American Chemical Society, 156th National Meeting, Atlantic
City, New Jersey.
Fransioli, M. G. (1969). "The -SH Groups of Hemerythrin: Their Role
in Oz Binding and their Interaction with Iron-Coordinating Ligands".
M.S. Thesis, Loyola University, Chicago, Illinois.
Garbett, K., Darnall, D. W., Klotz, I. M. and Williams, R.J.P. (1969).
"Spectroscopy and Structure of Hemerythrin". Arch. Biochem. Biophys.,
103, 419-434.
Garbett, K., Barnall, D. W. and Klotz, I. M. (197la). "The Effect of
Bound Ions on the Reactivity of Residues in Hemerythrin". Arch.
Biochem. Biophys., 142, 455-470.
Garbett, K., Johnson, C. E., Klotz, I. M., Okamura, M. Y. and Williams,
R. J. P. (197lb). "Hemerythrin: Further Studies of Mossbauer
Spectra". Arch. Biochem. Biophys., 142, 574-583.
Geolette, B. (1960). "Studies on Gel Filtration-sorption properties of
the bed material sephadex". f. Chroma tog., l, 330-342.
Giddings, J. c., Jucera, E., Russell, C. P. and Myers, M. N. (1968).
"Statistical Theory for the Equilibrium Distribution of Rigid
Molecules in Inert Porous Networks. Exclusion Chromatography".
J. Phys. Chem., ?.3_, 4397-4408.
159.
Gilbert, G. A. (1955). "The Physical Chemistry of Enzymes". Discuss.
Faraday Soc., 20, 68-71.
Gilbert, G. A. (1959). "The Sedimentation and Electrophoresis of
Interacting Substances. I. Idealized Boundary Shapes for a Single
Substance Aggregating Reversibly". Proc. Roy. Soc. (London) A. 250,
377-388.
Gilbert, G. A. (1966). '1Layer Technique in Gel Filtration for Estimating
Differences in the Degree of Dissociation of Closely Related /
Proteins". Nature, 212, 296-297.
Guidotti, G. and Craig, L. C. (1963). "The Behavior of Solutes which
Associat~"· Proc. Nat. Acad. Sci., SO, 46-54.
Groskopf, W.R., Holleman, J. W., Margoliash, E. and Klotz, I. M.
(1966). "Amino Acid Sequences of Peptides from the Tryptic
Digest of Golfingia gouldii Hemerythrin". Biochem., 1, 3783-
3796.
Gustavson, K. H. (1956). "The Chemistry and Reactivity of Collagen".
Academic Press Inc., New York.
Hamaguchi, K., Geidusche, E. Peter. (1962). "The Effect of Elect
rolytes on the Statility of the Deoxyribonuclease Helix". J.
Amer. Chem. Soc., ~ 1329-1338.
160.
Hannnes, G. G. and Schinnnel; P. R. (1965). "Equilibrium Measurements
of the Binding of Cytidine 3'Phosphate to Ribonuclease". J. Amer.
Chem. Soc., 87, 4665-4669.
Henn, S. w., Ackers, G. K. (1969). ''Molecular Sieve Studies of Inter
acting Protein Systems. rJ. Molecular Size of the D-Amino Acid
Oxidase Apoenzyme Subunit". J. Biol. Chem., 244, 465-470.
Henn, S. W. and Ackers, G. K. (1969). ''Molecular Sieve Studies of
Interacting Protein Systems. -.v. Association of Subunits of
D-Amino Acid Oxidase Apoenzyme". Biochemistry, ~' 3829-3838.
Hunnnel, J. P. and Dreyer, W. J. (1962). ''Measurement of Protein
Binding Phenomena by Gel Filtration". Biochem. Biophys. Acta.
~ 530-532.
Hutchinson, E. (1959). In "Chemistry, the Elements and Their Reactions".
P. 672, W. B. Saunders and Co., Philadelphia.
Ikkai, T. and Ooi, T. (1969). "The Effects of Pressure on Actomyosin
Systems". Biochemistry, ~' 2615-2622.
Joseph, R. and Harrington, W. F. n966). "Studies on the Formation
and Physical Chemical Properties of Synthetic Myosin Filaments".
Biochem., 1, 3473-3487.
Kakiuchi, K., Kato, S., Iwamishi, A. and Isemura,,T. (1964). "Associa
tion and Dissociation of Bacillus subtilis a-amylase Molecule".
J. Biochem., 21, 102-109.
(c
Kellett, G. (1967). "The Study of Interacting Protein Systems by
Molecular Sieve Chromatography". Lab. Pract., 16, 857-862,
Keresztes-Nagy, S. (1962). "Chemical and Macromolecular Properties
of Hemerythrin". Ph.D. Thesis, Northwestern University,
Evanston, Illinois.
161.
Keresztes-Nagy, S. and Klotz, I. M. (1963). ''Mercaptan Involvement
in Dissociation and Reconstitution of Hemerythrin". Biochemistry,
~ 923-927. /
Keresztes-Nagy, S. and Klotz, I. M. (1965). "Influence of Coordinating
Ligands on Structure and Spectra of Hemerythrin". Biochemistry,
~' 919-931.
Keresztes-Nagy, S., Lazer, L., Klapper, M. H. and Klotz, I. M. (1965).
"Hybridization Experiments: Evidence of Dissociation Equilibrium
in Hemerythrin". Science, 150, 357-359.
Keresztes-Nagy, S. and Klotz, I. M. (1967). '~ooperative Interactions
of Bound Ions and Sulfhydryl Groups in Hemerythrin". J. Polymer
Sci. Part C., 16, 561-570.
Keresztes-Nagy, S. and Orman, R. (1971). "Dissociation of Yeast
Enolase into Active Monomers". Biochemistry, 10, 2506-2508.
Klapper, M. H. (1970). "Rapid Binding of pMB to Non-SH Groups on
Hemerythrin". Biochem. Biophys. Res. Comm.,~' 172-179.
162.
Klapper, M. H. and Klotz, I. M. (1968a). "Physiology and Biochemistry
of Hemerythrins". (ed. E. Ghiretti). Academic Press, London,
New York, P. 85-93.
Klapper, M. H. and Klotz, I. M. (1968b). "Cooperative Interactions
and Determination of Protein Association-Dissociation Equilibria.
Hemerythrin". Biochemistry, ]_, 223-231.
Klapper, M. H., Barlow, G. H. and Klotz, I. M. (1966). "Evidence from
Sedimentation Velocity for Dissociation Equilibrium in
Hemerythrin" Biochem. Biophys. Res. Connn., ~' 116-123.
Klotz, I·. M. (1967). "Protein Subunits: A Table". Science, 155,
697-698.
Klotz, I. M. and Keresztes-Nagy, S. (1963). "Hemerythrin: Molecular
Weight and Dissociation into Subunits". Biochemistry, 1, 445-452.
Klotz, I. M. and Klotz, T. A. (1955). "Oxygen-Carrying Proteins: A
Comparison of the Oxygenation Reaction in Hemocyanin and Hemery
thrin with that in Hemoglobin". Science, 121, 477-480.
Klotz, I. M., Klotz, T. A. and Fiess, H. A. (1957). "The Nature of
the Active Site of Hemerythrin". Arch. Biochem. Biophys., 68,
284-2-39.
Klotz, I. M., Langermann, N., and Darnall, D. W. (1970). "Quaternary
Structure of Proteins". Ann. Rev. Biochem., 39, 25-62.
163.
Langerman, N. R. (1969). "Free Energy of Subunit Interactions:
Hemerythrin". Ph.D. Thesis, Northwestern University, Evanston,
Illinois.
Langerman, N. R. and Klotz, I. M. (1969). '~ree Energy of Subunit
Interactions: Hemerythrin". Biochemistry, !!,,, 4746-4752.
Langerman, N. and Sturetevent, J.M. (1971). "Calorimetric Studies
of Quaternary Structure and Ligand-Binding Hemerythrin".
Biochemistry, 10, 2809-2185. /
Laurent, T. C. and Killander, J. (1964). "A Theory of Gel Filtration
and its Experimental Verification". J. Chroma tog •. , 14, 317-330.
Leach, A. A. and 0 1 Shea, P. C. (1965). "The Determination of Protein
Molecular Weights of up to 225,000 by Gel Filtration on a Single
Column of Sephadex G-200 at 25° and 40°". J. Chromatog, ; g, 245-251.
Longsworth, L. G. (1943). "A Differential Moving Boundary Method for
Transference Numbers". J. Anter. Chem. Soc.,~ 1755-1765.
Longsworth, L. G., and Macinnes, D. A. (1942). "An Electrophoretic (
Study of Mixtures of Ovalbumin and Yeast Nuclic Acid". J. Gen.
Physiol., 25, 507-516.
Madsen, N. B. (1956). "The Interaction of Muscle Phosphorylase with
p-Chloromercuribenzoate. II. A Study of Light Acattering". J.
Biol. Chem., 223, 1067-1074.
Madsen, N. B. and Cori, C. -F. (1956). "The Interaction of Muscle
Phosphorylase with p-Chloromercuribenzoate. I. Inhibition of
Activity and Effect on the Molecular Weight". J. Biol. Chem.,
223, 1055-1065.
164.
Manwell, C. (1963). "Gene tic Control of Hemerythrin Specificity in
a Marine Worm". Science, 139, 755-758.
Millar, D. B., Frattalli, V. and Willick, G. E. (1969). "The
Quaternary Structure of Lactate Dehydrogenase. I. The Sub-
unit Molecular Weight and Reversible Association at Acid pH".
Biochemistry, ~' 2416-2421.
Monad, J ., Wyman, J ., and Changeux, J. P. (1965). "On the Nature of
Allosteric Transitions: A Plausible Model". J. Mol. Biol., g,
88-ll8.
Morris, C. J. 0. R. and Morris, P. (1963). In "Separation Methods in
Biochemistry". Interscience, New York. P. 61.
Nichol, L. W. and Ogston, A. G. (1965). "An Examination of the
Johnston-Ogston Equation and the Moving Boundary Equation".
J. Phys. Chem., 69, 1754-1756~
Nichol, L. W., Ogston, A.G. and Winzor, D. J, (1967). '~eaction
Boundaries and Elution Profiles in Column Chromatography".
J. Phys. Chem., z.!:.., 726-730.
(:
Penniston, J. T. (1971). "High Hydrostatic Pressure and Enzymic
Activity: Inhibition of Multimeric Enzymes by Dissociation".
Arch. Biochem. Biophys., 142, 322-332.
165.
Porath, J. (1963). "Some Recently Developed Fractionation Procedures
and their Application to Peptide and Protein Hormones". J. Appl.
Chem. 2 ~' 233-244.
Prosser, c. L. and Brown, F. A. (1961). "Comparative Animal Physiology".
Saunders and Co., Philadelphia, Pennsylvania. P. 386:
Rao, A. L. (1969). "Hemerythrin Dissociation-Association Studies by
Sephadex Chromatography". M. S. Thesis, Loyola University, Chicago,
Illinois.
Rao, A. L. and Keresztes-Nagy, S. (1968). Abstracts of American Chemical
Society, 156th National Meeting, Atalanic City, New Jersey.
Rao, A. L. and Keresztes-Nagy, S. (1971). Unpublished re&ults.
Riggs, A. F. (1952). "Sulfhydryl Groups and the Interaction between
the Hemes in Hemoglobin". J. of Gen. Physiol., 36, 1-16.
Riggs, A. F. (1959). ''Molecular Adaptation in Hemoglobins: Nature
of Bohr Effects". Nature, 183, 1037-1038.
Scarano, E., Guraci, G., and Rosse, M. (1967). "Deoxycytidylate
Aminohydrolase. JV. Stoichiometry of Binding of Isosteric
and Allosteric Effectors". Biochemistry, .§., 3645-3650.
166.
Scatchard, G. (1949). '~he Attraction of Proteins for Small Molecules
and Ions". Ann. N. Y. Acad. Sci., i!_, 660-672.
Schachman, H. K. and Edelstein, S. J. (1966). "Ultracentrifuge Studies
with Absorption Optics. IV. Molecular Weight Determinations at
the Microgram Level". Biochemistry, 1, 2681-2705.
Schales, o., and Schales, S. S. (1941). "A Simple and Accurate Method
for the Determination of Chloride in Biological Fluids". J. Biol.
Chem., 140, 879-884.
Schmidt, C. L. A. (1938). "Chemistry of the Amino Acids and Proteins".
C. C. Thomas, Baltimore, Maryland, P. 539.
Siegel, L. M. and Monty, K. J. (1965). "Determination of Molecular
Weights and Frictional Ratios of Macromolecules in Impure Systems:
Aggregation of Urease". Biochem. Biophys. Res. Connnon., .!2.,
494-499.
Squire, P. G., Mosler, P. and Okonski, C. T. (1968). "The Hydrodynamic
Properties of Bovine Serum Albumin Monomer and Dimer". Biochemistry,
z., 4261-4272.
167.
Squire, P. G. (1964). "A Relationship between the Molecular Weight
of Macromolecules and their Elution Volumes Based on a Model for
Sephadex Gel". Arch. Biochem. Biophys., 107, 471-478.
Stengle, T. R. and Baldenschwieler, J. D. (1966). "Halide ions as
Chemical Probes for N.M.R. (Nuclear Reagnetic Resonance) Studies
of Proteins". Proc. N.A.S., U.S. SS, 1020-102S.
Takenaka, Y. and Schwert, T. (19S6). ''Lactic Dehydrogenase. II.
Mechanism of Reaction". J. Biol. Chem., 223, 1S7-l 70.
/
Tan, K. H., and Keresztes-Nagy, S. (1971). Private Corrnnunication of
Unpublished Results.
Tonomura, Y., Sekiya, K. and Imamura, K. (1962). "The Optical Rotatory
Dispersion of Myosin A. I. Effect of Inorganic Salt". J. Biol.
Chem., 237, 3110-311S.
Weast, R. C., Editor. (1968). In "Handbook of Chemistry and Physics".
Chemical Rubber Co., Cleveland, Ohio. P. FlS2-FlS3., 49th Edition.
Whitaker, D. J. (1963). "Determination of Molecular Weights of Proteins
by Gel Filtration on Sephadex". Anal. Chem., 3S, 19S0-19S3.
Winzer, D. J. (1969). In "Physical Principles and Techniques of
Protein Chemistry". (S. Leach, ed.). Part A, P. 4Sl-49S, Academic
Press, New York.
I i i r i I I I
•
I
168.
Winzor, D. J., Coke, J.P. and Nichol, L. W. (1967). '~uantitative
Studies of Rapid Polymerization Equilibria by Gel Filtration.
The Z-average Elution Volume of a Reaction Boundary". J. Phys.
Chem., 2.!,, 4492-4498.
Winzor, D. J. and Scherage, H. A. (1963). "Studies of Chemically
Reacting Systems on Sephadex. I. Chromatographic Demonstration
of the Gilbert Theory". Biochemistry, ~' 1263-1267.
Wood, G. C. and Cooper, P. F. (1970). "The ApplicationofGel
Filtration to the Study of Protein-Binding of Small Molecules".
Chromatog. Rev., 12, 88-107.
·: ~ I~ . . .. L..111
169.
APPENDIX - I
A General Review of Gel-Chromatographic Concepts.
The various mathematical equations which have been utilized to
convert the experimental parameters (V, a etc.) into useful quantities
(K, % dissociation)are compiled in this Appendix. Therefore, only some
of the aspects (pertinent to this investigation) of chromatographic
theory will be presented here. More detailed reviews of gel chroma
tography may be found elsewhere (Determann, 1969; Winzor, 1969; Ackers,
1970; Cann, 1970).
Among the connnercially available molecular-sieve media, Sephadex
beads (dextran gels, cross linked with epichlorohydrin) are most ex
tensively used in coiumn chromatography. Separation of substances on
Sepha~ex colunms is dependent on the extent of penetration into the gel
pores (whose size can be selected from a wide variety of cross-linked
Sephadexes). It is this penetrating ability which determines the
migration of a solute on gel-chromatographic columns. The fundamental
parameter, distribution coefficient, KD' describes the penetration
(equilibration) by the equation:
~ = Q/Sc'
where Q is the amount of solute within the gel per unit column length,
B is the gel's internal volume per unit colunm length; and c is the con
centration of solute within the void volume. We will use the nomencla
ture of Ackers and Thompson (1965) to denote K0 , with o, the molecular
sieve coefficient.
170.
Since the sieve coefficient (a) depends on the porosity of the
gel and the size of the solute, its value can only vary from zero to
unity. A very large solute with no penetration (a = o) is excluded at
a volume which is equal to the solvent space outside of the gel beads
(V ). On the other hand, a very small solute penetrates completely 0
into the gel's interior space and is therefore excluded at a volume
(Vt) which comprises both the inside (Vi) and outside (V0
) of the gel
phase. The value of a is, accordingly, equal to unity. A solute with
intermediate penetration will be eluted from the column in a volume
V = V + a Vi where a can have a value between zero and unity. e o
Zonal and Frontal Chromatographic Analysis:
The essential difference in the two types of procedures is the
volume of sample (ideal solute) solution applied to the column. In the
frontal analysis procedure, a large volume of the sample is added to
the column such that the spaces exterior to the gel media are completely
replaced with the sample solution. The elution profile, accordingly,
will contain a plateau region where the concentration of the sample is
identical to that of the applied sample (C ). The advancing boundary 0
of the elution profile depicts the ~oncentration increase from zero to
C , whereas the descending counterpart shows the decrease in concentration 0
from C to zero. The elution volume of the sample may be obtained from 0
the volume at the centroid position (the equivalent boundary position)
(Longsworth, 1943; Nichol and Ogston, 1965).
171.
In the zonal procedure, the smalr volume of the sample (ideal
solute) migrates through the column to assume a Gaussian distribution
curve. The elution volume of the sample corresponds to the volume at
which the concentration of the sample is maximum in the elution profile.
Theoretically, this position should agree with the elution volume
obtained in a frontal experiment. In spite of the wide use of the
zonal procedure, the frontal-elution method is recommended for fraction
ation and purification work. The latter procedure is recommended
especially for studies on protein interactions, because of the absence
of dilution effects. Furthermore, the type of protein interactions can
be analyzed on the basis of existing theory (Gilbert, G. A., 1955) for
the rate of equilibration and stoichiometry.
Equilibrium Nature of Gel Filtration Data:
There is still no unified theory of gel chromatography available,
but most authors (Porath, 1963; Squire, 1964; Laurent and Killander,
1964) agree that it is an equilibrium procedure. Gilbert (1966) has
illustrated the steady-state nature of the quantity, elution volume,
which is obtained in a frontal-elution-chromatography method. Further,
he has indicated that equilibrium d~ta may be derived from elution volume
from the following considerations: The amount of the solute retained in
the column (at any instant) is given by multiplying the elution volume,
Vi, by the concentration of the solute in the inflow of the column, Wi,
under steady-state conditions. Kinetic factors such as re-equilibration
(Andrews, 1964) within the colunn (caused by occlusio~ of the reaction
172.
mixture by the gel phase)and the rates of diffusion of the various
species in the reaction mixture to and from or within the gel phase
(Ackers, 1964), cannot alter the steady state value Vix Wi. If the
solution entering the column is already in internal equilibrium, its
rate, of the restoration or disturbance in the colunm, can only affect
the elution (concentration) profile (Longsworth and Macinnes, 1942) and
not the value of Vi (Longsworth, 1943). Therefore, Gilbert (1966)
concluded that equilibrium constants can be calculated from elution
volume, Vi, without any kinetic effects. Recent reviewers (Kellett,
1967; Winzer, 1969; Ackers, 1970) of chromatography theories consider
this conclusion to be generally valid. Furthermore, the close agreement
between theoretical calculations and experimentally derived equilibrium
constants from elution volumes illustrates (Hammes and Schinnnel, 1965;
Ackers and Thompson, 1965) the validity of Gilbert's (1966) conclusion.
Therefore, we have used the steady-state parameter, elution volume, in
the calculation of the equilibrium constant for hemerythrin dissociation.
Evaluation of Elution Volume:
As mentioned earlier, frontal analysis is more useful in quantita-
tive studies, since the observed elution volume corresponds to the
applied sample concentration. In a frontal elution experiment, the
'elution' volume can be derived from the first moment of the boundary V,
more commonly known as the centroid position (Longsworth, 1943). In
ideal systems, this position corresponds to C /z, where C is the plateau 0 0
173.
concentration. In systems ·such as heme~thrin, which consist of
association-dissociation equilibria, the elution volume position is
obtained from the relation (Winzor, 1969),
Column Calibration:
1 v = c
0
c Jo 0
1 v de ~ c L v~c.
0
The eiperimental parameter, elution volume, of a solute is
directly related to its molecular-sieve coefficient (partition co-
efficient) by the equation a = V - Vo It is this coefficient vi
which is useful in the calibration of columns on the basis of molecular
size or weight.
Many models (Porath, 1963; Squire, 1964; Laurent and Killander,
1964; Ackers, 1964; Albertsson, 1960; Cassasa, 1967; Giddings et.al.,
1968; Ackers, 1967) have been proposed to visualize the penetrable
spaces within the gel matrix, among which only the statistical model of
Ackers (1967) includes a variety of different geometrical shapes for the
gel pores. According to this model, the total volume of gel-matrix
spa.ce which can be occupied by the tµolecular species of radius 'a' is
then expressed by the following relation:
a = erfc a - a
b 0
= 1 - 2/ 2 -a e da.
174.
where a is the position of the maximum value of the Gaussian distrio
bution, b0
is a measure of standard deviation and a is the sieve
coefficient (Ackers, 1970). The symbol 'erfc' represents the error-
function complement.
A linear form of the above equation predicts the molecular radius,
-1 a, to be related to the inverse-error-function complement (erfc ) of the
-1 sieve coefficient, a, by the relationship a= a + b (erfc a). 0 0
Such coorelation has been observed for a variety of gels and
molecular species in which the column calibration constants, a and b , 0 0
were obtained from the ordinate intercept and slope of the plot of 'a'
-1 versus erfc a.
Similarly, one can also relate the sieve coefficient (a) with M,
the molecular weight of the solute. However, the non-linear correlation
between these two quantities can only be made linear over a certain
range of molecular weights (and sieve coefficients). A number of
workers (Andrews, 1964, 1965; Whitaker, 1963; Leach and O'Shea, 1965)
employed the logarithm of molecular weight, M, for such empirical
straightening-out procedure by using an equation,
a = -A log M + B ,
where A and B are empirical column-c~libration constants and M the
molecular weight of the solute species. For any gel medium, this linear
realtionship can only hold over a certain portion of the calibration
plot between a and log (M).
175.
Equilibrium of Monomer with a Higher Polymeric Species:
In frontal gel chromatography, the elution profile varies
according to the type of equilibrium between the monomer and the polymer.
This effect can be visualized by the consideration of the rate of re
equilibration relative to that of separation of the species. The
relative concentrations of the interacting components are obtained
fairly easily from the elution profiles of slowly equilibrating systems.
Identification of the two distinct boundaries in the advancing and
descending elution profiles with the individual components is correct
in systems where the rate of separation on the column is faster than
the re-equilibration of the components. However, such identification
cannot be made in systems with intermediate and rapid rates of re
equilibration.
The median bisector (Nichol and Ogston, 1965) of the leading and
trailing elution boundaries may be used in the evaluation of the elution
volume (and thus, the sieve coefficient) of a polymerizing system with
an equilibrium rate almost identical to the rate of separation on the
column.
Ackers and Thompson (1965) have shown that a sharp leading bound
ary, and a diffuse trailing boundary, will be obtained in the elution
profile of a frontal type experiment, if the displacement by the trans
port process is slow in comparison with the rate of attainment of
equilibrium between the molecular species. Such elution behavior had
been predicted by earlier workers (Winzor and Scherag~, 1963; Ackers,
176.
1964). Ackers and Thompson (1965) have further shown that by neglecting
the normal boundary dispersion of a single solute, the sieve coefficients
of the individual species can be obtained from the boundary character-
istics, since the centroid elution volumes depend only on the plateau
concentrations and equilibrium constant.
In a multicomponent system, the equilibrium partition coefficient
for total solute is a weight average of the partition coefficients of
the individua} components (Ackers and Thompson, 1965). Accordingly the
weight average partition coefficient
where C, is the concentration of species j and 7f is the corresponding j
partition coefficient.
If interactions are present between species the equilibria(um)
will be shifted by a change in the total solute concentration and ow
will exhibit a concentration dependence. Ackers (1970) has deduced the
relationship between a and centroid volume (V) of a frontal chroma-. w
tographic experiment as follows:
a = (V - Vo) I Vi w
where V0 and Vi are the void and internal volume of .the gel pahse
respectively.
( \ 177.
The monomeric sieve coefficient designated as crm can be derived
from frontal-elution experiments by employing an extrapolation pro-
cedure, in which the values of ~w are plotted against the concentrations
at which they were obtained. crm, the monomeric sieve coefficient, is
derived by extrapolating this curve to zero protein concentration.
Ackers and Steere (1967) have demonstrated that the relation,
may be used to obtain the polymeric sieve coefficient crn, if
number of monomers are known.
I• I
l. ' the
The stoichiometry of the dissociation process of the polymer can
then be evaluated by the use of the individual sieve coefficients, crm and
crn· In addition, one needs to know the position of the minimum of the
gradient curve of the elution profile. This is obtained by plotting
small concentration differences, 6C, across the elution profile against
the corresponding values of 6V. Ackers and Thompson (1965) have used
Gilbert's postulates (1955), originally derived for ultracentrifugal
analysis, for the calculation of 'n', the stoichiometry of dissociation.
Depending on the type of monomer ~ polymer system, the elution
behavior of nA1~ An can be predicted, if intermediate association
forms are assumed to be unstable. If n = 2, the gradient across the
trailing boundary will have a single maximum that is skewed in the
direction of increasing volume. If, however, n is greater than 2, the
gradient will exhibit two maxima and a single minimum. This minimum
178.
position is defined by the equation:
V'min =Vo+ r2 n-1 t 3(n-l) <Ym + .....,,....,.....n_-,,,...2.,.__ <Ypl vl.. + s
3(n-l) j where Sis the sample applied on·the column. For a given column V'min
is independent of both the equilibrium constant and plateau concentration
C0
, and depends only on the stoichiometry, n, of the reaction. The
degree of polymerization can be completed directly from the coefficients
of the individual species and of the minimum by this equation for 'n'.
If v'min is defined as (V'min - V0 -S)/ Vi, then
n = 3 v'min - crm - 2 <Yp /
3 v'min - 2 cr~ - crp
The practical upper limit lies in the region n z 10, as is also the case
for the sedimentation velocity method.
Ackers (1964) has indicated that the centroid position of the
hyper sharp leading boundary (of a rapid interacting system) can be
related to the monomeric and octameric sieve coefficients as follows:
Where a is the weight fraction of monomeric species in the plateau
region. This quantity is given by a= ( crw - <Yp) I ( <Ym - crp ).
From the known values of a and 'n', the dissociation constant K for
the NA1~Au equilibrium by the equation
an (Co)n-1 K = -------
1 - a
where C0
is the solute concentration in the plateau region of the elution
diagram.
Similarly, 'K' can be derived from the trailing boundary:
K = n (C )n-1
min
A + (1 + ~ )n-1 n
179.
where Cmin is the concentration at the minimum position in the gradient
curve and
A = <J
m v' min
v' a min p /
In the case of hemerythrin dissociation, we already know that the number
of subunits are 8; therefore, all the above equations could be used for
the calculation of the dissociation constant, K.
If the value of 'K' were to be expressed in moles/liter of
monomeric llllits, the equation for 'K' should include a new term, M , the m
monomeric molecular weight (13,500). Hence, we divided the values of K
obtained from the above equations with the quantity, (Mm)n-l, to express
in units of moles/liter of monomer.
\
() 180.
APPENDIX II
Calculation of the Centroid Volume from a Frontal Elution Diagram:
We have used Longsworth's (1943) procedure for this calculation.
The procedure consists of dividing the first difference (gradient) curve
by a number of ordinates, e.g. five, at equal intervals between the base
line and the maximum, as shown in the following figure on the other
scale; the abscissas , V' . , and V". , of the ends of each ordinate, J. J.
together with the corresponding abscissa, V'i , of the edge of the .e
pattern, are then determined. The abscissa, Vi' of the midpoint ordinate
is thus V'i + V"i 2
If the distances Vi - vi.e are the same for each
ordinate, the gradients in the boundary are symmetrical about the ordinate
through the maximum. If the distances to the centers of the ordinates
are not equal, the boundary is 'skew'. If the skewness is not too
great, the following relation can be used to obtain V, the centroid, or
the first moment of the curve:
v =
th where ~Vi is the length of the i ordinate, V' 1i - V'i.
The curve in Fig. 37 is used to show the mathematical calculations used
in obtaining the elution volume from the first difference plots.
5.0 252 V(ml)
50.0
A representative first difference curve of the
leading boundary obtained in a frontal elution
experiment.
Caluculations are shown in Appendix II.
181.
(' 182.
Similarly, 'K' can be derived from the trailing boundary:
K =
where C . is the concentration at the minimum position in the gradient min
curve and
0: - VI m min I
v min - O"p /
In the case of hemerythrin dissociation, we already know that the
number of subunits are 8; therefore, all the above equations could be
used for the calculation of the dissociation constant, K.
If the value of'K' were to be expressed in moles/liter of
monomeric units, the equation for 'K' should include a new term, Mui'
the monomeric molecular weight(l3,SOO). Hence, we divided the values
of K obtained from the above equations with the quantity, (Mxu)n-l, to
express in units of moles/liter of monomer.
\
183.
TABLE xxvr
Various terms for the. calculation of the centroid volume
21.0
21.5
22.0
i 23.01
v "(ml) i
31.0
28.5
27 .o
26.0
!::.Vi• (V 11-V ")
i i
10.0
7.0
s.o
3.0
r.1::.v = i
25.0
v -r.t::.vi (ii - vi.e)
r.t::.V ~
- 1Ql 25
since v~ - 5.0 ml ..... e
V • 25.20 ml.
Vi
V"+V" i i
2
52/2 - 26.0
50/2 = 25.0
49/2 - 24.5
49/2 - 24.5
• 20.20 ml + vi
21.0 210.0
20.0 140.0
19.5 97 .5
19.5 58~5
r.t::.~i (Vi - vi.e)
,• 505.0
.e
. 184.
APPENDIX III
I
Conversion of q into its Inverse-Error-Function Complement (erfc-1).
For this purpose, we have used the Table of Error Function and
its Derivative, published as Applied ~athematic Series, No. 41 by the
National Bureau of Standards, U.S. Department of Cotmnerce.
The linear relation, a = a0 + b0 erfc-1 a, is predicted from
the correlation of cr, the sieve coefficient and the molecular radius
'a', which can be expressed as:
Therefore,
If a-a
0 is bo
cal tables. The
value of ~ ( 1T
cr .= erfc
1 - a = 2 7'
bo
J denoted by the term
value of 'x' is read
e-a 2 da.
0
x, one can
2 e-a da.
da •.
then use the mathemati-
off directly from the corresponding
It can be seen that x = erf~-1 a from the calibration equation.·
This procedure can be understood from the following example:
2 e-a da The corresponding value
of x from the Tables is·
0.016 0.984 :::: 1. 703
l.703 is the value of erfc-1 cr, where a= 0.016.
185.
APPENDIX IV
Calculation of % Dissociation from the Weight-Average Molecular Weight.
The following relation is used for this purpose:
Mw = '
where Cp + Cm = plateau protein concentration (g/l), and Mm and Mp are_ ·
monomeric and octameric molecular weights (13,500 and 107,000 respectively
for hemerythrin}. Example: M"w, obtained from extrapolation of crw (the
weight-average sieve coefficient) in the calibration graph, is 74,130 ±
1,500. (Concentration of protein = 480_± 5 µg/ml)
\ I
73,130 = cp x 107,000 +cm x 13,500
Cm+ Cp
= 3 .64 cm • c = ' m ____ 4_,s..,.o_ = 132
3.64
Percent dissociation =
= 132 480
x 100
x 100 = 27.4%.
186.
APPENDIX V
Calculation of the Dissociation Constant from the Weight-Average Sieve
Coefficient.
The equation for K can be represented as:
(o:)n x (Co)n-1 K =
(1-o:) x (Mm)n-l
,,
where a is crw - crp n = 8 and Min= 13,500. ' om - crp
Example: <Yw = 0.148; crm = 0.587 and crp = 0.025; C0 = 0.125 g/l.
a = 0.221
K = (0.221)8 x (0.125) 7
(1-0.221) x (13,500)7
= 2.13 x lo-41 moles/liter in monomeric units.
187.
APPENDIX VI
Changes in Dissociation Constant by Introduction of Errors in Elution
Volume and Concentration Terms.
Concentration gm/l
0.034
0.034
0.067
0.065 (5% error)
0.067
0.065 (5%_ error)
0.067
0.060 (15% error)
v K ml moles/l of monomer
lS.9
lS.S (0. 5% error)
17.62
17.62
17.62
17.42 (1% error)
17.62
17.62
7.5 x lo-41
6.6 x lo-41
l.S x lo-39
1.4 x lo-39
1.8 x lo-39
1.0 x 10-39
1.S x 10-39
2.6 x lo-40 •
\ i
Remarks
Neglegible change in
K's by introducing
error equal to mean
deviation in V .
Neglegible change in
K's by introducing 5%
error in the measurement of protein concentration.
Twofold change in K' s by introducing 5% error
in dilution plus 1%
error in measurement of
elution volume.
Fifteen fold change in
K's by introducing 15%
error in the measure-
ment of protein con
centration.
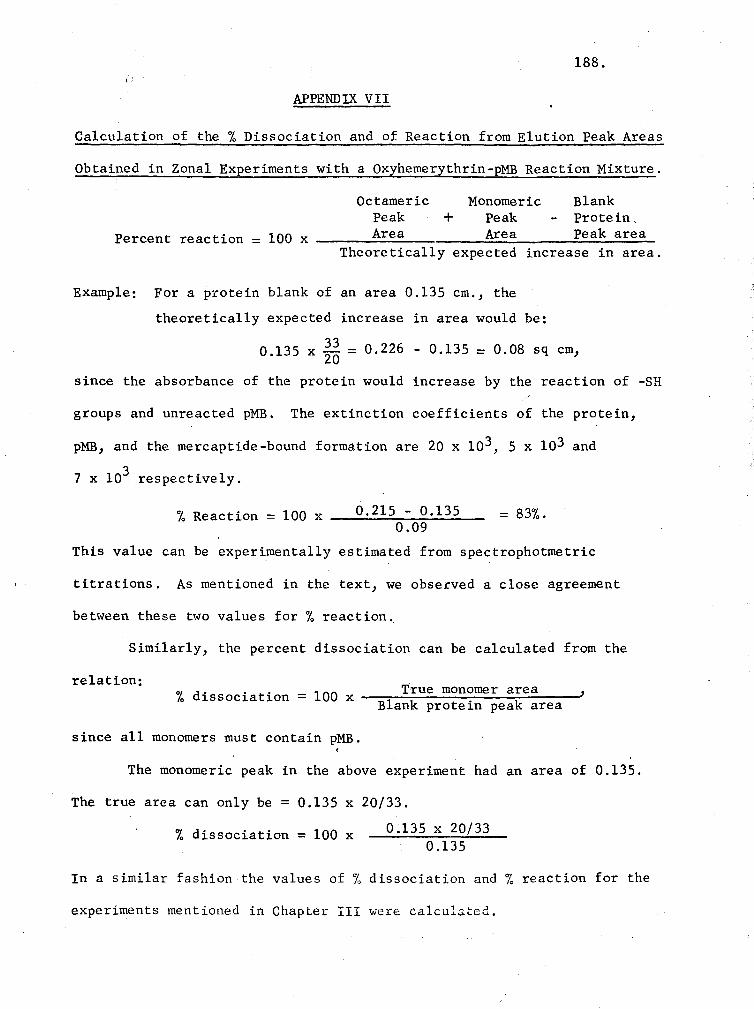
188. (1
APPENDIX VII
Calculation of the % Dissociation and of Reaction from Elution Peak Areas
Obtained in Zonal Experiments with a Oxyhemerythrin-pMB Reaction Mixture.
Octameric Peak +
Monomeric Peak
Blank Protein,
loo Area Area Peak area Percent reaction = x ~~~~~~~~-~~~~~~~~~~~~~~ Theoretically expected increase in area.
Example: For a protein blank of an area 0.135 cm., the
theoretically expected increase in area would be:
33 0.135 x 20
= 0.226 - 0.135 = 0.08 sq cm,
since the absorbance of the protein would increase by the reaction of -SH
groups and unreacted pMB. The extinction coefficients of the protein,
pMB, and the mercaptide-bound formation are 20 x 103, 5 x 10³ and
7 x 10³ respectively.
% Reaction = 100 x 0.215 - 0.135 = 83%. 0.09
This value can be experimentally estimated from spectrophotmetric
titrations. As mentioned in the text, we observed a close agreement
between these two values for% reaction.
Similarly, the percent dissociation can be calculated from the
relation: true monomer area % dissociation = 100 x ~--.,.~~~~~~~~~~~~~'
Blank protein peak area
since all monomers must contain pMB.
The monomeric peak in the above experiment had an area of 0.135.
The true area can only be = 0.135 x 20/33.
% dissociation = 100 x 0.135 x 20/33 0.135
In a similar fashion the values of % dissociation and % reaction for the
experiments mentioned in Chapter III were calculated.
('
APPROVAL SHEET
The dissertation submitted by Ayyagari Laxminarasimha Rao
has been read and approved by a committee from the faculty of the
Graduate School.
The final copies have been examined by the director of the
dissertation and the signature which appears below verifies the
fact that any necessary changes have been incorporated, and that
the dissertation is now given final approval with reference to
content, form and mechanical accuracy.
The dissertation is therefore accepted in partial fulfillment
of the requirements for the Degree of Doctor of Philosophy.