Embed Size (px)
Citation preview

Analytical Chemistry: An Indian Journal
Research | Vol16 Iss 13
Citation: Yogita B Wani (2016) A Stability Indicating RP-HPLC Method for Simultaneous Determination of Ibuprofen and Famotidine, Analytical
Chemistry: An Indian Journal, Vol: 16. © 2016 Trade Science Inc
1
A Stability Indicating RP-HPLC Method for Simultaneous Determination of
Ibuprofen and Famotidine
Yogita B Wani* and Dipak D Patil
R. C. Patel Institute of Pharmaceutical Education and Research, Karwand Naka, Shirpur, India
*Corresponding author: Yogita B. Wani, Department of Pharmaceutical Chemistry, R. C. Patel Institute of Pharmaceutical
Education and Research, Karwand Naka, Shirpur District: Dhule (Maharashtra State), India,
425405, Tel: +91-8888916533; E-mail: [email protected], [email protected]
Introduction
Ibuprofen (IBU) and famotidine (FAM) are co-formulated in oral tablet dosage form indicated for the relief of signs and
symptoms of rheumatoid arthritis, osteoarthritis and to decrease the risk of developing upper gastro-intestinal ulcer [1,2] IBU
and FAM are chemically incompatible. Therefore, the tablet in tablet dosage form of IBU and FAM was formulated by
Horizon Pharma, USA which improves the stability of IBU and FAM under forced degradation condition [1].
Abstract
A stability indicating gradient RP-HPLC method is developed for simultaneous determination of ibuprofen and famotidine.
Separation of degradants, ibuprofen and famotidine was carried out on Qualisil BDS C8 column (250 × 4.6 mm, 5 µm) using a
mobile phase gradient consisting of methanol and water pH 3.0 at a flow rate of 1 mL/min. The detection and reference wavelengths
were set at 263 nm (4 nm bandwidth) and 360 nm (80 nm bandwidth), respectively. Intentional degradation of ibuprofen and
famotidine was attempted at stress condition of hydrolytic (refluxed at 80ºC for 1 h), acid (5M HCl, refluxed at 80ºC for 1 h), base
(5M NaOH, refluxed at 80ºC for 1 h), oxidation (15% H2O2, for 6 h at 30 ºC) and sunlight (exposed for 4 h). Degradants were eluted
up to ~ 26 min whereas famotidine and ibuprofen shows retention at 6.34 ± 1.53 and 21.76 ± 0.38 min respectively. Drug-drug
interaction study was also performed. The proposed method was able to separate the formed sulfamide impurity which is a major
degradation product of famotidine - ibuprofen combination mixture when kept at accelerated condition (40ºC ± 75% RH for 30
days). The method obeys Beer’s law in the concentration range of 3-21 µg/mL for ibuprofen (r2=0.9998) and 0.1-0.7 µg/mL for
famotidine (r2=0.9999). The assay result of synthetic mixture was found to be 99.13 ± 0.14 and 100.73 ± 0.57 for ibuprofen and
famotidine, respectively. The proposed method was validated as per ICH Q2 (R1) analytical method validation guidelines. The
percentage recovery was found to be 96.55 ± 1.83 and 102.83 ± 0.85 for ibuprofen and famotidine, respectively. The results of
present study clearly shown that the proposed method was specific as ibuprofen and famotidine were estimated in presence of their
acidic, alkaline, oxidative, hydrolytic and photolytic degradation products and it may be effectively applied for estimating the
content of ibuprofen and famotidine in pharmaceutical formulation.
Keywords: Cromolyn sodium; HPLC; Cromolyn sodium alkaline degradate

www.tsijournals.com | June-2016
2
IBU (Figure 1) chemically known as (RS)-2-(4-(2-methylpropyl) phenyl) propionic acid is phenyl propionic acid derivative/
cyclooxygenase inhibitor from the class of non-steroidal anti-inflammatory drugs used in the treatment of fever, arthritis as
an analgesic [2].
Figure 1: Structure of Cromolyn Sodium. Figure 2: Structure of FAM.
Numerous studies have been carried out on FAM. Indian Pharmacopoeia [3], British Pharmacopoeia [4],
European Pharmacopoeia [5] and United States Pharmacopoeia [6] described a titrimetric method for estimating
the content of FAM in bulk form and liquid chromatographic method for the assays of tablet, injection and oral
suspension formulations of FAM. Use of spectrophotometric [24-27] spectrofluorimetric [28], HPLC [29-32],
flow injection analysis [33], HPTLC methods [34,35] for estimating the content of FAM in single component
formulation has been reported in the literature. Estimation of FAM in multicomponent formulation using
spectrophotometric [36,37], HPLC [38,39], flow injection analysis [39] and HPTLC methods [21,40] has been
reported in the literature.
To the best of our knowledge, a number of liquid chromatographic methods have been reported for the assay of
IBU and FAM. Shah et al. [41], Karthik Kumar et al. [42], Krishnaveni and Sathyanarayana [43] and Patel et al.
[44] described HPLC method for estimating the IBU and FAM but they didn’t perform the stability and/or drug-
drug interaction study [41-44]. Sekhar et al. [45] described HPLC method using ion pairing reagent in mobile
phase preparation but they didn’t perform the stability and drug-drug interaction study [45]. Ahirrao and Pawar,
[46] and Reddy et al. [47] described stability indicating HPLC method using buffered mobile phase but they
didn’t perform drug-drug interaction study [46,47]. In all the above methods authors did not performed the drug-
drug interaction study. In few research papers author has performed stability study but they used a buffered or ion
pairing reagent consisting mobile phase. So, the above methods are not economic and time consuming because
columns required more time for cleaning.
Therefore, there is a need to develop buffer free, ion-pairing reagent free, cost effective and less time consuming
method for estimating the content of IBU and FAM. Advantages of our proposed method are as follows.
1. Buffer free mobile phase
2. Economic
3. Quick column washing
4. Stability study and

www.tsijournals.com | June-2016
3
5. Drug –drug interaction study was carried out between IBU and FAM
6. All the degradants, sulfamide an interaction product, IBU and FAM were separated using single proposed
gradient mobile phase.
Present work demonstrates the development, validation and application of a simple, economical, accurate, precise
and selective gradient RP-HPLC method for estimating the content of IBU and FAM in combination.
Experimental
Instrument
Agilent technologies 1200 series HPLC instrument equipped with photo diode array detector, G 1311 A solvent
delivery system (Quaternary pump), Rheodyne injector (20.0 µL), Qualisil BDS C8 column (250 × 4.6mm, 5 µm)
and Ez-Chrom Elite software 3.3.2 was used.
Reagents and chemicals
IBU and FAM were obtained as a gift samples from Centurion Laboratories, Vadodara (Gujarat). Analytical grade
chemicals and double distilled water were used in the experiments.
Chromatographic conditions
The separation and simultaneous determination of IBU, FAM with their degradation products was performed on
Qualisil BDS C8 column (250 × 4.6 mm, 5 µm) using the gradient elution mode. A gradient programme consist of
methanol (Solvent A) and water pH 3.0 adjusted with ortho-phosphoric acid (Solvent B) is given in Table 1. A
mixture of methanol and water pH 3.0 (15:85 v/v) was used as diluent. The mobile phase was pumped at flow rate
of 1mL/min. The detection and reference wavelengths were set at 263 nm (4 nm bandwidth) and 360 nm (80 nm
bandwidth) respectively.
Solvent A Solvent B Time (min)
15 85 0
80 20 20
80 20 26
15 85 26.01
15 85 36
(Re-equilibration)
Preparation of standard solutions
Stock solution of IBU (300 µg/mL) and FAM (10 µg/mL) was prepared in HPLC- grade methanol. The working
standard solution was prepared by dilution of the above stock solution with diluent to achieve the concentration of
solution in the concentration range of 3-21 µg/mL and 0.1-0.7 µg/mL for IBU and FAM respectively. Mixed
working standard solution of 9 µg/mL of IBU + 0.3 µg/mL of FAM was prepared.
Preparation of synthetic mixture solution
Excipients used in the tablet formulation were added in IBU + FAM mixture (30:1, w/w) [1] (Table 2) and
sonicated for 20 minute after the addition of methanol. The final volume was made with methanol. The solution
was filtered through 0.45 µm filter paper. The working solution was prepared by dilution of the above stock
solution with diluent to obtain the concentration of 9 µg/mL of IBU and 0.3 µg/mL of FAM.

www.tsijournals.com | June-2016
4
Material %w/w mg/tab
Famotidine 2.54 26.6
Lactose monohydrate 0.95 10.0
Microcrystalline cellulose 3.3 34.6
Croscarmellose sodium 0.38 4.0
Colloidal silicon dioxide 0.04 0.4
Magnesium stearate 0.11 1.2
Ibuprofen 89.75 800
Purified water - q. s.
Table 2: Tablet formulation components.
Results and Discussion
Structural, physical and chemical properties of active pharmaceutical ingradients are very important factors in optimizing
appropriate chromatographic conditions [48]. According to that, RP-HPLC column was chosen for the analysis.
Significant condition in the present study was separation of IBU and its degradation products, as well as FAM and its
degradation products. IBU contains benzene ring and carboxylic acid group, whereas, FAM contains sulfamide and primary
amino group. The key difference in the structure is polarity and acidity/alkalinity. For the analysis of such a mixture
(compounds with high and low lipophilicity), it required a gradient mobile phase programme (Table 1) starting with low
percent of organic solvent and gradual increasing of organic solvent content so as to achieve an optimal separation and
retention of all the components of the mixture.
Retention behavior of IBU, FAM and their degradation products was studied using Qualisil BDS C8 column (250 × 4.6mm,
5µm) as a stationary phase. It was noticed that the optimal retention of FAM (log P value=-0.64) requires a mobile phase
with low percent of organic solvent, i.e., less than 20%, v/v and its degradation products requires mobile phase with low to
high percent of organic solvent. However, on the other hand, IBU (log P value=3.621) and its degradation products are more
lipophilic substances and they were retained for almost 70 min under the same experimental condition. Because of this,
isocratic elution was found to be time consuming and uneconomical to analyze the IBU and FAM mixture. Hence, efforts
were utillized for optimizing gradient mobile phase elution programme. A number of trials were performed to establish an
optimized gradient elution programme and they are presented in Table 3.
Obs.
No.
Mobile Phase Famotidine (FAM) Ibuprofen (IBU) Comment
www.tsijournals.com | June-2016
5
Rt (min.) Theoretical
plate
Assemetr
y
Rt
(min.)
Theoretical
plate
Assemetry
01. Methanol :
Water(80:20v/v
)
2.24 1705 1.03 6.94 6810 0.90 FAM elutes at void
volume
02. Methanol
:Water(75:25v/
v)
2.20 1335 1.06 9.26 6225 0.86 FAM elutes at void
volume
03. Methanol :
Water(55:45v/v
)
After 8 min
Methanol :
Water(90:10v/v
)
2.23 6836 0.86 8.20 97330 1.05 FAM elutes at void
volume
From above 3 runs it was concluded that FAM elutes at void volume, so we use the buffered mobile phase
04. Methanol : KH2PO4 10mM pH
3.08 (80:20v/v)
2.66 6327 1.26 6.66 6836 0.90 FAM elutes at void
volume
05. Methanol : KH2PO4 10mM pH
3.00(78:22v/v)
2.68 5148 1.21 7.52 6508 0.88 FAM elutes at void
volume
06. Methanol : KH2PO4 pH 3.08
10mM 70:30 v/v
2.76 8537 1.10 13.10 16484 1.06 FAM elutes at void
volume
07. Methanol : KH2PO4 pH 3.08
10mM 65:35 v/v
2.74 8537 1.21 20.54 14699 1.03 FAM elutes at void
volume
From the above 4 runs using Methanol and KH2PO4 pH 3.08 10mM, it was concluded that FAM elutes at void volume and as the buffer
concentration increases retention time of IBU also increases. So we use next buffer KH2PO4 10mM pH 6.80
0
8
.
Methanol : KH2PO4 10mM pH 6.80
(80:20v/v)
2.98 0 0.94 4.3 2554 0.65 FAM elutes at void
volume
0
9
.
Methanol : KH2PO4 10mM pH 6.80
(75:25v/v)
3.05 1188
7
1.13 5.02 13573 1.07 FAM elutes at void
volume
1
0
.
Methanol : KH2PO4 pH 6.8 10mM
70:30 (v/v)
3.06 0 1.07 5.65 11291 1.19 FAM elutes at void
volume
From the above 3 runs using Methanol and KH2PO4 pH 6.80 10mM, it was concluded that FAM elutes at void volume. So we use next
buffer Ammonium Acetate Buffer pH 5.5, 10mM
11. Methanol : Ammonium Acetate
Buffer pH 5.5 10mM 80:20 v/v
2.96 7084 1.28 4.88 11858 1.01 FAM elutes at void
volume

www.tsijournals.com | June-2016
6
12. Methanol : Ammonium Acetate
Buffer pH 5.5 10mM 70:30 v/v
2.98
7483 1.11 7.88 13363
1.11 FAM elutes at void
volume
13. Methanol : Ammonium Acetate
Buffer pH 5.5 10mM 55:45 v/v
Up to 17 min & then
Methanol : Ammonium Acetate
Buffer pH 5.5 10mM 90:10 v/v
3.06 1128
2
1.20 20.14 423031 1.19 FAM elutes at void
volume and IBU did
not elute up to 17 min
so the composition was
changed & then IBU
eluted at 20.14 min.
From the above 3 runs using Methanol and Ammonium Acetate Buffer pH 5.5 10mM, it was concluded that FAM elutes at void
volume and IBU takes longer time to elute when higher buffer concentration used. So we use next buffer mixed phosphate buffer
10mM pH 6.80
14. Methanol : Mixed Phosphate
Buffer pH 6.8 10mM 80:20 v/v
2.92 2038 1.00 3.65 1604 0.75 FAM elutes at void
volume and peak
asymmetry
15. Methanol : Mixed Phosphate
Buffer pH 6.8 10mM 70:30 v/v
2.94 793 1.11 5.83 804 0.58 FAM elutes at void
volume and peak
asymmetry
16. Methanol : Mixed Phosphate
Buffer pH 6.8 10mM 60:40 v/v
3.18 7254 1.47 11.22 15946 1.12 FAM elutes at void
volume
17. Methanol : Mixed Phosphate
Buffer pH 6.8 10mM 50:50 v/v
3.42 10651 1.11 26.58 9074 1.57 Longer retention time
of IBU and tailing
From the above 14,15 and 16 runs using Methanol and mixed phosphate buffer pH 6.80 10mM, it was concluded that FAM
elutes at void volume and in run 17 FAM elutes after the void volume but Rt of IBU is very longer 26.58 min.
Finally, from run no.14 we concluded that FAM required aqueous mobile phase conc. To elute after the void volume whereas
IBU required organic solvent for earlier retention time (Run 14-16). This retention behavior of IBU and FAM might be due to
large difference in log P value -0.64 and 3.621 for FAM and IBU respectively.
From above conclusion we go for optimization of gradient programme using Methanol and KH2PO4 pH 6.80 10mM
18. Gradient programme 5.64 10630 1.09 14.17 91950
1.10 Run time of IBU &
FAM OK but slope of
the gradient is more and
stable baseline was not
obtained.
19. Gradient programme 5.64 10523 1.13 16.34 12031
6
1.10 Run time of IBU &
FAM OK but slope of
the gradient is more and
stable baseline was not
obtained.
20. Gradient programme 5.44 14021 1.11 22.00 15528 1.14 OK

www.tsijournals.com | June-2016
7
Table 3: Mobile phase optimization trials.
For estimating IBU and FAM numerous liquid chromatographic methods were reported. But author has used buffered, ion-
pairing reagent containing mobile phases for the optimization [42, 43, 45-47]. After performing the analysis it required an
extensive column washing. With the continuous use of buffered mobile phases for separation column life is getting reduced
[49]. Therefore, the mobile phase composition was decided to be used without buffer and ion-pairing reagent.
4 No problem at all
Gradient programme given in run 20 is OK, also it obeys all the system suitability parameters. But we thought to develop a buffer free
mobile phase. So we use methanol and water pH 3 adjusted with orthophosphoric acid
21. Gradient programme
(Optimized mobile phase and
gradient programme)
6.527 43539 0.9846
9
22.047 44632
7
1.06765 Optimum mobile phase
because capacity factor
for IBU (7.71) and
FAM (1.52) is more
than 1 and less than 20
(Snyder et al.), peak
symmetry for IBU
(1.06) and FAM (0.98),
resolution (15.42),
gradient slope is also
less, stable baseline,
degradation products
were well resolved, and
IBU-FAM interaction
product was also
separated by using this
mobile phase.
Finally, by considering the
1. system suitability parameters i. e. capacity factor (1<k’<20), resolution (>2), tailing factor (0.9-1.2) and theoretical plates
(>2000)
2. separation of degradation products at acidic, alkaline, oxidative, neutral and thermal degradation from peak of IBU and FAM
3. and separation of drug-drug interaction product of IBU and FAM i.e. sulphamide
the proposed method was found to be optimum.
Column: Qualisil BDS C8 (250 x 4.6 mm, 5um)
Void volume: ~3 mL and dead time ~3 min at 1mL/min flow rate
www.tsijournals.com | June-2016
8
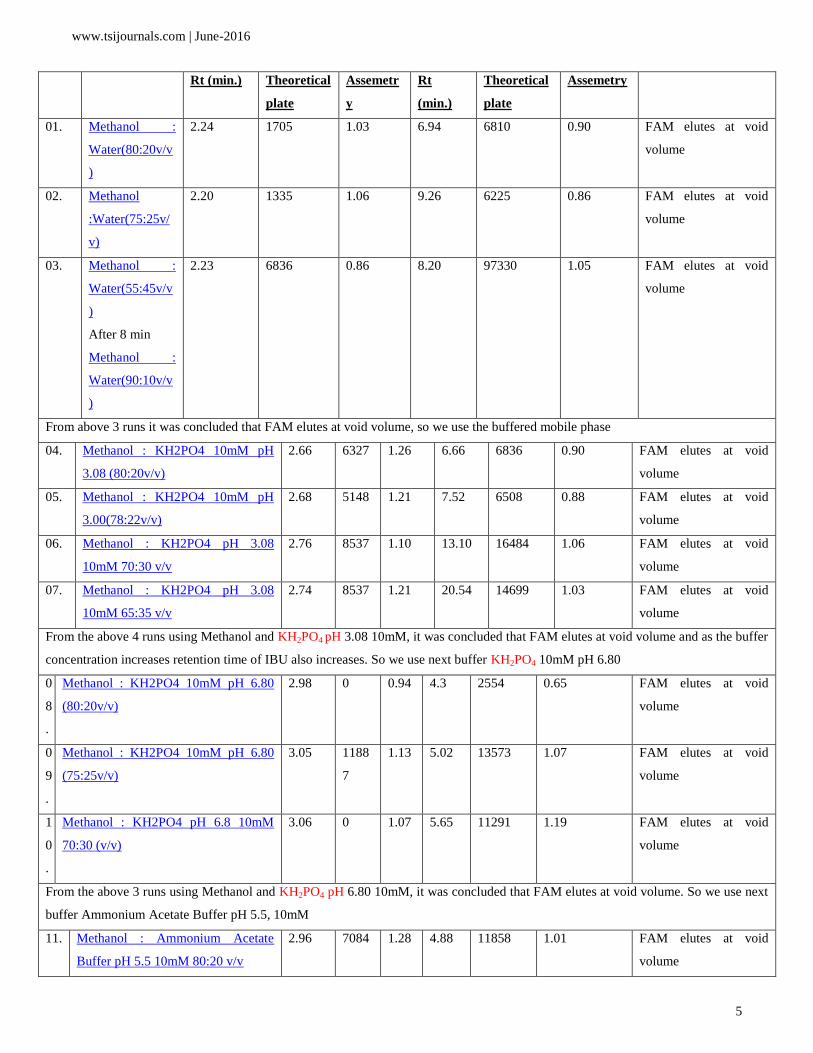
Selection of detection wavelength and band width
From the overlain UV spectra of IBU and FAM of mixed working standard solution, the detection wavelength 263 nm was
selected. The use of narrow band width has the advantage of increasing the signal selectivity of the detector [50]. Therefore, 4
nm band width was selected for analysis.
Selection of reference wavelength and bandwidth
In the gradient analysis, absorbance value of sample was changed as the mobile phase composition varies as well as
refractive index also changes during the gradient. This change in sample absorbance is not because of the sample itself but
because of change in composition of mobile phase. The use of a reference wavelength is highly recommended to reduce
baseline drift induced by refractive index changes during a gradient [51]. A reference wavelength of 360 nm with an 80 nm
bandwidth is fine for a sample that didn’t have a visible absorption band.
The representative chromatogram of IBU and FAM was shown in Figure 3.
Figure 3: Chromatogram of IBU and FAM.
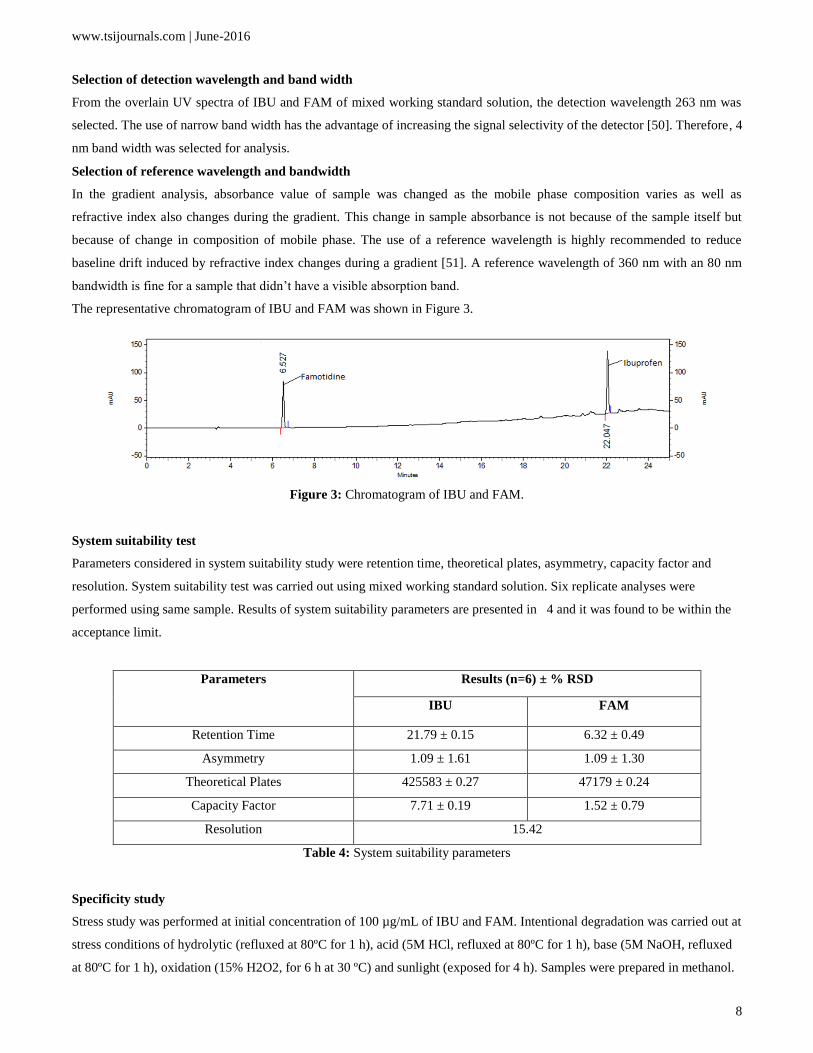
System suitability test
Parameters considered in system suitability study were retention time, theoretical plates, asymmetry, capacity factor and
resolution. System suitability test was carried out using mixed working standard solution. Six replicate analyses were
performed using same sample. Results of system suitability parameters are presented in 4 and it was found to be within the
acceptance limit.
Parameters Results (n=6) ± % RSD
IBU FAM
Retention Time 21.79 ± 0.15 6.32 ± 0.49
Asymmetry 1.09 ± 1.61 1.09 ± 1.30
Theoretical Plates 425583 ± 0.27 47179 ± 0.24
Capacity Factor 7.71 ± 0.19 1.52 ± 0.79
Resolution 15.42
Table 4: System suitability parameters
Specificity study
Stress study was performed at initial concentration of 100 µg/mL of IBU and FAM. Intentional degradation was carried out at
stress conditions of hydrolytic (refluxed at 80ºC for 1 h), acid (5M HCl, refluxed at 80ºC for 1 h), base (5M NaOH, refluxed
at 80ºC for 1 h), oxidation (15% H2O2, for 6 h at 30 ºC) and sunlight (exposed for 4 h). Samples were prepared in methanol.

www.tsijournals.com | June-2016
9
From all forced degradation samples, about 1.0 mL solution was transferred to 10.0 mL volumetric flask and dilution was
made with diluent. These samples were analyzed by HPLC as per the optimized chromatographic conditions. The results of
specificity study are presented in Table 5. The result of specificity study indicated that the proposed HPLC method is able to
separate IBU and FAM in presence of their degradation products obtained in different stress conditions (Figure 4). In case of
IBU, oxidative and photolytic degradation was not observed.
Figure 4: Overlain chromatograms of IBU and FAM in different stress conditions.
Condition % Drug remaining (n=3)
IBU FAM
5M HCl 42.08 31.12
5N NaOH 90.55 10.85
15% H2O2 98.04 75.41
Sunlight 92.91 76.71
Water 56.51 71.76
Table 5: Results of specificity study.

www.tsijournals.com | June-2016
10
Linearity study for IBU and FAM
Different concentrations of working standard solution in the concentration range of 3-21 µg/mL for IBU and 0.1-0.7 µg/mL
for FAM were prepared. Samples were injected for HPLC analysis and analyzed as per the optimized chromatographic
conditions. All the measurements were repeated three times for each concentration. A calibration graph of the drug
concentration versus peak area was constructed. A linear relationship was found in the concentration range of 3 - 21 μg/mL
for IBU (r2=0.9998) and 0.1-0.7 μg/mL for FAM (r2=0.9999).
Analysis of synthetic mixture
The working sample solution of synthetic mixture was used for the HPLC analysis. Sample was analyzed as per optimized
chromatographic conditions. Concentration and percentage drug content was determined using the following formulae.
Cu=(Au×Cs)/As
Where,
Cu: Concentration of sample solution (µg/mL)
Cs: Concentration of standard solution (µg/mL)
Au: Peak area of sample solution
As: Peak area of standard solution (24000 for FAM of concentration 0.3 µg/mL) and (38701 for IBU of concentration 9
µg/mL)
Percentage Drug Content = CEst/ CAct ×100
×
Where,
CEst: Estimated concentration (µg/mL)
CAct: Actual concentration (µg/mL)
The assay results of IBU and FAM in synthetic mixture was found to be 99.13 ± 0.14 and 100.73 ± 0.57, respectively.
Accuracy
The accuracy of the proposed method was determined by recovery study [52]. The known amount of pure IBU and FAM
were spiked to pre-analyzed synthetic mixture of IBU and FAM (9 µg/mL IBU + 0.3 µg/mL FAM). Analysis of IBU and
FAM was carried out at three concentration levels such as 80%, 100% and 120% within the specified linearity and range. The
contents of IBU and FAM were determined by using the formulae mentioned in “Analysis of synthetic mixture”.
The percentage recovery was calculated using the formula as below.
Percentage recovery=E/ (T+P)×100
Where,
E: Total amount of drug estimated (μg/mL)
T: Amount of drug taken from pre-analyzed synthetic mixture (μg/mL)
P: Amount of pure drug added (μg/mL)
The percentage recovery was found to be 96.55 ± 1.83 and 102.83 ± 0.85 for IBU and FAM respectively (Table 6).

www.tsijournals.com | June-2016
11
Drugs Initial amount
(µg/mL)
Pure drug
added (%)
Amount
recovered ±
SD (n=3)
Recovery (%) %RSD
IBU 9 80 15.69 ± 0.39 96.85 2.46
9 100 17.13 ± 0.22 95.18 1.26
9 120 19.24 ± 0.26 97.16 1.35
FAM 0.3 80 0.55 ± 0.005 102.25 1.04
0.3 100 0.61 ± 0.005 102.47 0.94
0.3 120 0.69 ± 0.005 103.78 0.84
Table 6: Results of accuracy study.
Precision
The precision of the method was determined as inter-day and intra-day precision. The repeatability study (intra-day precision)
was performed by analyzing the samples of IBU and FAM repeatedly within the day. The inter-day precision study was
performed by analyzing the samples of IBU and FAM repeatedly at different days. Six determinations of mixed working
standard solution of IBU and FAM were performed.
The result of inter-day precision was expressed as % RSD and it was found to be less than 2 (Table 7). The obtained %RSD
value indicates the good precision of the method.
Drug Concentration
µg/mL
Inter-day (n=6) Intra-day (n=6)
Peak area ±
SD
%RSD Peak area ±
SD
%RSD
IBU 9 33739.33 ±
57.64
0.17 33731.83 ±
47.37
0.14
FAM 0.3 22164 ±
162.74
0.73 22230.5 ±
127.67
0.57
Table 7: Results of precision study.
Limit of detection and limit of quantitation
Limit of detection (LOD) and limit of quantitation (LOQ) of the analytical method developed for estimating the IBU and
FAM content was calculated using the formulae mentioned below.
LOD=(3.3×σ)/S
LOD=(10×σ)/S
Where,
σ: Standard deviation of the response
S: Slope of calibration curve
The LOD was found to be 0.0453 μg/mL and 0.0068 μg/mL for IBU and FAM, respectively. The LOQ was found to be
0.1373 μg/mL and 0.0206 μg/mL for IBU and FAM, respectively.
www.tsijournals.com | June-2016
12
Robustness
In a robustness study number of experimental conditions was deliberately changed. The flow rate and detection wavelength
was changed by ± 0.1 and 1 unit respectively. Results of robustness study are presented in Table 8. From the results of
robustness study the method was found to be robust, as no significant change was observed on the peak area and
chromatographic resolution after small but deliberate variation in chromatographic conditions.
Method
parameter
varied
Retention Time Resolution Theoretical Plate Tailing factor Capacity
Factor
IBU FAM IBU FAM IBU FAM IBU FAM
Flow rate
0.9 mL/min 22.45 7.11 15.86 423498 47305 1.25 1.28 7.98 1.84
1.1 mL/min 19.95 5.79 15.28 425865 47582 1.41 1.31 6.98 1.32
Detection wavelength
262 nm 21.79 6.32 15.42 425582 47179 1.09 1.09 7.71 1.52
264 nm 21.79 6.32 15.42 425578 47205 1.09 1.09 7.71 1.52
Table 8: Results of robustness study.
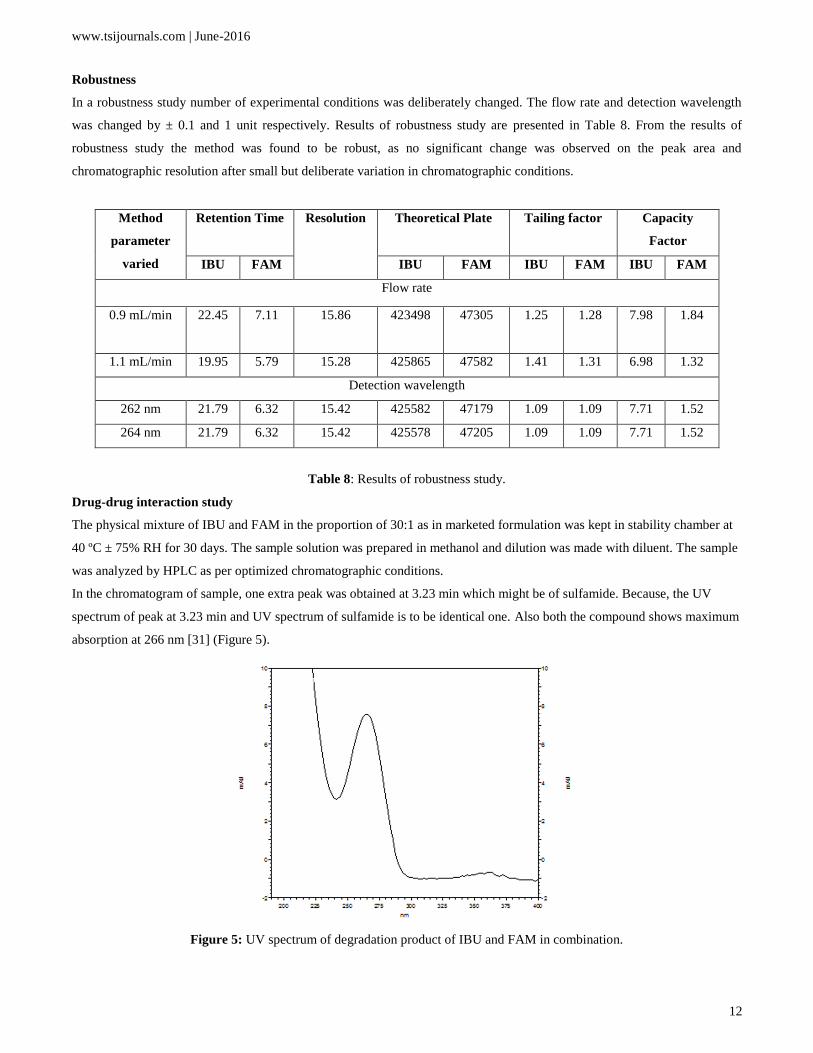
Drug-drug interaction study
The physical mixture of IBU and FAM in the proportion of 30:1 as in marketed formulation was kept in stability chamber at
40 ºC ± 75% RH for 30 days. The sample solution was prepared in methanol and dilution was made with diluent. The sample
was analyzed by HPLC as per optimized chromatographic conditions.
In the chromatogram of sample, one extra peak was obtained at 3.23 min which might be of sulfamide. Because, the UV
spectrum of peak at 3.23 min and UV spectrum of sulfamide is to be identical one. Also both the compound shows maximum
absorption at 266 nm [31] (Figure 5).
Figure 5: UV spectrum of degradation product of IBU and FAM in combination.

www.tsijournals.com | June-2016
13
From the above data, the proposed HPLC method was able to resolve the sulfamide impurity which is the major degradation
product of famotidine - ibuprofen combination mixture when kept for accelerated study [1,53].
Conclusion
All the degradants, sulfamide an interaction product, IBU and FAM were separated using single proposed gradient mobile
phase.
Acknowledgment
We thankful to Centurion Laboratories, Baroda (India) for providing gift sample of IBU and FAM for our research. We
would like to extend our thanks to Dr. S. B. Bari, Principal, H. R. Patel Institute of Pharmaceutical Education and Research,
Shirpur for providing research facilities to carry out this work.
References
1. Xu J, Valley H, Tidmarsh G (2011) US Patent 8,067,033 B2, Horizon Pharma, USA, 1-11.
2. DUEXIS (2011) Full Prescribing Information, Horizon Pharma, USA, 1-20.
3. Indian Pharmacopoeia (2010) I.P. Commission, Ghaziabad, 1331and 1479.
4. British Pharmacopoeia (2009) Her Majesty's Stationary Office, London, 767 and 791.
5. European Pharmacopoeia, Council of Europe (EDQM), France, 2119 and 1865.
6. United States Pharmacopoeia (2009) U.S.P.Convention, XXIV Rockville, 1865 and 2607
7. Fkhami A, Madrakian T, Khalafi L, Anal Lett. (2007) Flow injection and batch spectrophotometric determination of
ibuprofen based on its competitive complexation reaction with phenolphthalein‐β‐cyclodextrin inclusion complex. Analytical
Letters 40: 2317-2328.
8. Damiani PC, Bearzotti M, Cabazon MA (2001) Spectrofluorometric determination of ibuprofen in pharmaceutical
formulations. J Pharm Biomed Anal 25: 679-683.
9. F K Glowka M (2005) Karazniewicz, Anal. Chim. Acta 540: 95-102.
10. Cory WC, Harris C, Martinez S (2010) Accelerated degradation of ibuprofen in tablets. Pharm Dev Technol 15: 636-643.
11. Save TK, Parmar DV, Devarajan PV (1997) High-performance thin-layer chromatographic determination of ibuprofen in
plasma. J Chromatogr B Biomed Sci Appl 690: 315-319.
12. Hackett LP, Dusci LJ (1978) Gas-liquid chromatographic determination of ibuprofen in human plasma. Clin Chim Acta
87: 301-303.
13. Vangiessen GJ, Kaiser DG (1975) GLC determination of ibuprofen [dl-2-(p-isobutylphenyl) propionic acid] enantiomers
in biological specimens. J Pharm Sci 64: 798-801.
14. Hassan WS (2008) Determination of Ibuprofen and Paracetamol in Binary Mixture Using Chemometric-Assisted
Spectrophotometric Methods. Am J Appl Sci 5: 1005-1012.
15. Nyola N, Govinda SJ, Kumavat M, Kalra N, Singh G (2012) Method development of simultaneous estimation of
Sitagliptin and Metformin hydrochloride in pure and Tablet dosage form by UV-Vis spectroscopy. Int Res J Pharm. 3: 277-
280.
16. Palabiyik IM, Dinc E, Onur F (2004) Simultaneous spectrophotometric determination of pseudoephedrine hydrochloride
and ibuprofen in a pharmaceutical preparation using ratio spectra derivative spectrophotometry and multivariate calibration
techniquesJ. Pharm Biomed Anal 34: 473-483.

www.tsijournals.com | June-2016
14
17. Reddy PB, Reddy MS (2009) RP-HPLC Method for simultaneous estimation of Paracetamol and Ibuprofen in Tablets.
Asian J Res Chem 2: 70-72.
18. Ravisankar S, Vasudevan M, Gandhimathi M, Suresh B (1998) Reversed-phase HPLC method for the estimation of
acetaminophen, ibuprofen and chlorzoxazone in formulations. Talanta 46: 1577-1581.
19. Ge ZK, Luo YH, Zhao XY, Zang YJ, Zang H, et al. (2011) Simultaneous determination of ibuprofen and
diphenhydramine HCl in orally disintegrating tablets and its dissolution by reversed-phase high performance liquid
chromatography (RP-HPLC) Afr. J Pharm Pharmacol 5: 2100-2105.
20. Rao DD, Sait SS, Mukkanti K (2011) Development and validation of an UPLC method for rapid determination of
ibuprofen and diphenhydramine citrate in the presence of impurities in combined dosage form. J. Chromatogr. Sci 49: 281-
286.
21. Dubey N, Jain DK, Jadhawani S (2012) J. Planar Chromatogr.--Mod. TLC 25: 162
22. Sam Soloman WD, Kumar RA, VijaiAnand PR, Sivakumar R, Venkatnarayanan R (2010) Derivatized HPTLC method
for simultaneous estimation of glucosamine and ibuprofen in tablets Journal of Pharmacy Research and Health Care 2: 156-
162.
23. Dowling G1, Gallo P, Fabbrocino S, Serpe L, Regan L (2008) Determination of ibuprofen, ketoprofen, diclofenac and
phenylbutazone in bovine milk by gas chromatography-tandem mass spectrometry. Food Addit Contam Part A Chem Anal
Control Expo Risk Assess 25: 1497-1508.
24. Darwish IA1, Hussein SA, Mahmoud AM, Hassan AI (2007) Sensitive indirect spectrophotometric method for
determination of h2-receptor antagonists in pharmaceutical formulations. Int J Biomed Sci 3: 123-130.
25. Rahman N1, Kashif M (2003) Application of ninhydrin to spectrophotometric determination of famotidine in drug
formulations. Farmaco 58: 1045-1050.
26. Ayad MM1, Shalaby A, Abdellatef HE, Hosny MM (2003) New colorimetric methods for the determination of trazodone
HCl, famotidine, and diltiazem HCl in their pharmaceutical dosage forms. Anal Bioanal Chem 376: 710-714.
27. Okram ZD, Kanakapura B, Pavagada JR, Kanakapura BV(2011) simple and sensitive uv spectrophotometric methods for
determination of famotidine in tablet formulations. Farmacia 59: 647-657
28. Walash MI, El Brashy A, El Enany N, Wahba ME (2009) Spectrofluorimetric Determination of Famotidine in Pharmaceu
tical Preparations and Biological Fluids through Ternary Complex Formation with Some Lanthanide Ions: Application to
Stability Studies. Int J Biomed Sci 5: 158-168.
29. Zendelovska D, Stafilov T (2003) High-performance liquid chromatographic determination of famotidine in human
plasma using solid-phase column extraction. J. Serb. Chem. Soc., 68: 883-892.
30. Zarghi A, Shafaati A, Foroutan SM, Khoddam A (2005) Development of a rapid HPLC method for determination of
famotidine in human plasma using a monolithic column. J Pharm Biomed Anal 39: 677-680.
31. Vamsi Krishna M, Madhavi G, Rama Prasad LA, Gowri Sankar D (2010) Impurity profiling of Famotidine in bulk drugs
and pharmaceutical formulations by RP-HPLC method using ion pairing agent Der Pharm. Lett 2: 1-11.
32. Helali N, Darghouth F, Monser L (2004) RP-HPLC determination of famotidine and its potential impurities in
pharmaceuticals. Chromatographia, 60: 455-460.
33. Tzanavaras PD, Verdoukas A, Balloma T (2006) Optimization and validation of a dissolution test for famotidine tablets
using flow injection analysis. J Pharm Biomed Anal 41: 437-441.
www.tsijournals.com | June-2016
15
34. Singh S, Kumar S, Sharda N, Chakraborti AK (2002) New findings on degradation of famotidine under basic conditions:
identification of a hitherto unknown degradation product and the condition for obtaining the propionamide intermediate in
pure form. J Pharm Sci 91: 253-257.
35. Sathiyanarayanan, P V. Kulkarni, A. R. Nikam, K. R. Mahadik, Der Pharm. Sin., 3(1), 134-143 (2011).
36. Tajane DD, Gite SR,. Shah AR, Kale AB, Gadhave RV, et al. (2011) Spectrophotometric Simultaneous Determination of
Famotidine and Domperidone in Combined Tablet Dosage Form by Ratio Derivative and Area under Curve Method. Der
Pharm. Sin 2: 60-66
37. Biffar SE, Mazzo DJ (1986) Reversed-phase determination of famotidine, potential degradates, and preservatives in
pharmaceutical formulations by high-performance liquid chromatography using silica as a stationary phase. J Chromatogr
363: 243-249.
38. Wani YB and Patil DD (2013) Development and validation of spectrophotometric methods for the estimation of
ibuprofen and famotidineInt. J Pham Pharm Sci 5: 358-363.
39. Kamath BV, Shivram K, Shah AC (1994) Determination of diclofenac sodium, famotidine and ketorolac tromethamine
by flow injection analysis using dichloronitrophenol. J Pharm Biomed Anal 12: 343-346.
40. Pawar SM, Patil BS, Patil RY (2010) Validated HPTLC method for simultaneous quantitation of famotidine and
domperidone in bulk drug and formulationInt. J Adv Pharm Sci 1: 54-59.
41. Shah DA, Suthar DJ, Baldania SL, Chhalotiya UK. Bhatt KK (2012) Development and validation of liquid
chromatographic method for estimation of ibuprofen and famotidine in combined dosage form ISRN Analytical Chemistry
2012: 1-5
42. Karthik kumar B, Thiruvengadarajan VS, Srinivas Reddy T, Tanveer begum N. (2012). Analytical Method Development
and Validation of Ibuprofen and Famotidine in Tablet Dosage Form by RP-HPLC Method. J Pharm Res 5: 4633
43. Krishnaveni G and Sathyannarayana PVV (2013) Simultaneous Determination Of Famotidine And Ibuprofen In
Combined Pharmaceutical Dosage Form By Rp-Hplc Method. Int J Pharm Bio Sci 4: 655-662.
44. Patel DP, Shah RR, Patel AP, Patel RS, Shukla M (2012) An International Journal of Pharmaceutical Sciences 34: 2798-
2811.
45. Sekhar VR, Reddy YP, Ramalingam P, Theja DH (2013) RP-HPLC and UV-derivative spectrophotometry technique for
the simultaneous estimation of ibuprofen and famotidine in pharmaceutical dosage form, Der Pharmacia Sinica 4: 160-170.
47. Ahirrao VK, Pawar RP (2013) Simultaneous quantification of famotidine and ibuprofen in pharmaceutical dosage by
using validated stability indicating LC method. Res. J. Pharmaceutical Sci., 2: 1-9
48. Reddy YR, Kumar KK, Reddy M, Mukkanti K (2012) RP-UPLC method development and validation for the
simultaneous estimation of ibuprofen and famotidine in pharmaceutical dosage form. Pharm Methods 3: 57-61.
49. Hendrickson R (2005) Remington the Science and Practice of Pharmacy, Wolters Kluwer Pvt. Ltd: New Delhi, 623
50. Snyder LR, Glajch JL, Kirkland JJ (1996) Practical HPLC Method Development, Wiley-Interscience: New York, 229 52.
51. http://www.hplctools.com
52. http://www.chem.agilent.com
53. Alvarenga L1, Ferreira D, Altekruse D, Menezes JC, Lochmann D (2008) Tablet identification using near-infrared
spectroscopy (NIRS) for pharmaceutical quality control. J Pharm Biomed Anal 48: 62-69.
54. Tidmarsh G, Golombik BL, Lii T (2007) US2007/0043097A1, Horizon Therapeutics, Inc., CA, 1-27.

www.tsijournals.com | June-2016
16
*