Embed Size (px)
Citation preview

Analytical approaches in
cross-cohort research
Graciela Muniz-TerreraProgramme Leader Track
MRC Unit for Lifelong Health and Ageing
University College London
September
2015
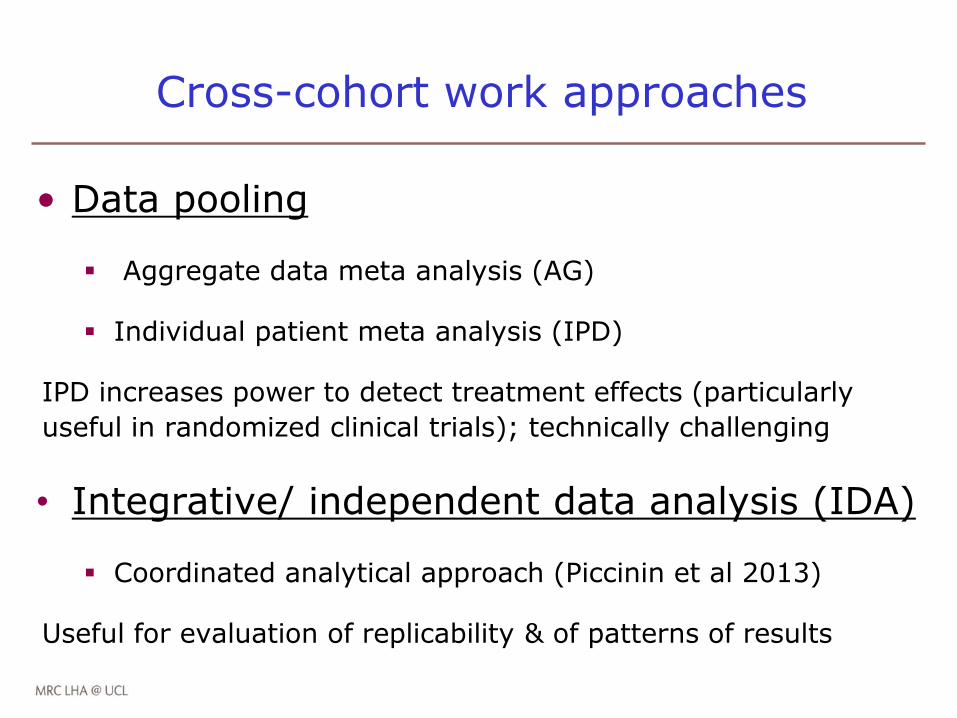
• Data pooling
Aggregate data meta analysis (AG)
Individual patient meta analysis (IPD)
IPD increases power to detect treatment effects (particularly
useful in randomized clinical trials); technically challenging
• Integrative/ independent data analysis (IDA)
Coordinated analytical approach (Piccinin et al 2013)
Useful for evaluation of replicability & of patterns of results
Cross-cohort work approaches
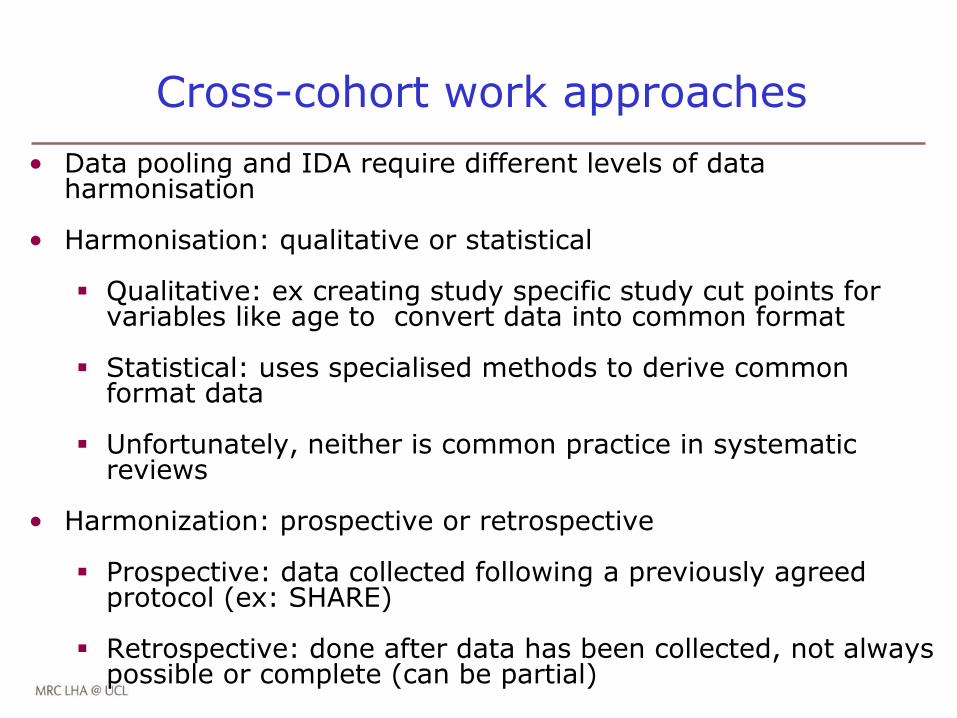
• Data pooling and IDA require different levels of data harmonisation
• Harmonisation: qualitative or statistical
Qualitative: ex creating study specific study cut points for variables like age to convert data into common format
Statistical: uses specialised methods to derive common format data
Unfortunately, neither is common practice in systematic reviews
• Harmonization: prospective or retrospective
Prospective: data collected following a previously agreed protocol (ex: SHARE)
Retrospective: done after data has been collected, not always possible or complete (can be partial)
Cross-cohort work approaches

Data pooling
• Data pooling, either for AD or IDA, requires data harmonisation
to obtain interpretable results
• When pooling cognitive data, researchers are faced with multiple
challenges, as outcomes are rarely binary
• Quite often, cognitive tests consist of a questionnaire such that
correct answers to individual questions are scored and the final
test score is the sum of the individual scores
• For example, to evaluate global cognitive function, many studies
use the Mini Mental State Exam
Data pooling
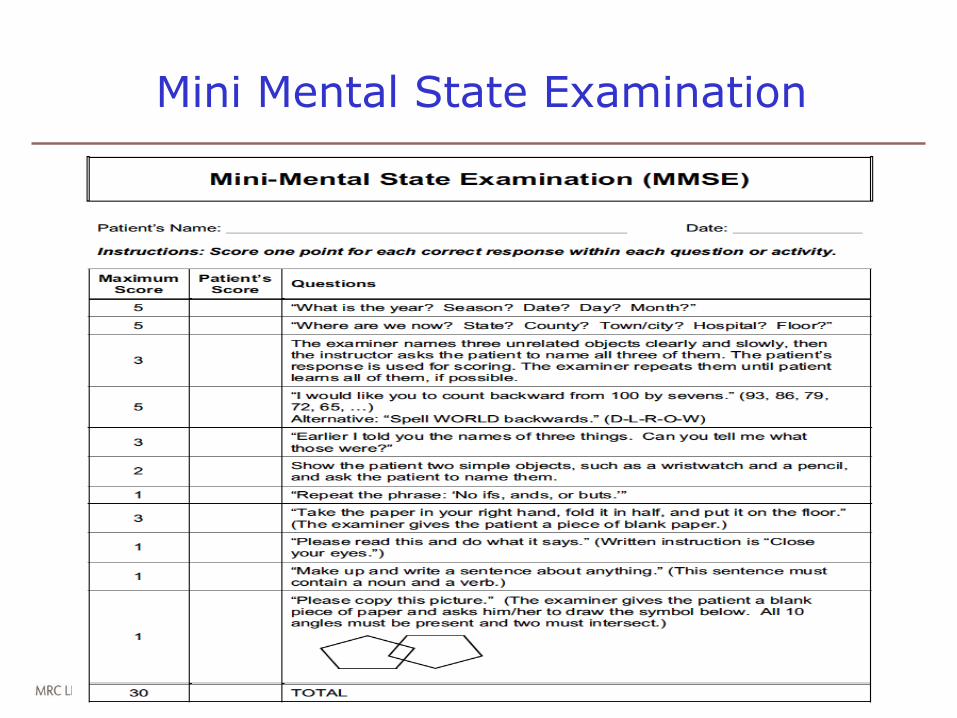
Mini Mental State Examination
• Questionnaire data in different studies may have missing items
(MMSE may not include some questions, some say too loaded on
memory)
• Language differences may be considerable & translation of tests
is not direct.
• Difficulty of the items may vary between countries
• Even within languages variations should be expected (ex: arete,
caravana, pendiente; medias, calcetas, escarpines, calcetines)
• These differences are usually ignored when pooling data
Data pooling
• Ignoring item harmonization, various methods have been
proposed.
• Each method makes different assumptions, we will discuss them
when necessary
• Three commonly used methods of harmonization are:
• T-scores
• C-scores
• Calculation of latent variables
Methods used in harmonization of cognitive variables
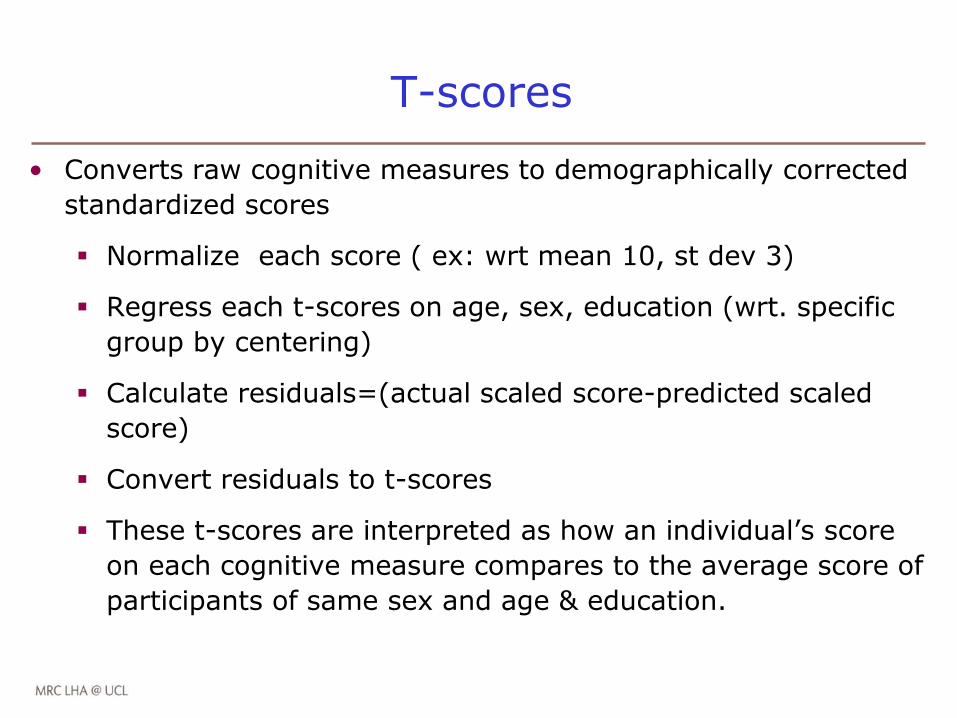
• Converts raw cognitive measures to demographically corrected
standardized scores
Normalize each score ( ex: wrt mean 10, st dev 3)
Regress each t-scores on age, sex, education (wrt. specific
group by centering)
Calculate residuals=(actual scaled score-predicted scaled
score)
Convert residuals to t-scores
These t-scores are interpreted as how an individual’s score
on each cognitive measure compares to the average score of
participants of same sex and age & education.
T-scores
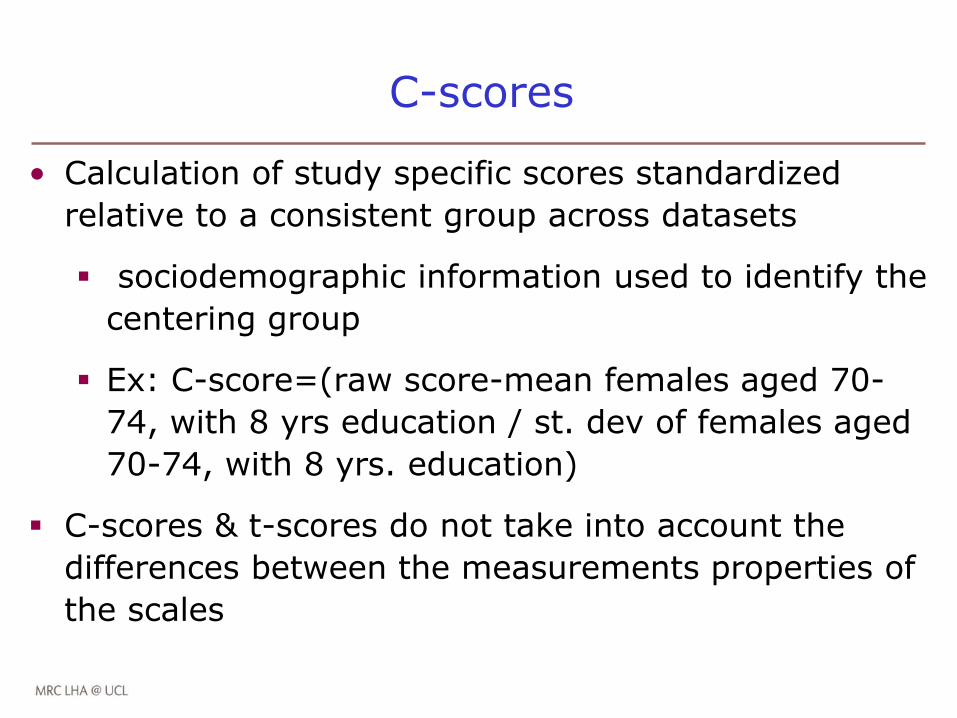
• Calculation of study specific scores standardized
relative to a consistent group across datasets
sociodemographic information used to identify the
centering group
Ex: C-score=(raw score-mean females aged 70-
74, with 8 yrs education / st. dev of females aged
70-74, with 8 yrs. education)
C-scores & t-scores do not take into account the
differences between the measurements properties of
the scales
C-scores
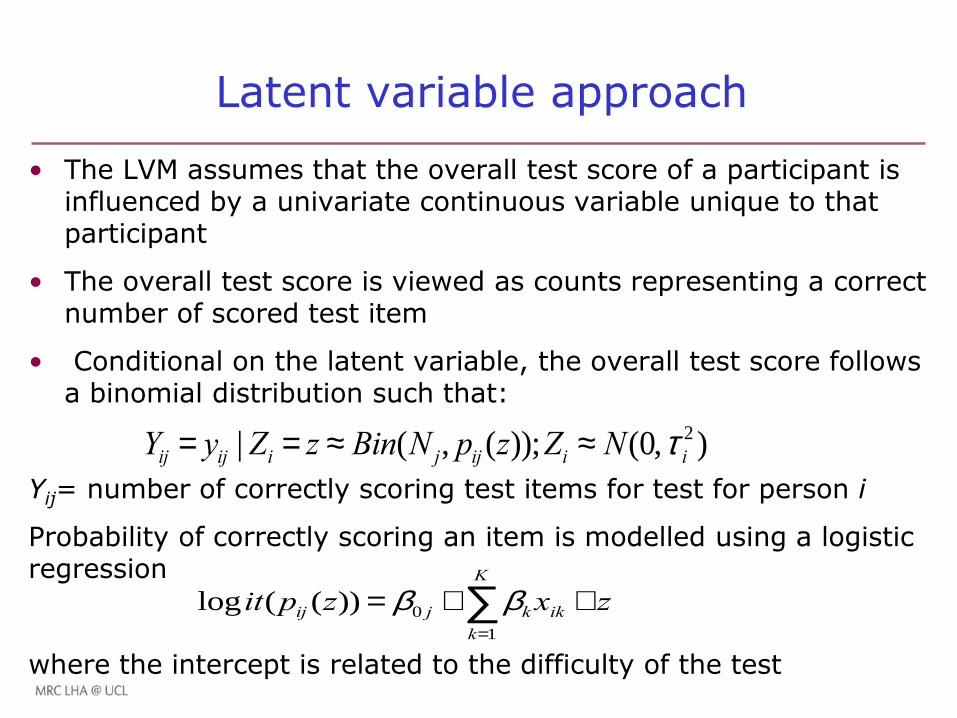
• The LVM assumes that the overall test score of a participant is influenced by a univariate continuous variable unique to that participant
• The overall test score is viewed as counts representing a correct number of scored test item
• Conditional on the latent variable, the overall test score follows a binomial distribution such that:
Yij= number of correctly scoring test items for test for person i
Probability of correctly scoring an item is modelled using a logistic regression
where the intercept is related to the difficulty of the test
Latent variable approach
Yij = yij | Zi = z » Bin(N j, pij (z));Zi » N(0,t i2 )
logit(pij (z)) = b0 j + bkk=1
K
å xik + z
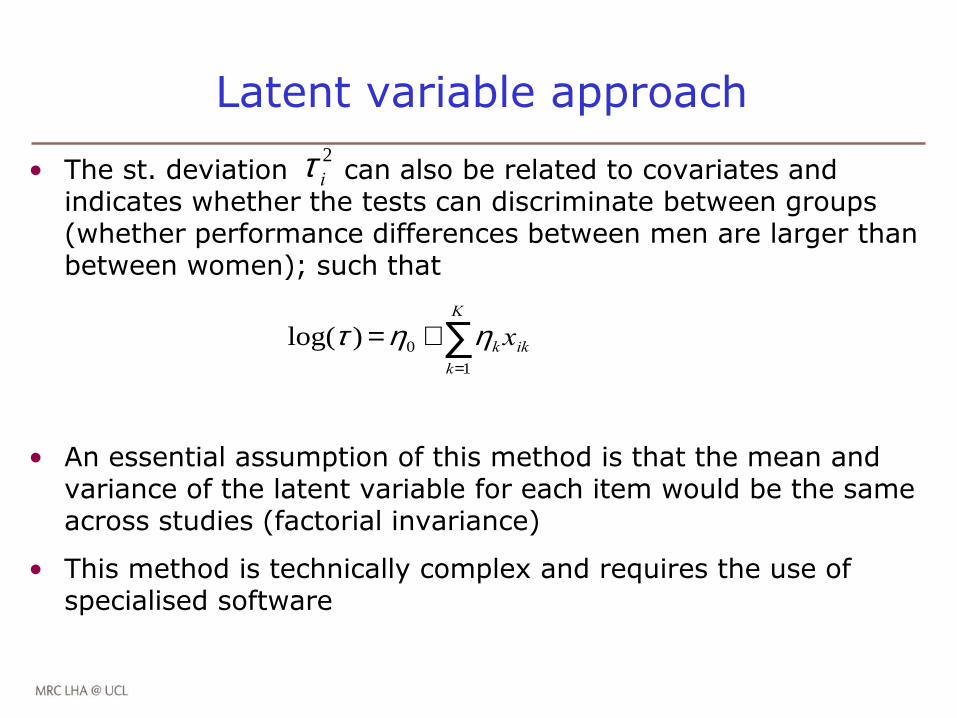
• The st. deviation can also be related to covariates and indicates whether the tests can discriminate between groups (whether performance differences between men are larger than between women); such that
• An essential assumption of this method is that the mean and variance of the latent variable for each item would be the same across studies (factorial invariance)
• This method is technically complex and requires the use of specialised software
Latent variable approach
t i2
log(t ) =h0 + hkk=1
K
å xik
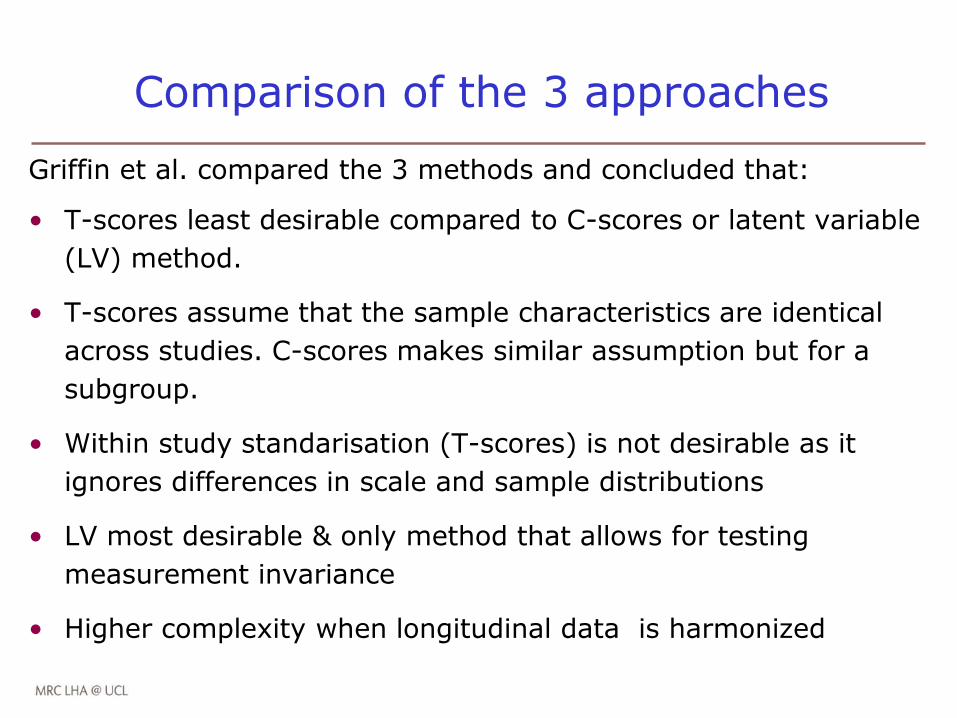
Griffin et al. compared the 3 methods and concluded that:
• T-scores least desirable compared to C-scores or latent variable
(LV) method.
• T-scores assume that the sample characteristics are identical
across studies. C-scores makes similar assumption but for a
subgroup.
• Within study standarisation (T-scores) is not desirable as it
ignores differences in scale and sample distributions
• LV most desirable & only method that allows for testing
measurement invariance
• Higher complexity when longitudinal data is harmonized
Comparison of the 3 approaches
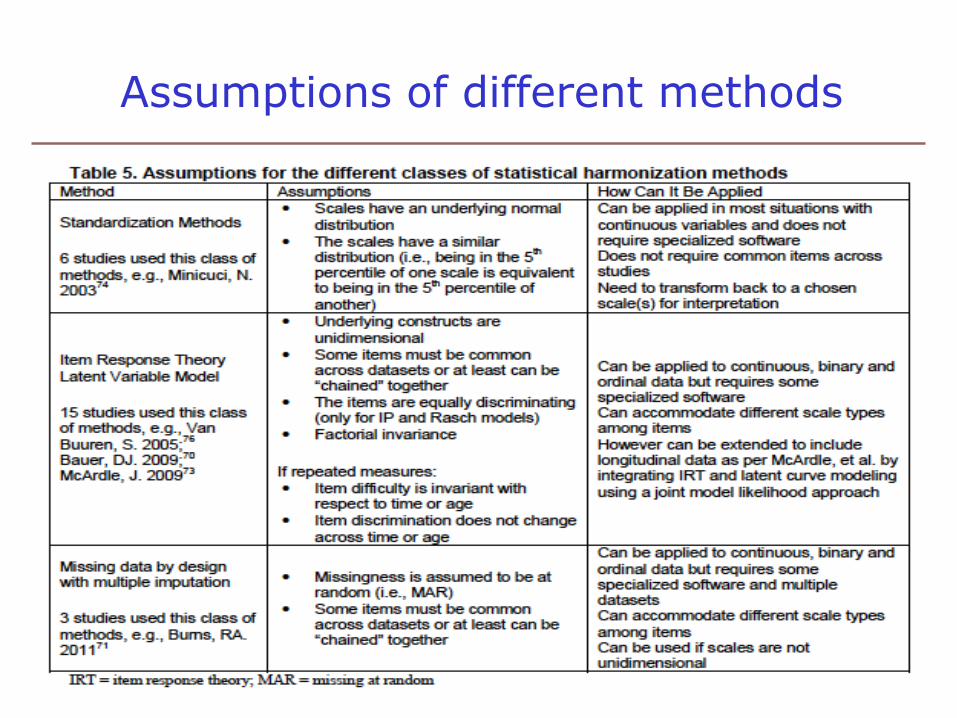
Assumptions of different methods
Integrative data analysis (IDA)
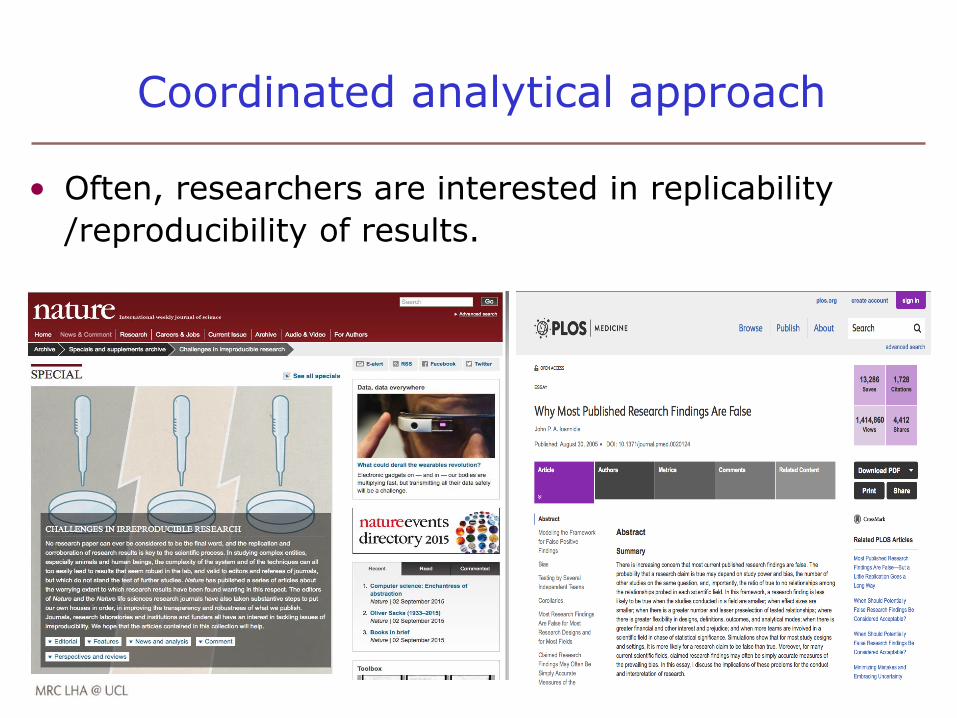
• Often, researchers are interested in replicability
/reproducibility of results.
Coordinated analytical approach
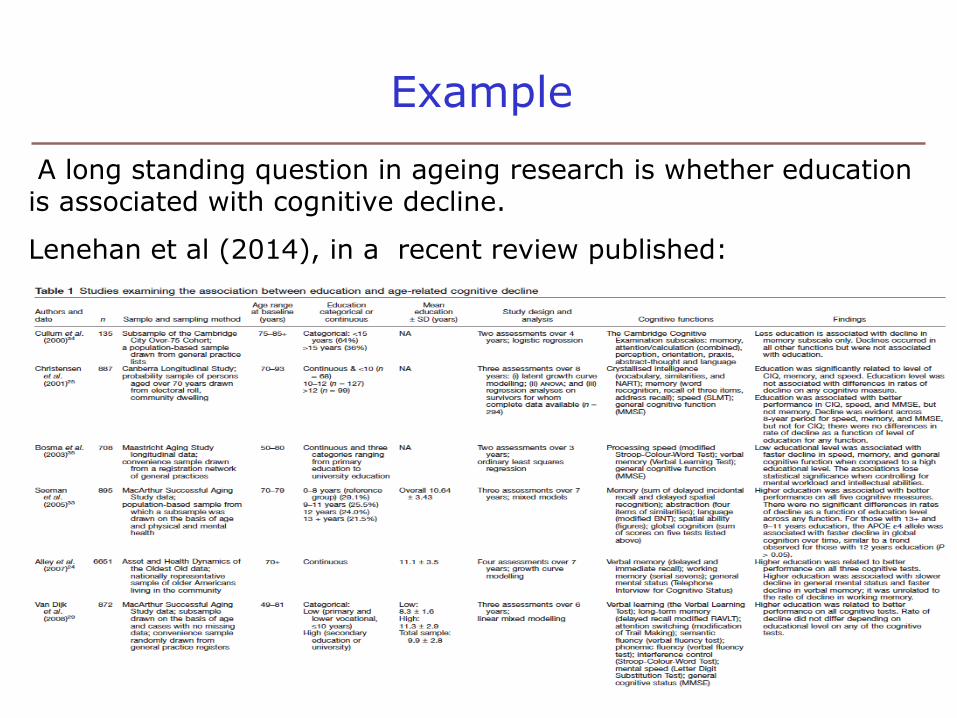
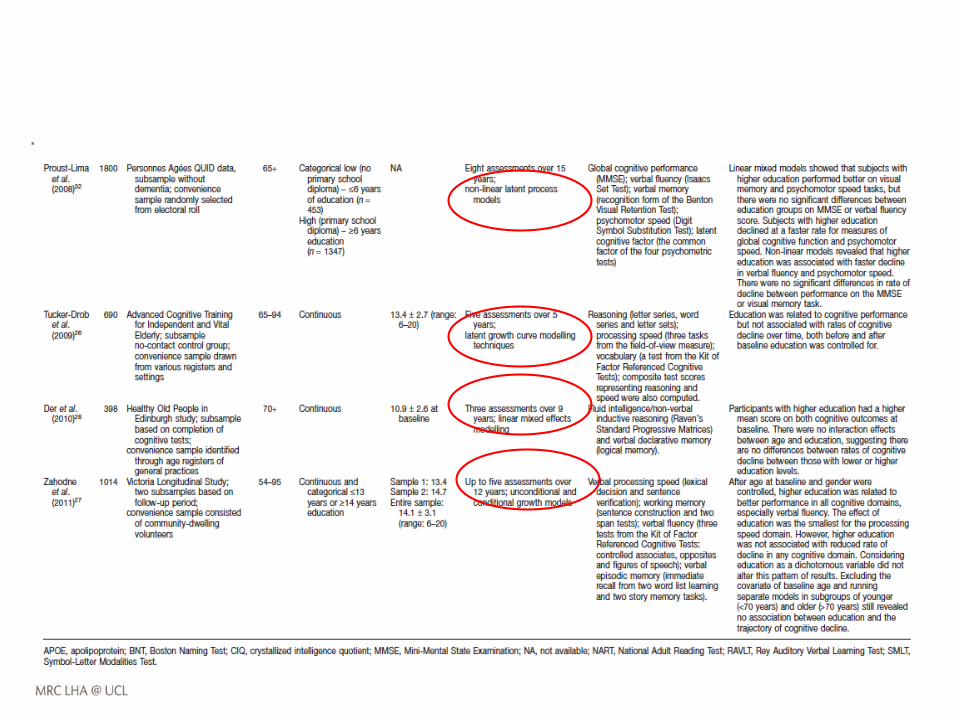
A long standing question in ageing research is whether education is associated with cognitive decline.
Lenehan et al (2014), in a recent review published:
Example
• Lenehan identified multiple reasons that could explain different results
• Amongst them, differences in statistical analysis used appeared as a significant source of heterogeneity of results
• The coordinated analytical approach proposed by Piccinin et al (2013) aims at reducing differences due to the fit of different statistical models.
• Same model fitted independently to various studies
• Consistent data coding (continuous covariates centered at same values; categorical variables also coded consistently)
• Sensitivity analyses are essential
• Coordinated approach will facilitate the comparison of results & identification or patterns of results
Example
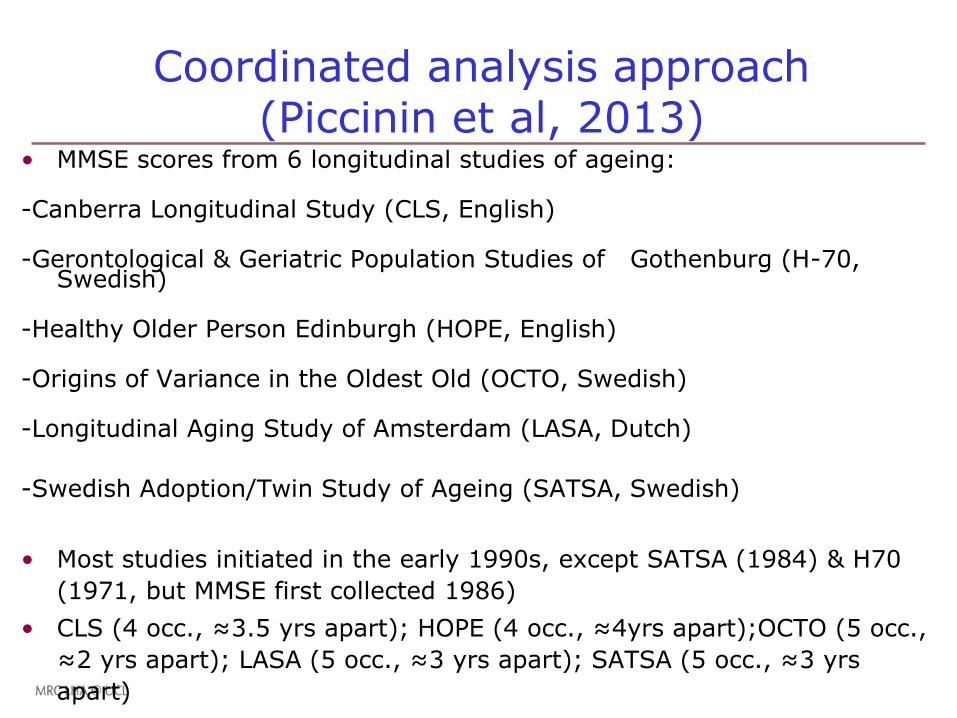
• MMSE scores from 6 longitudinal studies of ageing:
-Canberra Longitudinal Study (CLS, English)
-Gerontological & Geriatric Population Studies of Gothenburg (H-70, Swedish)
-Healthy Older Person Edinburgh (HOPE, English)
-Origins of Variance in the Oldest Old (OCTO, Swedish)
-Longitudinal Aging Study of Amsterdam (LASA, Dutch)
-Swedish Adoption/Twin Study of Ageing (SATSA, Swedish)
• Most studies initiated in the early 1990s, except SATSA (1984) & H70
(1971, but MMSE first collected 1986)
• CLS (4 occ., ≈3.5 yrs apart); HOPE (4 occ., ≈4yrs apart);OCTO (5 occ.,
≈2 yrs apart); LASA (5 occ., ≈3 yrs apart); SATSA (5 occ., ≈3 yrs
apart)
Coordinated analysis approach (Piccinin et al, 2013)
Coordinated analysis approach
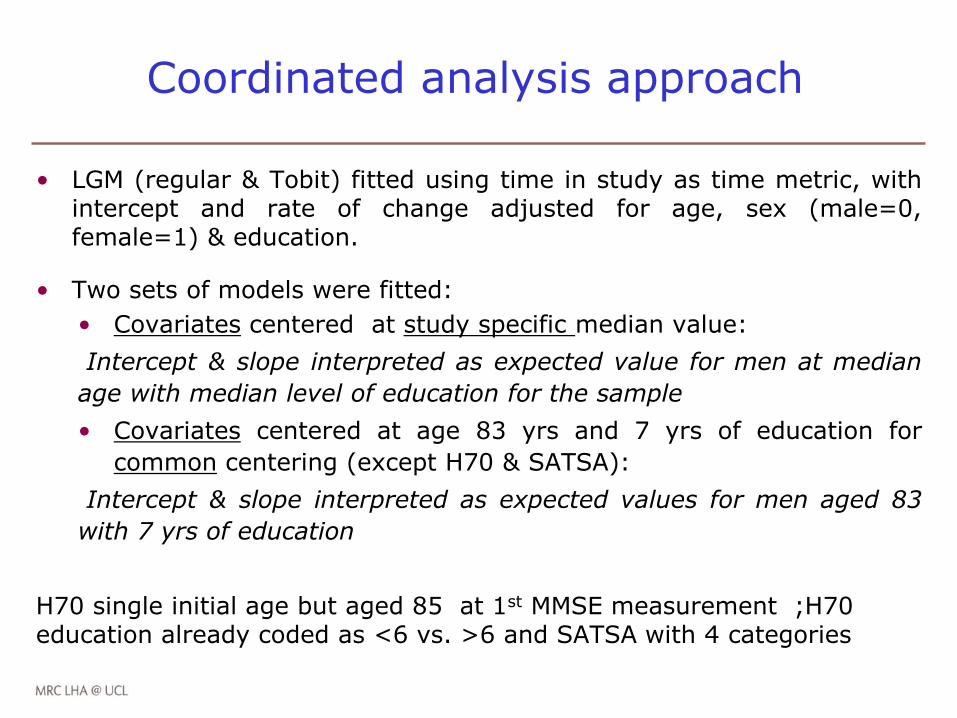
• LGM (regular & Tobit) fitted using time in study as time metric, withintercept and rate of change adjusted for age, sex (male=0,female=1) & education.
• Two sets of models were fitted:
• Covariates centered at study specific median value:
Intercept & slope interpreted as expected value for men at median
age with median level of education for the sample
• Covariates centered at age 83 yrs and 7 yrs of education for
common centering (except H70 & SATSA):
Intercept & slope interpreted as expected values for men aged 83
with 7 yrs of education
H70 single initial age but aged 85 at 1st MMSE measurement ;H70 education already coded as <6 vs. >6 and SATSA with 4 categories
Coordinated analysis approach
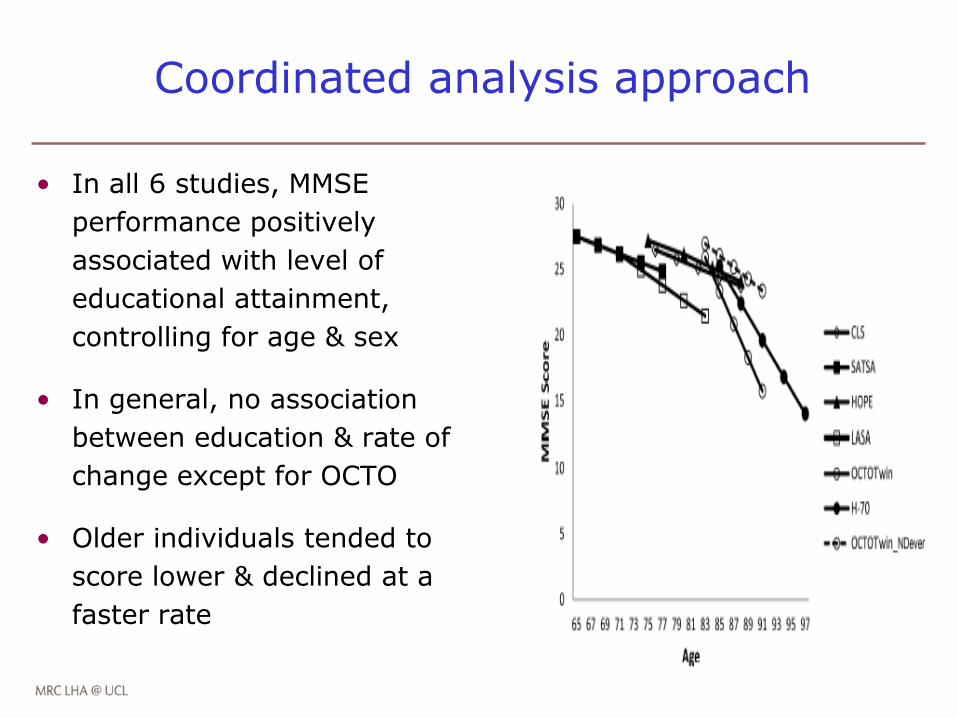
• In all 6 studies, MMSE
performance positively
associated with level of
educational attainment,
controlling for age & sex
• In general, no association
between education & rate of
change except for OCTO
• Older individuals tended to
score lower & declined at a
faster rate
Conclusion
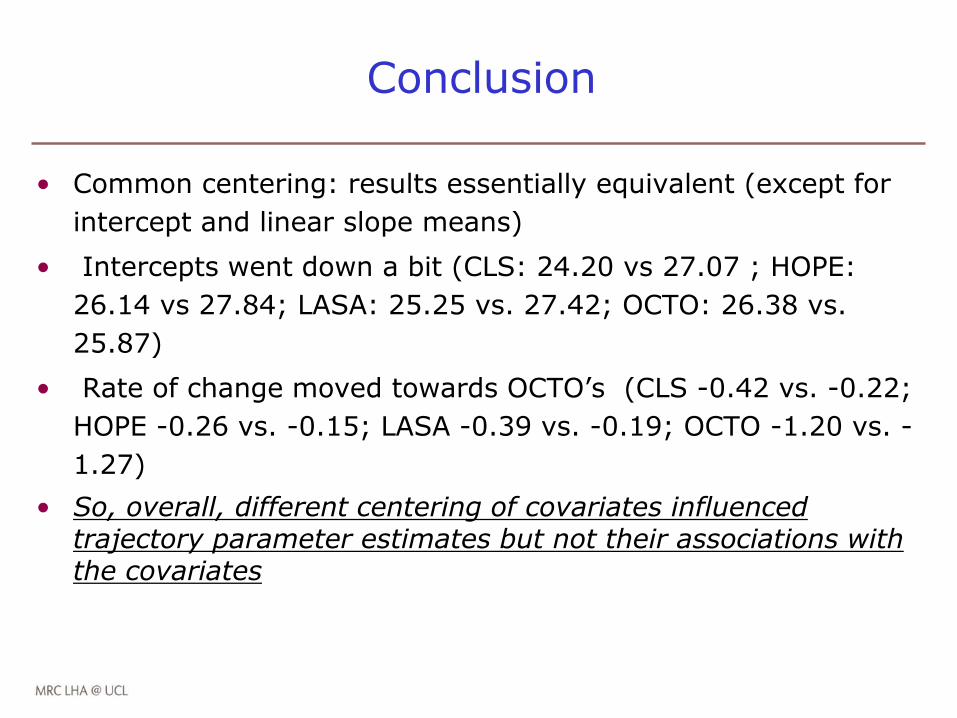
• Common centering: results essentially equivalent (except for
intercept and linear slope means)
• Intercepts went down a bit (CLS: 24.20 vs 27.07 ; HOPE:
26.14 vs 27.84; LASA: 25.25 vs. 27.42; OCTO: 26.38 vs.
25.87)
• Rate of change moved towards OCTO’s (CLS -0.42 vs. -0.22;
HOPE -0.26 vs. -0.15; LASA -0.39 vs. -0.19; OCTO -1.20 vs. -
1.27)
• So, overall, different centering of covariates influenced trajectory parameter estimates but not their associations with the covariates
Conclusion
• Coordinated analytical approach allowed us:
- to perform a fairer comparison of results across
studies
- gain opportunities to understand reasons for
diverse results
• As seen, may not be possible in all studies, but
sometimes partial comparisons are still possible
• Provide best possible input for meta analysis of
aggregate results if evidence synthesis is of interest.
References & suggested readings
• Griffith L. et al. Harmonization of cognitive measures in individual
participant data and aggregate data meta-analysis. Methods Research
Report.
• Piccinin et al. Coordinated analysis of age, sex and education on change in
MMSE scores.J Gerontol B Psychol Sci Soc Sci. 2013 May;68(3):374-90.
• Hofer SM, Piccinin AM. Integrative Data Analysis through Coordination of
Measurement and Analysis Protocol across Independent Longitudinal
Studies. Psychological methods. 2009;14(2):150-164.
doi:10.1037/a0015566.
• Bainter & Curran. Advantages of Integrative Data Analysis for
Developmental Research.Journal of Cognition and Development , vol 16(1),
2015.
• Bauer & Hussong. Psychometric Approaches for Developing Commensurate
Measures Across Independent Studies: Traditional and New Models.
Psychological Methods, 2009, Jun; 14(2).
• Fortier et al. Quality, quantity and harmony: the DataSHaPER approach to
integrating data across bioclinical studies. Int J Epidemiol. 2010
Oct;39(5):1383-93. doi: 10.1093/ije/dyq139. Epub 2010 Sep 2.