Embed Size (px)
Citation preview
NASA TECHNICAL NOTE
ANALYTICAL A N D EXPERIMENTAL STUDY OF COMPRESSIBLE LAMINAR-FLOW HEAT TRANSFER A N D PRESSURE DROP OF A GAS I N A UNIFORMLY HEATED TUBE - 6 '9p-
b4"$ *%**
by Alden F. Presler
Lewis Reseurch Center
!,C l e v e h d , Ohio 44135 iI
I N A T I O N A L AERONAUTICS AND SPACE ADMINISTRATION WASHINGTON, D. C. APRIL 1971
https://ntrs.nasa.gov/search.jsp?R=19710014236 2018-06-13T00:27:25+00:00Z
- -.
I . Report No. 2. Government Accession No.
NASA TN D-6333 1. Title and Subtitle ANALYTICAL AND EXPERIMENTAL STUDY O F
COMPRESSIBLE LAMINAR-FLOW HEAT TRANSFER AND PRESSURE DROP O F A GAS IN A UNIFORMLY HEATED TUBE
7. Author(s)
Alden F. Presler
9. Performing Organization Name and Address
Lewis Resea rch Center National Aeronautics and Space Administration Cleveland, Ohio 44135
2. Sponsoring Agency Name and Address
National Aeronautics and Space Administration Washington, D. C . 20546
5. Supplementary Notes
6. Abstract
TECH LIBRARY KAFB, NM
I11111111111lllllIll11lllllllllllllllIll11111 013288
3. Recipient's C;araiog NO.
5. Report D teApril 8971
6. Performing Organization Code
8. Performing Organization Report NO.
E- 5702 10. Work Unit No.
127-01 11. Contract or Grant No.
~~ ___
13. Type of Report and Period Covered
Technical Note 14. Sponsoring Agency Code
Numerical solutions of the compressible l amina r boundary-layer equations are obtained to investigate accelerat ion effects due to wall heating on axial development of velocity and temperat u r e profiles, local Nusselt numbers , and especially s ta t ic p r e s s u r e d rop and its momentum and frictional components. Heating. combined with compressibi l i ty , produces blunter velocity and t empera tu re prof i les than are reported in e a r l i e r analyses . L a r g e r momentum p r e s s u r e drops relat ive to friction l o s s e s reduce the Poiseuille p r e s s u r e pa rame te r by as much as one-third of its fully developed value. Experimental values of p r e s s u r e d r o p and momentum-to-friction pres s u r e ra t io checks the analytical preductions.
17. Key Words (Suggested by Author(s)) 18. Distribution Statement
P r e s s u r e drop; Gas flow; P r e s s u r e distri- Unclassified - unlimited bution; RT p r e s s u r e drop; Heat t ransfer ; Forced convection; Tempera tu re profiles; Lamina r flow
~
19. Security Classif. (of this report) 20. Security Classif. (of this page) 21. NO. of Pages 22. Price"
Unclassified Unclassified 4 5 $3.00
ANALYTICAL AND EXPERIMENTAL STUDY OF COMPRESSIBLE LAMINAR-FLOW HEAT
TRANSFER AND PRESSURE DROP OF A GAS IN A UNIFORMLY HEATED TUBE
by Alden F.. Presler
Lewis Research Center
SUMMARY
This is the report of an analytical and an experimental investigation to determine what effect acceleration caused by heat input to a compressible gas has on the laminar Nusselt numbers and static pressure drops. Helium gas flow in a circular tube w a s studied with uniform entrance conditions and wall heat flux conditions.
The analytical portion considers the compressible laminar momentum and energy boundary-layer equations to be valid throughout the tube cross section and axially downs t ream from the entrance. A numerical finite difference marching technique is used to solve the equations and is adaptable to a wide range of values of physical parameters such as heat flux and entrance Mach number. Axial development of velocity and temperature profiles, Nusselt numbers, and static pressures w e r e calculated for a 200-fold range in heat flux. Local bulk Nusselt numbers a r e little affected by thermal acceleration, but pressure drops from flow acceleration by heating show large increases due to heat flux.
The experiment closely approximates the geometrical and physical model of the analysis. There is a fivefold variation of the experimental heat flux, and entrance Mach numbers vary from 0.035 to 0.10. Experimentally determined Nusselt numbers and overall static pressure drops confirm analytical results, which w e r e obtained for corresponding heat flux parameters and dimensionless tube lengths.
INTRODUCT ION
This report is a continuation of two previous numerical studies of the effect of heat flux level on the behavior of the laminar flow of a compressible gas in a uniformly heated circular tube for both heating and cooling. Reference 1 reported the heat-
t ransfer and frictional behavior of both adiabatic laminar flow and one diabatic laminar case for a helium gas model. Reference 2 examined in detail by numerical analysis the flow behavior of helium gas undergoing cooling. It was found in both these reports that certain important deviations from classical heat- t ransfer and frictional results occurred because of compressibility effects a t low subsonic Mach numbers.
The present report examines in more detail analytically and experimentally the heating effect on local Nusselt numbers and frictional and pressure parameters. In the analytical program a 200-fold variation of heat flux level is imposed on the uniform entrance flow. In particular the development of momentum and frictional pressure components in the flow is detailed for this range of heat fluxes.
An experiment is described in which heat-transfer measurements are made on the laminar flow of helium gas in an electrically heated small-diameter Inconel tube. Local Nusselt numbers, inlet- to-exit pressure drop, and pressure drop components due to momentum change and friction loss are determined fo r a range of wall- to bulk-temperature ratios of 1.4 to 1 . 7 . These experimental results are compared with numerical predictions from the analytical model.
Reference 3 w a s one of the earliest analyses of laminar flow heat transfer that considered temperature variation of the physical properties. This analysis assumed fully developed velocity profiles in the circular tube. Constant property analyses for heat transfer to laminar incompressible flow for developing profiles are given in references 4 and 5.
Laminar flow heat-transfer experiments have not been numerous. A uniform heat flux program with both up and down flow in a vertical tube is reported in reference 6. The object of that research w a s to establish cr i ter ia for when free-convection effects are important relative to the forced convection. An experiment s imilar to the one reported herein is described in reference 7. It contains local Nusselt numbers for both helium and nitrogen flows and friction factors based on wall shear stresses, but it has no data on flow pressure drops.
Correlation of laminar friction and heat-transfer data of reference 7 is given in reference 8. The experimental friction factor based on wall shear stress is normalized to the fully developed analytical value by a product transformation of the ratio of wall to bulk temperature.
A recent numerical analysis using the marching technique is reported in reference 9. The condition of uniform heat flux was applied to a laminar flow which had initially a fully developed velocity profile. Besides the Nusselt number development, only friction factors based on wal l shear s t r e s s were shown.
2
SYMBOLS
Variables and dimensional quantities:
a local sound velocity,
cP specific heat at constant pressure
cV specific heat at constant volume
D tube diameter
G mass velocity, vL/nr, 2
h heat-transfer coefficient, q w / ( b
k thermal conductivity
L length of test section
P absolute static pressure
Q rate of energy dissipation
wal l heat fluxq W
r radius
t absolute static temperature
U axial velocity component
V radial velocity component
w flow rate, mass per unit t ime
Z axial distance from entrance
EL viscosity
P density
7 shear stress -
- \)
7 average shear stress over axial distance z
Dimension1ess quantities:
c;, specific heat ratio Cd C P , e
fP, b friction factor based on pressure drop f rom inlet, with density and velocity
evaluated at local bulk temperature, (i)(pe - py(:,pbub 2
f ~ , local friction factor based on wall shear stress, with density and velocity evalb
uated at local bulk temperature, 2Tw/Pbub2
3
I -
Gz Graetz number, lRe) (P~-)~l / (z /D)
K thermal conductivity ratio, k/ke
M local Mach number, u/a
Nub bulk Nusselt number, hD/kb
P pressure drop from inlet, (p, - p)/peue2
Pr Prandtl number, CP
p/k
Q+ wall heat flux, qwrw/kete
R radius ratio, r/rw
Re Reynolds number, GD/p
T static temperature, (1- t/te)/Q+'
U axial velocity component, u/ue
v radial velocity component, 2Ree(v/ue)
Z axial distance, (z/D)/Re
Z+ axial distance, (z/D)/Reb
Y specific heat ratio, Cp/Cv
E total emissivity
e temperature ratio, (t - b)/(t,- b) P' viscosity, p /pe
P' density, P/Pe
7'W
shear s t r e s s at wall, rwrw/pepe
Subscripts:
b bulk conditions
4 tube centerline conditions
d downstream mixing box conditions
e entry (initial) conditions
FR friction
i inside tube wal l conditions
j node point in axial position
k node point in radial position
4
M momentum
0 outside tube wall conditions
w wal l conditions
NUMERICAL ANALYSIS
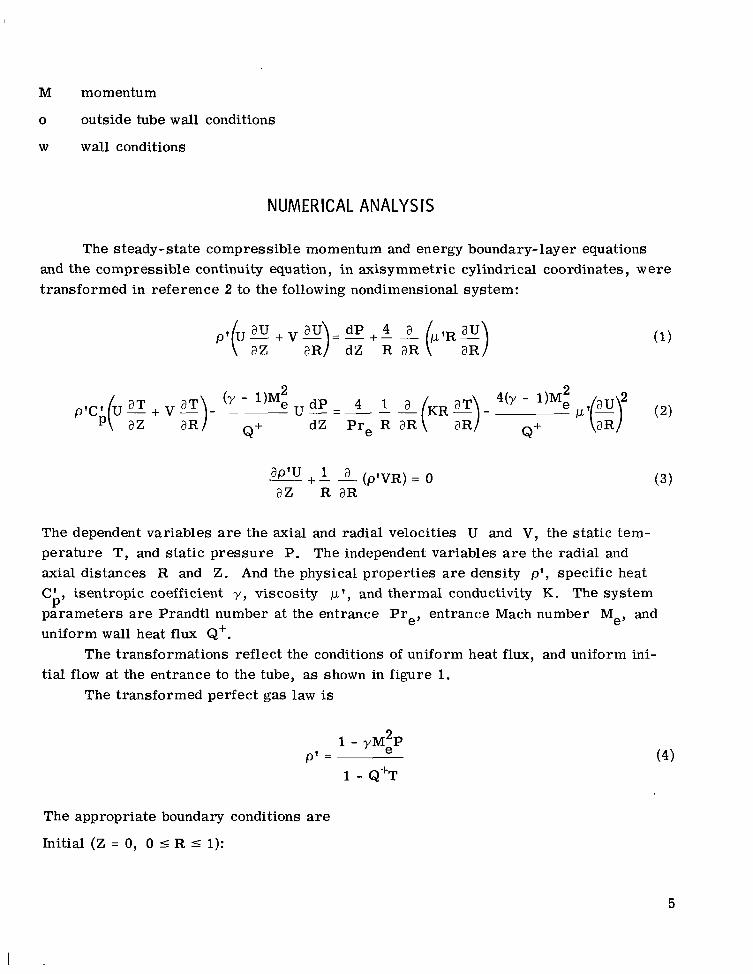
The steady-state compressible momentum and energy boundary-layer equations and the compressible continuity equation, in axisymmetric cylindrical coordinates, were transformed in reference 2 to the following nondimensional system:
ap'u 1 a-+ -- (p'VR) = 0 (3)az R aR
The dependent variables a r e the axial and radial velocities U and V, the static temperature T , and static pressure P. The independent variables are the radial and axial distances R and Z . And the physical properties a r e density p' , specific heat Cb, isentropic coefficient y , viscosity p ' , and thermal conductivity K. The system parameters a r e Prandtl number at the entrance Prey entrance Mach number Me, and uniform wall heat flux Q+.
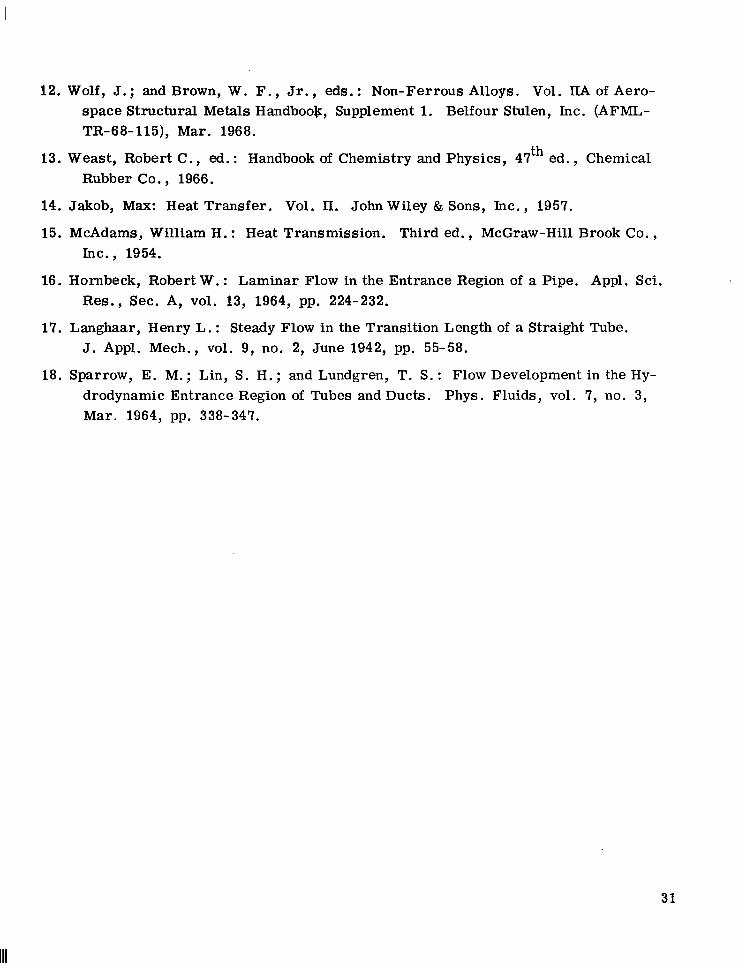
The transformations reflect the conditions of uniform heat flux, and uniform initial flow at the entrance to the tube, as shown in figure 1.
The transformed perfect gas law is
1 - yMeP2 p' = (4)
1 - Q+T
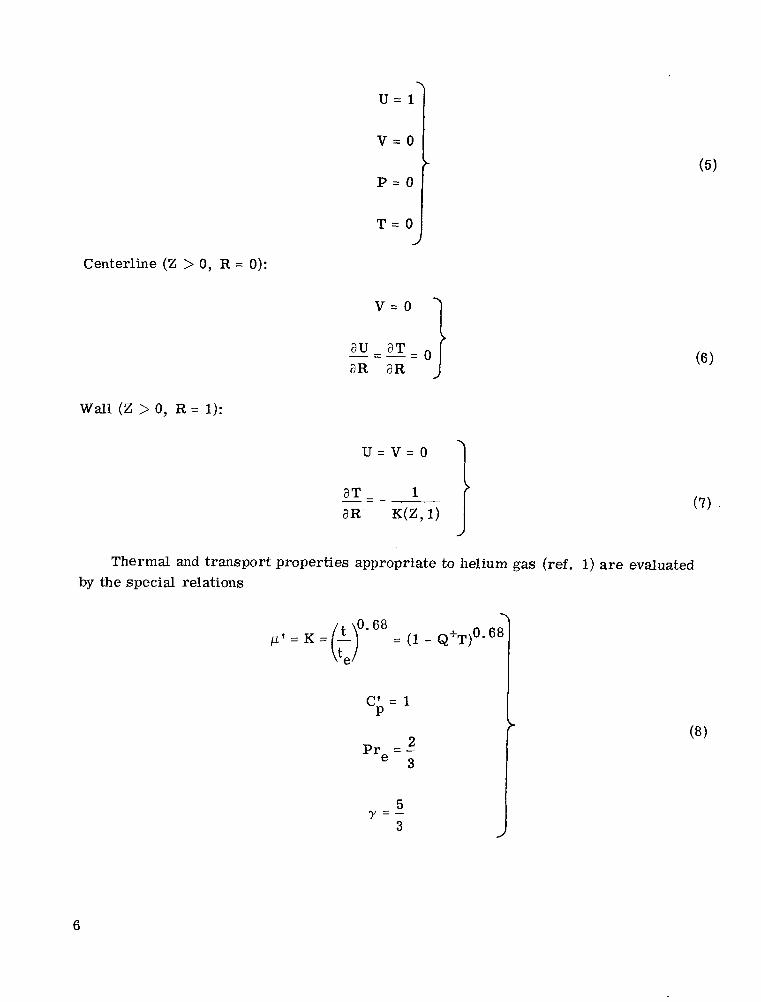
The appropriate boundary conditions a r e
Initial (Z = 0, 0 IR 5 1):
5
- -
P = O
T = O
Centerline ( Z > 0, R = 0):
Wal l (Z > 0, R = 1):
u = v = o
aT - 1-aR. K ( Z , l ) (7)
Thermal and transport properties appropriate to helium gas (ref. 1) are evaluated by the special relations
Pr = -2 e 3
5Y = -
3
6
The numerical solution of the system described above by the marching technique (see appendix) for given Q+ and Me, provides values of U(R,Z), T(R, Z), and P ( Z ) as numerical output. Also included as output are the bulk velocity and temperature, ub(z) and Tb(Z), respectively. From these, the heat- transfer parameter
is immediately calculated, where from equation (8)
(ref. 1). The two friction parameters of interest in this study are obtained from the numer
ical data. The first, based on local wal l shear , is
16T& 4f Reb = 7,b
%'b
where
, - TWrWTw -
eue
The second, based on the overall p ressure change, is
4fpbR% = -2P
u b z +
where Z+ = (z/D)/R% is a dimensionless distance based on bulk Reynolds num Der. The overall static pressure drop is the sum of the drop due to friction and the drop
due to momentum change,
Ap = Apfriction + 'P momentum (14)
7
---
2Divide these t e rms by peue,
~AP - A P +-*PM ~ 2 2 2
PeUe PeUe Peue
The left s ide of equation (15) is the dimensionless pressure P. Then the equation can be written as
where the dimensionless pressure terms on the right have the form (ref. 2)
and
The wal l shear stress in equation (17) is an average over the length Z. The bulk velocities Calculated in the numerical program are used in equation (18) to
calculate the dimensionless momentum pressure drop occurring between the entrance and the local axial position. As the overall static pressure P is also calculated as a function of axial position, the dimensionless friction pressure PFR is immediately calculated from equation (16) for the required local axial positions.
The relative distribution of the friction and momentum pressure drop contributions is immediately given by the ratio PM/PFR.
EXPERIMENTAL INVESTIGATION
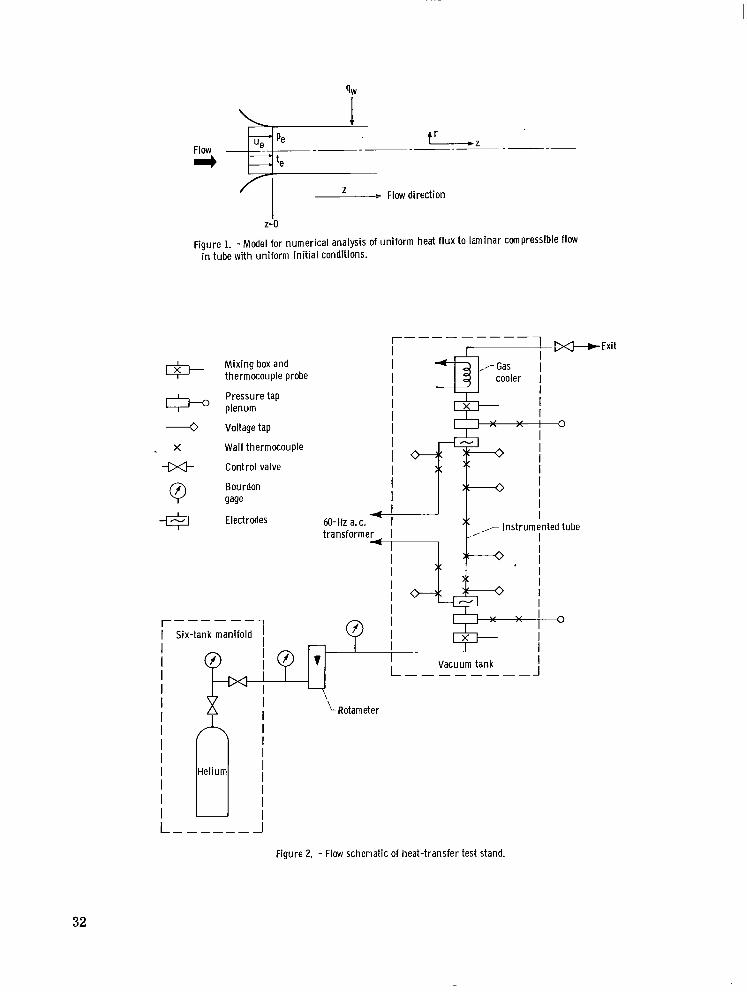
The heat-transfer and pressure drop rig, shown schematically in figure 2, consists essentially of an electrically heated tube mounted vertically in a vacuum chamber.
The vacuum chamber is a vertically mounted steel cylinder, 4 feet ( 1 . 2 m) high and 18 inches (0.46 m) in diameter. The interior was sandblasted to reduce outgassing time. Access to the tank is through an opening 1 2 inches (0.30 m) wide and about
8
4 feet ( 1 . 2 m) long. A flange has an O-ring seal which holds the working vacuum to around 5 microns pressure. The test section is mounted on the inside of the door, which is hinged on the bottom, so that when the door is open the test section is outside the vacuum chamber and is therefore easily accessible.
Flow Measurements
Helium gas from the six-tank manifold is metered through a parallel bank of four rotameters (see fig. 2). Gas pressure at the flowmeters is controlled at' 30 psig (101 000 N/m 2). Primary flow control is by means of valves downstream of the rota-meters. Further control is by means of a valve on the exit s ide of the test section.
The four rotameters were calibrated with helium gas at 45 psia and SOo F. They have maximum flow rates of 0.00030, 0.0027, 0.011, and 0.027 pound per minute
l ~ l O - ~ , and 1 ~ 1 0 - ~( 1 . 1 ~ 1 0 - ~ , 3. T X ~ O - ~ kg/sec). This gives a maximum flow rate with all four tubes at capacity of 0 .041 pound per minute (1. 54X10-6 kg/sec).
Test Section
The test section is constructed of Inconel alloy 600 tubing whose outside diameter is 0.125 inch (0.308cm) and inside diameter is 0.089 inch (0.226 cm). Briefly, the test section 19 inches (48 .2 cm) long between the heating electrodes and 23 inches (58 .4 cm) long between the static pressure taps.
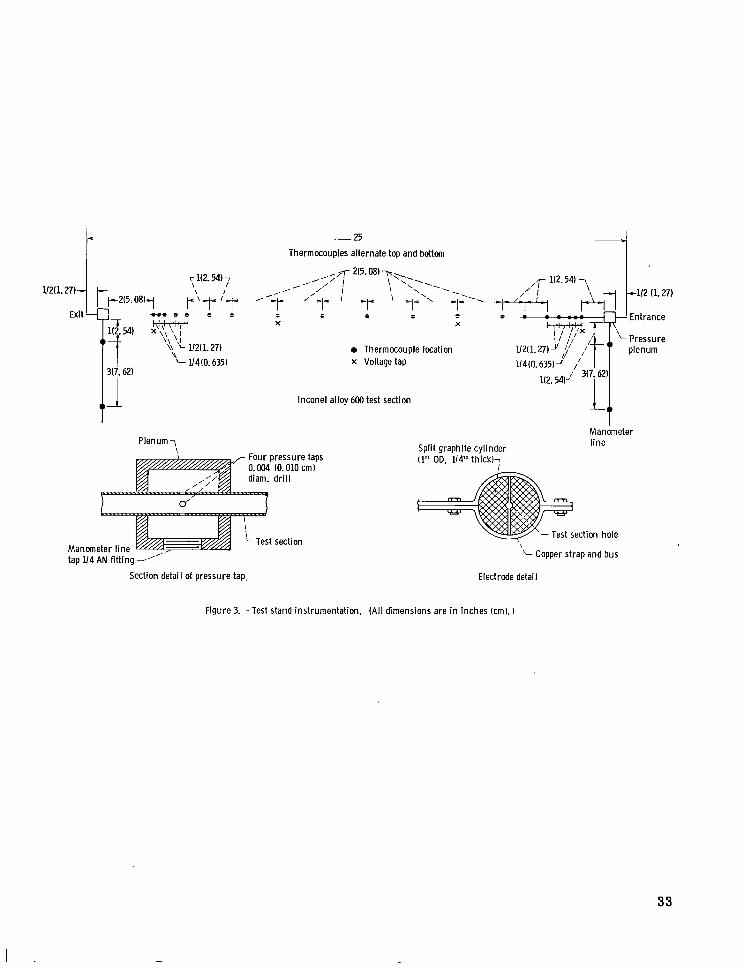
The general dimensions of the instrumented test section are given in figure 3. The plenum chambers for static pressure measurements and the wal l thermocouples, are discussed in the next two instrumentation sections.
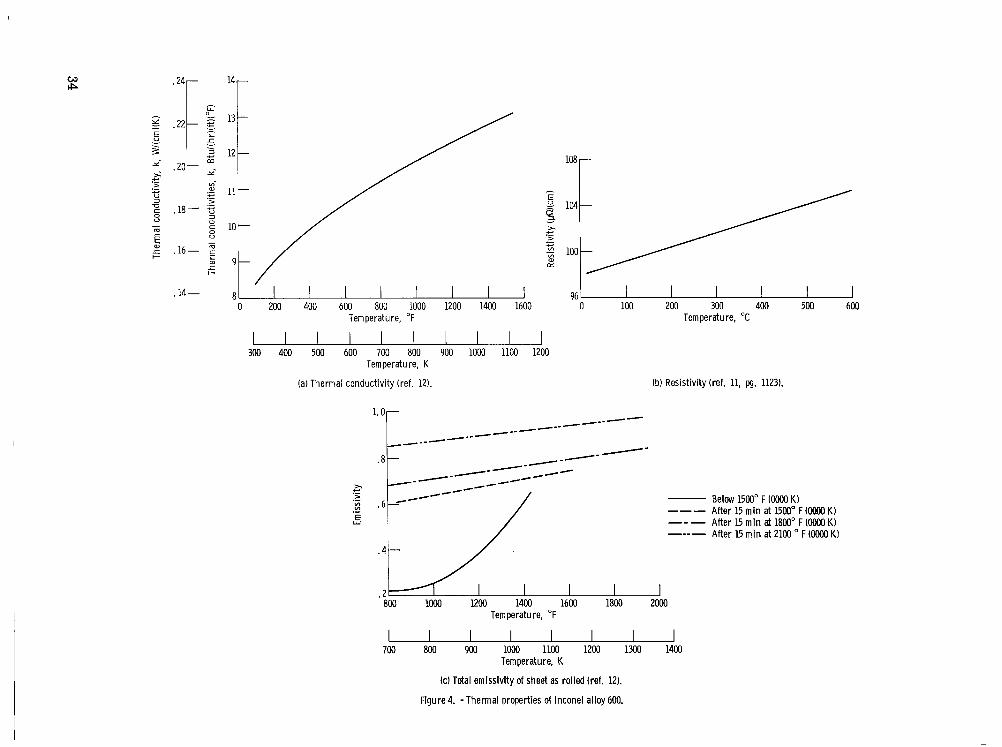
Inconel w a s chosen .because of its fine high temperature strength properties and because its electrical resistance varies but slightly over a wide range of temperatures (ref. 10). Inconel alloy 600 has a liquidus temperature of 2600' F (1692 K ) and a solidus temperature of 2540' F (1669 K ) (ref. 11). The physical properties of Inconel alloy 600 needed for the present study are found in references 10 to 12, and are reproduced in figure 4 for the applicable temperature range.
Pressure Measurements
The static pressure drop of the gas flowing through the heated test section was obtained from the two tap positions at the entrance and exit of the tube, shown in figures
9
2 and 3. Each tap position consists of a cylindrical plenum chamber of 3/4-inch (1.91-cm) diameter Inconel alloy 600 tubing 3/4-inch (1.91-cm) long and welded to the flow tube, with the chamber fed through four 4-mil holes drilled along crossed diameters. The inside of holes were carefully deburred after drilling. Details of the plenum are shown in figure 3.
Pressu re leads of 1/8-inch (0.318-cm) Inconel tubing are connected to the plenum chambers by threaded fittings, and the pressure leads are brought through the vacuum chamber bulkhead with nylon fittings. Outside the vacuum chamber, plastic tubing connects the two pressure leads to a U-tube manometer, 4 feet (1.2 m) long, which can be positioned at Oo, 30°, 45O, and 60' from the vertical. The manometer is half filled with acetylene tetrabromide colored with a red dye. This fluid has a specific gravity of 2.967 (2Oo/4O), has a formula weight of 345.70, and is safe to use (ref. 13 formula e-265, pg. C-308). It se rves well as manometer fluid for uses between water, on one hand, and mercury, on the other.
A second U-tube manometer half filled with mercury is attached in parallel with the tetrabromide manometer for cases when pressure drops are too large for the first manometer. In this case, shutoff valves on the tetrabromide manometer seal it from the system.
Temperature Measurements
Wall temperatures on the test section are obtained from nineteen 24-gage chromelalumel thermocouples, which were spot welded at the positions indicated on figure 3. These thermocouples are positioned alternately 180' around the tube, and are spaced closer together at both the exit and entrance sections where the temperature gradients are steeper. The thermocouple w i r e s are encased in ceramic beads for insulation and thermal shielding.
Figure 3 indicates a pair of thermocouples spot welded 3 inches apart on both the downstream and upstream pressure tap tubing. These thermocouples, installed to measure thermal gradients on the plenum tubine for heat loss calculations, are also encased in ceramic beads.
The two copper bus bars connecting the power to the Inconel test section within the vacuum enclosure also have a pair of chromel-alumel thermocouples spotted on them f o r the same purpose of measuring the thermal gradients. On the upstream bus, the couples are placed 8 inches (20.3 cm) apart, while on the downstream bus the couples are 12 inches (30.48 cm) apart.
Upstream and downstream mixing box temperatures are measured with Inconel sheathed chromel-alumel thermocouple probes inserted at right angles to the gas flow
10
in the mixing cans. A sheathed thermocouple probe is similarly placed in the plenum chamber of the rotameters in order to measure the flow temperatures for correcting the indicated flow.
All thermocouple leads are brought through the vacuum tank bulkhead in sealed couplings and then to switching boxes outside the tank. Temperatures were recorded on flight recorder charts and monitored on a self-balancing potentiometer. The mixing box temperature difference is also checked with a precision laboratory potentiometer.
Voltage and C u r r e n t Measurements
The current fed to the test section is measured with a precision milliammeter connected to a current transformer with a step-down ratio of 240:l. Voltages at the s ix taps w e r e measured with calibrated laboratory voltmeters.
DATA REDUCTION
The experimental program provides the following output: (1)Test section wall temperatures (2) Mixing box probe temperatures (3) Temperature gradients on the bus bars and the two plenum leads (4) Mass flow rate of helium through the test section (5) Electrical current in the test section (6) Voltage drops across the test section and the graphite electrodes (7)Pressure at the entrance to the test section and total p ressure drop across the
working section The first concern in data reduction is that of overall heat balance. Fo r this the
total energy input rate is the sum of the wattage in the test section and the wattage in the graphite electrodes.
-Qtotal input - Q test section + Qelectrodes
These wattages are obtained from the measured current and voltages of the appropriate taps .
Energy losses to the environment are the radiation flux from the heated test section and the conduction losses in the bus bars, in the plenum leads, and out the two ends of the test section.
11
-Qloss, total - ‘rad + Qbus + Qplenum + %be end
The heat balance then equates the net heat input with the temperature rise between the mixing boxes.
Qnet = Qtotal input - Qtotal losses zwc (t - te)P d
The losses consist of all heat not used to raise the gas temperature, as indicated in equation (20). The preceding equality, of course, is rarely achieved in a heat-transfer experiment because of the uncertainties in the laboratory meters. However, this calculation must be performed as a check to give confidence in the calculation of the local net heat flux used in later heat-transfer correlations.
~nthe heat loss calculations, the conduction t e rms Qbus, Qplenum, and Qhbe end are calculated f rom
where the thermal conductivity k is appropriate to the metal under consideration, A is the cross sectional area normal to the direction of heat flux, and At/AL is the temperature gradient obtained from the pair of thermocouples spaced L units apart (for the plenum and bus bars) or the gradient obtained from the test section wall temperatures. For the present experiment, conduction along the Inconel tubing (i.e., the test section and plenum leads) is no more than 1percent of the total losses. This is due to the low thermal conductivity of Inconel (fig. 4(a)) and the very small cross section of the tubing.
Heat loss due to radiation from the test section to the inner wall is essentially radiation between concentric cylinders, infinitely long, of which the area of the outer cylinder (vacuum tank) is essentially infinite in value compared with the radiating surface of the small inner cylinder (test section). For this extreme but appropriate case, the net radiation exchange for diffuse radiation is given by (ref. 14, pg. 4, eq. (31-9))
where the flux is based on unit area of the outer surface of the tube, the temperatures are absolute, u is the Stefan-Boltzmann constant, and E is the emissivity factor of the
12
heated test section. Since the tube temperature varies along the length from inlet to outlet, the total radiation heat loss is the integral
Qtotal rad = 2sro iL dx
along the tube length. W e know the tube temperature, however, only at 19 positions on the heated portion (fig. 3). We therefore replace the integral by the summation over n incremental areas
Qtotal rad =cQrad, J.(j = 1, . . .,19) J
where
H e r e
qrad, J. = -
where the enclosure temperature w a s at 311 K (560' R), and t.J is the absolute tube temperature at the jth thermocouple. The incremental area &I.(=
J 2sro AL.)is taken
J s o that the thermocouple is at the midpoint of the small length AL
j .The emissivity of a heated tube is a complicated function of temperature, surface
conditions (smoothness, degree of oxidation) and previous metals history such as annealing. Data on emissivity of Inconel alloy 600 is collected in reference 12 and is reproduced in figure 4(c). The experimental runs reported herein were conducted at wall temperatures less than 867 K ( l l O O o F), and thus the solid lower curve in figure 4(c) seems appropriate to this calculation. However, an emissivity value of 0.4 is chosen to represent the tube for these data at all tube positions. The choice of this value was arrived at from trial heat balances starting with emissivity values 0.2. The higher value of 0.4 gave good balances for all experimental runs. It appears that the aging process, which produces the almost constant and la rger emissivities shown in fig
13
u r e 4(c), also affected our test section in its many hours of heating at temperatures of 800 K and lower. This is probably the physical reason underlying the constant (and empirically determined) emissivity of 0.4.
The practical equation fo r radiation loss to be used for the present data reduction is
where ro = 0.125 inch (0 .315 cm); L = 19 inches (48 .3 cm); tencl = 560' R (311 K); E = 0.4; and u = 5. 73X10-l2 watts per square centimeter per K4.
The total radiation loss calculated by the preceding technique, along with the conduction losses f rom the bus bars, are the total losses Qloss used in computing the net heat input of equation (21).
The local net heat flux needed for computing the local Nusselt numbers are obtained from
for the incremental areas AAinner,] .(= rri AL.) and AAouter,]..(= n r o AL.) containingJ J
the jth thermocouple. Here the first te rm on the right hand s ide of equation (20) is the electrical energy dissipated in the tube in the volume contained in the length AL
j' Thus
is the expression used to directly compute the heat flux need in the Nusselt number. The temperature drop across the thin tube wall is calculated by equation (2 .14-d) of
reference 15. The most severe drop occurs when the outer surface is perfectly insulated. In this special case, and for the heat input rates of the present work, the maximum temperature drop across the tube wal l is in the order of 1 K, which is negligible f o r this study. Consequently, the wall temperature used in the heat transfer calculations are the indicated recorder temperatures.
The local bulk Nusselt numbers may now be computed at each of the j thermocouple positions using the net heat flux from equation (30):
14
Nub = 2ri%et, j
j - %)Ij
At each thermocouple position j , the local bulk Reynolds number is, from its definition,
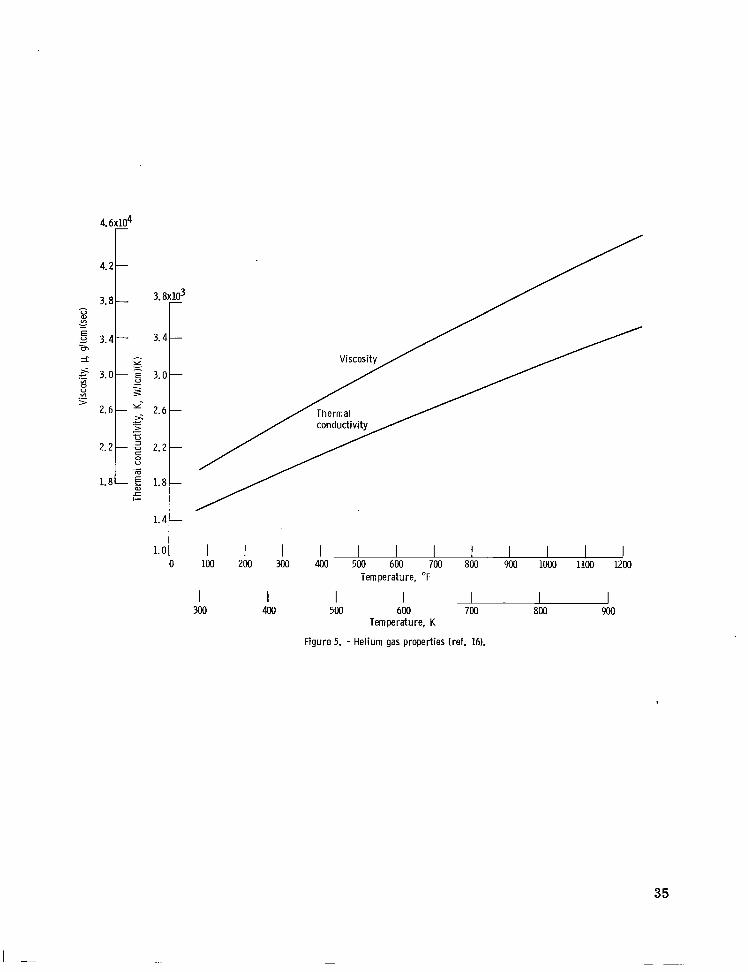
In equations (31) and (32) the values of the helium thermal conductivity kb and viscosity pb are determined at the local bulk temperature $, from the transport property data of reference 16, which is also plotted in figure 5.
RESULTS AND DISCUSSION
Analytical
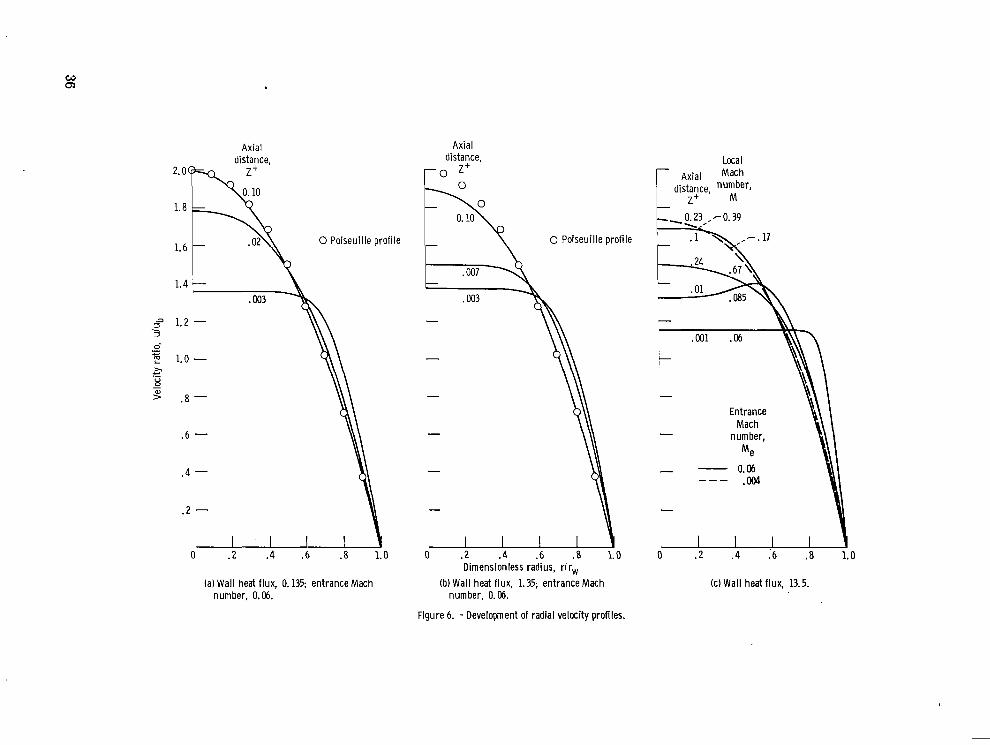
The system of equations and boundary conditions (1)to (8) are solved numerically by a marching technique (see appendix) for radial variations of U and T, and for axial variations in U, T, and P. From the solutions the Nusselt numbers and friction factors , equations (9), (11) and (13), are obtained as a function of position along the tube. Calculations are carried out for values of initial Mach number of 0.0005, 0.004, and 0.06, and of the heat flux parameter Q+ = 0.135, 1.35, 13.5 and 27.0. Numerical results of axial velocity profiles for several axial positions, initial Mach numbers, and heat flux parameters, are shown in figure 6.
Hornbeck (ref. 17) shows the velocity profile development from initial uniform conditions fo r constant property fluids to the fully developed parabolic (Poiseuille) profile at values of Z+ - 0.1. This orderly profile development becomes distorted for flows of compressible fluids (variable density) with heat-induced acceleration. In the entrance regions of the tube this distortion is observed in large fluid acceleration near the wall , resulting at higher heat inputs in velocity "overshoot, '' that is, velocities near the wall exceeding the centerline velocity. Comparison of figures 6(a) to (d) shows that the acceleration overshoot distortion changes from an unobservable contribution at the low Q+ = 0.135 to a large contribution around Z+ - 0.01 for the high Q+ = 27.0.
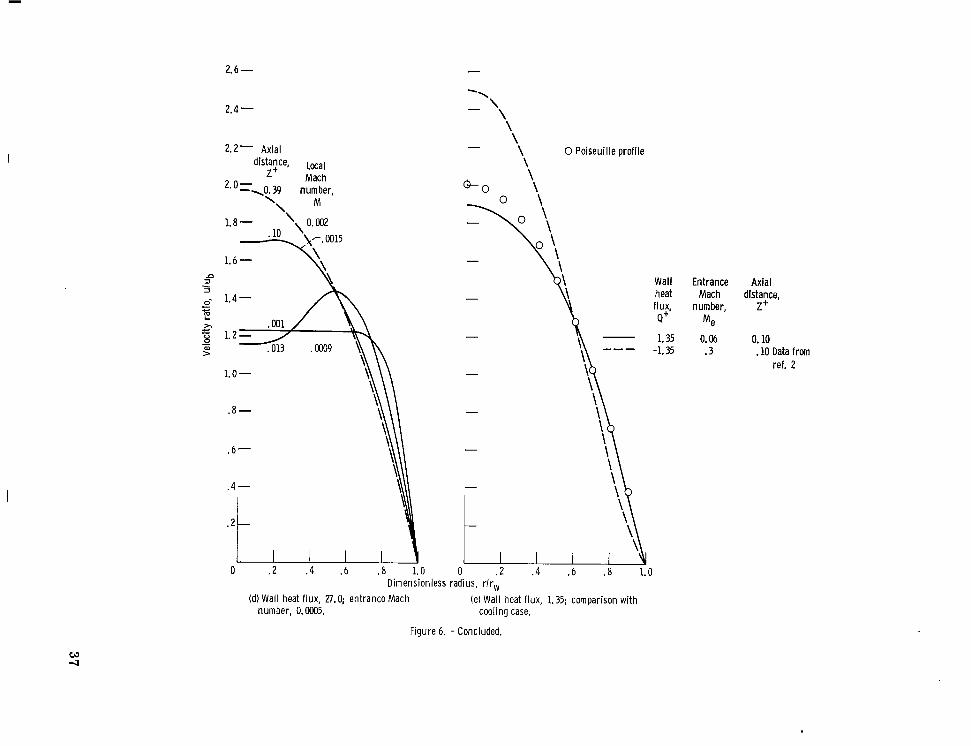
The overshoot distortion is smoothed out in the downstream sections of the tube; but the effects of near-wall acceleration remain, which prohibit a t rue fully developed flow (parabolic profile) from being obtained (figs. 6(c) to (d)).
15
The resulting bluntness of the downstream velocity profile, caused by heat-induced acceleration, is exactly opposite the predicted heat-transfer effect on the velocity profiles as cited in references 3 and 15 (fig. 9.16). The pioneer work of reference 3 assumed a fully developed'flow ; this condition eliminated t ransverse velocity V and axial velocity gradient aU/aZ from the momentum equation to be solved. Thus the heat transfer affected the flow only through the temperature variation of the fluid viscosity and thermal conductivity. F o r gases this implies a profile that is blunter than parabolic for cooling, and a profile that is more peaked ( u 4 p b > 2.0) than parabolic for heating. The actual profiles are shown in figure 6(e) for the two cases Q+ = 1.35 and Q' = -1.35. The cooling data are from reference 2.
There is a Mach number effect which intrudes only in figure 6(c) and which also has a decided flattening effect on the velocity profiles as the local bulk Mach numbers exceed 0 .5 and the flow proceeds to choking. F o r nearly the same Z+ the profile at local Mach number of 0.67 is much blunter than the profile at Mach number 0.39. Flow changes are occurring very rapidly in this region. No further results for this inter-resting effect are available because of limitations in the computational programs at the higher subsonic Mach numbers.
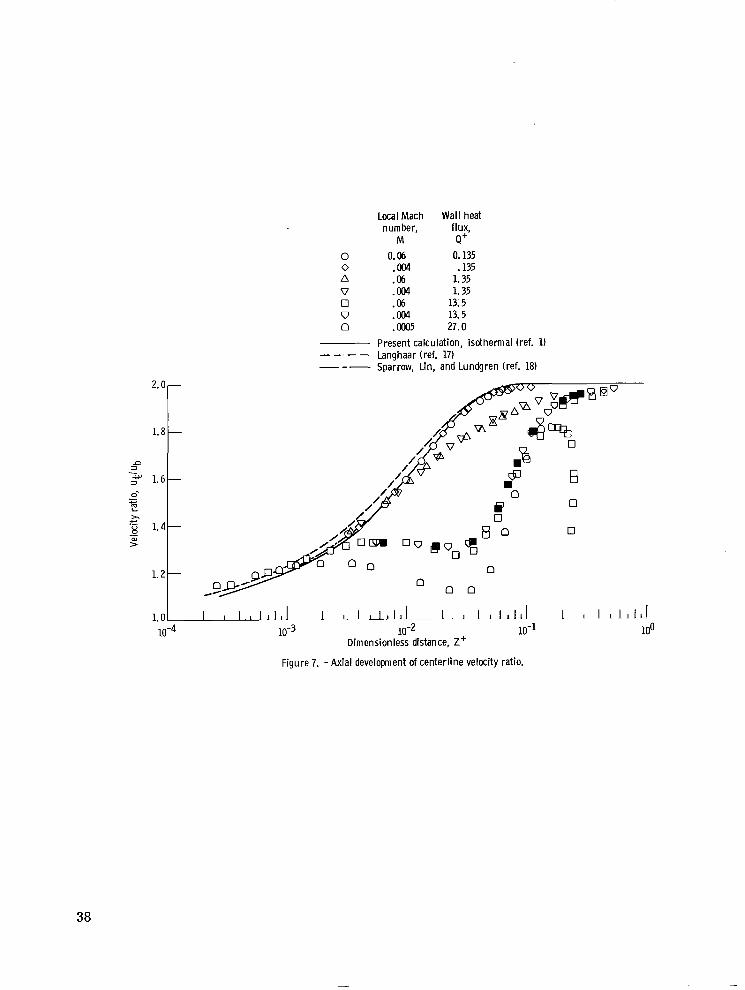
Heating rate effect on velocities near the wal l is shown in another way in figure 7, where the centerline- to bulk-velocity ratio development with axial distance is plotted with Q+ as parameter. Isothermal analyses for flow developing from an initial slug profile (refs. 1, 18, and 19) are plotted for comparison. The limit of u+/ub of 2.0 represents fully developed Poiseuille laminar flow. There is but little deviation from the isothermal curve for the low Q+ = 0.135 case. F o r Q+ = 1.35, profile development follows isothermal up to Z + 2 0.01 where the velocity overshoot in the wall region begins to reduce the quantity of flow in the center region of the tube, resulting in the reduced u+/ub and the longer approach to Poiseuille limit. There is much greater deviation for &+ = 13.5 and 27.0, and overshoot effect begins much sooner, at around Z + 0.001. At the highest heating rates, there is a minimum ratio around Z+ = 0.03. This means that, while the bulk and centerline velocity both increase under heating, relatively more flow is carried in the wall overshoot region than in the center portion of the tube in the region 0.001 < Z+ < 0.005.
The decrease in the u+/ub ratio for Q+ = 13.5 and Me = 0.06 in the region of Z + > 0.10 is due, as mentioned ear l ier , to the flattening of the profile in the upper subsonic Mach number regime.
The inclusion of variable density and inertia- convective te rms in the numerical boundary-layer heat- transfer analysis has yielded the unusual acceleration effects on axial velocity development which are shown in figures 6 and 7. Temperature profiles suffer a s imilar distortion from the same causes.
16
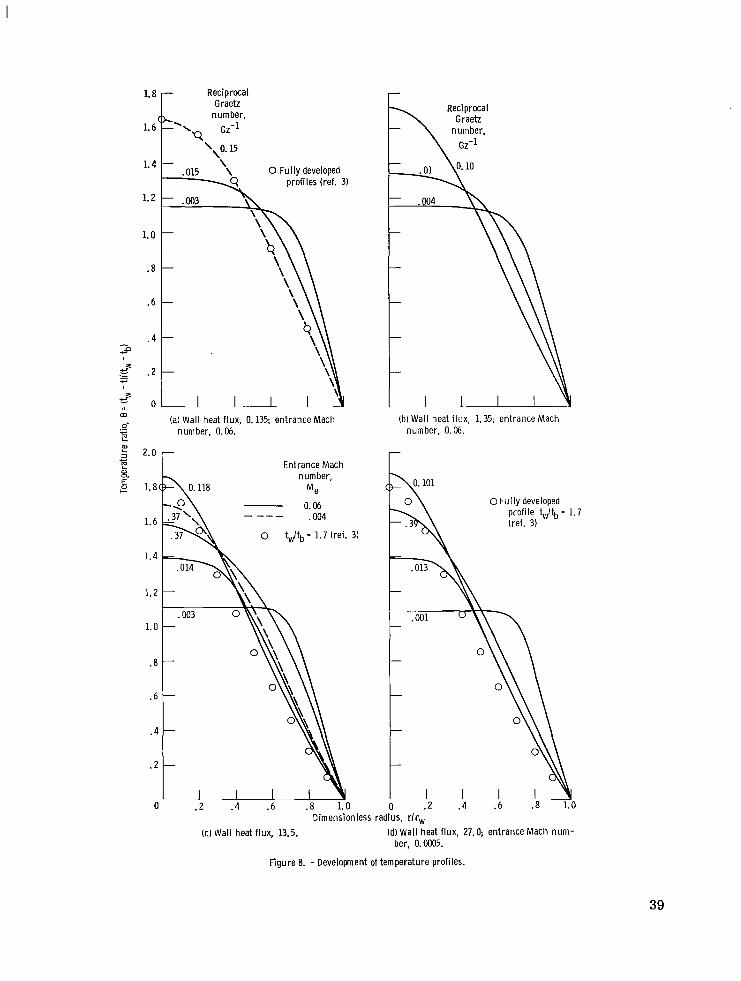
The intensity of acceleration effects on both T(Z,R) and U(Z,R) is directly related to the heat flux level Q+, and this result is apparent for the dimensionless temperatures in figure 8 where there is a progressive 200-fold increase in the wal l heat flux. The following qualitative discussion of the acceleration effect on the variable 8 is applicable to gas flows at all heat flux levels, but it is most graphically illustrated at the highest flux in figure 8(d).
In the entrance portion of the tube, the accelerating gas in the wal l region convects most of the heat flux from the wall; the central bulk of the flow remains at constant temperature up to axial lengths of about Gz" - 0.01.
Downstream of this Gz-l position, heat flux penetrates to the centerline of the tube. However, the continuing heat-induced acceleration of the gas flow finally produces temperature profiles in the usually fully developed tube regions that are blunter than the classical results of reference 3. The profiles in the latter work w e r e calculated using realist ic gas transport properties, but without the disturbing effect of axial velocity gradients which are associated with the radial convection that mixes the central bulk of the flow.
The result from reference 3 which is plotted on figure 8(d) for purpose of comparison is at the value of tW/$ = 1.7; this corresponds to Gz-l = 0.07 in the present case of Q + = 27.0.
The deviation of the present results from reference 3 is rather opposite to that classical prediction in that the downstream blunt profiles in figure 8 are s imilar to the cooling heat transfer cases of the earlier work. There, with the absence of radial convection, cold gas at the wal l sustained a large radial temperature gradient (due to low thermal conductivity), but the interior flow showed a rather blunt temperature profile, that is, with shallow curvature, because of the higher thermal conductivity of the warmer gas.
In figure 8(c), for Q+ = 13.5, the additional effect of high subsonic Mach number becomes apparent in the difference in the curves for the same Gz-' = 0.37 but with different initial Mach numbers. The solid curve for Gz-l = 0.37 has a local bulk Mach number of about 0.67, the same as the velocity curve in figure 6(d).
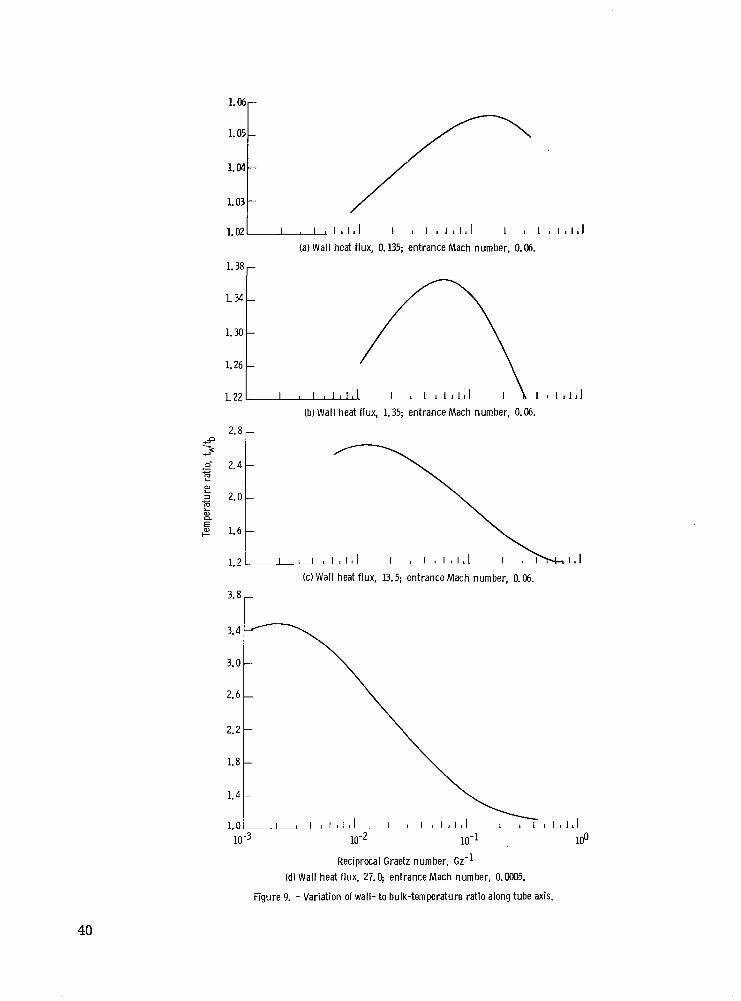
Since wall-to-bulk temperature ratios have been used as parameters in correlating high temperature heat transfer data (ref. 8) it is interesting to observe the variation of that ratio with axial distance. Figure 9 details tine development in ascending values of the heat parameter Q+. In all cases, the wal l temperatures are close to the bulk temperatures in the immediate region of the tube entrance, which is due to mixing from the very high convection where the wall velocity gradients are very steep, and also to conduction caused by steep local temperature gradients. Far ther down the tube, the developing velocities give rise to substantial wall-to-bulk temperature differences and, hence, increasing temperature ratios. With the approach to a fully developed condition
17
the wall-to-bulk temperature difference becomes almost a constant. However, the simultaneous and approximately equal rise in wall and bulk temperature implies that the ratio of absolute temperatures approaches a value of unity as a limit.
All the numerical cases in figure 9 show a maximum in tw/h,the value of which increases with increasing &+. The position of the maximum on the GL1 axis decreases with increasing values of the heat parameter &+. This inverse relation between &+ and axial position of maximum temperature ratio simply reflects the influence of the more rapid rise of tw and \, and the la rger tw - $, difference at higher wall heat fluxes.
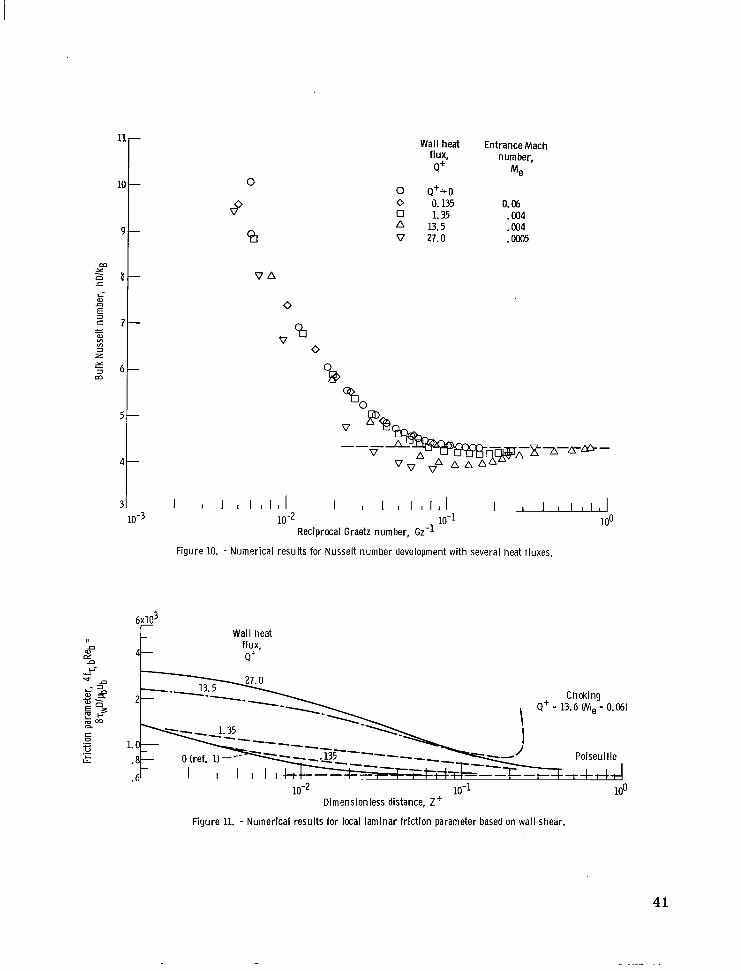
Numerical results for the Nusselt number in developing flow are shown in figure 10. These cases are all for low values of initial Mach number, s o there is no choking or near choking effects in these data. The most interesting result of these calculations is the insensitivity of the fully developed Nusselt number to the level of wall heat flux. Even for values of Q+ = 1 3 . 5 and 27.0, the Nusselt numbers approach the classical uniform heat flux Nub = 48/11 as Gz-l - 00 (ref. 15, p. 239). This result contrasts sharply with the cooling heat-transfer behavior of helium in reference 2, where the fully developed Nusselt number was about 75 percent higher than classical uniform heat flux value.
The laminar friction parameters of equations (11) and (13) are shown in figures 11 and 12, respectively, as development with axial distance. The shear friction parameter in figure 11 is strongly influenced in the entrance region by the level of the heat flux parameter Q+. This is a result of the fluid velocity overshoot near the wall , as in indicated in figure 7. The steep velocity gradients in the entrance wall region naturally give r i se to large wall shear.
The low Q+ cases and the adiabatic results f rom reference 1 approach the fully developed Poiseuille value of 4f7, b"% = 64. The higher &+ cases could approach a slightly higher asymptotic value of, perhaps 68. Because of excessive computer time needed, these calculations were not carried out quite far enough to definitely establish such a value.
Both the Q+ = 13. 5 and 27 .0 cases give identical friction parameter values for Z + > 0 . 1 0 when the initial Mach numbers are very low. For a Me = 0.06 , however, the Q+ = 13 .5 case exhibits a choking effect when Z > 0. 2. This result was first reported in reference 1 and is due to the steepening of the velocity profile near the wa l l fo r the high subsonic flows. This profile development is shown in figure 6(d).
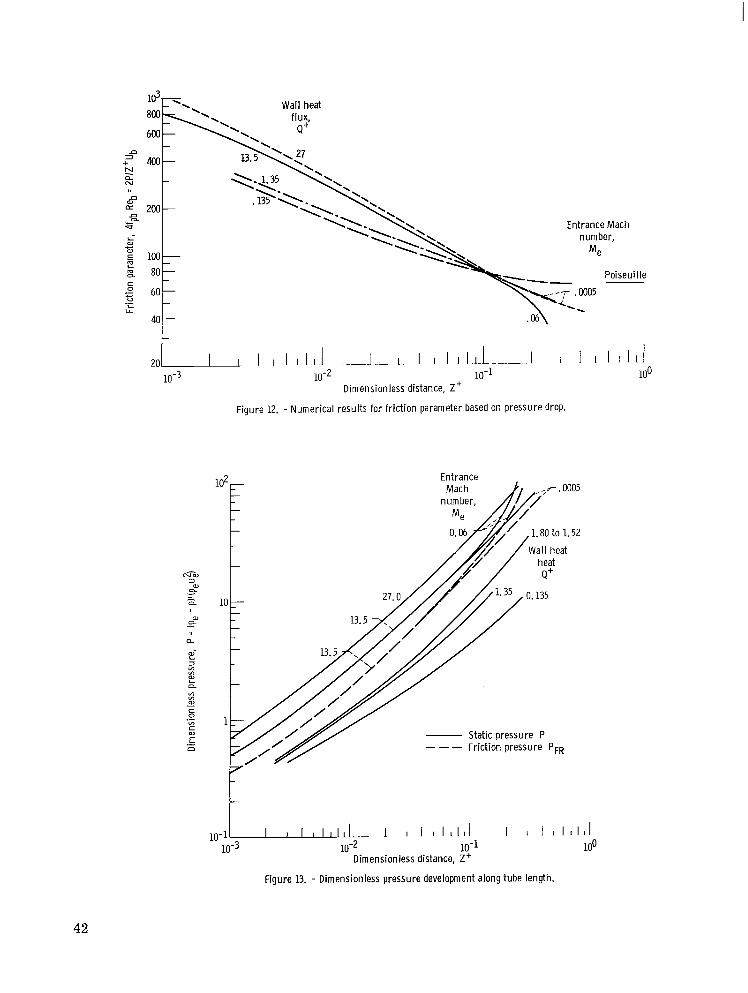
The friction parameter 4fp ,bRe
b , based on the pressure drop from the tube en
trance to the local Z+ position, is shown in figure 12 for the four Q+ values. The low Q+ cases approach the fully developed Poiseuille l imit of 4f
P,bRe
b = 64. The higher Q+
cases seem to approach an asymptote of 40, but its more precise value is also not established because the calculations were not carried out for larger Z+ because of the
18
excessive computer time required. The pressure drop friction parameter for Q+ = 13.5 and Me = 0.06 dips sharply for values of Z+ > 0.2 which, again, is the region of high subsonic Mach number effect.
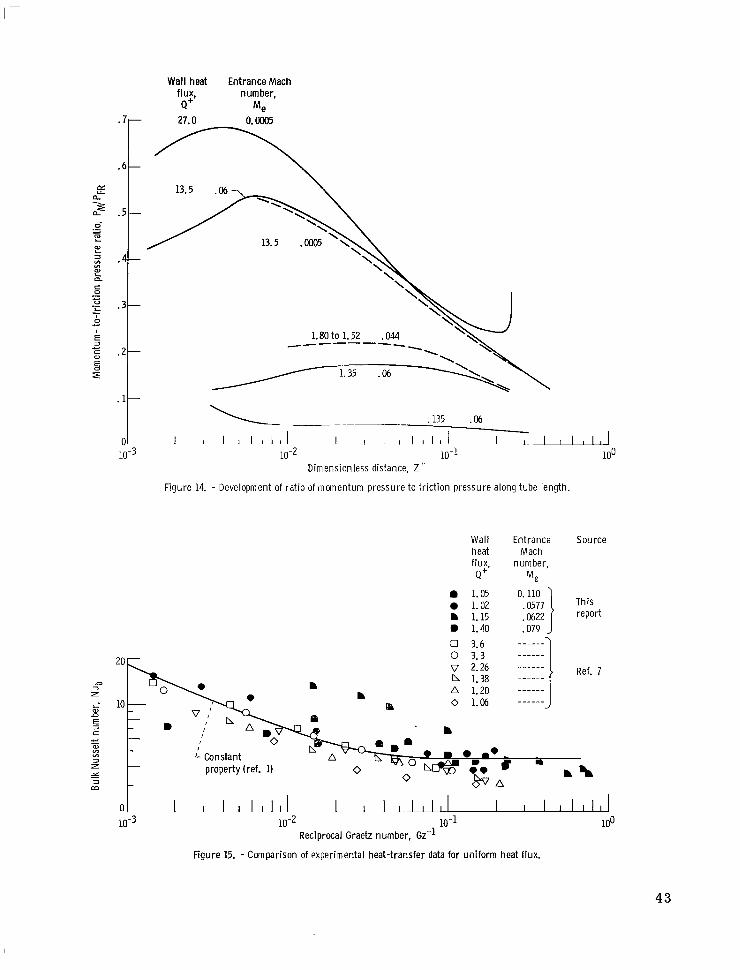
The dimensionless pressure drop P used to calculate 4f Re in the previous figure, is shown in figure 13 as a development with axial distak: zb. and with Q+ as parameter. F o r the higher heating case Q+ = 13.5, the friction pressure drop PFR is also detailed. This was calculated f rom equations (16) and (18) in the manner described in the theory section of this report. Two cases for Q+ = 13. 5 are shown, with Me = 0.0005 and 0.06. For Me = 0.06, the choking effect is again seen at the upper Z+ l imits of the calculation. Figure 13 is useful for obtaining the theoretical P values needed fo r comparison with experimental p ressure drop data.
The relative distribution of momentum and friction pressure drops, shown in figu r e 14 as PM/PFR against Z+, is a sensitive indicator of the changes in the velocity profiles along the tube axis. This is most t rue at the higher heat fluxed Q+ = 13. 5 and 27.0. The very steep velocity gradients at tube entrance, as noted previously, produce high wal l shear stress which overwhelms in magnitude the PM from the small rise in bulk velocity in that region.
Exper imental
Experimental and analytical results for heat transfer and shear friction are compared in figures 15 and 16, respectively. In figure 15, experimental local Nusselt numbers from the present study, and also helium data from reference 7, are plotted along with the numerical adiabatic line for developing uniform heat flux case. The first 10 percent of the tube length are more sensitive to thermocouple e r r o r s because the wal l - to bulk-temperature differences are small , especially relative to the fully developed values. Scatter in experimental data is much less pronounced in the downstream tube sections, which is demonstrated by the maximum &25percent deviation of the data around the asymptotic value Nub = 48/11 f o r la rge Z+ (ref. 1). Such deviation is acceptable in laminar heat-transfer experiments (ref. 7), and w e therefore conclude that measurement and data reduction of variables such as mass flow, temperatures, and net heat flux, are correct.
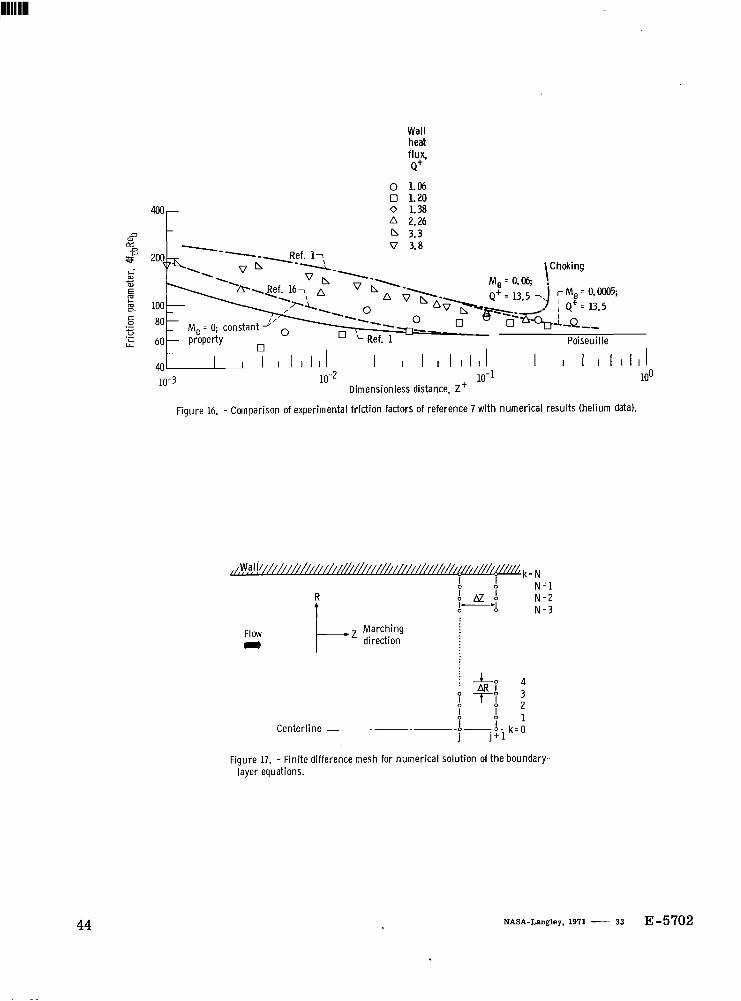
No local wal l shear values were obtained in the present experiment. However, Davenport (ref. 7) reported local friction factors for his heat-transfer experiments with helium gas. H i s values, based on local bulk conditions, are plotted on figure 16, and they are compared with analytical results for adiabatic case (Q+ = 0) and for one high heat flux case (Q+ = 13.5) both of which also appear in figure 11. The experimental friction parameters have the most sca t te r in the entrance region (Z+ < 0.04 for most
19
runs). This is where determination of the axial pressure gradient (needed for calculation of the local wall shear stress from pressure tap data) is most inaccurate. In the downstream regions of the tube, the experimental friction parameters seem to converge in the l imit to the analytical prediction.
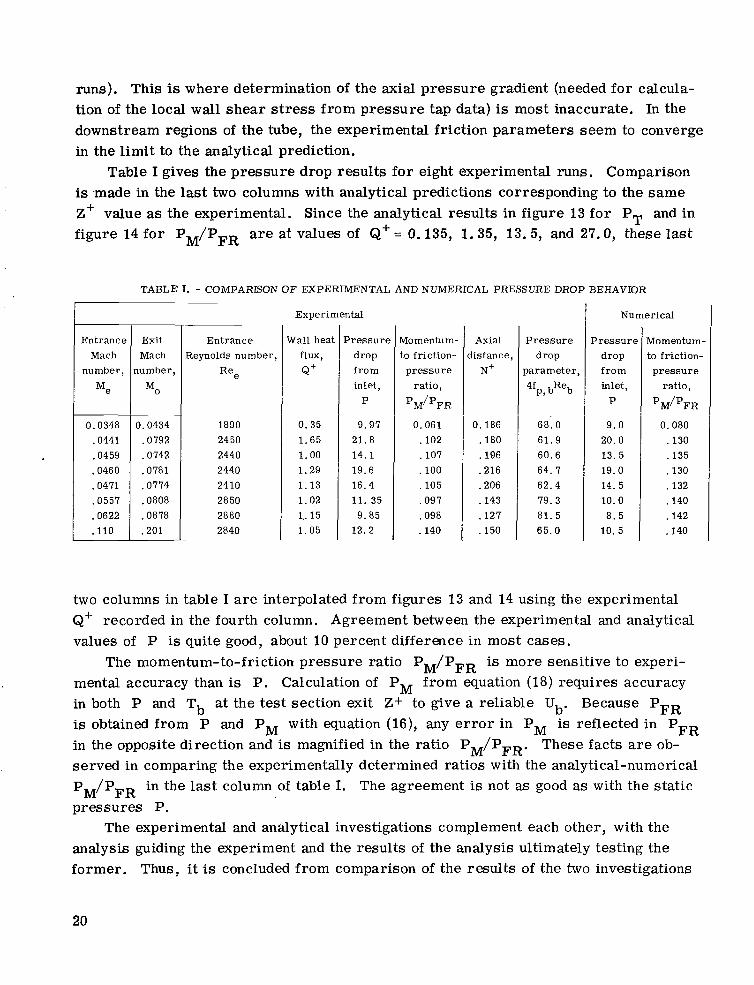
Table I gives the pressure drop results for eight experimental runs. Comparison is made in the last two columns with analytical predictions corresponding to the same Z+ value as the experimental. Since the analytical results in figure 13 fo r PT and in figure 14 for PM/PFR are at values of Q+ = 0.135, 1 .35 , 13.5, and 27.0, these last
TABLE I. - COMPAREON O F EXPERIMENTAL AND NUMERICAL PRESSURE DROP BEHAVIOR
Experimental I Entrance Exit Entrance Ball heat Pressure
Mach Mach Reynolds number, flux, d rop number, number, Ree Q+ f rom
Me Mo inlet, P
1890 0.35 9.97 2450 1 .65 21.8 2440 1.00 14.1 2440 1.29 19.6 2410 1.13 16 .4 2850 1.02 1 1 . 3 5 2880 1.. 15 9 .85 2840 1.05 12.2
Numerical
Momentum- Axial P r e s s u r e Press u rE Momentum-to friction- Iistance, d rop drop to friction-p res su re N+ parameter, f rom p res su re
PM’PFR P P M / ~ F R
0.061 0.186 68.0 9 . 0 0.080 . l o 2 .180 6 1 . 9 20.0 .130 . l o 7 .196 60.6 13. 5 .135 . l o o .216 64. 7 19.0 .130 ,105 .206 62.4 14.5 .132 .097 .143 79.3 10.0 , 1 4 0 .098 . I 2 7 81. 5 8 . 5 .142 .140 .150 65.0 1 0 . 5 . 140
ratio, 4fp,bReb inlet, ratio,
two columns in table I are interpolated from figures 13 and 14 using the experimental Q+ recorded in the fourth column. Agreement between the experimental and analytical values of P is quite good, about 10 percent difference in most cases.
The momentum-to-friction pressure ratio PM/PFR is more sensitive to experimental accuracy than is P. Calculation of PM from equation (18) requires accuracy in both P and Tb at the test section exit Z+ to give a reliable Ub. Because PFR is obtained from P and PM with equation (16), any e r r o r in PM is reflected in PFR in the opposite direction and is magnified in the ratio PM/PFR. These facts are observed in comparing the experimentally determined ratios with the analytical-numerical PM/PFR in the last column of table I. The agreement is not as good as with the static pressures P.
The experimental and analytical investigations complement each other, with the analysis guiding the experiment and the results of the analysis ultimately testing the former. Thus, it is concluded from comparison of the results of the two investigations
20
that the numerical marching solution of the compressible boundary-layer equations for flow in tubes gives realistic development of heat-transfer and pressure functions for the subsonic region.
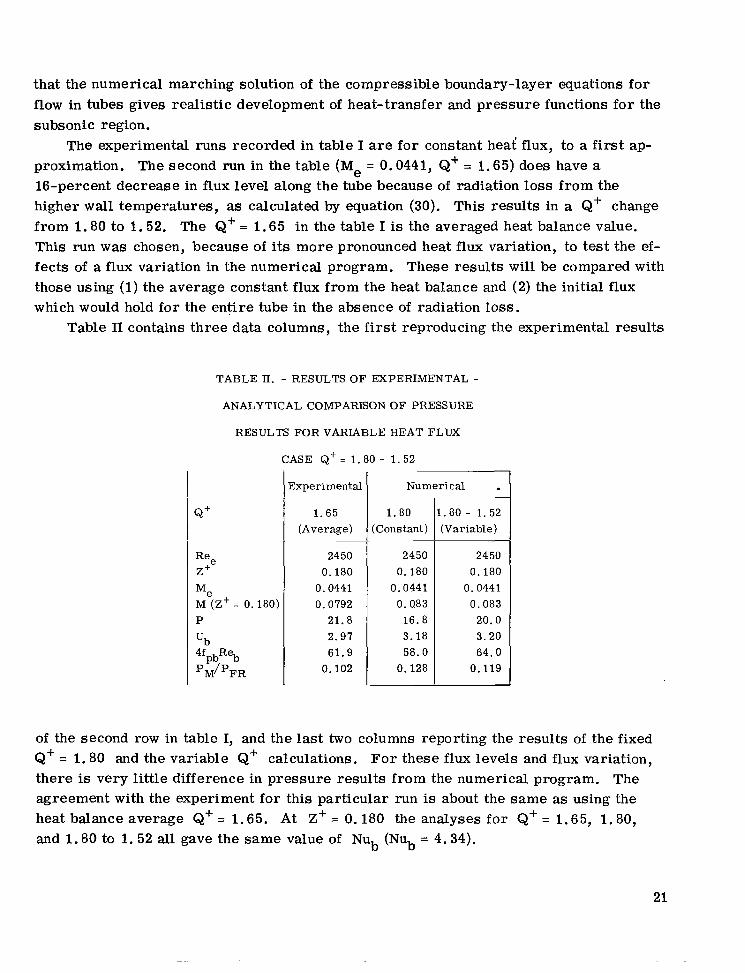
The experimental runs recorded in table I are for constant heaf flux, to a first approximation. The second run in the table (Me = 0.0441, Q' = 1.65) does have a 16-percent decrease in flux level along the tube because of radiation loss from the higher wal l temperatures, as calculated by equation (30). This results in a Q+ change from 1.80 to 1.52. The Q+ = 1.65 in the table I is the averaged heat balance value. This run w a s chosen, because of its more pronounced heat flux variation, to test the effects of a flux variation in the numerical program. These results will be compared with those using (1)the average constant flux from the heat balance and (2) the initial flux which would hold for the entire tube in the absence of radiation loss.
Table I1 contains three data columns, the first reproducing the experimental results
TABLE II. - RESULTS O F EXPERIMENTAL -
ANALYTICAL COMPARISON OF PRESSURE
RESULTS F O R VARIABLE HEAT FLUX
CASE Q+ = 1.80 - 1.52
Sxper imenta l N u m e r i c a l . 1.65 1.80 .80 - 1.52
I1 &+ (Average ) (Cons tan t ) (Var i ab le )
~
2450 2450 24 50
I z e ( Z + = 0.180) 0.0441 0.0792
0.0441 0.083
0.0441 0.083
I P 21.8 16.8 20.0 2.97 3.18 3.20 61.9 58.0 64.0
0.102 0.128 0.119
0.180 0.180 0.180
of the second row in table I, and the last two columns reporting the results of the fixed Q+ = 1.80 and the variable Q+ calculations. For these flux levels and flux variation, there is very little difference in pressure results from the numerical program. The agreement with the experiment for this particular run is about the same as using the heat balance average Q+ = 1.65. At Z + = 0.180 the analyses for Q+ = 1.65, 1.80, and 1.80 to 1.52 all gave the same value of Nub (Nub = 4.34).
CONCLUSIONS
The laminar, compressible, viscous flow in a uniformly heated tube was investigated both by numerical analysis and experiment. The flow of the gas entered the tube with uniform velocity and temperature and at low subsonic Mach numbers. The results may be summarized as follows:
Analytical
1. F o r any level of uniform wall heat flux, the local bulk Nusselt numbers exhibit only small deviations from the constant property analyses. This is in contrast to the results for the same initial conditions but with moderate wall cooling for which the nominal fully developed Nusselt numbers are about 75 percent higher than the constant property analysis value.
2. Flow acceleration due to heating causes static pressure drops to increase as the wall heat flux level is raised. However, the pressure parameter, which is formed from the pressure drop, is much less sensitive to heating levels, and in the nominally fully developed tube section is about 2/3 of the Poiseuille limit of 64.0 a t the highest heat flux of the present program.
3. Velocity profiles in the fully developed tube section are somewhat blunter than Poiseuille profiles because of continued flow acceleration in the region near the heated wall. This result is contrary to the sharp profile found in heat-transfer texts where profile variations are due only to viscosity decrease from the wall temperature rise.
4. The overshoot velocity effect near the heated wall in the tube entrance does produce large shear stress in this region and contributes to l a rge r local friction factors and pressure drops in the entrance than are obtained in constant property o r adiabatic compressible analyses.
5. The static pressure development down the tube is split into the sum of the momentum and total friction pressure drops. The contribution of momentum change relative to pressure drop due to friction is la rger for the higher wall heat fluxes.
Exper im ental
1 . Experimental bulk Nusselt numbers for a fivefold variation in wall heat flux verify the analytical prediction of insensitivity of the Nusselt numbers to the heating level.
2. Static pressure drops f rom the experimental tests are compared with analytical values for the same dimensionless heat flux, and results from the two methods agree to within 10 percent.
22
3. The general conformity of the analytical and experimental p ressure relation at the heat flux levels reported herein are considered as ample justification of the reliability of results and method for the numerical marching technique analysis of developing laminar compressible tube flows with heat transfer.
4. An experimental run in which the wall heat flux decreases because of radiation losses by 16 percent f rom inlet to exit is compared with numerical calculations with the same heat flux distribution. The numerical analysis produces values of the pressure parameters P, momentum- to friction-pressure ratio PM/PFR, and pressure drop parameter 4f
P,bRe
b which are close to the experimentally determined values of these
three parameters.
Lewis Research Center, National Aeronautics and Space Administration,
Cleveland, Ohio, January 22, 1971, 127-01.
23
I -
aT)
- _
--
APPENDIX - NUMERICAL PROCEDURE FOR FINITE DIFFERENCE
SOLUTION OF LAMINAR FLOW BOUNDARY LAYER EQUATIONS
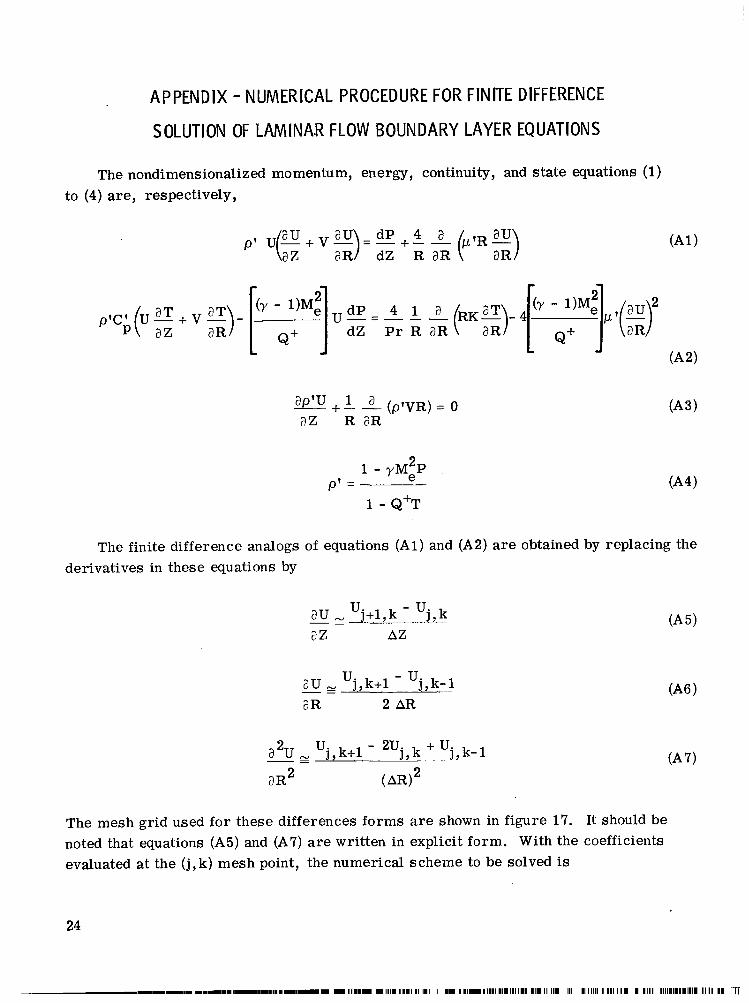
The nondimensionalized momentum, energy, continuity, and state equations (1) to (4) are, respectively,
p'C'P (
u-;E + v - aR
a p w +-1 -a (p'VR) = 0 az R aR
21 - yMePp' = (A4
1 - Q+T
The finite difference analogs of equations (Al) and (A2) are obtained by replacing the derivatives in these equations by
az AZ
au 'j,k+l - uj ,k- l aR 2 AR
a2u uj,k+l - "j , - .k + 'j,k-l
The mesh grid used for these differences forms are shown in figure 17. It should be noted that equations (A5) and (A7) are written in explicit form. With the coefficients evaluated at the (j, k)mesh point, the numerical scheme to be solved is
24
1 - 1 - 1 1 , 1 1 1 1 . . . 1 1 1 1 . 1 . . . 1 1 1 1 1 1 ~ . I I I 111111. 1I11111 Ill1I I 111 I 11111 11111111111111111111I1111 II 111 111 I I 11111 I I1111 1 1 I 1111 111111111111111 II II II -iT
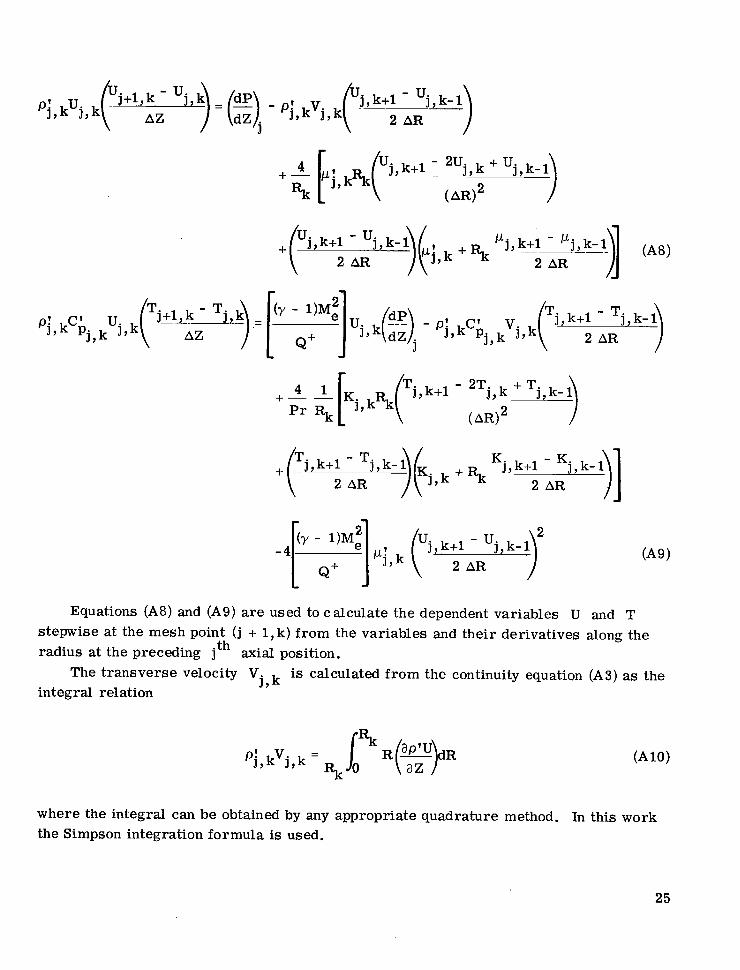
Az - pi,kvj,krpp-)pi,kuj,k( 'j+l, k - 'j ' l ) = (z)j j,k+l - 'j,k-l 2 AR
Equations (A8) and (A9) are used to calculate the dependent variables U and T stepwise at the mesh point ( j + 1,k) from the variables and their derivatives along the radius at the preceding jth axial position.
The transverse velocity Vj,k
is calculated from the continuity equation (A3) as the integral relation
where the integral can be obtained by any appropriate quadrature method. In this work the Simpson integration formula is used.
25
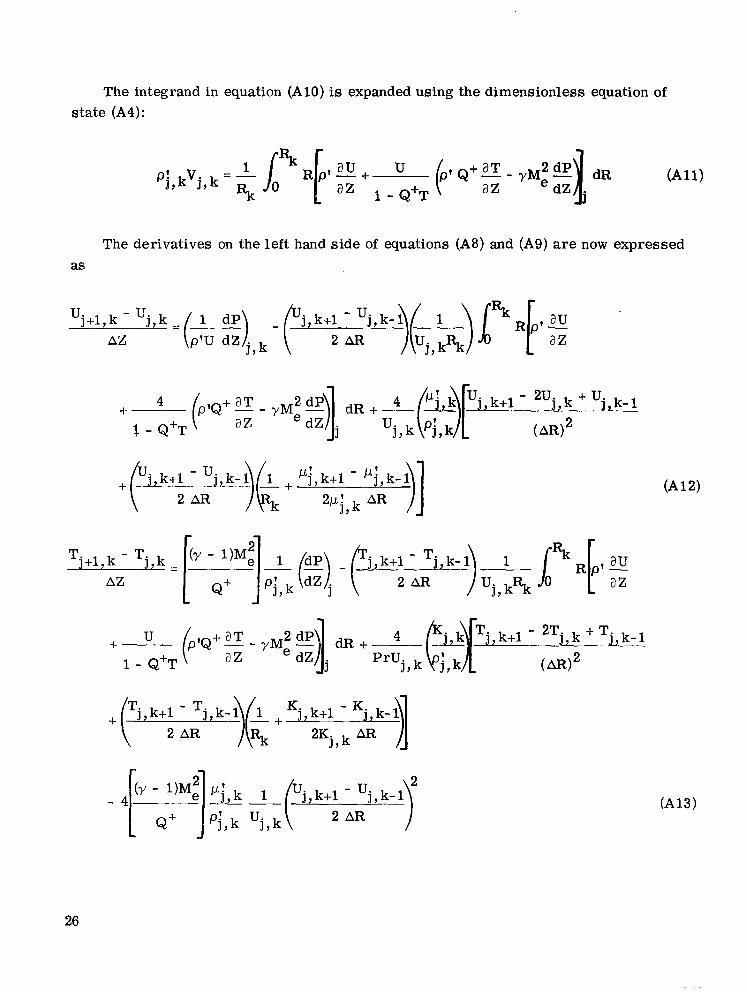
The integrand in equation (A10) is expanded using the dimensionless equation of state (A4):
The derivatives on the left hand s ide of equations (A8) and (A9) are now expressed as
Tj ,k+l - Tj ,k- l 1 + K j , k + l +( 2 AR )k
26
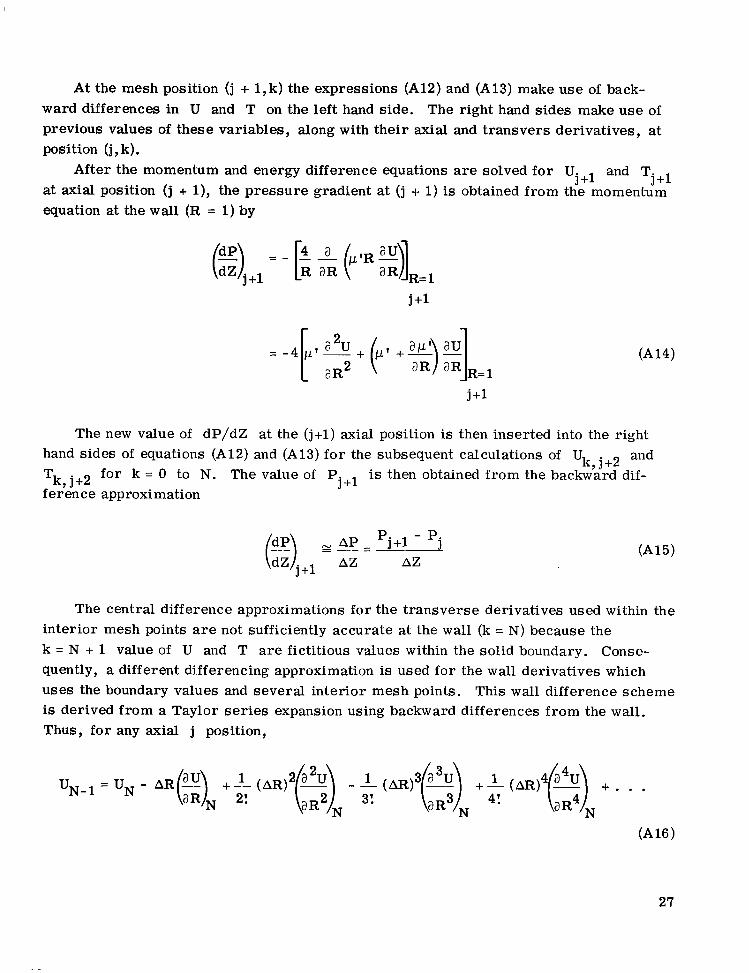
At the mesh position (j + 1,k) the expressions (A12) and (A13) make use of backward differences in U and T on the left hand side. The right hand sides make use of previous values of these variables, along with their axial and transvers derivatives, at position (j, k).
After the momentum and energy difference equations are solved for Uj+l and Tj+l at axial position (j + l), the pressure gradient at (j + 1)is obtained from the momentum equation at the wall (R = 1)by
j +1
The new value of dP/dZ at the ( j+1) axial position is then inserted into the right hand sides of equations (A12) and (A13) for the subsequent calculations of Uk , J.+2 and
Tk, j+2 for k = 0 to N. The value of Pj+l is then obtained from the backward diff eren ce approximation
AZ
The central difference approximations for the transverse derivatives used within the interior mesh points are not sufficiently accurate at the wall (k = N ) because the k = N + 1 value of U and T a r e fictitious values within the solid boundary. Consequently, a different differencing approximation is used fo r the wall derivatives which uses the boundary values and several interior mesh points. This wall difference scheme is derived from a Taylor series expansion using backward differences from the wall. Thus, for any axial j position,
27
- -
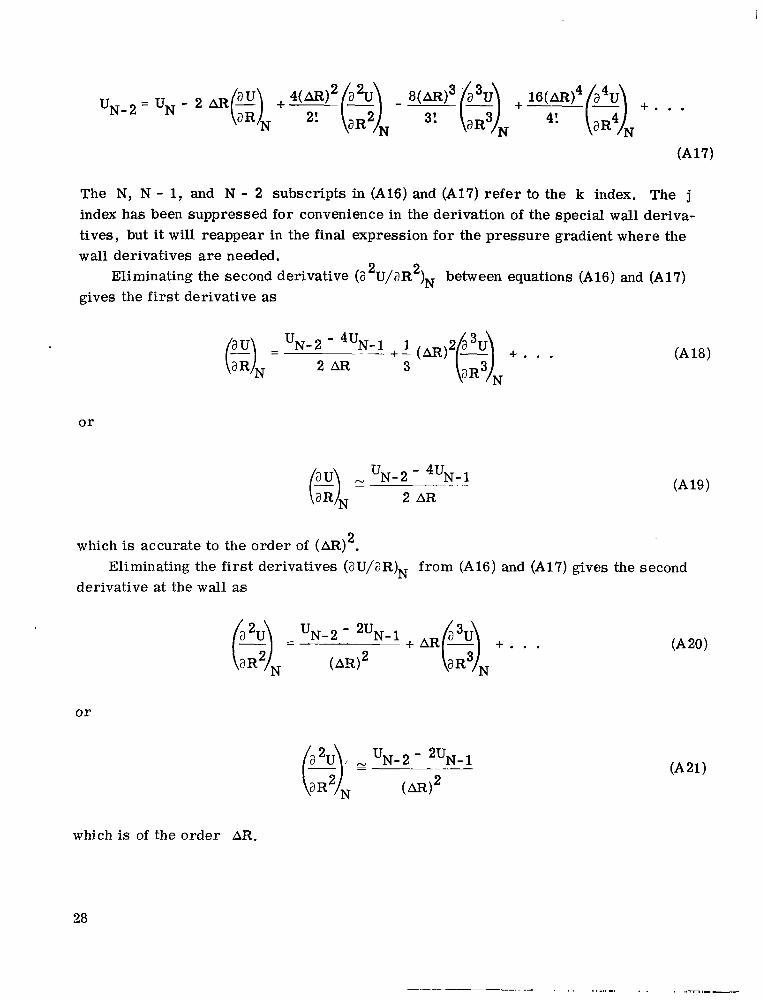
U N - 2 = UN - 2 AR aR
The N, N - 1, and N - 2 subscripts in (A16) and (A17) refer to the k index. The j index has been suppressed for convenience in the derivation of the special wall derivatives, but it will reappear in the final expression for the pressure gradient where the wall derivatives are needed.
Eliminating the second derivative (a 2U/aR 2)N between equations (A16) and (A17) gives the first derivative as
'N-2 - +I(AR)2(z)Na3u + . . . 3
or
faU\ 'N- 2 - 4uN- .~~ 1 bR/N 2 AR
2which is accurate to the order of (AR). Eliminating the first derivatives (aU/aR)N f rom (A16) and (A17) gives the second
derivative at the wal l as
o r
(&]I 'N-2 - 2uN-1_ _
which is of the order AR.
28
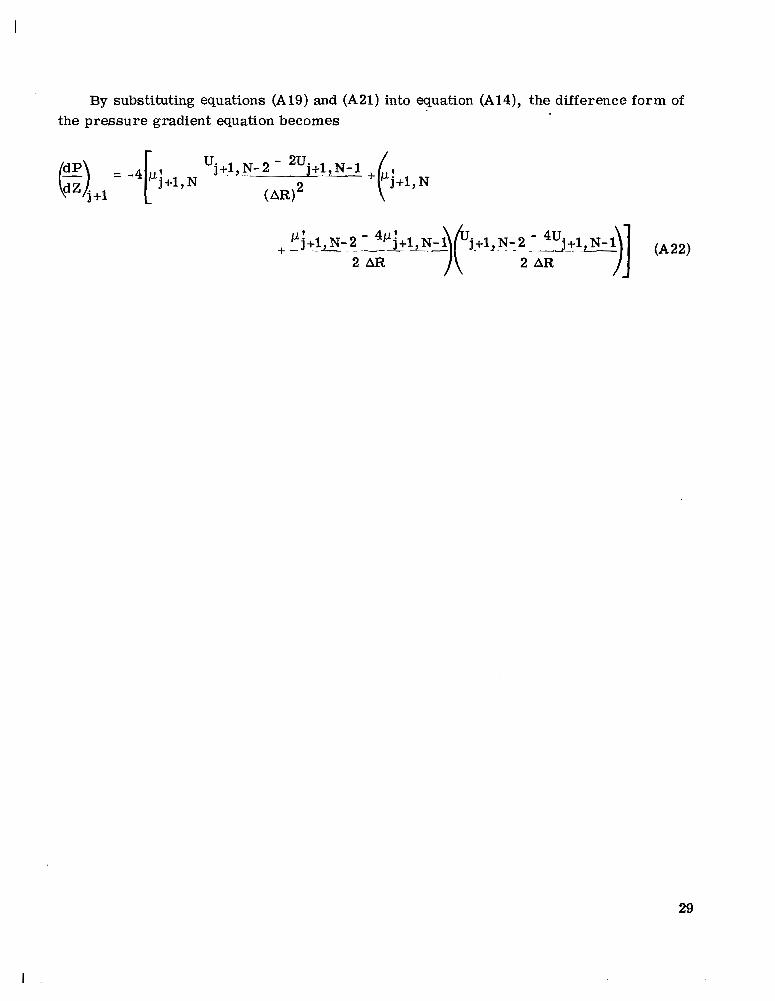
By substituting equations (A19) and (A21) into equation (A14), the difference form of the pressure gradient equation becomes
29
REFERENCES
1. Deissler, Robert G. ; and Presler, Alden F. : Analysis of Developing Laminar Flow and Heat Transfer in a Tube for a Gas with Variable Properties. Proceedings of the Third International Heat Transfer Conference. Vol. 1. AIChE, 1966, pp. 250-256.
2. Presler, A. F. : Analysis of Developing Laminar Flow and Heat Transfer in a Tube fo r a Gas with Cooling. NASA TN D-6152, 1970.
3. Deissler, Robert G. : Analytical Investigation of Fully Developed Laminar Flow in Tubes with Heat Transfer with Fluid Properties Variable Along the Radius. NACA T N 2410, 1951.
4. Siegel, R.; Sparrow, E. M.; and Hallman, T. M. : Steady Laminar Heat Transfer in a Circular Tube with Prescribed Wall Heat Flux. Appl. Sci. Res. , sec . A, vol. 7, no. 5, 1958, pp. 386-392.
5. Kays, W. M. : Numerical Solutions for Laminar-Flow Heat Transfer in Circular Tubes. Trans. ASME, vol. 77, no. 8, Nov. 1955, pp. 1265-1274.
6. Hallman, Theodore M. : Experimental Study of Combined Forced and Free Laminar Convection in a Vertical Tube. NASA TN D- 1104, 1961.
7. Davenport, Monty E. : The Effect of Transverse Temperature Gradients on the Heat Transfer and Friction for Laminar Flow of Gases. Rep. TR 247-3, Stanford Univ., July 31, 1962.
8. Taylor, Maynard F. : A Method of Correlating Local and Average Friction Coefficients f o r Both Laminar and Turbulent Flow of Gases Through a Smooth Tube with Surface to Fluid Bulk Temperature Ratios from 0.35 to 7.35. Int. J. Heat Mass Transfer, vol. 10, no. 8, Aug. 1967, pp. 1123-1128.
9. Worsoe-Schmidt, P. M. : Heat Transfer in the Thermal Entrance Region of Circular Tubes and Annular Passages with Fully Developed Laminar Flow. Int. J. Heat Mass Transfer, vol. 10, no. 4, Apr. 1967, pp. 541-551.
10. Manly, W. D.; and Bridges, W. H. : Nickel and Its Alloys. Materials. Vol. 1 of Reactor Handbook. Second ed., C. R. Tipton, Jr., ed. , Interscience Publ. , Inc. , 1960, ch. 27.
11. Lyman, Taylor, ed. : Metals Handbook. Vol. I. Eighth ed. , American Society of Metals, 1961.
30
12. Wolf, J.; and Brown, W. F., Jr., eds.: Non-Ferrous Alloys. Vol. IIA of Aerospace Structural Metals Handbook, Supplement 1. Belfour Stulen, Inc. (AFML-TR-68-115), Mar. 1968.
13. Weast, Robert C., ed. : Handbook of Chemistry and Physics, 47th ed. , Chemical Rubber Co., 1966.
14. Jakob, Max: Heat Transfer. Vol. 11. John Wiley & Sons, Inc., 1957.
15. McAdams, William H. : Heat Transmission. Third ed., McGraw-Hill Brook Co., Inc., 1954.
16. Hornbeck, Robert W.: Laminar Flow in the Entrance Region of a Pipe. Appl. Sci. Res., Sec. A, vol. 13, 1964, pp. 224-232.
17. Langhaar, Henry L . : Steady Flow in the Transition Length of a Straight Tube. J. Appl. Mech., vol. 9, no. 2, June 1942, pp. 55-58.
18. Sparrow, E. M.; Lin, S. H. ; and Lundgren, T. S. : Flow Development in the Hydrodynamic Entrance Region of Tubes and Ducts. Phys. Fluids, vol. 7, no. 3, Mar. 1964, pp. 338-347.
31
III
-----
I
I
5 Flow d i rect ion
z=o
Figure 1. -Model for numer ica l analysis of un i fo rm heat f lux to laminar compressible flow in tube w i th un i form i n i t i a l conditions.
e M i x i n g box and thermocouple probe
;;;;retap
+ Voltage tap
X Wall thermocouple
++ Control valve
r---- ExitI I I I
I
n 9 q&qII
I Ir-------I I Six-tank manifold I I
I - I
I *I
i I
I! Q I
I Vacuum tank 1
I I I ‘-Rotameter
Figure 2. - Flow schematic of heat-transfer test stand.
32
I_
t' Plenum7
Manometer l ine tap l / 4 AN f i t t ing -/'
~ - 2 5 Thermocouples alternate top and bottom
/' /'
'7'-X
0 Thermocouple location x Voltage tap
lnconel alloy 600 test section
Split graphite cylinderFour pressure taps (1" OD, Y4" thick)0.004 (0.010 cm)
1 112 (1.27)
Pressure plenum
'IManometer l ine
Test section hole
Copper strap and bus
Scction detail of pressure tap. Electrode detail
Figure 3. -Test stand instrumentation. (All dimensions are in inches (cm). )
33
--- ----
,201- J lo8r
.18
.16- c f
.140 200 400 600 800 1000 1200 1400 1600
Temperature, "F
300 400 500 600 700 800 900 1000 1100 1200 Temperature, K
(a) Thermal conductivity (ref. 12).
. 4c / .
96 0 100 200 300 400 500
Temperature, "C
(b) Resistivity (ref. 11, w.1123).
Below 1500" F ~o000K ) After 15 min at 15133"F (oo00K) After 15 m i n at 1800" F ~oo00K) After 15 m i n at 2100 F ~oo00K)
.2800 loo0 1200 1400 1600 1800
Temperature, "F
700 800 900 lo00 1100 1200 1300 1400 Temperature, K
(c) Tda l emissivity of sheet as rolled (ref. 12).
Figure 4. -Thermal properties of lnconel alloy 600.
600
4. 6x1O4
4.2 c 3.8
2.6
1.0 I I I I I I I I 0 100 200 300 400 500 600 700 800 900 loo0 1100 1200
Temperature, "F
I I I I 1 - 1 I 300 400 500 600 700 800 900
Temperature, K
Figure 5. - Helium gas properties (ref. 16).
35
VI
0.23;-
---
Axial Axial distance, 1A:< LocaI
distance,
-\. 0.39
.1 \ ,-.17
-,001 .06
I--
Entrance Mach
- number, M e
- - 0.06 .004
Dimensionless radius, rlr, (b) Wall heat flux, 1.35; ent ranceMach(a) Wall heat flux, 0.135; entrance Mach
number, 0.06. (c) Wall heat flux, 13.5.
number, 0.06.
Figure 6. - Development of radial velocity profiles.
n 3 3 -
1.0-
. 6 -
.4-
. 2 -
0 . 2 . 4 .6 .8 1.0
2.6- 7
2.4
\-2.2- Axial \ 0 Poiseuille profiledistance, \-A.
L ’ Mach \ 2. E.0.39 number, 0 \
\ o \\ M
-. \\ n-3 Wall Entrance Axial 3 heat Mach distance,
flux, number, Z+ Qf M e 1.35 0.06 0.10
-1.35 .3 .10 Data from ref. 2
1.0
. 6
‘ \\.4
. 2 t-\‘1
~~
0 . 2 . 4 .6 .8 1.0 0 . 2 . 4 .61 . 8 1.0 Dimensionless radius, rlr,
(d)Wall heat flux, 27.0; entrance Mach le) Wall heat flux, 1.35; comparison with number, 0.0005. cooling case.
Figure 6. - Concluded.
Local Mach Wal l heat number, f lux,
M Q+ 0.06 0.135 .004 .135 .06 1.35 .OM 1.35 .06 13;5 .004 13.5 .0005 27.0
Present calculat ion, isothermal (ref. 1) Langhaar (ref. 17) Sparrow, Lin, and Lundgren (ref. 18)
.-0c m, x5 1.4-8
1.2
1.0 10-4 10-3 10-2 10-1
Dimensionless distance, Z+
Figure 7. -Ax ia l development of center l ine velocity ratio.
38
100
m
- Entrance Mach
number,
,004 --- 0 t d t b = 1.7 (ref. 31
---
1.8 Reciprocal Graetz
number, 1.6 -\- \ G2-l
‘9 \,O. 15
-1.4 .015
\ \ 0 Fully developed
profiles (ref. 3) 1.2 - . w 3
-1.0
-.8
-. 6
-. 4 I
r)4
3 . 2 c c
$m 0 (a) Wall heat flux, 0.135; entrance Mach (b) Wall heat flux, 1.35; entrance Mach
0z number, 0.06. number, 0.06. L
m5 2.0 -I
m, Entrance Mach
E0. 1.8 number,
0.101M e 0.06 0 Fully developed
1.6 -- ,004 profile t,/tb = 1.7 (ref. 3)
0 t d t b = 1.7 (ref. 31
1.4
1.2
1.0
.8
.6
. 4
. 2
0 . 2 . 4 . 6 .8 1.0 Dimensionless radius, rlr,
(c) Wall heat flux, 13.5. (d) Wall heat flux, 27.0; entrance Mach number, O.ooO5.
Figure 8. - Development of temperature profiles.
39
m
a,
1.02
1.38 r
cL
E ImLn
1.2
10-3
(a) Wall heat flux, 0.135; entrance Mach number, 0.06.
(b) Wall heat flux, 1.35; ent ranceMach number, 0.06.
(c) Wall heat flux, 13.5; ent ranceMach number, 0.06.
10-2 10-1 100
Reciprocal Graetz number, Gz - l (d) Wall heat flux, 27.0; ent ranceMach number, 0.0005.
Figure 9. - Variation of wall- t o bulk-temperature rat io along tube axis.
40
0
0
V 0 0
Wall heat Entrance Mach flux, number,Q+ M e
0 Q+-0 0 0.135 0.06 0 1.35 .004
13.5 .004 V 27.0 .0005
I I 1 1 I I l l 1 I 1 I I l l l l l 1 I I I I l l , l 10-3 10-2 10-1 100
Reciprocal Graetz number, Gz- I
Figure 10. - Numerical resul ts for Nusselt number development wi th several heat fluxes.
6x10³ Wall heat
f lux, % F Q+a,n
Choking Qf = 13.6 (Me= 0.06)
Poiseui l le
t--F++tlt l.. 10-2 10-1 100
Dimensionless distance, Zf
Figure 11. - Numerical results for local laminar f r i c t ion parameter based on wall shear.
41
. .
---
I20 I I I 1 1 1 J --L I I I I I*_L----_I I I 1 I I I l l 10-3 10-2 10-1
Dimensionless distance, Zt
Figure 12. - Numerical resul ts for f r i c t ion parameter based on pressure drop.
I
10-1F- 1 - 1 1
10-3
Figure 13.
Entrance Mach , ~ . 0 0 0 5
number, 7'
Static pressure P Fr ict ion pressure PFR
, 1 I I I I L 1 I I l l l l l l I I I 1 l l l l l
10-2 10-1 100 Dimensionless distance, Z+
- Dimensionless pressure development along tube length.
42
100
. 6
. 5
.1
Wal l heat Entrance Mach flux, number, Q+ Me
.7-> 0 10-3
0 I 10-3
~ ~~ ___ ,135
I I 1 1 1 1 1 1 1 I I 1 I I I l l 1 I 1-u 10-2 10-1 100
Dimensionless dis!ance, Zt
\--.06
Figure 14. - Development of ra t io of momentum pressure to f r i c t ion pressure along tube length.
h
Wall Entrance Source heat Mach flux, number,
Q + M e 1.05 0.110 1.02 .0577 This 1.15
.079 1 report 1.40
0 3.6 0 3.3 .--___---1
I
L Constant .* property (ref. 1) h ' L
I I I I I 1 1 1 1 I I I 1 1 1 l 1 1 I I I l l l l l l
10-2 10-1 100 Reciprocal Graetz number, G z - l
Figure 15. - Ccmparison of experimental heat-transfer data for un i form heat flux.
43
Wall heat flux, Q+
0 1.06 0 1.20
400 - 0 1.38 A 2.26 -
n n 3.3 a, v 3.8
Poiseuil le -
10-3 Dimensionless distance, Zt
Figure 16. - Comparison of experimental f r i c t ion factors of reference 7 w i th numerical resul ts (hel ium data).
1-6d u d N - 2 N - 3
Flow March ing m I-direction
Figure 17. - Fini te difference mesh for numer ica l solut ion of the boundary-layer equations.
44 NASA-Langley, 1971 - 33 E-5702
NATIONAL AND SPACE ADMINISTRA? IONAERONAUTICS WASHINGTON, D. C. 20546
OFFICIAL BUSINESS FIRST CLASS MAIL PENALTY FOR P R I V A T E USE 5300
POSTAGE AND FEES PAID UATIONAL AERONAUTICS ANL:
SPACE ADMINISTRATION
Q 5 U 0 0 1 5 8 51 30s 71.10 00903 P I R F O R C E W E A P Q N S L A B O R A T O R Y /WLOL/ K I R T L A N D AFB, NEB H E X I C C 87117
A T T E . LOU B O W M A ~ U ,CHIEFvTECH. L I B R A R Y
POSTM~STER: If Undeliverable (Section 158 Postal Manual) Do Nor Return
"The aerouaictical and space activities of the United Stntes shnll be condiicted so as t o contribule . . . t o the expansion of hzuiiau knoiuledge of phenoiilelia iii the atiitosphere aad space. The Adviinistraiion shall provide for the widest prncticable and appropriate disseiiiiitation of inforrttatioii coiiceriiing i t s activities aizd the reszilts thereof."
-NATIONALAERONAUTICSA N D SPACE ACT OF 1958
NASA SCIENTIFIC A N D TECHNICAL PUBLICATIONS
TECHNICAL REPORTS: Scientific and technical information considered impor tan t, complete, and a lasting contribution to existing knowledge.
TECHNICAL NOTES: Information less broad in scope brit nevertheless of importance as R
contribution to existing knowledge.
TECHNICAL MEMORANDUMS: Information receiving limited distribution because of preliminary data, security classification, or other reasons.
CONTRACTOR REPORTS: Scientific and technical information generated under a NASA contract or grant and considered an important contribution to existing knowledge,
TECHNICAL TRANSLATIONS: Information published in a foreign language considered to merit NASA distribution in English.
SPECIAL PUBLICATIONS: Information derived from or of value to NASA activities. Publications include conference proceedings, monographs, data compilations, handbooks, sourcebooks, and special bibliographies.
TECHNOLOGY UTILIZATION PUBLICATIONS: Information on technology used by NASA that may be of particular interest in commercial and other non-aerospace applications. Publications include Tech Briefs, Technology Utilization Reports and Technology Surveys.
Details on the availability of Ihese publications may be obtained from:
SCIENTIFIC AND TECkiNICAL INFORMATION OFFICE
NATIONAL AERONAUTICS AND SPACE ADMINISTRATION Washington, D.C. PO546


![7e IIIf H] - Defense Technical Information · PDF fileRAND program, under U.S. Air ... compressible laminar flow are reviewed and a proposal for a finite- ... time and my acquaintance](https://img.pdfslide.us/doc/110x75/5aa24c987f8b9a1f6d8d0cf6/-7e-iiif-h-defense-technical-information-program-under-us-air-compressible.jpg)