Embed Size (px)
DESCRIPTION
Analytical Analysis – Selective Use of Ratios. Chapter 29. By the end of the chapter, you should be able to: prepare and interpret common size statements of income and financial position; explain the use of ratios in determining whether a company is shariah compliant; - PowerPoint PPT Presentation
Citation preview
Slide 29.1
Analytical Analysis – Selective Use
of Ratios
Chapter 29
Slide 29.2
By the end of the chapter, you should be able to:prepare and interpret common size statements of
income and financial position;explain the use of ratios in determining whether a
company is shariah compliant;explain the use of ratios in debt covenants;critically discuss various scoring systems for predicting
corporate failure;critically discuss remuneration performance criterion;calculate the value of unquoted investments;critically discuss the role of credit rating agencies.
Objectives
Slide 29.3
Making financial information more understandable and easier to analyse
Making the information accessible The ICAS report in 1999 Business Reporting: the inevitable change?
Making the information easier to interpret XBRL
The reliability of current financial information Lack of confidence among investors.
Slide 29.4
Making financial information more understandable and easier to analyse (Continued)
Audit independence needs to be strengthened Schemes have kept liabilities off balance sheet Auditors are not seen as protecting shareholders
Future business prospects Pressure for managers to share their assessment of future
business prospects so that investors can make informed investment decisions
Slide 29.5
Making financial information more understandable and easier to analyse (Continued)Disclosure of strategies
In 1999 the ICAEW produced a report No Surprises: The Case for Better Risk Reporting
Disclosure of risks and focus on relevant ratios ICAEW 1998 discussion paper, Financial Reporting of Risk.
Slide 29.6
The initial overview
Prepare a common size statement of financial position A vertical analysis assesses the strength of the
statement of financial position with assets and liabilities shown as a percentage of a base figure
A horizontal analysis is then carried out on areas that require further investigation.
Slide 29.7
Common-size statements
Methods of ratio comparisons Two methods of comparison can be used – cross-sectional
and time-series. Cross-sectional analysis - financial ratios of different
companies within the same industry are compared. Comparison of these ratios can indicate areas that require
further investigation. Whether the figure being compared is better or worse than the standard is immaterial. Why?
Positive deviations can be indicators of problems just as much as negative deviations can. For example, a high asset turnover ratio could arise because production plant is being used at the expense of providing downtime for maintenance – leading to early breakdowns and thus lost production
Slide 29.8
Common-size statements
Time-series analysis is where performance over time is being assessed.
The current year’s performance is compared with previous years’ performance to ascertain whether or not the company is progressing as expected. Trends can be isolated, and as with cross-sectional analysis, can be investigated if they are not as expected
Slide 29.9
Vertical and horizontal analysis
Horizontal and vertical analyses of the financial statements helps interpretation of the above methods of analysis
Horizontal analysis is where changes in various items within the financial statements are compared from year to year. For example, in the Income Statement, the change in sales or
revenues from year 1 to year 2 is compared. Amounts for comparative years are expressed as a percentage
of the base year amount Vertical analysis reveals the relationship of items within
the financial statement to a base item. All amounts of a year expressed as a percentage of a base
amount (e.g., net sales revenue, total assets) For example, in the Balance Sheet, individual items are
expressed as a percentage of total assets, or of total liabilities and shareholders’ funds.
Slide 29.10
Year-to-Year Change Analysis
Use both absolute and percentagesGuidelines:
When an item has value in the base year and none in the next period, the decrease is 100%
A meaningful percent change cannot be calculated when one number is positive and the other number is negative
A percent change cannot be calculated when there is no figure for the base year.
Slide 29.11
Industry Variations
Financial components vary by type of industry Merchandising
Inventory is a principal asset Sales may be primarily for cash or on credit
Service Inventory is low or nonexistent
Manufacturing Large inventory holdings Substantial investment in plant assets
Slide 29.12
Vertical analysis – common size statements
The vertical analysis approach can, for eample, highlight the structure of the Statement of financial position by presenting
Non-current assets, Working capital, Debt and Equity as a percentage of debt plus equity
Slide 29.13
Vertical Analysis
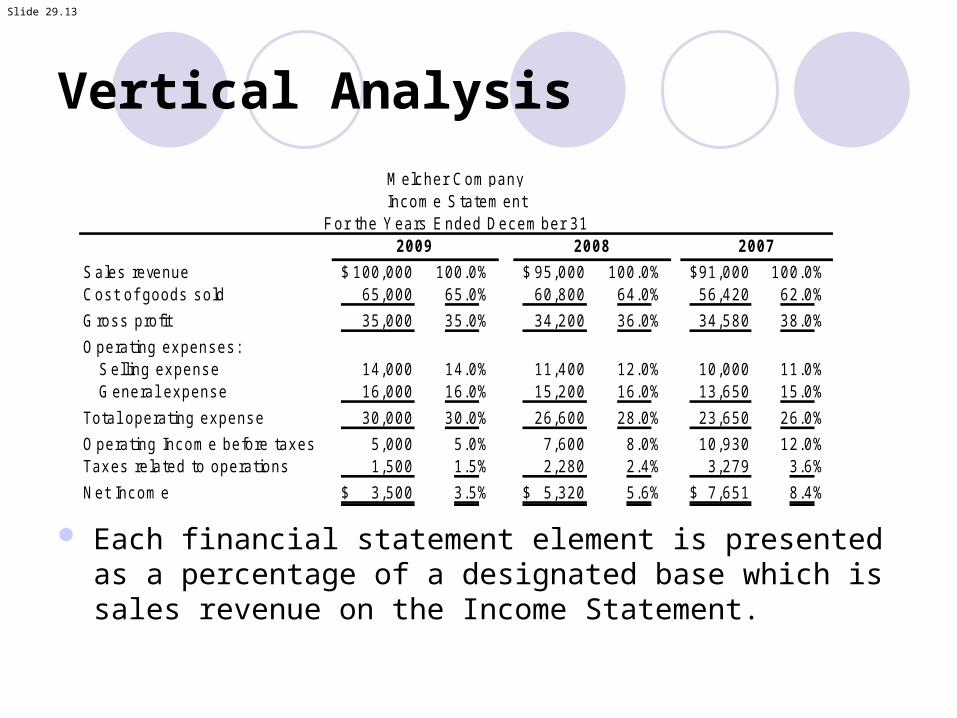
Each financial statement element is presented as a percentage of a designated base which is sales revenue on the Income Statement.
Sales revenue 100,000$ 100.0% 95,000$ 100.0% 91,000$ 100.0%Cost of goods sold 65,000 65.0% 60,800 64.0% 56,420 62.0%
Gross profit 35,000 35.0% 34,200 36.0% 34,580 38.0%
Operating expenses:Selling expense 14,000 14.0% 11,400 12.0% 10,000 11.0%General expense 16,000 16.0% 15,200 16.0% 13,650 15.0%
Total operating expense 30,000 30.0% 26,600 28.0% 23,650 26.0%
Operating Income before taxes 5,000 5.0% 7,600 8.0% 10,930 12.0%Taxes related to operations 1,500 1.5% 2,280 2.4% 3,279 3.6%
Net Income 3,500$ 3.5% 5,320$ 5.6% 7,651$ 8.4%
Melcher CompanyIncome Statement
2009 2008 2007For the Years Ended December 31
Slide 29.14
Vertigo. Financial structure – initial assessment – p. 743
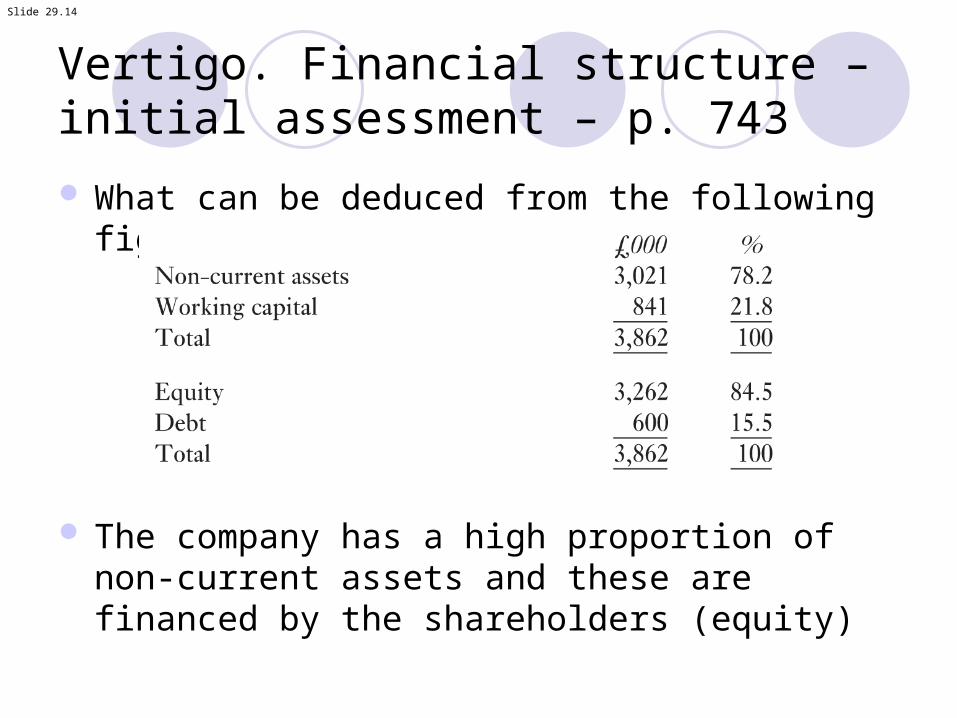
What can be deduced from the following figures?
The company has a high proportion of non-current assets and these are financed by the shareholders (equity)
Slide 29.15
Vertical analysis – financial structure inter-period comparison
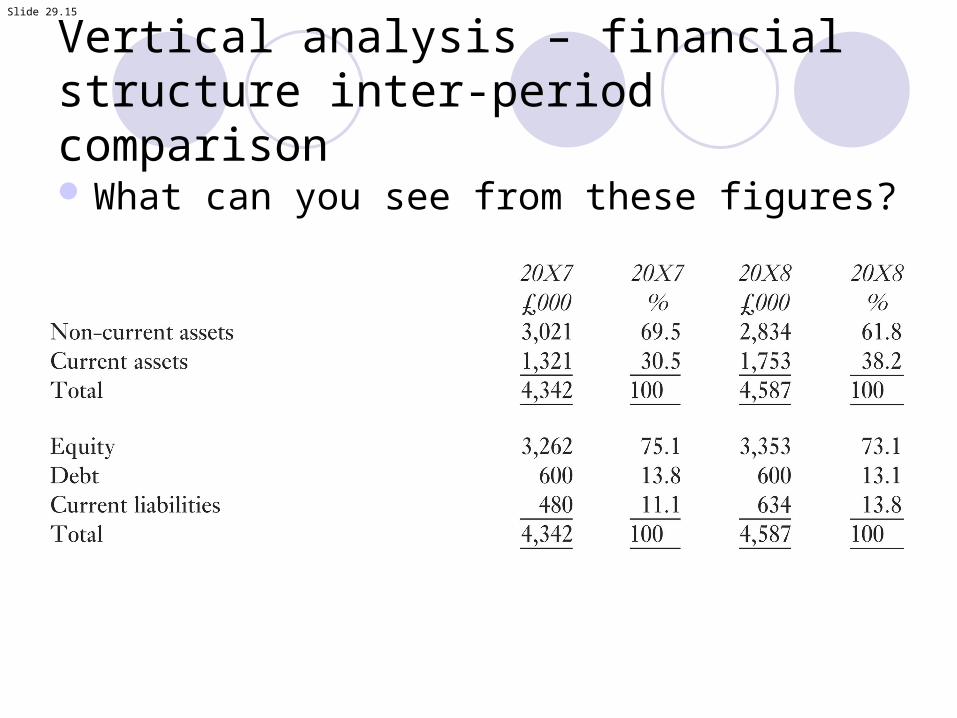
What can you see from these figures?
Slide 29.16
Vertigo example – p.743-748.
The Balance sheet analysis shows Vertigo is financially sound in the long-term – see the debt-equity relationship. This shows that the shareholders (owners) have supplied 73.1% of the required funding for the business.
However, there appears to be some problems arising from the Income statement data.
Slide 29.17
Horizontal analysis
A horizontal analysis looks at the percentage change that has occurred
Concentrate on areas that seems to require closer investigation
For example: Current assets and current liabilities if working capital
percentage is increasing.
Slide 29.18
Horizontal Analysis
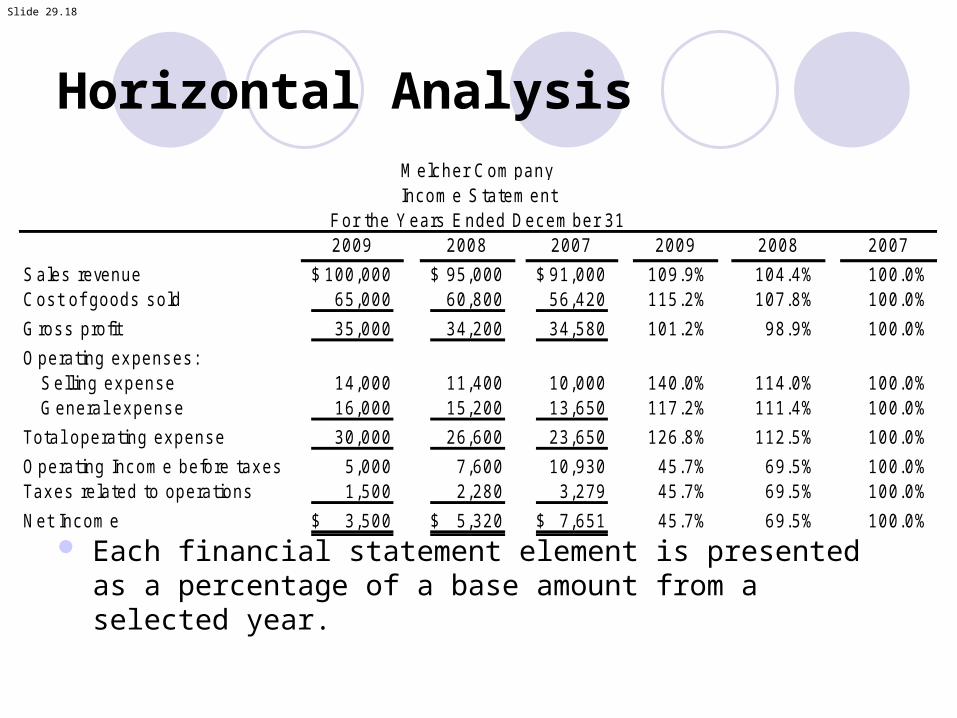
Each financial statement element is presented as a percentage of a base amount from a selected year.
2009 2008 2007 2009 2008 2007
Sales revenue 100,000$ 95,000$ 91,000$ 109.9% 104.4% 100.0%Cost of goods sold 65,000 60,800 56,420 115.2% 107.8% 100.0%
Gross profit 35,000 34,200 34,580 101.2% 98.9% 100.0%
Operating expenses:Selling expense 14,000 11,400 10,000 140.0% 114.0% 100.0%General expense 16,000 15,200 13,650 117.2% 111.4% 100.0%
Total operating expense 30,000 26,600 23,650 126.8% 112.5% 100.0%
Operating Income before taxes 5,000 7,600 10,930 45.7% 69.5% 100.0%Taxes related to operations 1,500 2,280 3,279 45.7% 69.5% 100.0%
Net Income 3,500$ 5,320$ 7,651$ 45.7% 69.5% 100.0%
Melcher CompanyIncome Statement
For the Years Ended December 31
Slide 29.19
Overview of the cost structures – Vertical analysis
Preparing a Common size statements of income gives an indication of the cost structure
Shows the relative significance of costs.
Slide 29.20
Relative significance of costs
20X8 20X9
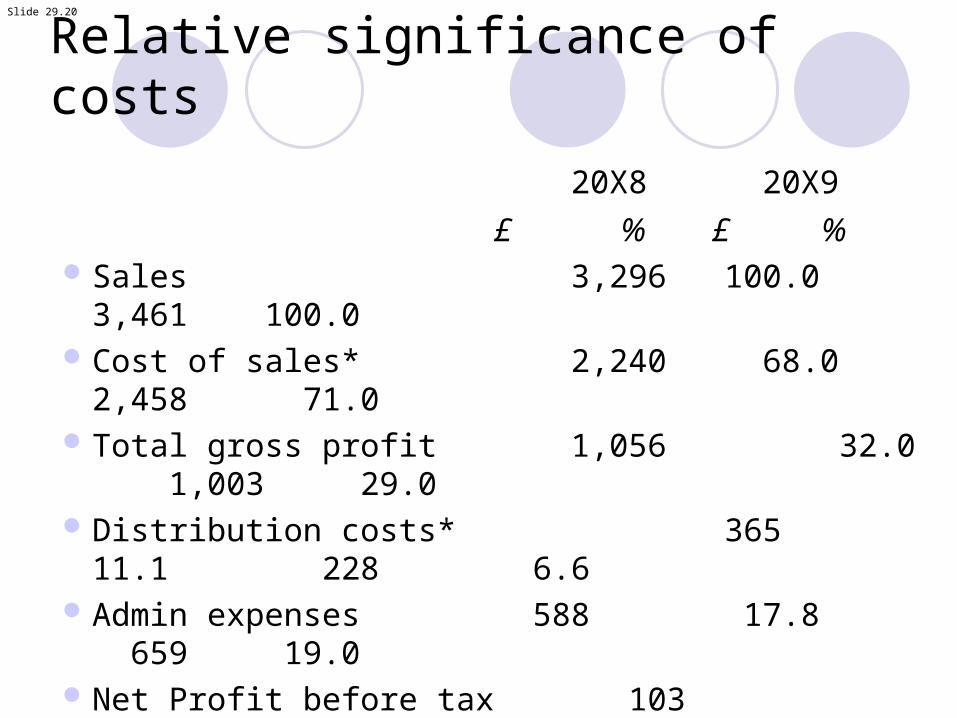
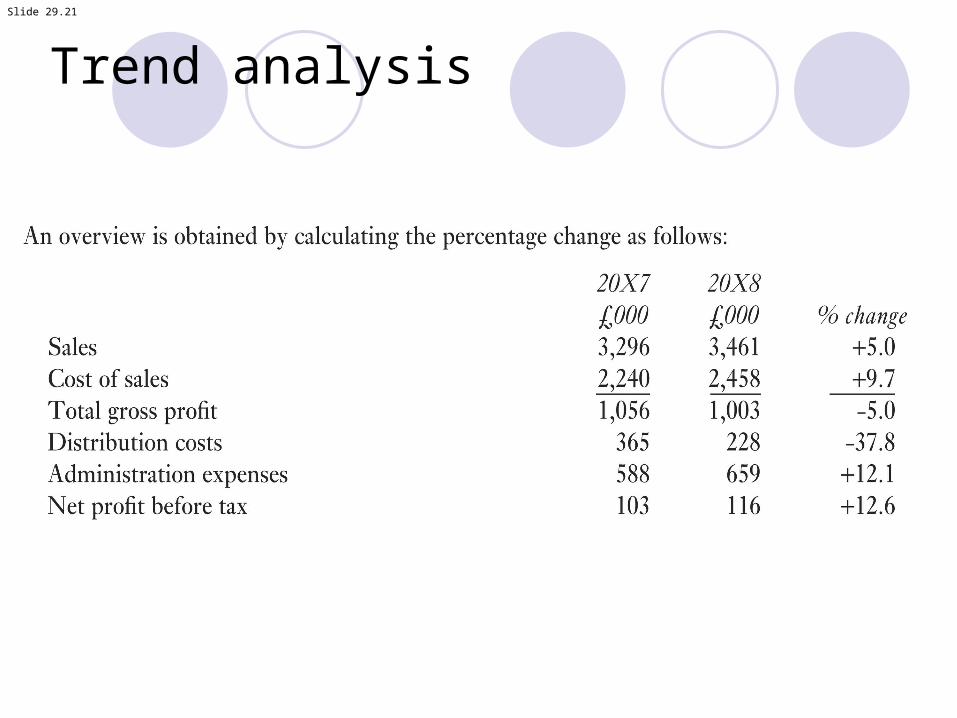
£ % £ %Sales 3,296 100.0 3,461 100.0Cost of sales* 2,240 68.0 2,458 71.0Total gross profit 1,056 32.0 1,003 29.0Distribution costs* 365 11.1 228 6.6Admin expenses 588 17.8 659 19.0Net Profit before tax 103 3.1 116 3.4 *The increase in COS has led to a fall in GP, but the fall in
Distribution costs has been enough to provide an overall %age increase in net profit
Slide 29.21
Trend analysis
Slide 29.22
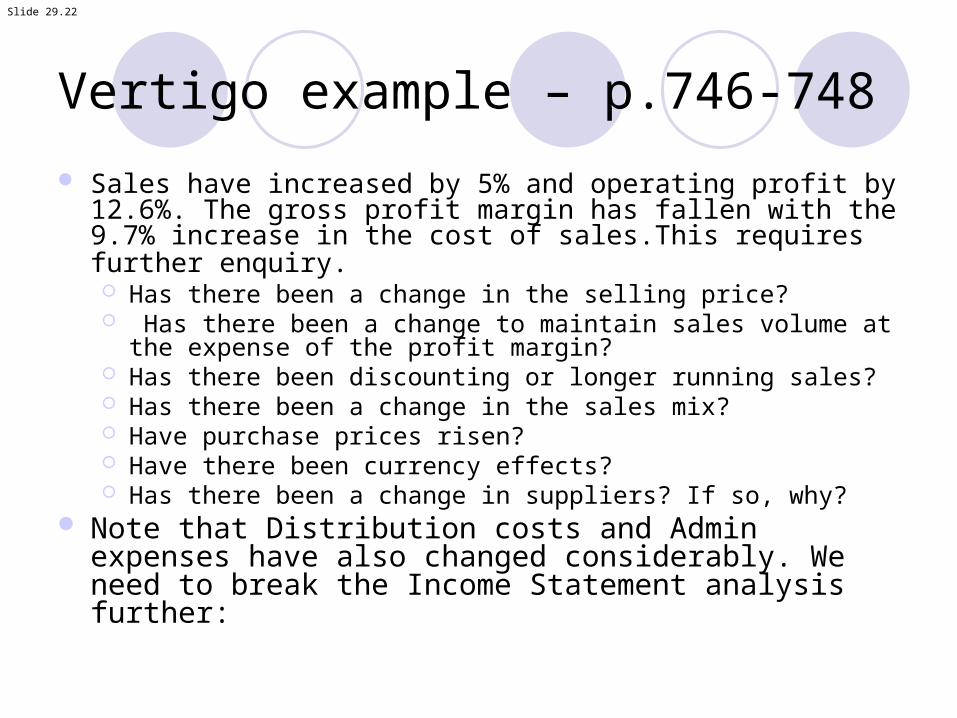
Vertigo example – p.746-748
Sales have increased by 5% and operating profit by 12.6%. The gross profit margin has fallen with the 9.7% increase in the cost of sales.This requires further enquiry. Has there been a change in the selling price? Has there been a change to maintain sales volume at the
expense of the profit margin? Has there been discounting or longer running sales? Has there been a change in the sales mix? Have purchase prices risen? Have there been currency effects? Has there been a change in suppliers? If so, why?
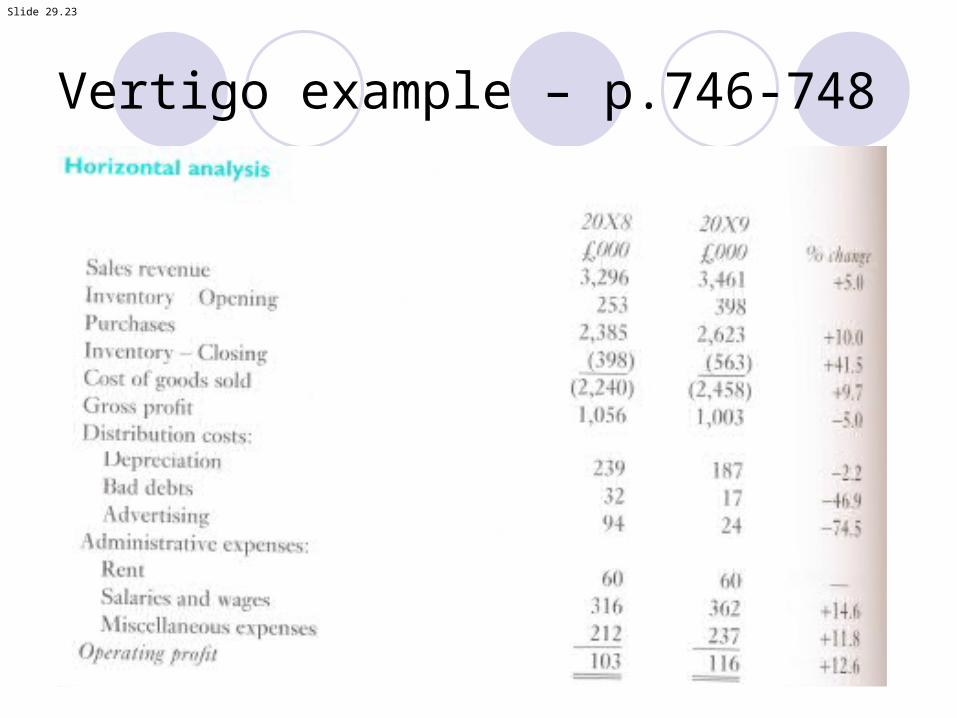
Note that Distribution costs and Admin expenses have also changed considerably. We need to break the Income Statement analysis further:
Slide 29.23
Vertigo example – p.746-748
Slide 29.24
Vertigo example – p.746-748
Review of distribution costs Advertising reduced by 74.5% If the 20X8 levels were
maintained, operating profit would reduce to ₤46,000 - a fall from the previous year of 55% rather than an increase of 12.6%.
There should be further enquiry to establish the normal level over the previous three years - whether there was
heavier advertising in 20X8 to achieve the 5% increase in sales in the light of the company's intention to attempt to obtain further investment in 20X9
whether this is likely to have an adverse effect on future sales and what the company’s reason was for reduced spending.
Bad debts have fallen although there has been an increase in sales and the credit period has increased to 126 days. This raises a query as to the company's credit control and possibility of more bad debts.
Slide 29.25
Vertigo example – p.743-748.
If we go back to the working capital aspects of the Balance Sheet, there are some additional quesitons that need to be answered.
Bad debts have fallen although there has been an increase in sales and the credit period has increased to 126 days. This raises a query as to the company's credit control and possibility of more bad debts.
Slide 29.26
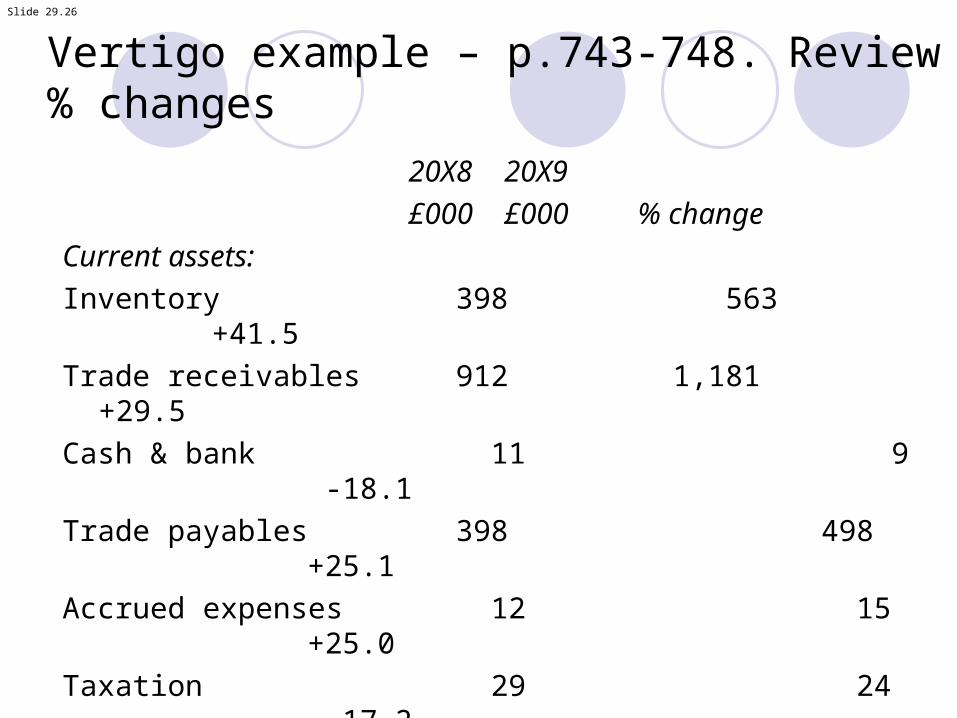
Vertigo example – p.743-748. Review % changes
20X8 20X9
£000 £000 % change
Current assets:
Inventory 398 563 +41.5
Trade receivables 912 1,181 +29.5
Cash & bank 11 9 -18.1
Trade payables 398 498 +25.1
Accrued expenses 12 15 +25.0
Taxation 29 24 -17.2
Bank overdraft 41 97 +136.5
There was a 5% increase in sales for the year.
What can we deduce from these figures and what else should we do?
Slide 29.27
Vertigo example – p.743-748
There has been a buildup of inventory and the credit allowed and taken has increased significantly
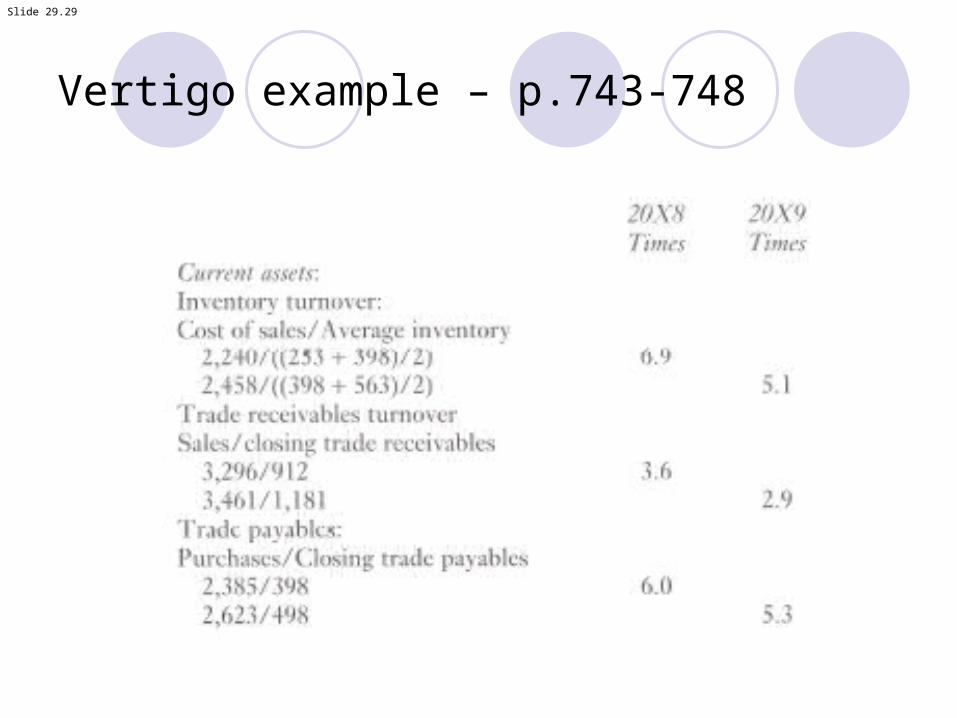
The turnover ratios for trade receivables and payables show that the receivables credit period has increased from 101 days to 126 days and payables period has increased from 60 days to 69 days. Expressed in terms of turnover ratios, receivables have fallen from 3.6 times a year to 2.9 times.
In relation to trade receivables: Has there been a change in the credit terms? Has that been a formal arrangement? Has the company changed its criteria for creating an allowance
for bad debts? Bad debts have fallen but is this due to a reluctance to chase
late payment?
Slide 29.28
Vertigo example – p.743-748
The turnover ratios for inventory lead to the following questions: Why has the increase occurred? Is there a greater risk of obsolescence or further
pressure to reduce the gross profit margin to move the inventory?
The increase in working capital has led to a greater reliance on bank overdraft facilities and is a cause for concern. We need to ascertain the terms and limit of the overdraft.
Slide 29.29
Vertigo example – p.743-748
Slide 29.30
Stress testing
Sensitivity check Effect of a fall in sales.
What IF There were to be a fall in sales of say 5% in 20X9
resulting from the cut in the Advertising budget What would the impact be on the operating profit and
interest cover?
Slide 29.31
Screen business activities
Check financial ratios do not exceed specified limits.
Sharia compliant investment
Slide 29.32
The indices are compiled after
(i) Screening companies to confirm that their business activities are not prohibited or (fall within the 5% threshold)
(ii) Calculating three financial ratios based on total assets and
(iii) Calculating a dividend adjustment factor that results in more relevant benchmarks, as they reflect the total return to an Islamic portfolio net of dividend purification.
The MSCI Islamic indices
Slide 29.33
Sharia investment principles do not allow investment in companies that are directly active in, or derive more than 5% of their revenue (cumulatively) from, the following activities (‘prohibited activities’):
Alcohol: Tobacco: Pork related products: Conventional Financial Services
Defense / Weapons: Gambling / Casino: Music: Hotels.
Business activity screening
Slide 29.34
Sharia investment principles do not allow investment in companies deriving significant income from interest or companies that have excessive leverage. MSCI Barra uses the following three financial ratios to screen for these companies:
•Total debt over total assets •Sum of a company's cash and interest-bearing securities
over total assets•Sum of a company’s accounts receivables and cash over
total assetsNone of the financial ratios may exceed 33.33%.
Financial screening
Slide 29.35
Trend analysis
Multivariate analysis – Z-scoresH-scoresA-scoresBalanced scorecardsValuing shares of an unquoted company –
quantitative processValuing shares of an unquoted company –
qualitative processShareholder value analysisFinancial reporting and risk.
Slide 29.36
Multivariate analysis
Single value score Benchmark criteria applied to this score
Combination of ratios, for example Working capital/Total assets Sales/Total assets
Weighted for predictive capability, for example Working capital/Total assets Weight 0.012 Sales/Total assets Weight 0.999.
Slide 29.37
Multivariate analysis – types of scores
Z-scoresAltman’s Z-scoresTaffler’s Z-scoresPAS-scoreA-scores.
Slide 29.38
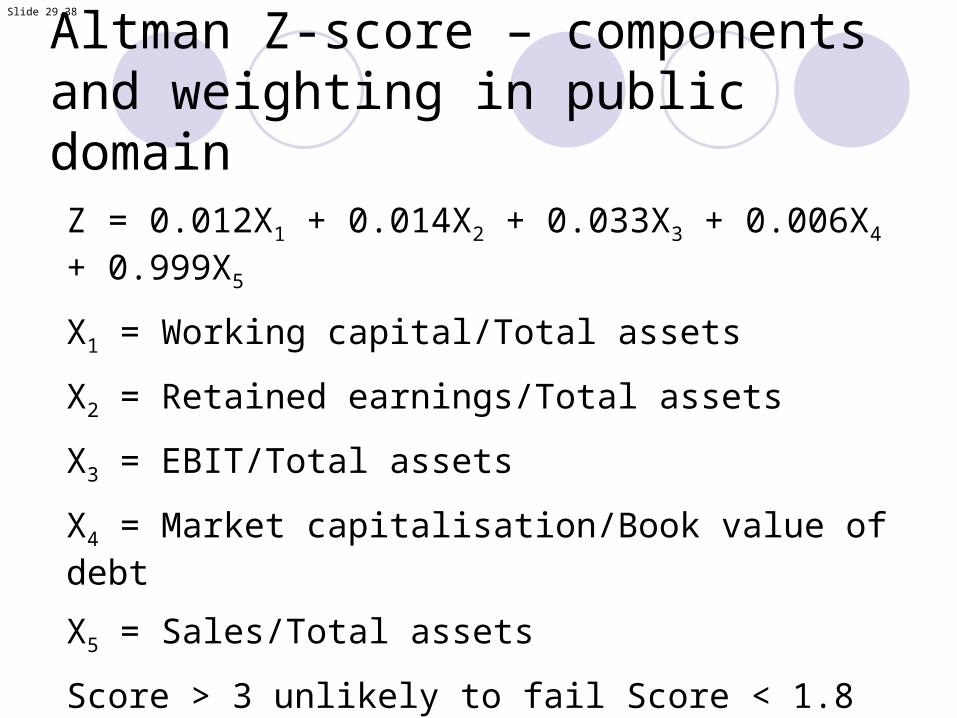
Altman Z-score – components and weighting in public domain
Z = 0.012X1 + 0.014X2 + 0.033X3 + 0.006X4 + 0.999X5
X1 = Working capital/Total assets
X2 = Retained earnings/Total assets
X3 = EBIT/Total assets
X4 = Market capitalisation/Book value of debt
X5 = Sales/Total assets
Score > 3 unlikely to fail Score < 1.8 likely to fail.
Slide 29.39
Audit report: fundamentaluncertainty – going concern
In forming our opinion, we have considered the adequacy of the disclosure
The validity of the going concern basis is dependant on the Company's ability to meet its future working capital requirements and generate free cash flow
The accounts do not include any adjustments that would result from a failure to generate a free cash flow.
Slide 29.40
Audit report: fundamentaluncertainty – going concern (Continued)
It is not practical to quantify the adjustments that might be required, but should any adjustments be required they would be significant
In view of the significance of this fundamental uncertainty, we consider that it should be drawn to your attention but our opinion is not qualified in this respect.
Slide 29.41
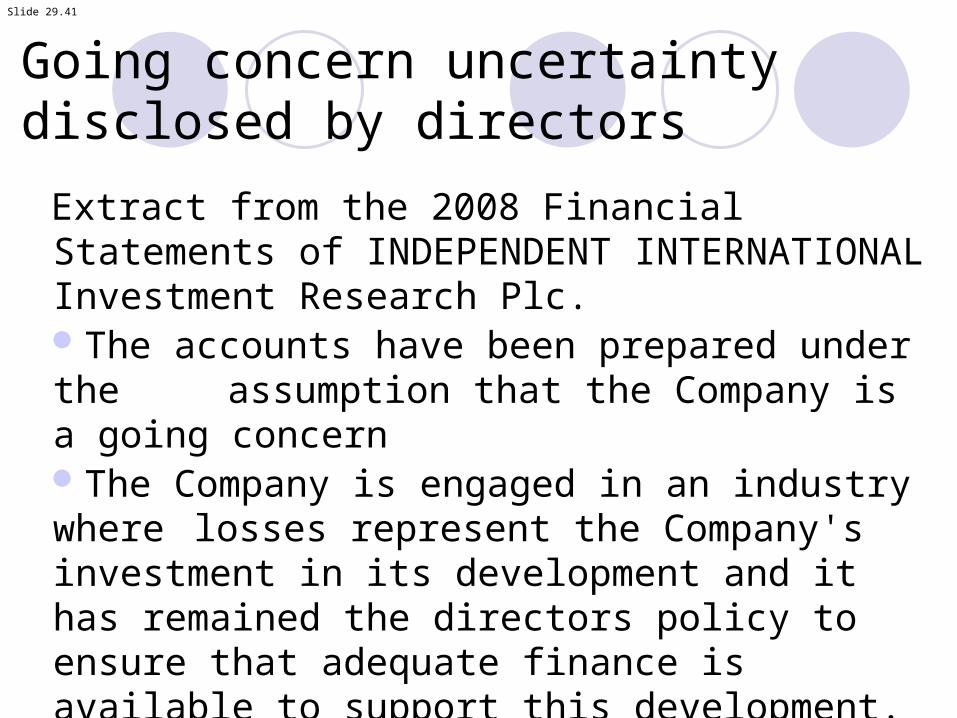
Going concern uncertainty disclosed by directors
Extract from the 2008 Financial Statements of INDEPENDENT INTERNATIONAL Investment Research Plc.The accounts have been prepared under the assumption that the Company is a going concernThe Company is engaged in an industry where losses represent the Company's investment in its development and it has remained the directors policy to ensure that adequate finance is available to support this development.
Slide 29.42
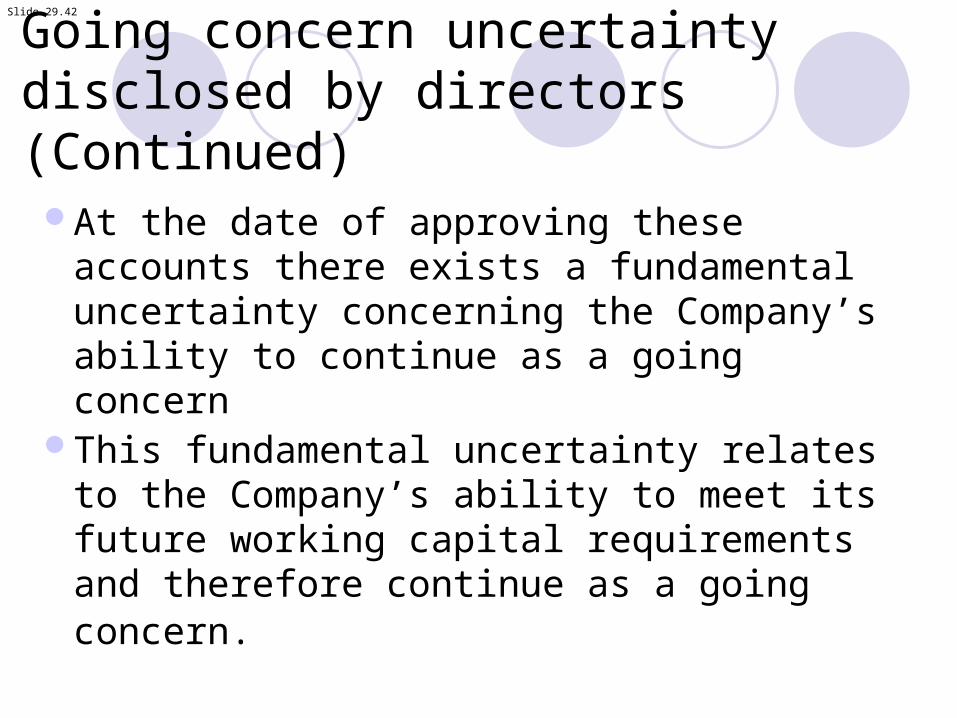
Going concern uncertainty disclosed by directors (Continued)
At the date of approving these accounts there exists a fundamental uncertainty concerning the Company’s ability to continue as a going concern
This fundamental uncertainty relates to the Company’s ability to meet its future working capital requirements and therefore continue as a going concern.
Slide 29.43
Shareholder value analysis
Growing interestAccounting measures (EPS) not related to
share valueLinkage with executive remuneration.
Slide 29.44
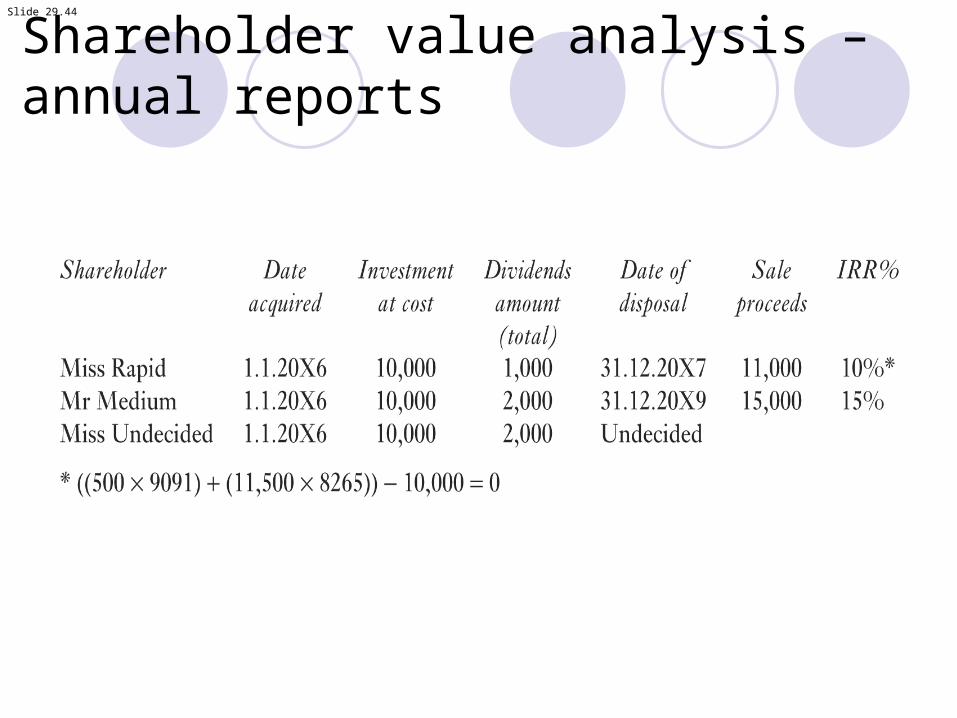
Shareholder value analysis – annual reports
Slide 29.45
Economic Value Added (EVA)
Slide 29.46
Professional risk assessors
Companies are given a rating that can range from AAA for companies with a strong capacity to meet their financial commitments down to D for companies that have been unable to make contractual payments or have filed for bankruptcy with more than 10 ratings in between, for example BBB for companies that have adequate capacity but which are vulnerable to internal or external economic changes.
Slide 29.47
How ratings are set
Internal company factors may include:An appraisal of the financial reports to
determine: Trading performance, for example specific financial
targets such as return on equity and return on assets earnings volatility; past and projected performance; how well a company has coped with business cycles
Cash flow adequacy, for example EBITDA interest cover EBIT interest cover; free operating cash flow
Capital structure, for example gearing ratio; debt structure implications of off balance sheet financing.
Slide 29.48
How ratings are set – internal factors
A consideration of the notes to the accounts to determine possible adverse implications, for example contingent liabilities, heavy capital investment commitments which may impact on future profitability, liquidity and funding requirements
Meetings and discussions with managementMonitoring expectation, for example against quarterly
reports, company press releases, profit warningsMonitoring changes in company strategy, for example
changes to funding structure with company buyback of shares, new divestment or acquisition plans and implications for any debt covenants.
Slide 29.49
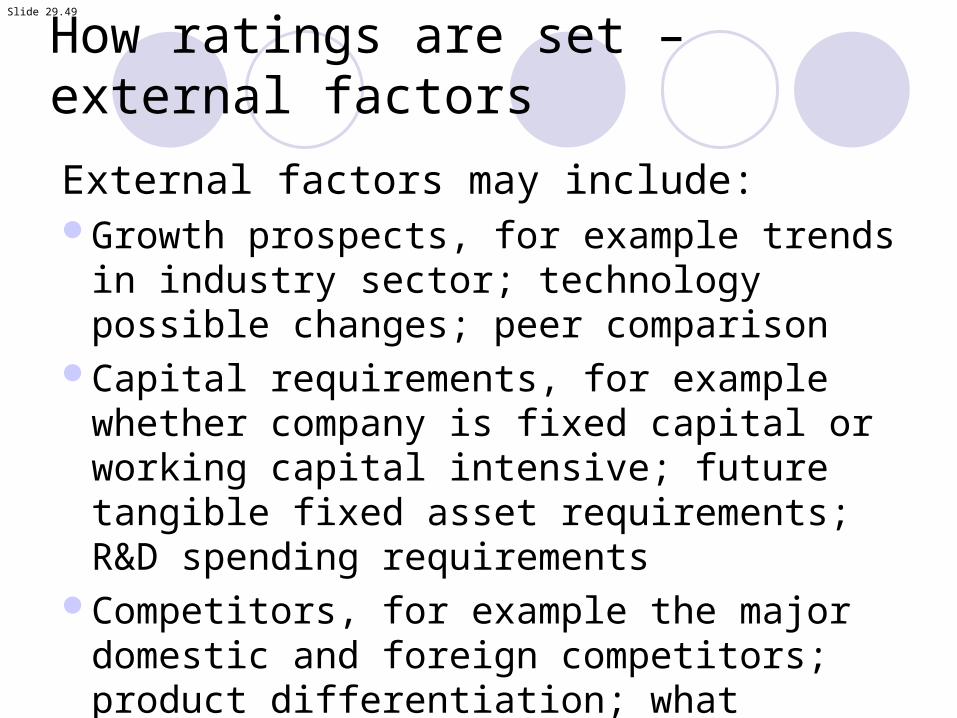
How ratings are set – external factors
External factors may include:Growth prospects, for example trends in industry
sector; technology possible changes; peer comparison
Capital requirements, for example whether company is fixed capital or working capital intensive; future tangible fixed asset requirements; R&D spending requirements
Competitors, for example the major domestic and foreign competitors; product differentiation; what barriers there are to entry.
Slide 29.50
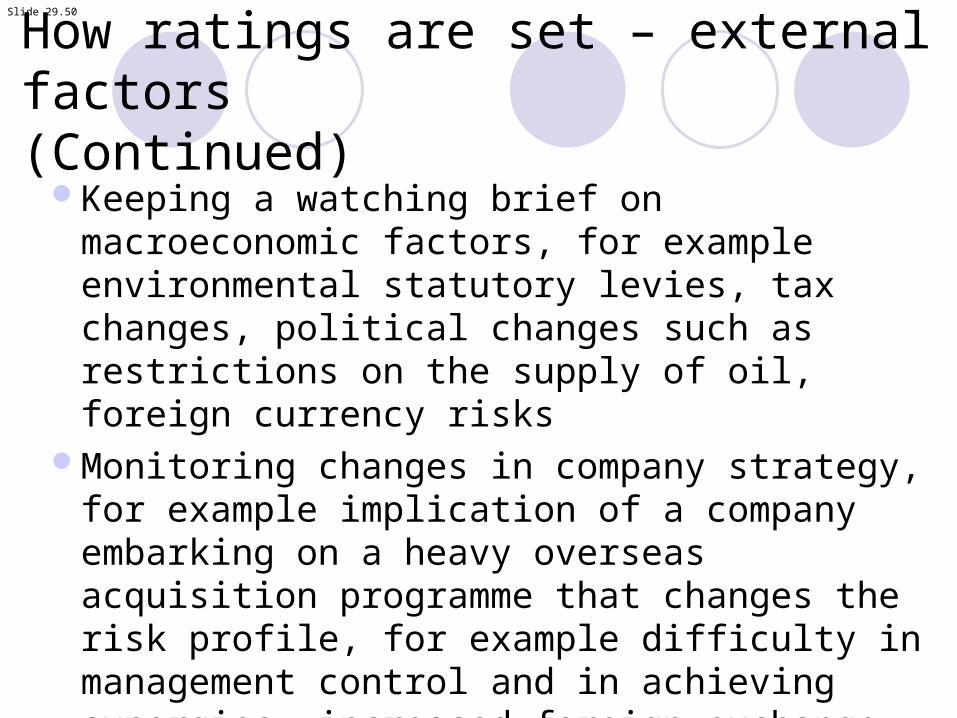
Keeping a watching brief on macroeconomic factors, for example environmental statutory levies, tax changes, political changes such as restrictions on the supply of oil, foreign currency risks
Monitoring changes in company strategy, for example implication of a company embarking on a heavy overseas acquisition programme that changes the risk profile, for example difficulty in management control and in achieving synergies, increased foreign exchange exposure.
How ratings are set – external factors(Continued)
Slide 29.51
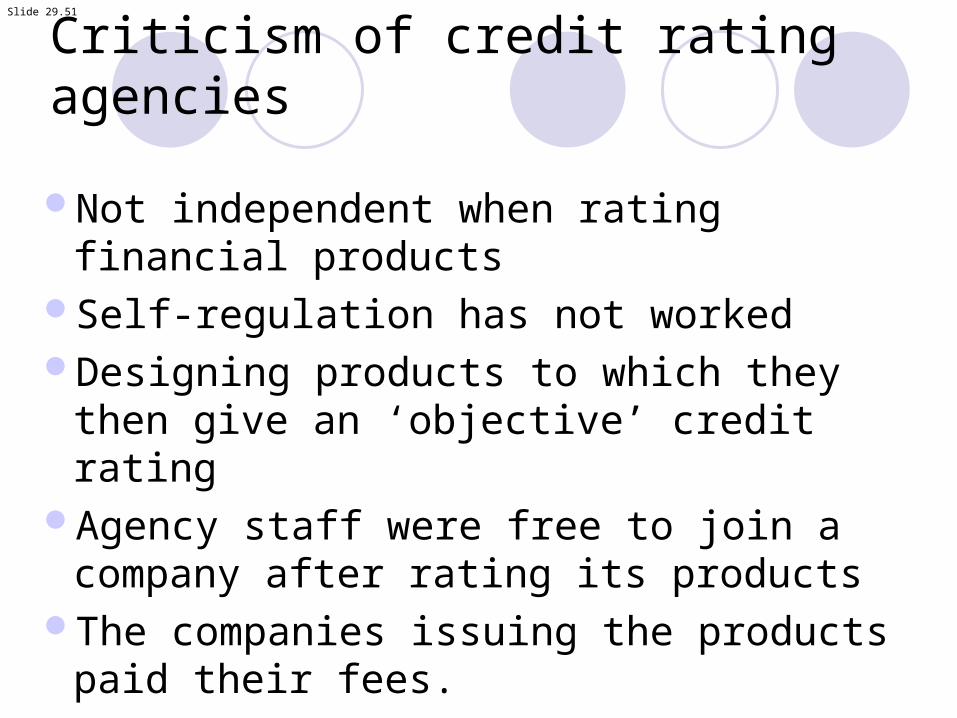
Criticism of credit rating agencies
Not independent when rating financial productsSelf-regulation has not workedDesigning products to which they then give an
‘objective’ credit ratingAgency staff were free to join a company after
rating its productsThe companies issuing the products paid their
fees.
Slide 29.52
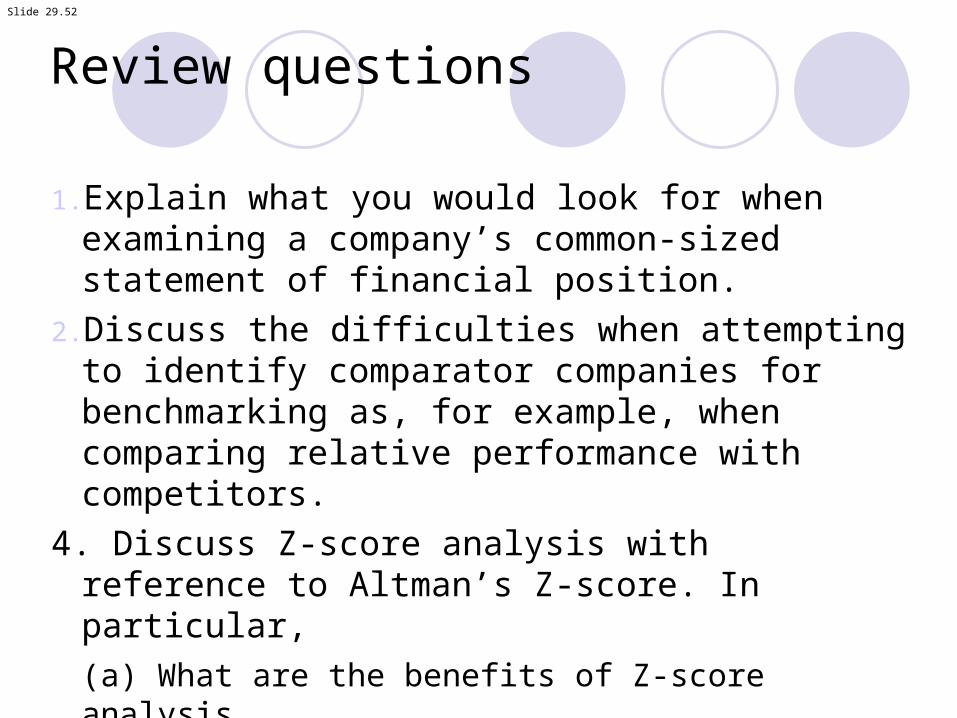
Review questions
1. Explain what you would look for when examining a company’s common-sized statement of financial position.
2. Discuss the difficulties when attempting to identify comparator companies for benchmarking as, for example, when comparing relative performance with competitors.
4. Discuss Z-score analysis with reference to Altman’s Z-score. In particular,
(a) What are the benefits of Z-score analysis
(b) What are the criticisms levelled at Z-score analysis?
Slide 29.53
Review questions (Continued)
7. Explain how and why EVA is calculated.
8. How can “accounting sleight of hand” be used to report increased profits? What can be done to prevent this from occurring?


![Application of P-Dimethylaminobenzaldehyde Benzoylthiourea ... · new selective complexing agents and analytical reagents [1]. Compund with thiourea derivatives has gained considerable](https://img.pdfslide.us/doc/110x75/5e11954b6b589366e637664f/application-of-p-dimethylaminobenzaldehyde-benzoylthiourea-new-selective-complexing.jpg)


![ANALYTICAL METHOD DEVELOPMENT & VALIDATION FOR ... · spectrophotometric analysis of Dutasteride in tablets [15] were reported. Tamsulosin hydrochloride [TAM] is a selective antagonist](https://img.pdfslide.us/doc/110x75/5f7f9cff6e6aa108a12f3ea7/analytical-method-development-validation-for-spectrophotometric-analysis.jpg)