Embed Size (px)
Citation preview
Analyst’s Workspace: An Embodied Sensemaking Environment For Large, High-Resolution Displays
Christopher Andrews* Chris North
Virginia Tech
ABSTRACT Distributed cognition and embodiment provide compelling models for how humans think and interact with the environment. Our examination of the use of large, high-resolution displays from an embodied perspective has lead directly to the development of a new sensemaking environment called Analyst’s Workspace (AW). AW leverages the embodied resources made more accessible through the physical nature of the display to create a spatial workspace. By combining spatial layout of documents and other artifacts with an entity-centric, explorative investigative approach, AW aims to allow the analyst to externalize elements of the sensemaking process as a part of the investigation, integrated into the visual representations of the data itself. In this paper, we describe the various capabilities of AW and discuss the key principles and concepts underlying its design, emphasizing unique design principles for designing visual analytic tools for large, high-resolution displays.
Keywords: Embodiment, distributed cognition, large, high-resolution display, sensemaking, space.
Index Terms: H.5.2 [Information Systems]: Information Interfaces and Presentation—User Interfaces
1 INTRODUCTION Sensemaking, the process of searching out information, breaking it down, and then piecing it back together into an understandable, compelling whole, is the cognitively demanding task that lies at the heart of many analytic domains. One of our great challenges as a research community is to develop tools and techniques that join with the human agent in the sensemaking process.
Thomas et al. have suggested that we need to develop a “science of interaction” to help us to create interfaces that support the analyst in engaging in a discourse with his or her data [47]. Our approach to conceptualizing what a “science of interaction” might involve is rooted in the cognitive theory of distributed cognition. Distributed cognition is a theoretical framework that does not limit the boundaries of cognition to the confines of a single human actor’s head. Instead it is based on the idea that cognition flows into the environment and through social interactions [28]. In essence, interaction can create cognitive systems.
A key precept of distributed cognition is that cognition is embodied [25]. Embodied cognition is the cognitive theory that cognition is tightly bound to the physical body — that perception and physicality allow the cognitive agent to couple with the environment, using cheap environmental cues rather than building a rich internal model [15]. Thus the human body and the
environment do not merely provide stimuli for cognition; they are tightly intertwined with internal resources, combining into a cognitive system.
One of the primary attractions of the distributed cognition perspective is that it can help us observe and reason about cognitive processes by watching the interchange of representations as they are passed between agents in the system [23, 25, 37]. These external representations are the physical symbols, objects, rules and constraints of the system that allow knowledge to be passed between the agents making up the system [52]. This perspective fosters an ethnographic approach based on careful observation of current practices, and can help explain why new systems fail [23].
The challenge we face is in moving past theory and using the outcomes of these observations to build new tools [17]. While we can identify systems that leverage human embodied resources, there seem to be few examples that are actually the result of a process informed by distributed cognition and embodiment. There are exceptions, but many of these seem to focus primarily on replacing or augmenting a single existing physical object [21, 36], and none that we know of are tools for supporting cognitive processes such as analysis.
In this paper, we present a new analytic environment called Analyst’s Workspace (AW), which we hold up as an example of a system design heavily informed by distributed cognition, from conception to implementation. AW was designed specifically for use on large, high-resolution displays, and provides the analyst with a free-form spatial workspace for performing intelligence analysis.
The primary goal of the environment is to support an analytic approach that interleaves both foraging activities (information discovery and identification) and synthesis activities (connecting dots, making hypotheses, constructing narratives). We are trying to address a disconnect that we have observed in many tools with respect to synthesis. Either synthesis is left entirely in the analyst’s head, which can lead to potential problems with cognitive bias and an inability to communicate how a particular conclusion was reached [24], or it is done separately from the foraging activities, eschewing the tight connection between the
email: {cpa, north}@cs.vt.edu * Now at Mount Holyoke College
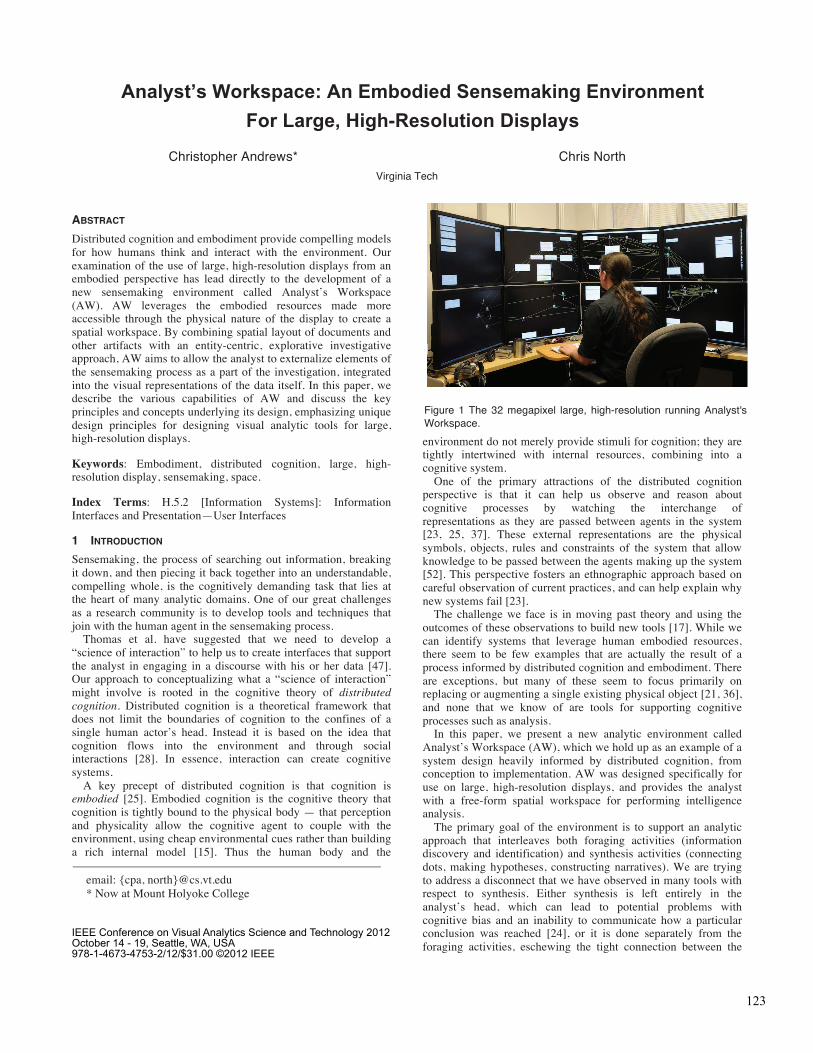
Figure 1 The 32 megapixel large, high-resolution running Analyst's Workspace.
123
IEEE Conference on Visual Analytics Science and Technology 2012October 14 - 19, Seattle, WA, USA 978-1-4673-4753-2/12/$31.00 ©2012 IEEE

two. As Kang observed, the sensemaking process is not easily separable into these separate processes, real analysis is far more “parallel and organic” [33].
In this paper, we describe the development of Analyst’s Workspace, looking not just at its specific capabilities, but also the rationale behind its design.
2 RELATED WORK There are a growing number of analytic tools that are designed to address the needs of intelligence analysts, each covering a range of abilities and features, and thus providing support for different activities within the sensemaking process. Rather than attempt to describe all of the available tools, we instead focus on a few of the significant ones that influenced the development of AW or share similar characteristics.
A popular category of analytic tools is the link analysis tools, such as Analyst’s Notebook [5], Sentinel Visualizer [3], and Palantir Government [6]. These tools are entity based, with the focus placed predominantly on identifying and visualizing connections between entities. The primary activity supported by these tools is exploration – chaining from entity to entity to find patterns of connections. However, we have also seen evidence that these tools are frequently used at the far end of sensemaking process to manually organize the results of an investigation as part of writing a report.
Jigsaw is another tool that is fundamentally concerned with entities and the connections between them [46]. The underlying motivation for Jigsaw, like AW, is to provide support for the analyst — not to replace the analyst with algorithmic processes. Unlike the link analysis tools, the focus is on directing the analyst to the important reports to be read. Jigsaw provides the analyst with a wide variety of visualizations that can be used to illuminate different aspects of the data set and focuses the analyst’s exploration.
There are two features of Jigsaw that were particularly influential in the development of AW. The first is the primacy of the actual textual data. While the link analysis tools work on data extracted from text and other documents, Jigsaw anchors the investigation in the actual text document. The other visualizations are ways to find text documents, rather than trying to be a complete representation of the data. The second feature is essentially an extension of the first. Like the link analysis tools, Jigsaw acknowledges the importance of entities, however, Jigsaw treats them subtly differently. Connections between entities are based on co-occurrence in documents and are used as a way to navigate the document space, viewing them as connections between documents. While co-occurrence may indicate real social connections, that is not necessarily the case, and this use of them is a pragmatic approach that makes good use of the relatively easy to obtain information without imposing additional meaning that may not be supported by the underlying data.
Despite this influence, AW differs significantly from Jigsaw. Jigsaw is primarily a foraging tool, providing exploratory tools for finding interesting data and connections. Until the recent addition of a “Tablet” tool, which provides a freeform space for schematizing and otherwise recording important information, Jigsaw lacked any way to collect or annotate the important pieces of information identified by the system. We have taken the opposite approach with AW, focusing primarily on providing a way for the analyst to hold on to information and work with it.
Entity Workspace provides another source of inspiration. The core purpose of Entity Workspace is to serve as an evidence marshaling tool, allowing the analyst to rapidly make and record connections between entities as they are encountered in the text [14]. The product produced by Entity Workspace is an evidence file, which can then serve as the basis of schema building and
synthesis. Like AW, Entity Workspace is fundamentally concerned with an integrated investigation and allowing lightweight, unspecified connections to facilitate analytic externalization. However, Entity Workspace is primarily a transitional tool — helping the analyst to extract information and put it in a form that can be used for synthesis, rather than attempting to support synthesis itself within the tool.
Occulus’ GeoTime is a similar tool with a different focus. Whereas Entity Workspace helps the analyst to marshal information about entities, GeoTime helps to marshal geographic and temporal information into a single visualization [34]. As with the link analysis tools, visualizing these patterns can help drive the development of schemas. The addition of “stories” [18] provides some support for synthesis activities, but the approach is quite different from AW’s, and the integration is not as tight.
Sandbox [50] and Cambiera [29] are a pair of analytic tools that share the same basic spatial approach to supporting synthesis taken by AW. Sandbox is focused entirely on the synthesis aspect of sensemaking. It provides a freeform workspace coupled with a suite of annotation tools and structuring tools based on formal analytic methods. Sandbox itself provides no foraging tools, but it does integrate with the Trist system — the two of them form the nSpace suite [31]. However, because the foraging is relegated to a separate application, Sandbox cannot offer the same tight level of integration offered by AW, breaking the process into discrete searching, reading, and synthesizing phases. More important is the lack of real physical space. Whereas AW is emulating a large workspace like a whiteboard or a conference table, Sandbox is more akin to working in a notebook. The use of real physical space allows AW to include more information (such as full text documents), and more distinct locations, thus providing greater context for semantic structures [7]. While Sandbox provides a zoomable workspace, it seems that multiple workspaces is a more common approach to managing multiple structures. As such, the primary structures are list-like, with the freeform capabilities of the space used to place relevant images and document links near corresponding suppositions, rather than as a way to show relationships.
Cambiera is even closer in design and goals to AW. Like AW, the space is an integrated one, in which documents and search results have visual representations that can be freely moved around a shared space [29]. Cambiera is also closely tied to the display hardware, as it was specifically designed for use on the Microsoft Surface. By using the tabletop, Isenberg et al. have introduced a similar physicality into the analytic process.
There are a number of differences in our approaches, however, driven by three factors: first, while the Surface provides a reasonably sized workspace, it has a relatively low resolution, second, Cambiera is focused on collaborative work, and third, AW is focused on an entity-centric approach to exploration whereas Cambiera is keyword focused. Due to the limitations in space, documents and search results are displayed as overviews, requiring interaction to view the details. While documents can be opened fully for reading, it is only practical for a couple of documents to open at a time. Another effect of the spatial limitations is to push schematizing and synthesis out of the environment. The environment provides no annotation tools, and Isenberg et al. report in their evaluation that while their users performed some semantic organization in the space, it was fairly minimal and at a very high level. Instead, physical notebooks with no connection to the system were used for most schematizing and synthesis representations [30].
3 SPACE FOR SENSEMAKING The most important feature of AW is the use of a large, free form spatial workspace for organizing documents. There are a number
124
of key advantages to using space as the primary sensemaking medium. First and foremost, humans are cognitively well adapted to making use of space to express and perceive relationships between objects [35]. Importantly, these relationships can be expressed without any other modifying information, such as details regarding the nature of the relationship.
This point is important to the analytic process because it means that spatial organization can support incremental formalism [43]. At its core, sensemaking is the process of structuring information so that it can be understood. The process of constructing schemas, hypotheses, and narratives are essentially structuring operations. However, as Kang discovered, much of the actual process of intelligence is about uncovering the right questions to ask and only then figuring out what the answer might look like and how it can be reached [33]. This will require some experimentation and potentially several different analytic techniques. So, when an investigation begins, it is hard to know what structure the solution will require. The idea behind incremental formalism is to let structure evolve with the growing knowledge and understanding of the information that is being structured. Space works well in this regard, because it can express relationships without the need to describe them [42].
Space lowers the barrier to externalizing aspects of synthesis both cognitively and pragmatically. On the cognitive side, the ability to express lightweight relationships without the burden of knowing what the relationships is or how it fits into the rest of the investigation means that the analyst can externalize half-realized connections without interrupting the flow of an investigation. In addition, because the space itself does not impose any meaning of its own, the analyst can freely try different approaches and applying different spatial metaphors as appropriate to the data [41].
On the pragmatic side, the ease with which these relationships can be expressed makes it more likely that the analyst will actually do it. This is a key design principle that underlies much of the design of AW – we encourage externalization of internal synthesis by reducing the amount of effort required to do so. In this case, we consider this effort to be both cognitive and physical (in the form of distracting interactions). While soliciting more information about a relationship might increase AW’s ability to provide additional assistance, AW, like Entity Workspace, purposely errs in the other direction in order to keep the cost of externalizing down [13]. By encouraging the analyst to externalize schemata into the space, AW helps analysts to represent relationships and categorize information as it is encountered, making relationships visible, and thus more accessible for analysis and questioning [24]. At the same time, it should help the analyst to abstract the information, making it easier to internalize.
3.1 Large, high-resolution displays The idea of using spatial organization as a marshaling tool is not a unique one. The use of spatial organization to make sense of information is practically a daily occurrence in most people’s lives [35]. Spatial hypermedia was developed specifically to tap into human spatial abilities for many of the reasons listed above [44]. It is important, however, to consider how this space is provided to the user.
In our previous work, we studied analyst behavior during a sensemaking task on a large, high-resolution display [8]. Our study demonstrated a number of benefits of the display for the sensemaking process, many of which we can attribute to the fact that the size of the display and the available number of pixels created a spatial environment.
Earlier studies have shown that the use of large, high-resolution displays can increase performance and decrease user frustration when working with large, spatial visualizations [11]. This improvement was attributed to the difference between virtual navigation (e.g., panning and zooming) and physical navigation (e.g., moving body, head and eyes). Large, high-resolution displays provide the opportunity for replacing virtual navigation with physical. While the benefits of physical navigation can be somewhat attributed to efficiency, it can also be argued that there are cognitive advantages as well.
To make this argument, we turn to the theory of embodied cognition. If the environment and the physical body play a strong role in cognition, then we would expect that spatial abilities would draw heavily on the physical resources that actually interact with the environment. These physical resources range from large-scale muscle movement and proprioception resulting from actions such as walking across the room to smaller changes such as glancing at a new region of the display. O’Regan has postulated that the human visual system is actually an example of embodiment in action. His theory is that the rich cohesive visual environment that we perceive is actually created by eye movement and rapid consultations with the physical world [38].
In another of our studies, we explicitly compared virtual and physical workspaces for sensemaking and found that the physical space provided by a large display biases the user towards working spatially, leading to increased externalization of the user’s synthesis [7]. While we cannot as tool developers create couplings for our users [17], we can create environments that increase the potential for these couplings to form. Our work suggests that physical navigation engages more embodied resources, providing a greater opportunity for users to couple with the space, providing more meaning to locations and encouraging a more cohesive view of the entire workspace.
4 SYSTEM OVERVIEW Analyst’s Workspace is specifically designed to aid an analyst in exploring a collection of unstructured text documents (primarily news reports and intelligence reports such as those found in the Visual Analytics Benchmark Repository [4]). In this section, we will discuss the primary features of AW as well as the theory and process that led to the design.
4.1 Physical Environment Unlike the analytic tools described earlier, AW is designed to be an environment, and the physical display is as important as the software. AW was primarily designed to run on the display seen in Figure 1, which has a number of compelling properties. However, the software is not restricted to run only on this particular hardware configuration. The most important criteria is that the display is human scale, which is to say that the display’s size and resolution are closely matched by the limits of the sphere of human influence and perception (particularly visual acuity), which we believe allows us to best leverage human embodied resources [9].
The particular display used for AW’s development is a 4x2 grid of 30’’ monitors, each with resolution of 2560x1600 pixels. This creates a display with an overall resolution of 10240x3200 or about 33 megapixels. Each column is mounted on a freestanding support, which allows the display to be reconfigured to curve around the user. While the curve is not essential to the design of AW, it allows the user to access all of the display from a central position just by turning, which has been shown to be more efficient in most instances [45]. A single desktop computer with multiple graphics cards drives the entire display.
125
There are a couple of practical benefits of this display. The pixel density of the 30’’ monitors means that we get a large number of pixels with a relatively small footprint, making it practical to put the display in an office environment, where it could be used all day, rather than having to install it in a special lab setting (e.g., [12]). A key concern with tiled displays is the way in which the bezels interact with the perception of the space, and we have found that the 30’’ panels provide sufficient uninterrupted real estate to encourage the use of spatial positioning in the environment. Another advantage of the setup is that the use of the single machine as the driver means that the display can be used for any conventional desktop applications and common development tools and libraries can be used.
An important point to make is that while our display is constructed using eight smaller monitors, it should not be considered a multi-monitor setup. The tight tiling and AW’s software component encourage the user to perceive the environment as a single continuous space. In contrast, most multi-monitor configurations encourage the user to think in terms of separate workspaces, usually associated with a distinct application or task [39]. For example, Jigsaw was conceived to take advantage of multiple monitors, and uses the extra space to show more views. The views are connected through brushing and linking, but the spatial relationships between the views are meaningless [46].
4.2 Interaction Interaction is performed through a conventional mouse and keyboard, which are located on a rolling podium so the user can move the input devices to various locations around the display. There have been a number of different interaction techniques proposed for large, high-resolution displays (e.g, [19, 40]), but we have found that the keyboard and mouse are still quite reliable, effective and familiar to users.
AW employs interactions that are similar to most space-based tools. Objects can be dragged around the space with the mouse in the conventional way. Multiple objects can be selected and moved either through the use of a selection rectangle or by holding down a modifier key when clicking on them. All other operations are available either by clicking directly on an object or through contextual menus opened by right clicking on the space or an object, with most operations also having an associated keyboard shortcut.
4.3 Representations As one of the goals of the development of AW is to create a tool that can join the analyst to form a cognitive system, the nature of the available representations is important. A principle role of external representations is to serve as external memory for the analyst; however, the representation of information can radically change how it is used [52]. Our choices are driven by a couple of factors. The first consideration is the importance of being able to access the primary source information [8, 46]. The second factor is our desire to take advantage of that large quantity of information that can be displayed simultaneously in the environment. Third, we want to support both information acquisition and synthesis, so we would like representations can be used to direct foraging activities as well as representations that analysts can conscript as symbols representing various levels of meaning for synthesis. Finally, we would like to use representations to which analysts are already accustomed to aid their adoption and use.
4.3.1 Documents Drawing on our previous studies [7, 8] and Robinson’s study of analysts working with physical artifacts [41], the primary artifacts
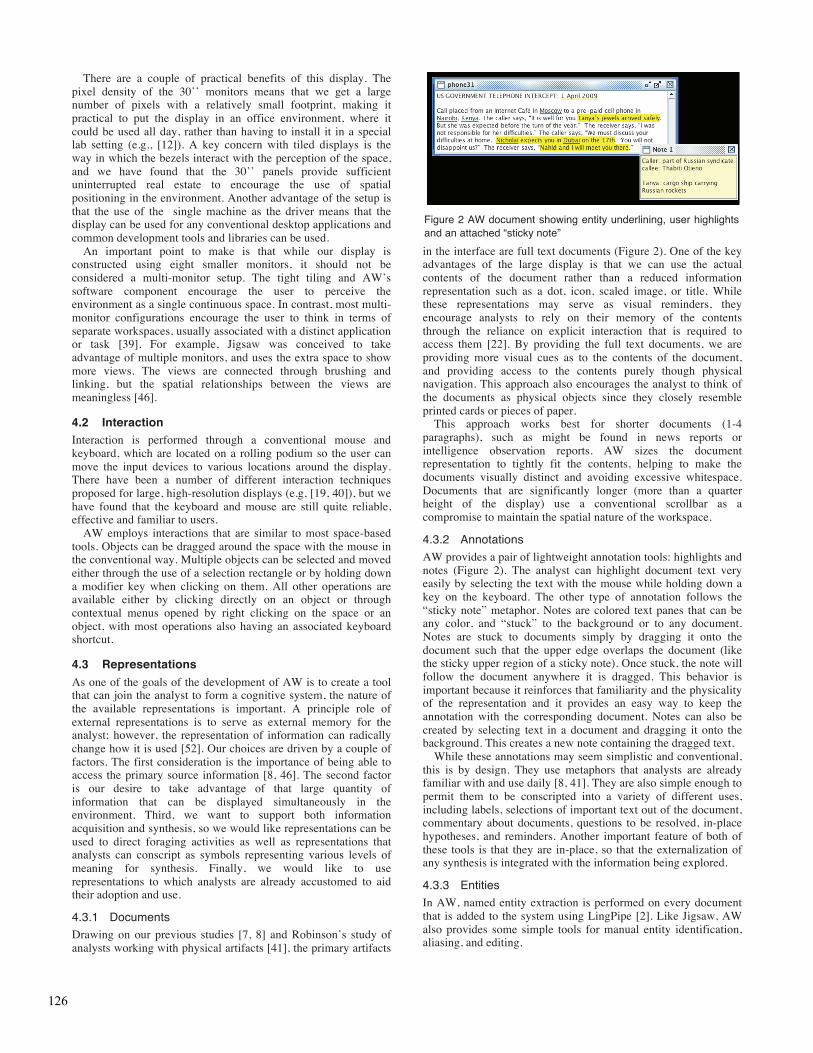
in the interface are full text documents (Figure 2). One of the key advantages of the large display is that we can use the actual contents of the document rather than a reduced information representation such as a dot, icon, scaled image, or title. While these representations may serve as visual reminders, they encourage analysts to rely on their memory of the contents through the reliance on explicit interaction that is required to access them [22]. By providing the full text documents, we are providing more visual cues as to the contents of the document, and providing access to the contents purely though physical navigation. This approach also encourages the analyst to think of the documents as physical objects since they closely resemble printed cards or pieces of paper.
This approach works best for shorter documents (1-4 paragraphs), such as might be found in news reports or intelligence observation reports. AW sizes the document representation to tightly fit the contents, helping to make the documents visually distinct and avoiding excessive whitespace. Documents that are significantly longer (more than a quarter height of the display) use a conventional scrollbar as a compromise to maintain the spatial nature of the workspace.
4.3.2 Annotations AW provides a pair of lightweight annotation tools: highlights and notes (Figure 2). The analyst can highlight document text very easily by selecting the text with the mouse while holding down a key on the keyboard. The other type of annotation follows the “sticky note” metaphor. Notes are colored text panes that can be any color, and “stuck” to the background or to any document. Notes are stuck to documents simply by dragging it onto the document such that the upper edge overlaps the document (like the sticky upper region of a sticky note). Once stuck, the note will follow the document anywhere it is dragged. This behavior is important because it reinforces that familiarity and the physicality of the representation and it provides an easy way to keep the annotation with the corresponding document. Notes can also be created by selecting text in a document and dragging it onto the background. This creates a new note containing the dragged text.
While these annotations may seem simplistic and conventional, this is by design. They use metaphors that analysts are already familiar with and use daily [8, 41]. They are also simple enough to permit them to be conscripted into a variety of different uses, including labels, selections of important text out of the document, commentary about documents, questions to be resolved, in-place hypotheses, and reminders. Another important feature of both of these tools is that they are in-place, so that the externalization of any synthesis is integrated with the information being explored.
4.3.3 Entities In AW, named entity extraction is performed on every document that is added to the system using LingPipe [2]. Like Jigsaw, AW also provides some simple tools for manual entity identification, aliasing, and editing.
Figure 2 AW document showing entity underlining, user highlights and an attached “sticky note”
126

AW represents entities in three different ways. Within documents, entities are identified using colored underlining based on the entity type. We chose to use underlines rather than highlighting because it seemed to make the text more readable, it does not interfere with the user highlights, and it provides the appearance of hyperlinks, indicating their functionality. When the analyst hovers the cursor over an entity, information scent in the form of a text overlay appears that lists any aliases of the entity as well as the number of documents in which the entity appears, helping the analyst decide if the entity is worth pursuing.
When the analyst clicks on an underlined entity, an entity object is opened next to the document (Figure 3). The entity object is initially displayed as a labeled list of the documents in which it appears. Again, we are making use of the available display space to provide some detailed information about the documents. The entity displays the document title if it has one, or the first line of text if it does not. Color is used to indicate the current state of the document: open in the workspace (aqua background), selected (blue background), read (light gray text), and unread (black text).
While the list view is useful for interaction, we found that users conscripted the entity objects for other roles, such as labels for collections of documents, or the representation of social networks that had been uncovered in the documents. To accommodate this usage, entities can be iconified using the button in their upper right corner. This reduces them to a smaller, more recognizable state similar to the representations used in Palantir and Analyst’s Notebook [5, 6] (Figure 4).
4.3.4 Search Results AW provides full text search through the Apache Lucene search engine [1]. The results of a search are persistent in the space, and look similar to the entities (which are essentially specialized searches). In addition to conventional text entry based search, AW will also perform an in-place search that uses the currently selected text, so search can be performed by selecting an interesting phrase, invoking the search tool, and then tapping the ENTER key. In-place searches retain a link back to the source document, providing some simple provenance data about where the search term originated.
4.3.5 Spatial organization While documents and entities are the primary artifacts in the interface, spatial organization is certainly another source of representations in AW. The analyst, rather than AW, provides the spatial organization (and its underlying meaning). Based on observations of the use of space by analysts, we identified three basic spatial structures: clusters, lists, and timelines [8, 41]. To
support these, AW provides a collection of commands (accessible through contextual menu and keyboard shortcuts) that act over the set of currently selected documents. By restricting operations to just the selected documents, AW provides support for the creation of multiple spatial metaphors within the same workspace.
Most of the operations are basic alignment and distribution commands as might be found in a diagramming tool. The purpose of these is to make spatial structures more salient by leveraging the Gestalt principles for grouping. AW adds to these with a timeline command that uses any date information associated with the document to rearrange the documents temporally. The timeline tool will group the documents either vertically or horizontally based on the original arrangement of the selected documents.
4.4 Contextual visualization In order to communicate additional information to the analyst, AW employs contextual or embedded visualization. Yost has previously demonstrated that the increased screen real estate of large, high-resolution displays provides a distinct advantage for embedded visualizations (what she called “space-centric” visualizations) [51]. There are a number of reasons why embedded visualization works particularly well on large, high-resolution displays, but we will focus primarily on context. The available room allows us to embed additional content where it is important, where the analyst can see it and take advantage of it while conducting the investigation.
One fairly basic form of contextual visualization is the coloring of entries in document lists described earlier (e.g., Figure 3). Another example is the treatment of search terms. Like many textual tools, AW highlights occurrences of search terms within the document. Of course, in AW, these highlights are applied to all open documents, allowing the user to get a quick sense of how many of the found documents are already open.
In a large display environment, highlights are not enough to draw user attention, however, as users may miss activity that is out of their current visual field [27], so AW uses visual links that span the workspace. These links are drawn automatically to show containment relationships (entities or search terms that occur in a document, e.g., Figure 3) as well as co-occurrence relationships (two entities that appear in at least one shared document). In addition, the analyst can add new connections to represent additional arbitrary relationships between documents.
Because of the potential for visual clutter through the proliferation of automatically drawn links, the automatic links are only shown if they connect to the currently selected object (manually added links are visually persistent). These links can also be selected, which changes their color and redraws them on top of the other objects in the space, making them easier to trace. Double clicking on a co-occurrence link will open a list of the documents that are shard by the two entities.
As can be seen in Figure 3, the links are also multiscale. Similar to the cross application links described by Waldner et al. [49], selected links connect directly to the link target, not just to the frame that contains it. When a selection event occurs, the type of object being selected (document, entity, search term) is broadcast and the frames that contain the target return a list of the internal targets and the rectangle in which each is contained. Links are then drawn directly to all of these inner targets.
These multiscale links are important because provide instant feedback to the analyst, drawing attention to connections as the analyst works. By linking into the documents, the analyst can use simple physical navigation to quickly assess what the connection is in context. This can reduce cognitive bias by reducing the load on the analyst’s memory through externalization.
Figure 3 An entity showing internal links to instances in a document (green line), as well as links to other open documents (gray lines).
127

4.5 Analytic process While Analyst’s Workspace fully supports keyword-based investigations, entity-directed investigation is anticipated to be the primary technique. The primary technique is to follow an entity-directed investigation technique.
In Figure 3, we see an example document and an open entity. The analyst has identified Thabiti Otieno as a person of interest. The entity is open below the document, showing a list of the other documents in which Otieno appears. We can also see the visual links connecting the entity to the original document as well as several others. In this instance, there are two other open documents which reference Otieno, indicating that there is a previously unexplored connection from the current document back to documents found earlier in the investigation, increasing the potential significance of this entity. Co-occurrence links are not shown in the figure, but when they appear, they show the analyst additional connections in the data set that are not immediately identifiable just from the collection of documents (especially if the documents that form the connection have not yet been opened).
A key goal of AW is that the analyst should be able to find more information about an entity or phrase immediately without leaving the context of the enclosing document. We support this by providing the tools within the document, and reporting the result sets as separate objects near the document. In the course of reading a document, an analyst may even collect a number of leads, which will all then be open in the space providing a visual reminder of which leads to pursue as well as the means of pursuing them. We feel that this approach will influence the analyst into adopting an approach to the data that Kang et al. labeled as “Find a clue, follow the trail (FCFT)” [32]. This technique is not based on narrowing in on a solution from an overview of the entire collection, but instead cuts through the dataset based on leads in the data, making it an efficient approach when there are many irrelevant documents in the data set as these will not be uncovered by the process.
Of course, as the investigation proceeds, we anticipate the analyst constantly externalizing back into the space in the form of annotations and spatial organization as new facts are learned and integrated into some overarching narrative that ties together the known information.
In Figure 4, we provide an example of some externalization. On the left, there is an iconified entity. Looking at the links, we can see that the entity is present in all of the visible documents. The analyst has used the timeline tool to order these documents into a vertical timeline. He then integrated a second spatial metaphor by using horizontal offsets to indicate three separate threads of activity involving this entity.
An important point about this example is that the analyst is using the same visual artifacts to gather information and to schematize that information into a usable form. Since the artifacts are the same, there is no enforced break between actions relating to synthesis and actions relating to foraging for more information — no need for the analyst to break out of the context of the investigation to schematize information, and vice versa, no need to access a separate tool or view to gather more evidence from the data set in support of a hypothesis.
5 USING ANALYSTʼS WORKSPACE The development of Analyst’s Workspace was driven by extensive internal use of the tool as we worked to understand the opportunities offered by large, high-resolution displays for sensemaking. It has been used to successfully solve the text analytics problems in the past two VAST Challenges [16], most recently winning an award [10].
Conducting a controlled evaluation of a tool like AW presents a number of significant challenges, requiring, as it does, subjects capable of conducting an analysis with sufficient time to develop effective strategies for making the best use of the tool in addition to the time required to conduct an analysis of sufficient depth to require the tool’s assistance. Rather than attempting a full comparative evaluation, we instead report on the use of the environment by a single user as she conducted two fairly lengthy analyses using AW. Our user was a psychology student from outside of our lab with an interest in analytic problems, but no background in intelligence analysis or large display use.
We had nine sessions with this user, each lasting from one to two hours. No time limits were imposed on the user, she was just asked to be a thorough as possible in developing her case. She began with a training exercise, consisting of 41 synthetic intelligence reports (28 of which were important). The training spanned four sessions, and 4.5 hours. During these sessions she gained familiarity with the environment and we discussed strategies both for conducting an analysis and using the environment. In particular, she was trained in the FCFT approach and shown how to use space to represent relationships between documents. She then moved to the primary investigation, consisting of 111 documents (57 important), spanning five sessions for a total of 9 hours.
Her investigation began by identifying the three person entities that appeared in the most documents using the frequency ordering in the entity browser. She opened these into the workspace, and worked through the associated documents, following the FCFT strategy, opening entities she encountered in the documents that seemed interesting. Since the entities in this particular data set generally appear in fewer than 10 documents, the start of the investigation followed a breadth-first approach. She would open all of the documents associated with the entity, use the tool to arrange them temporally and then read through them in order, highlighting important passages. Particularly important events or connections or questions were recorded in notes. As she encountered interesting entities, she would open them and put them to one side. She would then select the most interesting entity of the open set and repeat the process - the entities she opened as she read were thus providing a visual record of leads that still needed to be explored.
As she worked, she followed a general schematizing strategy of grouping documents into temporally ordered columns based on
Figure 4 Timeline using offsets to mark different threads. Note also the iconified entity labeling the structure.
128

the person most closely associated with the documents. The entity object was iconified and placed on top of the column, serving as a label as well as an indicator that all of the documents associated with the entity had been explored. She placed columns of related people together, so that the plots and events she was tracking divided the space up into distinct regions. Locations were another important component of her investigation, and when a person was particularly associated with an address or other location, she opened the associated entity and placed it beside the person entity as an additional label.
Throughout the investigation, she made heavy use of the visual links. Whenever she opened a new document, she would look at all of the links to open entities to see how the document fit into the overall picture she was forming. She also made heavy use of the links while she was sorting out relationships. Every time she opened an entity, she would follow all of the visual links to see how the entity fit with the rest of the investigation. This would give her an idea of the context surrounding the entity, and she would move it to a location in the space the minimized the length of the links. The process also helped her remember earlier stages of the investigation, as a link back to an older entity would cause her to skim the associated documents to find the connection.
For the first two thirds of the investigation, the space was divided up based on the various threads she had uncovered. As she learned more, she refined this until she had two discrete narratives. After working to find some connection between the two, she ultimately rejected one of them and cleared the associated documents from the space. She then reordered the space to the state seen in Figure 5. At this point, she has positioned the columns so that the more important people are closer to the top of the workspace, and the horizontal placement shows rough relationships between the displayed people.
Her solution is not perfect; she is a novice to intelligence analysis and she made some incorrect connections based on false assumptions (primarily that all of the references to two common first names all referred to the same two suspects) that encouraged her to try and weave some additional events into her narrative, clouding the final form of the coming attack. However, her solution did have the network of the players and most of the sequence of events leading up to the attack. Her final solution contained 56 of the 57 important documents and about 15 “noise” documents (false positives).
While with the observation of a single user cannot fully validate our approach, it at least provides evidence that supports our theoretic claims about the environment.
One of the goals of the environment was to support coupling between analyst and the space to permit the space to be used as a
cohesive whole where position had meaning to the analyst. As we can see from the workspace, artifacts from the investigation span the entire space. When talking about the investigation, she would gesture to different regions of the display as references to locations or people involved in the threat (e.g., “I can’t find a connection between Morales <points to location on display> and Texas <points to a different region>”). This indicates that regions of the display have assumed meanings for her, and interestingly, at a higher level than the information displayed there (which is to say she was not pointing specifically to a Morales entity).
We saw this conscription of representations for meaning at various levels of the investigation. For example, the primary use of documents was to read the contents. By being present in the workspace, they served as a source of refresh to which she frequently returned. However, there was often evidence that she was attaching other meaning to the documents, sometimes using them to represent an event or a meeting. We did not collect enough information to say definitively, but this suggests that she was able to make use of the documents as material carriers, physical artifacts that temporarily becomes the embodiment of an idea [48]. In other words, the document was, at least temporarily, the event.
Another goal was to support a fluid process in which foraging and synthesis activities seamlessly flowed together. Her process was a constant flow between digging into document, tracing entity connections, and schematizing the results. Looking at the screenshot, we can see that she has a large number of iconfied entities spread across the space, primarily acting as labels and representing the real connections between people and locations (the globe icons). However, even though she was using these primarily as synthesis tools, they were still active foraging tools. As she was organizing the workspace into its final form, she was still continuing to use the entities to flesh out connections, clicking on them and reviewing the connections. In one notable instance elevating the importance of a person as she uncovered additional evidence of just how connected he was through the appearance of the visual links when she selected the entity to move it. This is important because had she been relying on her memory, she clearly would have overlooked this person and thus missed a vital part of the narrative.
While further studies with more experienced users would enhance future development of AW, our work with this user helps to validate our basic design. The environment helped her to explore and manage a large amount of information, resulting in a narrative that was fairly close to the actual hidden plot, and her behavior suggests that it leverages human embodied resources as it was designed to do.
Figure 5 The final solution provided by longitudinal subject. Note the distinct columns, each marked by a collection of related entities.
129

6 FUTURE WORK In addition to conducting more studies, there is also considerable work that can be done, both conceptually and developmentally, to extend this work.
Currently, the focus of AW has been on creating an environment for synthesis. The data exploration tools such as search and entity-based navigation are useful, but not extensive. One of the biggest weaknesses of the approach we have taken is that starting an investigation can be daunting if there is no focused task or question to begin with. While the analyst can make use of tools like our entity browser, which allows entities to be sorted by frequency, or the document browser, which supports automated topic classification, these do not provide obvious entry points. We have done some work attempting to integrate some more advanced data mining techniques into the process [26], but we have not yet succeeded in finding a way to integrate these tools into the environment in a satisfactory manner. Ideally, we would want to find some way to provide the analyst with an overview of the data set. The challenge would be to integrate it into the overall process we have already developed. Conceptually, we would want to make use of the available space to provide an informative overview, which would be at odds with the current additive, constructive use of the space.
Forcespire, which builds on the fundamental design of AW, attempts to provide this through directed clustering. It uses statistical models directed by the analyst’s organizational choices to reorganize the rest of the data appropriately [20]. This is an interesting approach, though it will hit scalability limits quicker than AW due to its reliance on displaying all documents in the space at once.
Another area of AW’s development that we would like to address is the end of the investigation. While AW supports incremental formalism through the use of space and the provided layout tools, there is no strict formalism applied to the data by the end of the process. As such, there is no way to currently transform the workspace into a presentable report. There are two related issues to be explored here. The first question to ask is how personal are the semantics of the spatial layouts? In other words, are final workspaces meaningless to everyone but the analyst who created it, or can others “read” the solution out of the space? Exploring this will tell us how directly we can use the workspace as a result and how much the tool could potentially derive from it. The second question is how much more information can we reasonably get from the analyst? At what point does providing richer information to the system become burdensome, either distracting from the actual analysis or becomes something avoided by the analyst?
7 CONCLUSION Analyst’s Workspace is an analytic environment that leverages the spatial affordances provided by a large, high-resolution display to create a sensemaking workspace. The perspective of distributed cognition and embodiment shaped the design and development of the tool, from initial exploratory studies to implementation. The result of this perspective is not a collection of new visual representations or tools — if it is considered as a collection of “features”, AW should feel very familiar. Our contribution is the combination of representations and how they are used.
Distributed cognition is fundamentally about conscripting external elements into the cognitive process, which requires simple, fluid communication between the disparate elements. Our goal was to provide representations that were already part of the analyst’s process (documents, entities, search results) in a form that was familiar so that they could be easily adopted. The large, high-resolution display provides an environment that engages
human embodied resources for managing and understanding the physical environment, which we exploit to encourage the perspective that the representations behave like persistent physical objects. This provides a simple vector for the analyst to manipulate the representations, externalizing the cognitive process and creating meaning through organization and annotation. While other tools have created similar environments, AW is still unique in the use of representations that can participate in both foraging and synthesis, creating the potential for the development of a cognitive system involving the analyst and the environment.
While there remains more work to be done in evaluating AW’s effectiveness, we feel this work already has a contribution to make. The importance of supporting the whole of the sensemaking process seems to have been overlooked and we hope that our discussion of the design goals of AW can help to shape future tool development. In particular, we would like to highlight a couple of key elements in the design that we feel are particularly important: • The low interaction overhead for expressing relationships
encourages externalization. • The flexibility of the spatial environment encourages the
adoption of incremental formalism and exploration. • The use of the same visual artifacts for synthesis and
foraging leads to more fluid movement between the two processes.
• The use of detailed representations and visual links to draw the analyst’s attention to connections in the workspace reduce cognitive bias by reducing reliance on memory.
The large, high-resolution display creates the opportunity for layers of context through the availability of high levels of detail (e.g., raw text, highlights, entities, documents, spatial structures) to support all of these features. It is through the multi-scale representations that are supported by the display that we can create artifacts that are usable for both foraging and synthesis. This in turn is what allows us to make full use of the environment for low cost externalization.
We think Analyst’s Workspace is a compelling analytic tool that combines some existing analytic concepts into a new environment, and we hope that it inspires the development of new tools and spurs interest in the use of large, high-resolution displays. In addition, we hold this work up as an interesting example of applying distributed cognition to the field of visual analytics. The perspective that the analyst and tool form a cognitive system enabled by the analyst’s embodied resources led to a tool that was more about supporting the analytic process than it was about changing the shape of the information being analyzed. This perspective helped us to develop a working environment that can match the fluid and dynamic process of intelligence analysis to become a cognitive ally to the analyst by integrating foraging and sensemaking activities and encouraging the externalization of artifacts of the synthesis process.
ACKNOWLEDGEMENTS This research was funded in part by NSF FODAVA grant CCF-0937133
REFERENCES [1] Apache Lucene, Retrieved 3/12 from http://lucene.apache.org/. [2] LingPipe, Retrieved 3/12 from http://alias-i.com/lingpipe/. [3] Sentinel Visualizer, Retrieved 3/12 from
http://www.fmsasg.com/Products/SentinelVisualizer/. [4] Visual Analytics Benchmark Repository, Retrieved 3/12 from
http://hcil.cs.umd.edu/localphp/hcil/vast/archive/index.php. [5] Analyst's Notebook, Retrieved 3/12 from http://www.i2group.com/. [6] Palantir, Retrieved 3/12 from http://www.palantirtech.com/.
130

[7] Andrews, C. "Space to Think: Sensemaking and Large, High-Resolution Displays".Ph.D. dissertation, Dept. Comp Sci, Virginia Tech, Blacksburg, VA, 2011.
[8] Andrews, C., Endert, A., and North, C.: "Space to think: large high-resolution displays for sensemaking". In CHI, Atlanta, GA, 2010, pp. 55-64.
[9] Andrews, C., Endert, A., Yost, B., and North, C.: Information Visualization on Large, High-Resolution Displays: issues, Challenges, and Opportunities, Information Visualization, 10, (4), pp. 341-355, 2011.
[10] Andrews, C., Hossain, M.S., Gad, S., Ramakrishnan, N., and North, C.: "Analyst's Workspace: Protecting Vastopolis ". In VAST, Providence, RI, 2011, pp. 323-324.
[11] Ball, R., North, C., and Bowman, D.A.: "Move to improve: promoting physical navigation to increase user performance with large displays". In CHI, New York, NY, 2007, pp. 191-200.
[12] Bi, X., and Balakrishnan, R.: "Comparing usage of a large high-resolution display to single or dual desktop displays for daily work". In CHI New York, NY, USA, 2009, pp. 1005--1014.
[13] Bier, E.A., Card, S.K., and Bodnar, J.W.: "Entity-based collaboration tools for intelligence analysis". In VAST, Columbus, OH, 2008, pp. 99-106.
[14] Bier, E.A., Ishak, E.W., and Chi, E.: "Entity Workspace: An Evidence File That Aids Memory, Inference, and Reading". In ISI, San Diego, CA, 2006, pp. 466-472.
[15] Clark, A.: (2008)Supersizing the Mind: Embodiment, Action, and Cognitive Extension, Oxford University Press.
[16] Costello, L., Grinstein, G., Plaisant, C., and Scholtz, J.: Advancing user-centered evaluation of visual analytic environments through contests, Information Visualization, 8, (3), pp. 230-238, 2009.
[17] Dourish, P.: (2001)Where the Action Is: The Foundations of Embodied Interaction, MIT Press.
[18] Eccles, R., Kapler, T., Harper, R., and Wright, W.: "Stories in GeoTime". In VAST, Sacramento, CA, 2007, pp. 19-26.
[19] Endert, A., Fiaux, P., Chung, H., Stewart, M., Andrews, C., and North, C.: "Chairmouse:Leveraging Natural Chair Rotation for Cursor Navigation on Large, High-Resolution Displays". In CHI, Vancouver, BC, Canada, 2011, .
[20] Endert, A., Han, C., Maiti, D., House, L., Leman, S.C., and North, C.: "Observational-level interaction with statistical models for visual analytics". In VAST, Providence, RI, 2011, .
[21] Fishkin, K.P.: A taxonomy for and analysis of tangible interfaces, Personal Ubiquitous Comput., 8, (5), pp. 347--358, 2004.
[22] Gray, W.D., and Fu, W.-T.: Soft constraints in interactive behavior: the case of ignoring perfect knowledge in-the-world for imperfect knowledge in-the-head, Cognitive Science: A Multidisciplinary Journal, 28, (3), pp. 359--382, 2004.
[23] Halverson, C.A. (1994, Aug). Distributed Cognition as a Theoretical Framework for HCI: Don't Throw the Baby out with the Bathwater - The Importance of the Cursor in Air Traffic Control. Dept. Cog. Sci., Univ. California, San Diego. La Jolla, CA. [Online]. Available: http://www.cogsci.ucsd.edu/research/documents/technical/9403.pdf.
[24] Heuer, R.J.: (1999)Psychology of Intelligence Analysis, Center for the Study of Intelligence.
[25] Hollan, J., Hutchins, E., and Kirsh, D.: Distributed cognition: toward a new foundation for human-computer interaction research, ACM Trans. Comput.-Hum. Interact., 7, (2), pp. 174--196, 2000.
[26] Hossain, M.S., Andrews, C., Ramakrishnan, N., and North, C.: "Helping Intelligence Analysts Make Connections". In AAAI, 2011, pp. 22-31.
[27] Hutchings, D.R., and Stasko, J.: "Consistency, multiple monitors, and multiple windows". In CHI New York, NY, 2007, pp. 211--214.
[28] Hutchins, E.: (1996)Cognition in the Wild, The MIT Press. [29] Isenberg, P., and Fisher, D.: "Collaborative Brushing and Linking for
Co-located Visual Analytics of Document Collections". In Eurovis, 2009, pp. 1031-1038.
[30] Isenberg, P., Fisher, D., Morris, M.R., Inkpen, K., and Czerwinski, M.: " An Exploratory Study of Co-located Collaborative Visual Analytics around a Tabletop Display". In VAST, Salt Lake City UT, 2010, pp. 689-702.
[31] Jonker, D., Wright, W., Schroh, D., Proulx, P., and Cort, B.: "Information Triage with TRIST". In Proc. Int'l Conf. Intelligence Analysis, MITRE, 2005, .
[32] Kang, Y.-a., Gorg, C., and Stasko, J.: "Evaluating visual analytics systems for investigative analysis: Deriving design principles from a case study". In VAST, 2009, pp. 139 -146.
[33] Kang, Y.-a., and Stasko, J.: "Characterizing the intelligence analysis process: Informing visual analytics design through a longitudinal field study.". In VAST, 2011, pp. 21-30.
[34] Kapler, T., and Wright, W.: GeoTime information visualization, Information Visualization, 4, (2), pp. 136--146, 2005.
[35] Kirsh, D.: The intelligent use of space, Artif. Intell., 73, (1-2), pp. 31-68, 1995.
[36] Klemmer, S.R., Hartmann, B., and Takayama, L.: "How bodies matter: five themes for interaction design". In DIS, New York, NY, USA, 2006, pp. 140-149.
[37] Liu, Z., Nersessian, N.J., and Stasko, J.T.: "Distributed Cognition as a Theoretical Framework for Information Visualization". In IEEE Trans. Visualization and Computer Graphics, 2008, .
[38] O'Regan, J.K.: Solving the "real" mysteries of visual perception: the world as an outside memory., Can J Psychol, 46, (3), pp. 461-488, 1992.
[39] Ringel, M.: "When one isn't enough: an analysis of virtual desktop usage strategies and their implications for design". In CHI, New York, NY, USA, 2003, pp. 762--763.
[40] Robertson, G., Czerwinski, M., Baudisch, P., Meyers, B., Robbins, D., Smith, G., and Tan, D.: The Large-Display User Experience, IEEE Comput. Graph. Appl., 25, (4), pp. 44--51, 2005.
[41] Robinson, A.C.: "Collaborative synthesis of visual analytic results". In VAST, 2008, pp. 67-74.
[42] Shipman, I., Frank M., Hsieh, H., Maloor, P., and Moore, J., Michael: "The visual knowledge builder: a second generation spatial hypertext". In HYPERTEXT, New York, NY, 2001, pp. 113-122.
[43] Shipman, I., Frank M., and Marshall, C.C.: Formality Considered Harmful: Experiences, EmergingThemes, and Directions on the Use of Formal Representations inInteractive Systems, CSCW '99, 8, (4), pp. 333-352, 1999.
[44] Shipman, I., Frank M., and Marshall, C.C.: Spatial hypertext: an alternative to navigational and semantic links, ACM Comput. Surv., pp. 14, 1999.
[45] Shupp, L., Andrews, C., Dickey-Kurdziolek, M., Yost, B., and North, C.: Shaping the Display of the Future: The Effects of Display Size and Curvature on User Performance and Insights, ACM Trans. Comput.-Hum. Interact., 24, (1&2), pp. 230 - 272, 2009.
[46] Stasko, J., Gorg, C., Liu, Z., and Singhal, K.: Jigsaw: Supporting Investigative Analysis through Interactive Visualization, VAST '07, pp. 131-138, 2007.
[47] Thomas, J.J., and Cook, K.A. (Eds.). (2005) Illuminating the Path: The Research and Development Agenda for Visual Analytics, (National Visualization and Analytics Center).
[48] Vygotsky, L.: (1986)Thought and Language, MIT Press. [49] Waldner, M., Puff, W., Lex, A., Streit, M., and Schmalstieg, D.:
"Visual links across applications". In GI, Toronto, Ont., Canada, Canada, 2010, pp. 129--136.
[50] Wright, W., Schroh, D., Proulx, P., Skaburskis, A., and Cort, B.: "The Sandbox for analysis: concepts and methods". In CHI, New York, NY, 2006, pp. 801-810.
[51] Yost, B., and North, C.: The Perceptual Scalability of Visualization, IEEE Transactions on Visualization and Computer Graphics, 12, (5), pp. 837--844, 2006.
[52] Zhang, J.: The Nature of External Representations in Problem Solving, Cognitive Science, 21, pp. 179-217, 1997.
131