Embed Size (px)
Citation preview
1
3DS
.CO
M ©
Das
saul
t Sys
tèm
es
| Q4
& F
Y20
12 E
arni
ngs
Pre
sent
atio
n
3DS
.CO
M ©
Das
saul
t Sys
tèm
es |
Q4
& 2
012
Ear
ning
s P
rese
ntat
ion
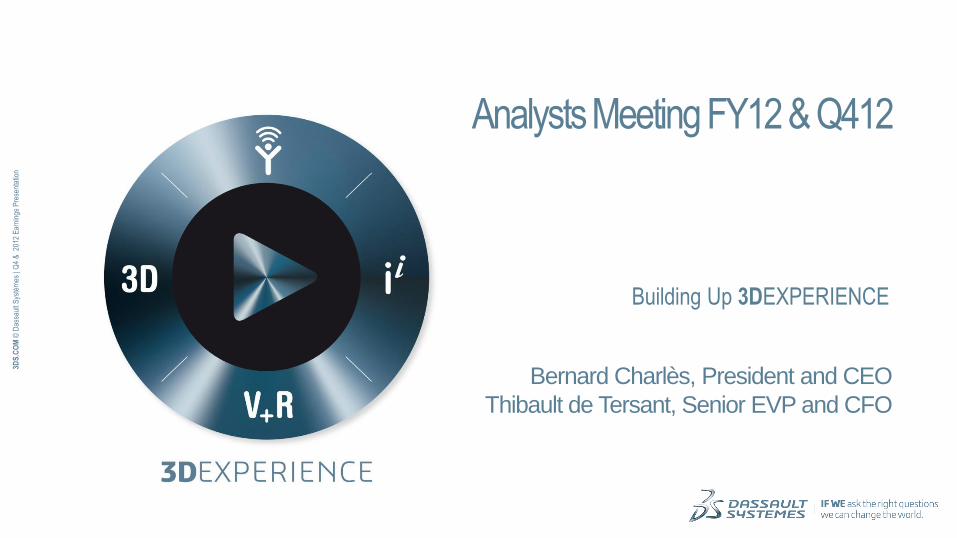
Analysts Meeting FY12 & Q412
Bernard Charlès, President and CEO
Thibault de Tersant, Senior EVP and CFO
Building Up 3DEXPERIENCE
2
3DS
.CO
M ©
Das
saul
t Sys
tèm
es
| Q4
& F
Y20
12 E
arni
ngs
Pre
sent
atio
n
Statements herein that are not historical facts but express expectations or objectives for the future, including but not limited to statements
regarding the Company’s non-IFRS financial performance objectives, are forward-looking statements.
Such forward-looking statements are based on Dassault Systèmes management's current views and assumptions and involve known and
unknown risks and uncertainties. Actual results or performances may differ materially from those in such statements due to a range of factors. If
global economic and business conditions continue to be volatile or deteriorate, the Company’s business results may not develop as currently
anticipated and may decline below their earlier levels for an extended period of time. Furthermore, due to factors affecting sales of the Company’s
products and services, there may be a substantial time lag between any change in global economic and business conditions and its impact on the
Company’s business results.
In preparing such forward-looking statements, the Company has in particular assumed an average U.S. dollar to euro exchange rate of US$1.40
per €1.00 and an average Japanese yen to euro exchange rate of JPY120 to €1.00 for the 2013 first quarter and full year; however, currency
values fluctuate, and the Company’s results of operations may be significantly affected by changes in exchange rates. The Company’s actual
results or performance may also be materially negatively affected by changes in the current global economic context, difficulties or adverse
changes affecting its partners or its relationships with its partners, changes in exchange rates, new product developments, and technological
changes; errors or defects in its products; growth in market share by its competitors; and the realization of any risks related to the integration of
any newly acquired company, in particular related to the integration of Gemcom software International and internal reorganizations. Unfavorable
changes in any of the above or other factors described in the Company’s regulatory reports, including the 2011 Document de référence, and 2012
Half Year Financial Report, which were filed with the French Autorité des marchés financiers (AMF) on March 29, 2012, and July 27, 2012,
respectively, could materially affect the Company’s financial position or results of operations.
Forward Looking Information
3
3DS
.CO
M ©
Das
saul
t Sys
tèm
es
| Q4
& F
Y20
12 E
arni
ngs
Pre
sent
atio
n
Readers are cautioned that the supplemental non-IFRS information presented in this press release is subject to inherent limitations. It is not based on any comprehensive set of accounting rules or principles and should not be considered as a substitute for IFRS measurements. Also, the Company’s supplemental non-IFRS financial information may not be comparable to similarly titled non-IFRS measures used by other companies. Further specific limitations for individual non-IFRS measures, and the reasons for presenting non-IFRS financial information, are set forth in the Company’s annual report for the year ended December 31, 2011 included in the Company’s 2011 Document de référence and the 2012 Half Year Financial Report filed with the AMF on March 29, 2012, and July 27, 2012, respectively.
In the tables accompanying this press release the Company sets forth its supplemental non-IFRS figures for revenue, operating income, operating margin, net income and diluted earnings per share, which exclude the effect of adjusting the carrying value of acquired companies’ deferred revenue, stock-based compensation expense and related social charges, the expenses for the amortization of acquired intangible assets, other income and expense, net, certain one-time items included in financial revenue and other, net, and the income tax effect of the non-IFRS adjustments and certain one-time tax effects in 2012. The tables also set forth the most comparable IFRS financial measure and reconciliations of this information with non-IFRS information.
When the Company believes it would be helpful for understanding trends in its business, the Company provides percentage increases or decreases in its revenue (in both IFRS as well as non-IFRS) to eliminate the effect of changes in currency values, particularly the U.S. dollar and the Japanese yen, relative to the euro. When trend information is expressed herein "in constant currencies", the results of the "prior" period have first been recalculated using the average exchange rates of the comparable period in the current year, and then compared with the results of the comparable period in the current year.
Forward Looking Information

4
3DS
.CO
M ©
Das
saul
t Sys
tèm
es
| Q4
& F
Y20
12 E
arni
ngs
Pre
sent
atio
n
Delivering on 2012 Objectives Non-IFRS
Software revenue growth Double-digit software revenue growth ex FX
EPS growth +15%
Operating margin expansion +120 basis points to 31.6%
Customers expansion +20,000 new customers driven by indirect sales capacities increase
Users expansion 10 million users in total
Geographic diversification High Growth Countries revenue growth: ~ +16% exFX
Industry vertical diversification CPG Retail – Energy – Construction – Natural Resources
Emerging stronger and ready to enter a new phase in our history
5
3DS
.CO
M ©
Das
saul
t Sys
tèm
es
| Q4
& F
Y20
12 E
arni
ngs
Pre
sent
atio
n
1 2012 Strategy
2 2012 Business Review
3
Q4 & FY12 Financial Highlights
4
Q1 & FY13 Financial Objectives
5
5
Financial Information Appendix
Agenda
6
3DS
.CO
M ©
Das
saul
t Sys
tèm
es
| Q4
& F
Y20
12 E
arni
ngs
Pre
sent
atio
n
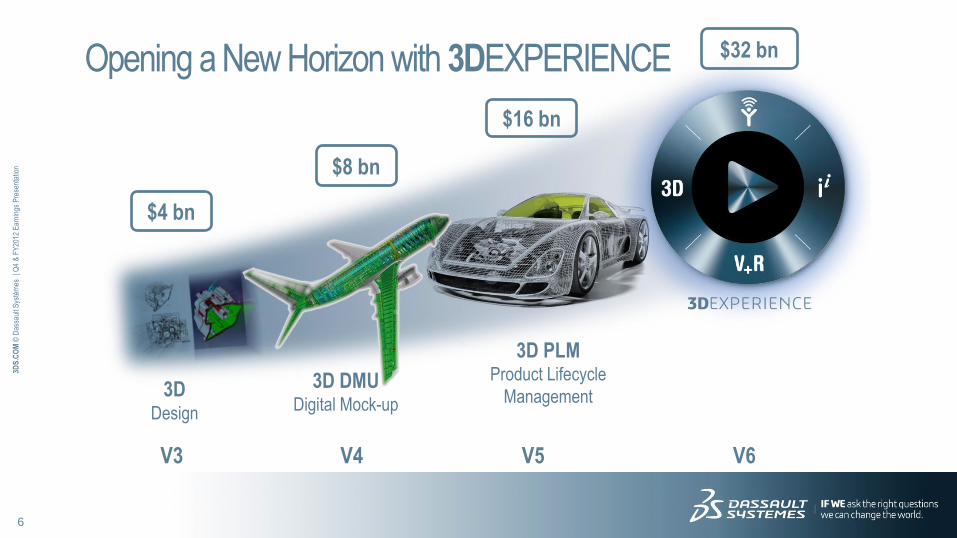
Opening a New Horizon with 3DEXPERIENCE
3D Design
3D DMU Digital Mock-up
3D PLM Product Lifecycle
Management
$4 bn
$8 bn
$16 bn
$32 bn
V3 V4 V5 V6
7
3DS
.CO
M ©
Das
saul
t Sys
tèm
es
| Q4
& F
Y20
12 E
arni
ngs
Pre
sent
atio
n
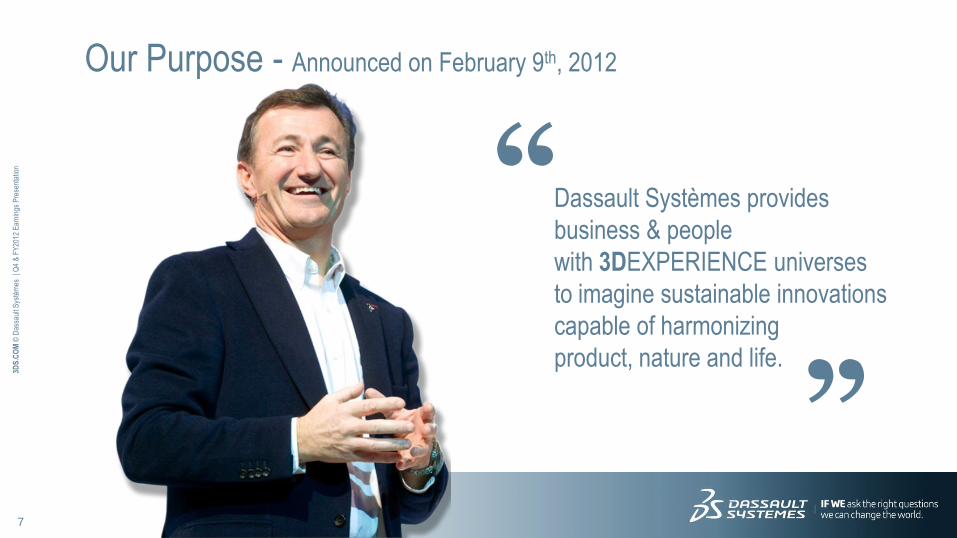
Our Purpose - Announced on February 9th, 2012
Dassault Systèmes provides
business & people
with 3DEXPERIENCE universes
to imagine sustainable innovations
capable of harmonizing
product, nature and life.
“ “
8
3DS
.CO
M ©
Das
saul
t Sys
tèm
es
| Q4
& F
Y20
12 E
arni
ngs
Pre
sent
atio
n
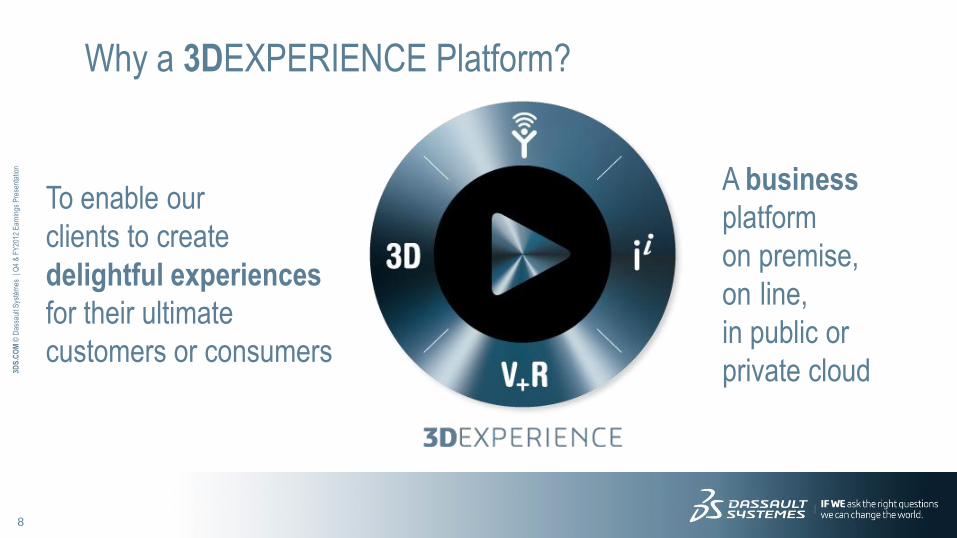
Why a 3DEXPERIENCE Platform?
To enable our
clients to create
delightful experiences
for their ultimate
customers or consumers
A business platform
on premise,
on-line,
in public or
private cloud
A business
platform
on premise,
on-line,
in public or
private cloud
9
3DS
.CO
M ©
Das
saul
t Sys
tèm
es
| Q4
& F
Y20
12 E
arni
ngs
Pre
sent
atio
n
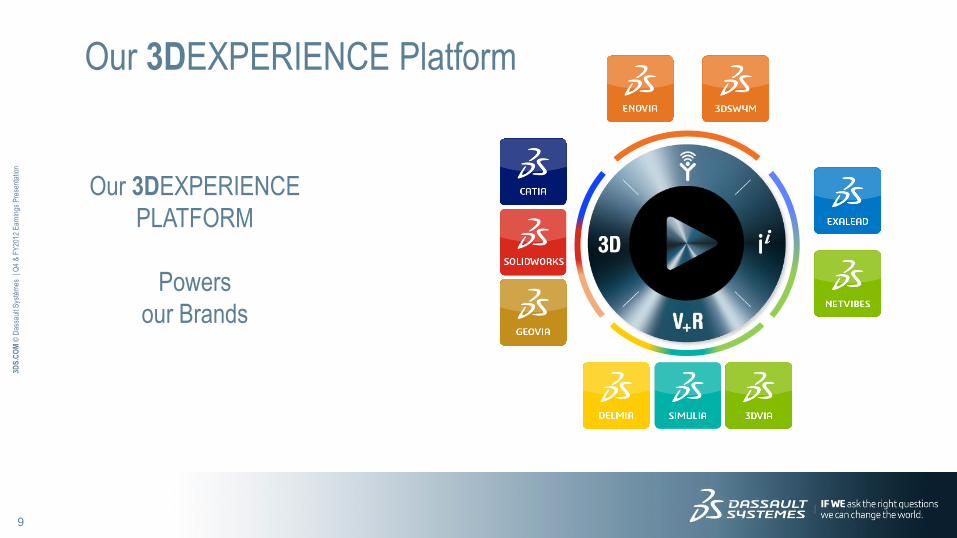
Our 3DEXPERIENCE Platform
Our 3DEXPERIENCE
PLATFORM
Powers
our Brands
10
3DS
.CO
M ©
Das
saul
t Sys
tèm
es
| Q4
& F
Y20
12 E
arni
ngs
Pre
sent
atio
n
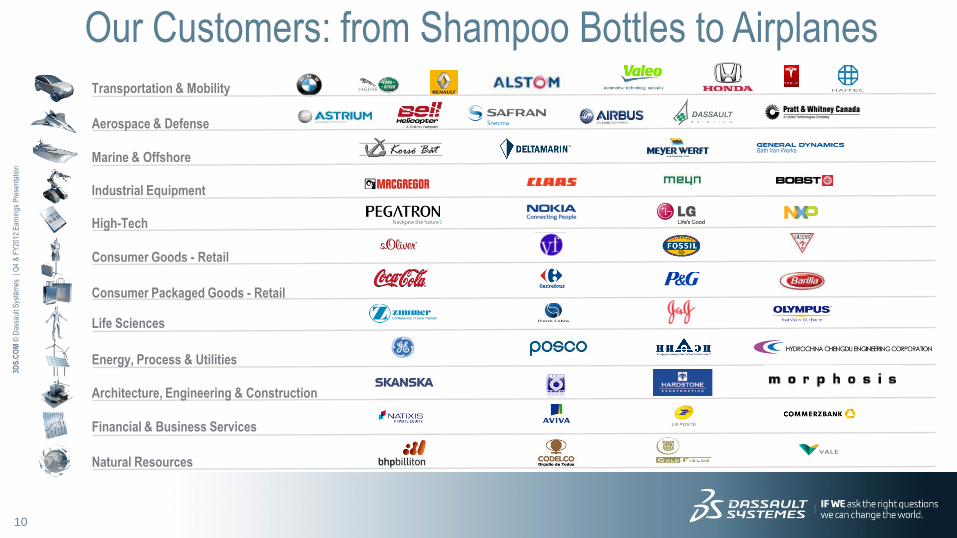
Financial & Business Services
Aerospace & Defense
Transportation & Mobility
Marine & Offshore
High-Tech
Consumer Goods - Retail
Life Sciences
Energy, Process & Utilities
Architecture, Engineering & Construction
Industrial Equipment
Our Customers: from Shampoo Bottles to Airplanes
Natural Resources
Consumer Packaged Goods - Retail
11
3DS
.CO
M ©
Das
saul
t Sys
tèm
es
| Q4
& F
Y20
12 E
arni
ngs
Pre
sent
atio
n
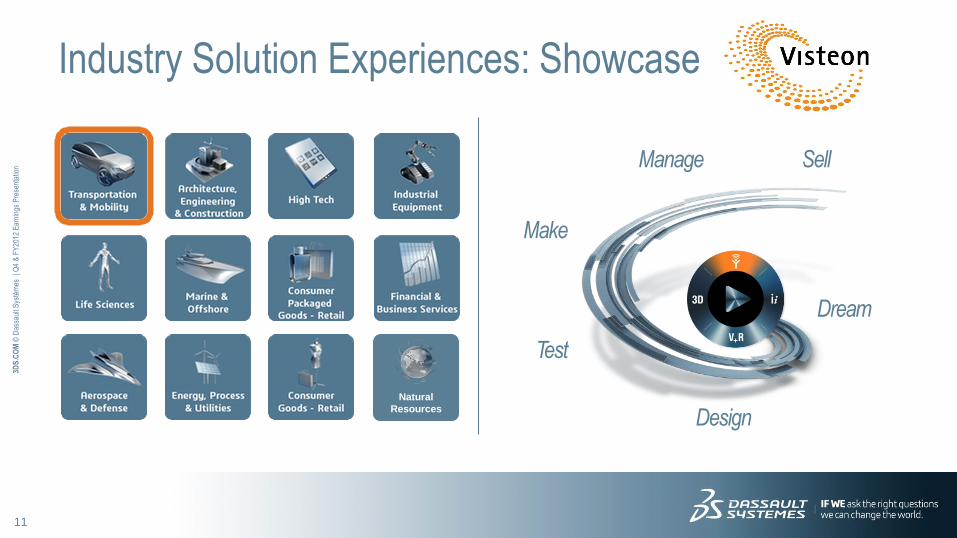
Industry Solution Experiences: Showcase
Natural
Resources
Design
Dream
Manage
Test
Make
Sell
12
3DS
.CO
M ©
Das
saul
t Sys
tèm
es
| Q4
& F
Y20
12 E
arni
ngs
Pre
sent
atio
n
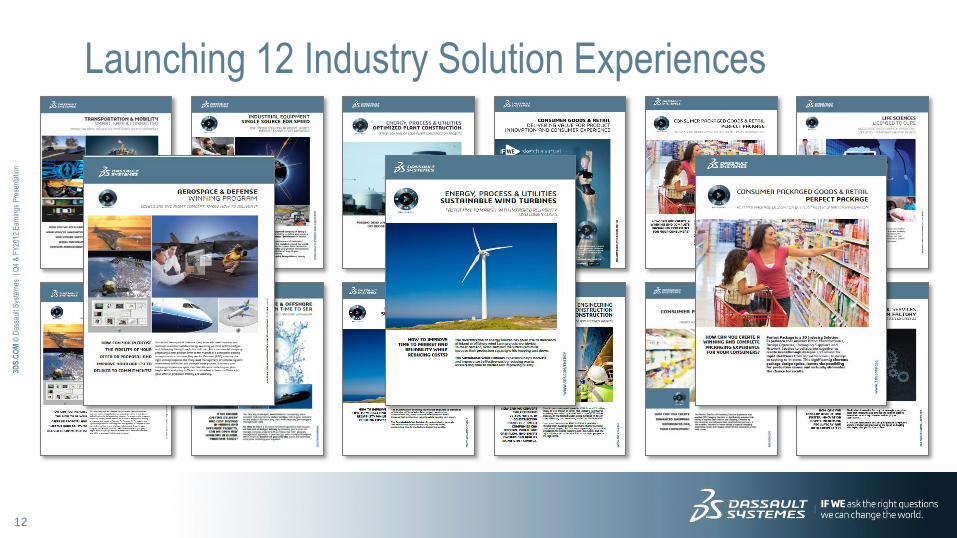
Launching 12 Industry Solution Experiences
13
3DS
.CO
M ©
Das
saul
t Sys
tèm
es
| Q4
& F
Y20
12 E
arni
ngs
Pre
sent
atio
n
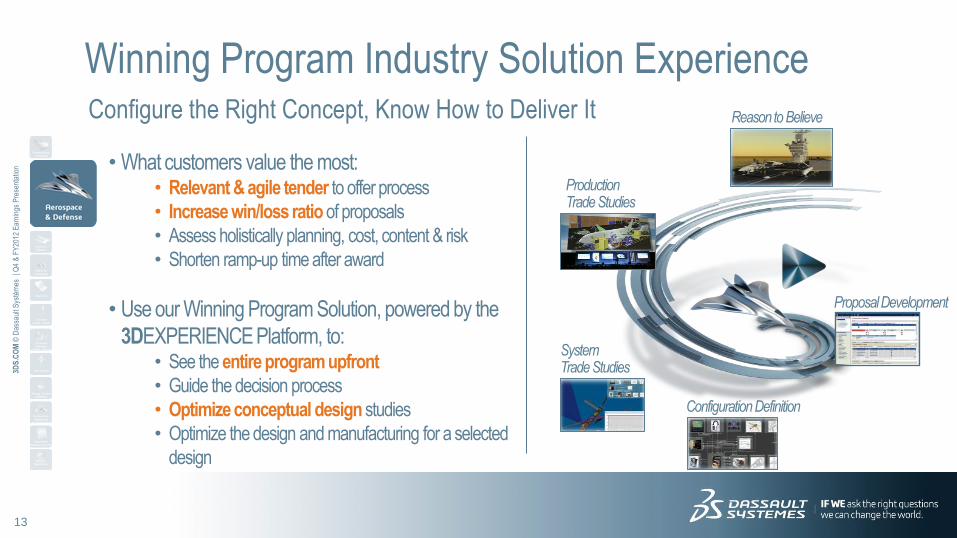
Winning Program Industry Solution Experience Configure the Right Concept, Know How to Deliver It
Configuration Definition
Proposal Development
Reason to Believe
System Trade Studies
Production Trade Studies
Natural
Resources
• What customers value the most: • Relevant & agile tender to offer process
• Increase win/loss ratio of proposals
• Assess holistically planning, cost, content & risk
• Shorten ramp-up time after award
• Use our Winning Program Solution, powered by the
3DEXPERIENCE Platform, to: • See the entire program upfront
• Guide the decision process
• Optimize conceptual design studies
• Optimize the design and manufacturing for a selected
design
14
3DS
.CO
M ©
Das
saul
t Sys
tèm
es
| Q4
& F
Y20
12 E
arni
ngs
Pre
sent
atio
n
Winning Program Industry Solution Experience Video
15
3DS
.CO
M ©
Das
saul
t Sys
tèm
es
| Q4
& F
Y20
12 E
arni
ngs
Pre
sent
atio
n
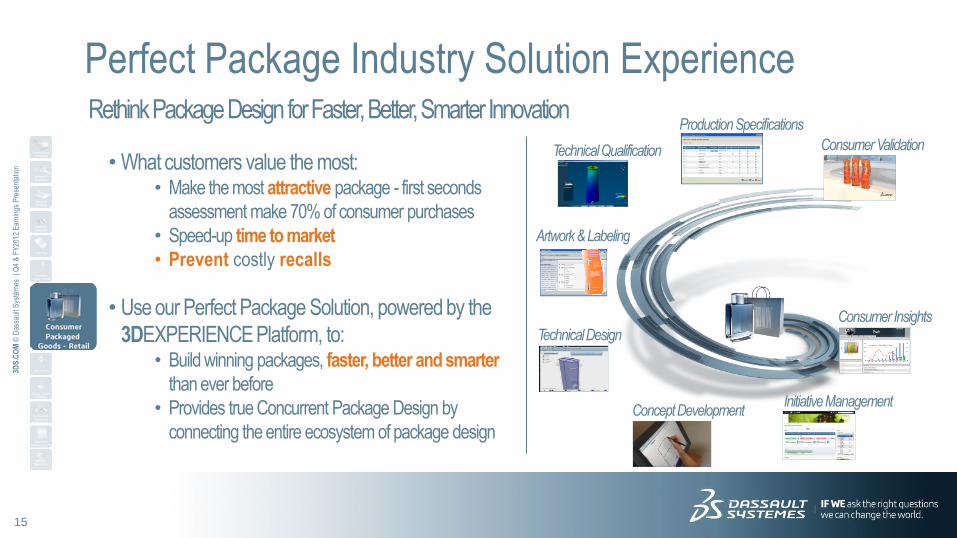
Perfect Package Industry Solution Experience Rethink Package Design for Faster, Better, Smarter Innovation
Concept Development
Consumer Insights
Production Specifications
Technical Design
Technical Qualification Consumer Validation
Natural
Resources
Initiative Management
Artwork & Labeling
• What customers value the most: • Make the most attractive package - first seconds
assessment make 70% of consumer purchases
• Speed-up time to market
• Prevent costly recalls
• Use our Perfect Package Solution, powered by the
3DEXPERIENCE Platform, to: • Build winning packages, faster, better and smarter
than ever before
• Provides true Concurrent Package Design by
connecting the entire ecosystem of package design
16
3DS
.CO
M ©
Das
saul
t Sys
tèm
es
| Q4
& F
Y20
12 E
arni
ngs
Pre
sent
atio
n
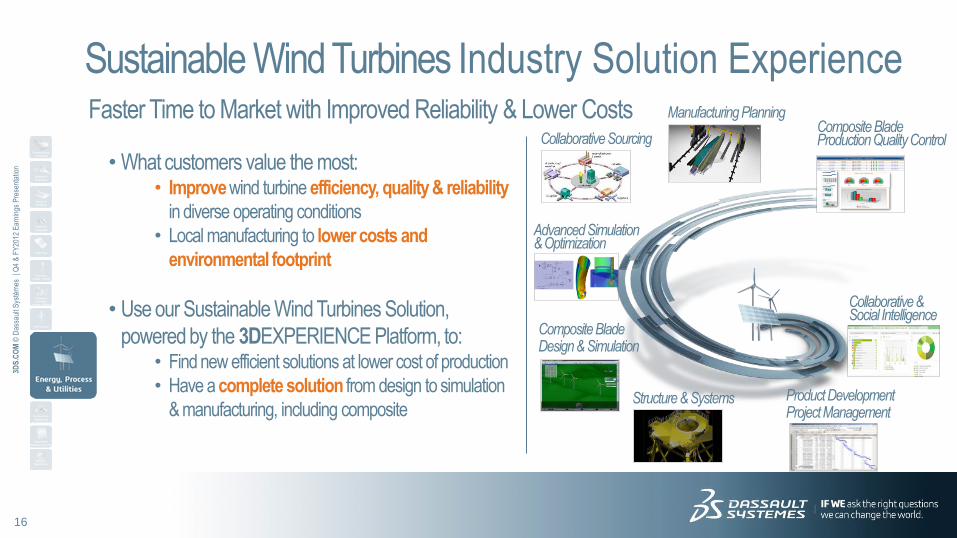
Sustainable Wind Turbines Industry Solution Experience Faster Time to Market with Improved Reliability & Lower Costs
Natural
Resources
Collaborative & Social Intelligence
Manufacturing Planning
Composite Blade Design & Simulation
Collaborative Sourcing Composite Blade Production Quality Control
Advanced Simulation & Optimization
Product Development Project Management
Structure & Systems
• What customers value the most: • Improve wind turbine efficiency, quality & reliability
in diverse operating conditions
• Local manufacturing to lower costs and
environmental footprint
• Use our Sustainable Wind Turbines Solution,
powered by the 3DEXPERIENCE Platform, to: • Find new efficient solutions at lower cost of production
• Have a complete solution from design to simulation
& manufacturing, including composite

17
3DS
.CO
M ©
Das
saul
t Sys
tèm
es
| Q4
& F
Y20
12 E
arni
ngs
Pre
sent
atio
n
SquareClock Acquisition
Online Social 3DEXPERIENCE
18
3DS
.CO
M ©
Das
saul
t Sys
tèm
es
| Q4
& F
Y20
12 E
arni
ngs
Pre
sent
atio
n
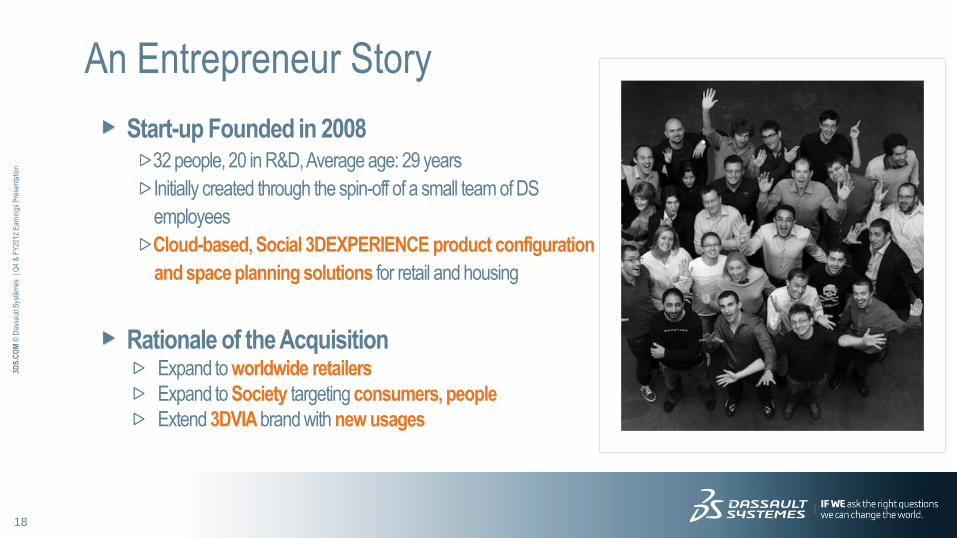
Start-up Founded in 2008 32 people, 20 in R&D, Average age: 29 years
Initially created through the spin-off of a small team of DS
employees
Cloud-based, Social 3DEXPERIENCE product configuration
and space planning solutions for retail and housing
Rationale of the Acquisition Expand to worldwide retailers
Expand to Society targeting consumers, people
Extend 3DVIA brand with new usages
An Entrepreneur Story
19
3DS
.CO
M ©
Das
saul
t Sys
tèm
es
| Q4
& F
Y20
12 E
arni
ngs
Pre
sent
atio
n
1 2012 Strategy
2 2012 Business Review
3
Q4 & FY12 Financial Highlights
4
Q1 & FY13 Financial Objectives
5
5
Financial Information Appendix
Agenda

20
3DS
.CO
M ©
Das
saul
t Sys
tèm
es
| Q4
& F
Y20
12 E
arni
ngs
Pre
sent
atio
n
Customers Expansion
Users Expansion
Geographic Diversification
Industry Vertical Diversification
2012 Business Review
21
3DS
.CO
M ©
Das
saul
t Sys
tèm
es
| Q4
& F
Y20
12 E
arni
ngs
Pre
sent
atio
n
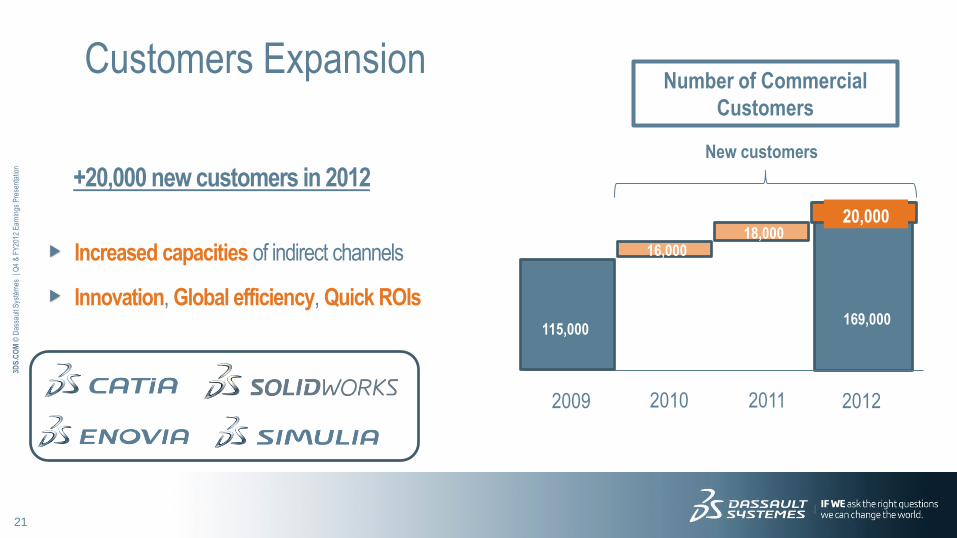
Customers Expansion
115,000
20,000 18,000
169,000
2009 2011 2012
16,000
2010
New customers
+20,000 new customers in 2012
Increased capacities of indirect channels
Innovation, Global efficiency, Quick ROIs
Number of Commercial
Customers
22
3DS
.CO
M ©
Das
saul
t Sys
tèm
es
| Q4
& F
Y20
12 E
arni
ngs
Pre
sent
atio
n
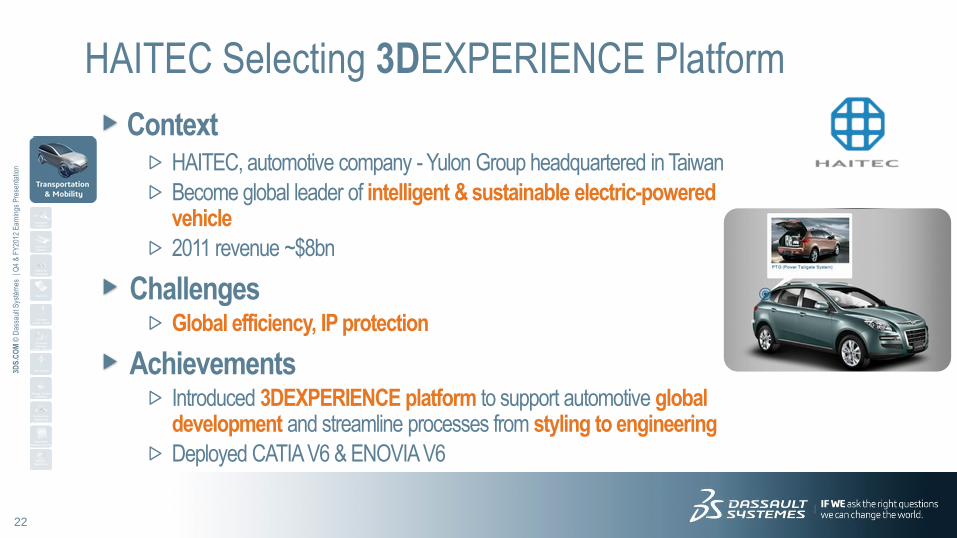
Context HAITEC, automotive company - Yulon Group headquartered in Taiwan
Become global leader of intelligent & sustainable electric-powered vehicle
2011 revenue ~$8bn
Challenges Global efficiency, IP protection
Achievements Introduced 3DEXPERIENCE platform to support automotive global development and streamline processes from styling to engineering
Deployed CATIA V6 & ENOVIA V6
HAITEC Selecting 3DEXPERIENCE Platform
Natural
Resources
23
3DS
.CO
M ©
Das
saul
t Sys
tèm
es
| Q4
& F
Y20
12 E
arni
ngs
Pre
sent
atio
n
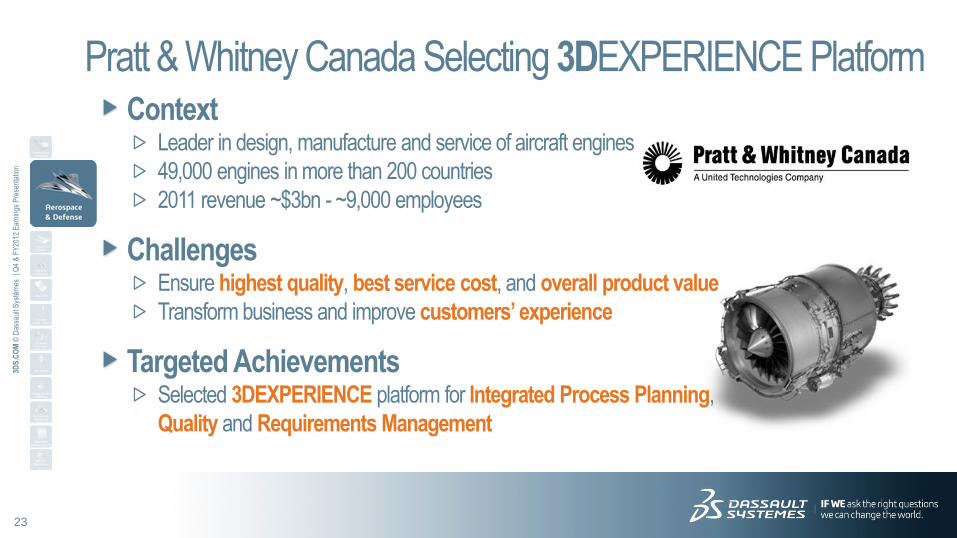
Context Leader in design, manufacture and service of aircraft engines
49,000 engines in more than 200 countries
2011 revenue ~$3bn - ~9,000 employees
Challenges Ensure highest quality, best service cost, and overall product value
Transform business and improve customers’ experience
Targeted Achievements Selected 3DEXPERIENCE platform for Integrated Process Planning,
Quality and Requirements Management
Pratt & Whitney Canada Selecting 3DEXPERIENCE Platform
Natural
Resources
24
3DS
.CO
M ©
Das
saul
t Sys
tèm
es
| Q4
& F
Y20
12 E
arni
ngs
Pre
sent
atio
n
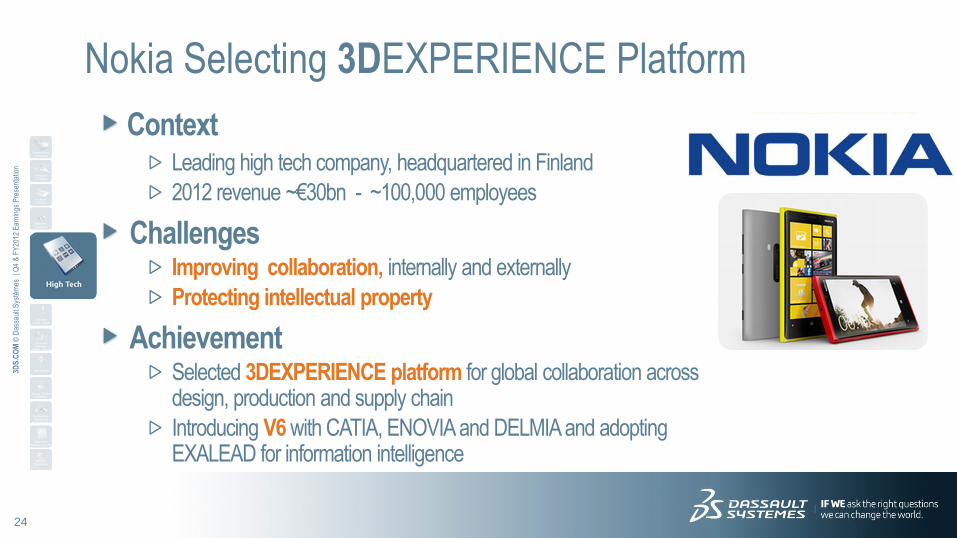
Context Leading high tech company, headquartered in Finland
2012 revenue ~€30bn - ~100,000 employees
Challenges Improving collaboration, internally and externally
Protecting intellectual property
Achievement Selected 3DEXPERIENCE platform for global collaboration across design, production and supply chain
Introducing V6 with CATIA, ENOVIA and DELMIA and adopting EXALEAD for information intelligence
Nokia Selecting 3DEXPERIENCE Platform
Natural
Resources
25
3DS
.CO
M ©
Das
saul
t Sys
tèm
es
| Q4
& F
Y20
12 E
arni
ngs
Pre
sent
atio
n
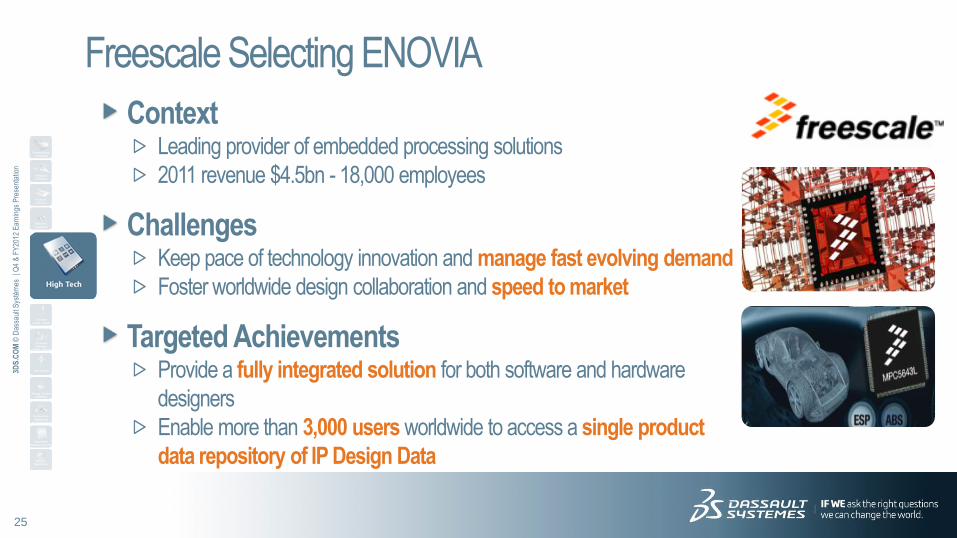
Context Leading provider of embedded processing solutions
2011 revenue $4.5bn - 18,000 employees
Challenges Keep pace of technology innovation and manage fast evolving demand
Foster worldwide design collaboration and speed to market
Targeted Achievements Provide a fully integrated solution for both software and hardware
designers
Enable more than 3,000 users worldwide to access a single product
data repository of IP Design Data
Freescale Selecting ENOVIA
Natural
Resources
26
3DS
.CO
M ©
Das
saul
t Sys
tèm
es
| Q4
& F
Y20
12 E
arni
ngs
Pre
sent
atio
n
Customers Expansion
Users Expansion
Geographic Diversification
Industry Vertical Diversification
2012 Business Review

27
3DS
.CO
M ©
Das
saul
t Sys
tèm
es
| Q4
& F
Y20
12 E
arni
ngs
Pre
sent
atio
n
Users Expansion
Reaching 10m users in total SOLIDWORKS exceeding 2m users
0
500,000
1,000,000
1,500,000
2,000,000
2,500,000
1996 1998 2000 2002 2004 2006 2008 2010 2012
SOLIDWORKS Users (Commercial & Education)
Total Users Breakdown (%)
~35%
~20%
~20%
~25% 35%
23%
20%
22%Netvibes & Exalead
3DVIA
SOLIDWORKS
CATIA, ENOVIA, Spatial
principally
28
3DS
.CO
M ©
Das
saul
t Sys
tèm
es
| Q4
& F
Y20
12 E
arni
ngs
Pre
sent
atio
n
Customers Expansion
Users Expansion
Geographic Diversification
Industry Vertical Diversification
2012 Business Review
29
3DS
.CO
M ©
Das
saul
t Sys
tèm
es
| Q4
& F
Y20
12 E
arni
ngs
Pre
sent
atio
n
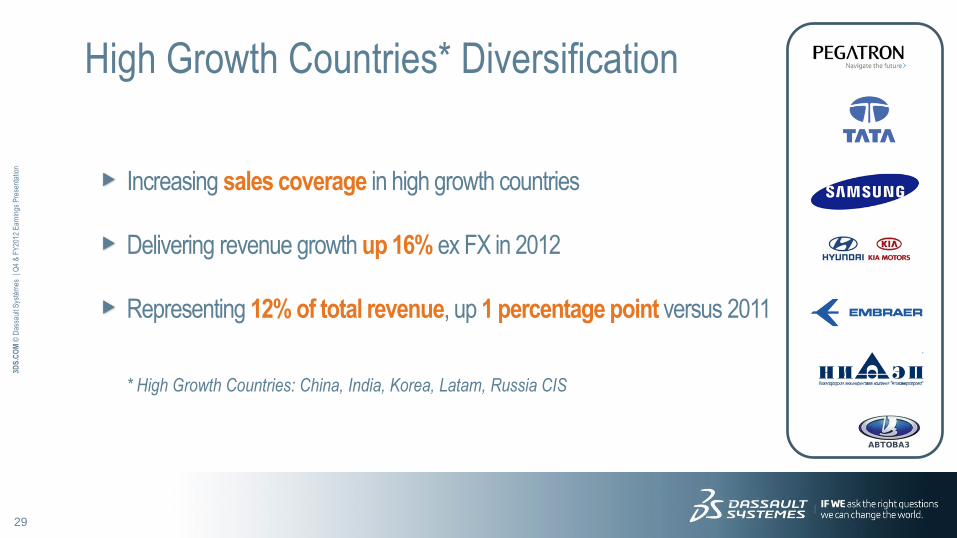
Increasing sales coverage in high growth countries
Delivering revenue growth up 16% ex FX in 2012
Representing 12% of total revenue, up 1 percentage point versus 2011
High Growth Countries* Diversification
* High Growth Countries: China, India, Korea, Latam, Russia CIS
30
3DS
.CO
M ©
Das
saul
t Sys
tèm
es
| Q4
& F
Y20
12 E
arni
ngs
Pre
sent
atio
n
Customers Expansion
Users Expansion
Geographic Diversification
Industry Vertical Diversification
2012 Business Review
31
3DS
.CO
M ©
Das
saul
t Sys
tèm
es
| Q4
& F
Y20
12 E
arni
ngs
Pre
sent
atio
n
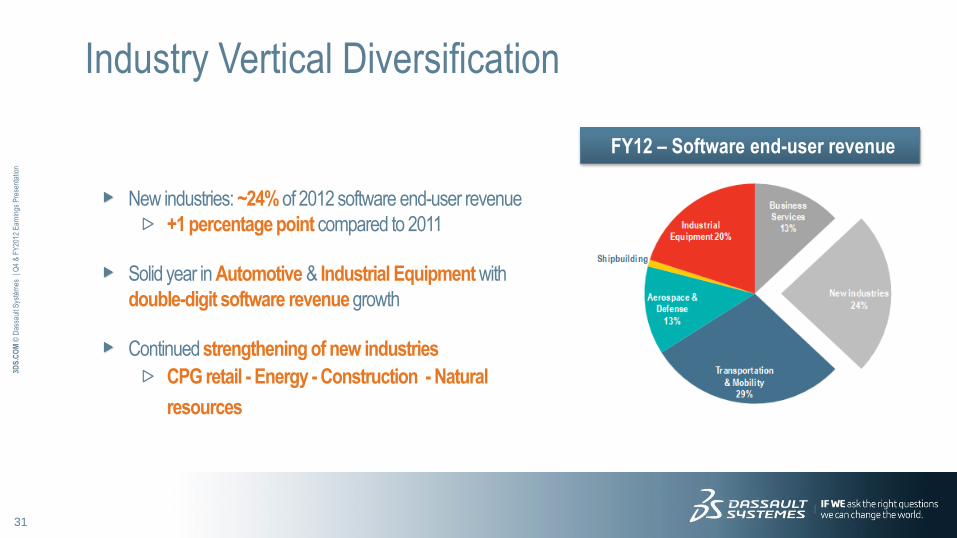
New industries: ~24% of 2012 software end-user revenue
+1 percentage point compared to 2011
Solid year in Automotive & Industrial Equipment with
double-digit software revenue growth
Continued strengthening of new industries
CPG retail - Energy - Construction - Natural
resources
Industry Vertical Diversification
FY12 – Software end-user revenue
32
3DS
.CO
M ©
Das
saul
t Sys
tèm
es
| Q4
& F
Y20
12 E
arni
ngs
Pre
sent
atio
n
1 2012 Strategy
2 2012 Business Review
3
Q4 & FY12 Financial Highlights
4
Q1 & FY13 Financial Objectives
5
5
Financial Information Appendix
Agenda
33
3DS
.CO
M ©
Das
saul
t Sys
tèm
es
| Q4
& F
Y20
12 E
arni
ngs
Pre
sent
atio
n
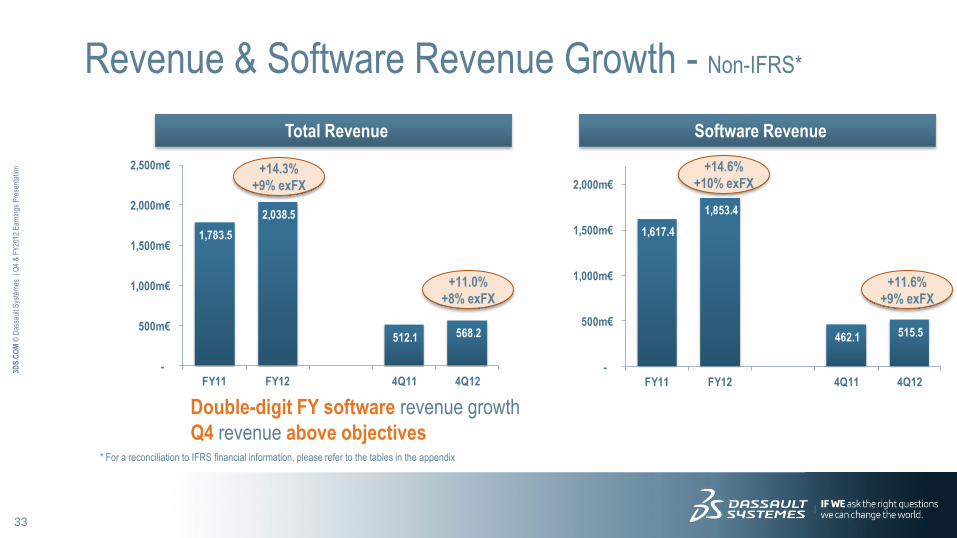
Revenue & Software Revenue Growth - Non-IFRS*
Double-digit FY software revenue growth
Q4 revenue above objectives * For a reconciliation to IFRS financial information, please refer to the tables in the appendix
1,783.5
2,038.5
512.1 568.2
-
500m€
1,000m€
1,500m€
2,000m€
2,500m€
FY11 FY12 4Q11 4Q12
Total Revenue
+11.0%
+8% exFX
+14.3%
+9% exFX
1,617.4
1,853.4
462.1 515.5
-
500m€
1,000m€
1,500m€
2,000m€
FY11 FY12 4Q11 4Q12
+11.6%
+9% exFX
Software Revenue
+14.6%
+10% exFX
34
3DS
.CO
M ©
Das
saul
t Sys
tèm
es
| Q4
& F
Y20
12 E
arni
ngs
Pre
sent
atio
n
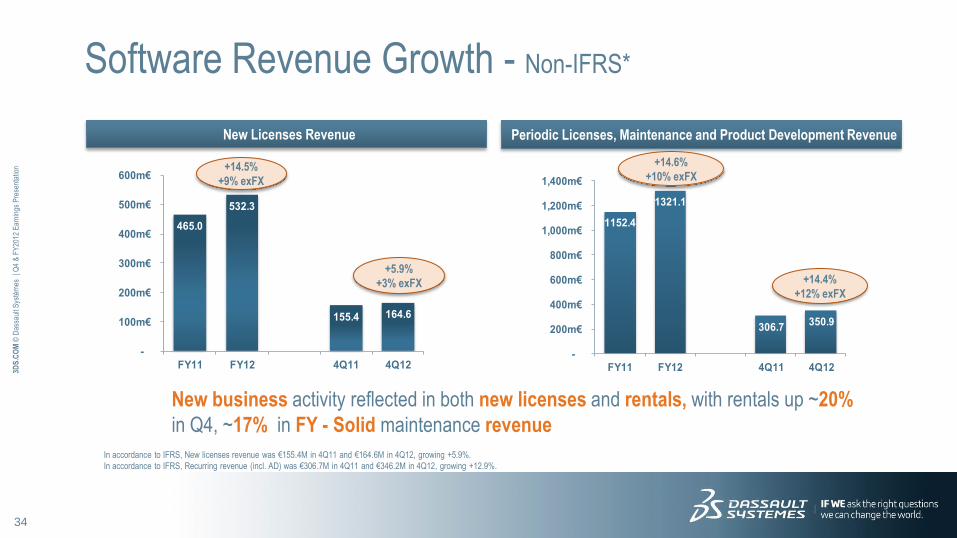
1152.4
1321.1
306.7350.9
-
200m€
400m€
600m€
800m€
1,000m€
1,200m€
1,400m€
FY11 FY12 4Q11 4Q12
465.0
532.3
155.4 164.6
-
100m€
200m€
300m€
400m€
500m€
600m€
FY11 FY12 4Q11 4Q12
Software Revenue Growth - Non-IFRS*
New Licenses Revenue Periodic Licenses, Maintenance and Product Development Revenue
In accordance to IFRS, New licenses revenue was €155.4M in 4Q11 and €164.6M in 4Q12, growing +5.9%.
In accordance to IFRS, Recurring revenue (incl. AD) was €306.7M in 4Q11 and €346.2M in 4Q12, growing +12.9%.
+5.9%
+3% exFX +14.4%
+12% exFX
+14.5%
+9% exFX
+14.6%
+10% exFX
New business activity reflected in both new licenses and rentals, with rentals up ~20%
in Q4, ~17% in FY - Solid maintenance revenue
35
3DS
.CO
M ©
Das
saul
t Sys
tèm
es
| Q4
& F
Y20
12 E
arni
ngs
Pre
sent
atio
n
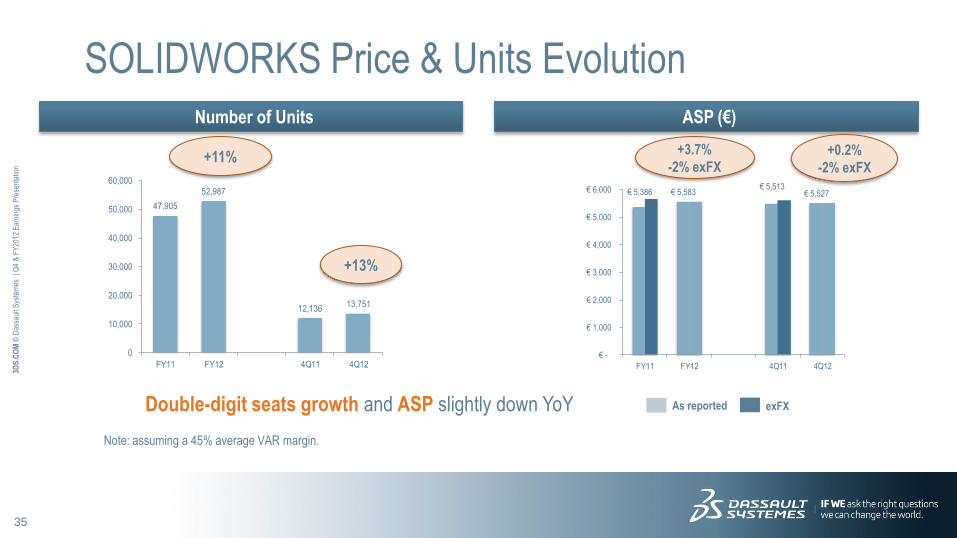
€ 5,386 € 5,583 € 5,513
€ 5,527
€ -
€ 1,000
€ 2,000
€ 3,000
€ 4,000
€ 5,000
€ 6,000
FY11 FY12 4Q11 4Q12
47,905
52,987
12,13613,751
0
10,000
20,000
30,000
40,000
50,000
60,000
FY11 FY12 4Q11 4Q12
SOLIDWORKS Price & Units Evolution
Number of Units ASP (€)
+0.2%
-2% exFX
+13%
As reported exFX
+11% +3.7%
-2% exFX
Double-digit seats growth and ASP slightly down YoY
Note: assuming a 45% average VAR margin.
36
3DS
.CO
M ©
Das
saul
t Sys
tèm
es
| Q4
& F
Y20
12 E
arni
ngs
Pre
sent
atio
n
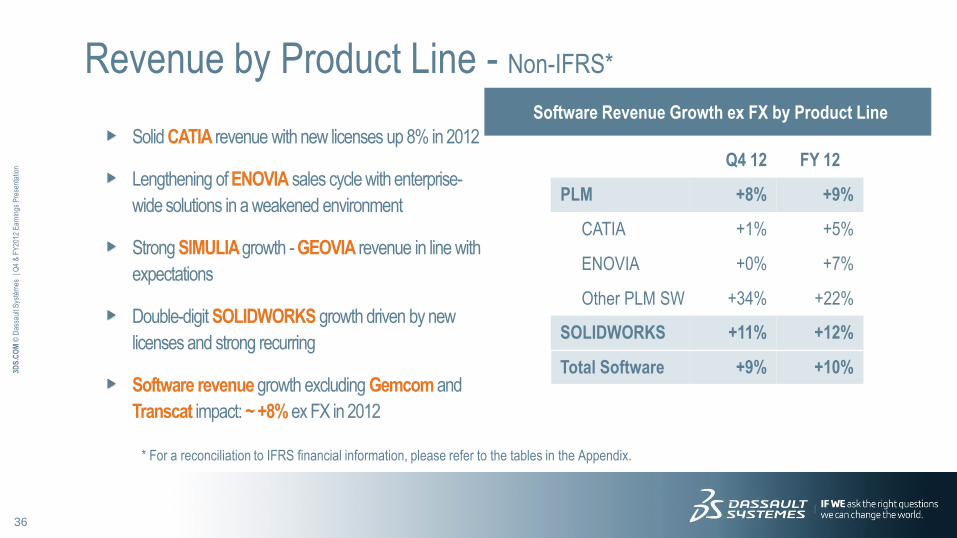
Solid CATIA revenue with new licenses up 8% in 2012
Lengthening of ENOVIA sales cycle with enterprise-
wide solutions in a weakened environment
Strong SIMULIA growth - GEOVIA revenue in line with
expectations
Double-digit SOLIDWORKS growth driven by new
licenses and strong recurring
Software revenue growth excluding Gemcom and
Transcat impact: ~ +8% ex FX in 2012
Revenue by Product Line - Non-IFRS*
Q4 12 FY 12
PLM +8% +9%
CATIA +1% +5%
ENOVIA +0% +7%
Other PLM SW +34% +22%
SOLIDWORKS +11% +12%
Total Software +9% +10%
Software Revenue Growth ex FX by Product Line
* For a reconciliation to IFRS financial information, please refer to the tables in the Appendix.
37
3DS
.CO
M ©
Das
saul
t Sys
tèm
es
| Q4
& F
Y20
12 E
arni
ngs
Pre
sent
atio
n
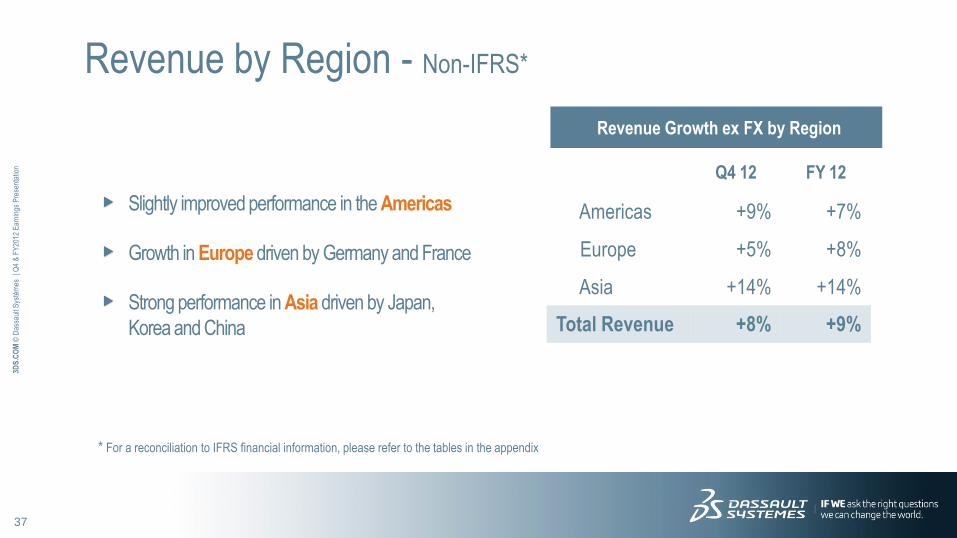
Slightly improved performance in the Americas
Growth in Europe driven by Germany and France
Strong performance in Asia driven by Japan,
Korea and China
Revenue by Region - Non-IFRS*
Q4 12 FY 12
Americas +9% +7%
Europe +5% +8%
Asia +14% +14%
Total Revenue +8% +9%
Revenue Growth ex FX by Region
* For a reconciliation to IFRS financial information, please refer to the tables in the appendix
38
3DS
.CO
M ©
Das
saul
t Sys
tèm
es
| Q4
& F
Y20
12 E
arni
ngs
Pre
sent
atio
n
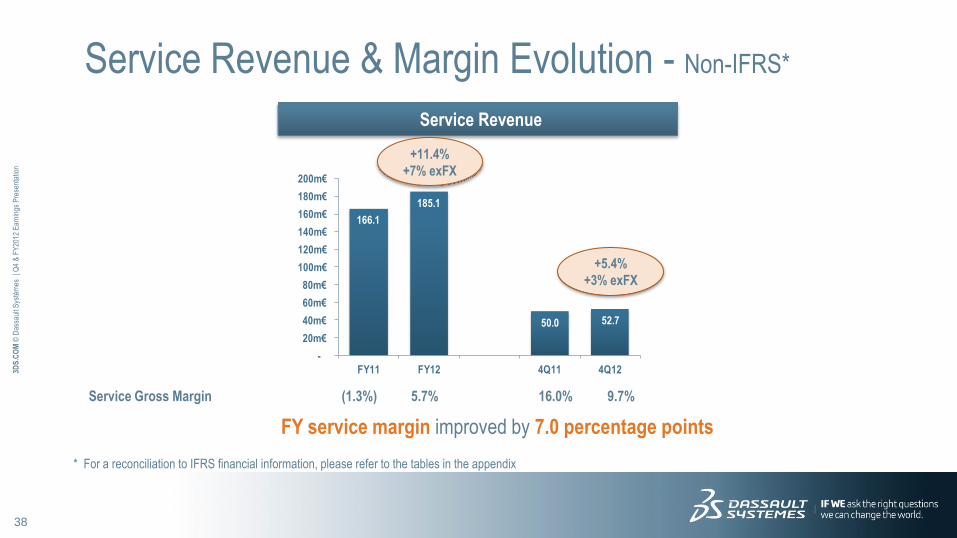
166.1
185.1
50.0 52.7
-
20m€
40m€
60m€
80m€
100m€
120m€
140m€
160m€
180m€
200m€
FY11 FY12 4Q11 4Q12
Service Revenue & Margin Evolution - Non-IFRS*
Service Revenue
+5.4%
+3% exFX
* For a reconciliation to IFRS financial information, please refer to the tables in the appendix
Service Gross Margin (1.3%) 5.7% 16.0% 9.7%
+11.4%
+7% exFX
FY service margin improved by 7.0 percentage points
39
3DS
.CO
M ©
Das
saul
t Sys
tèm
es
| Q4
& F
Y20
12 E
arni
ngs
Pre
sent
atio
n
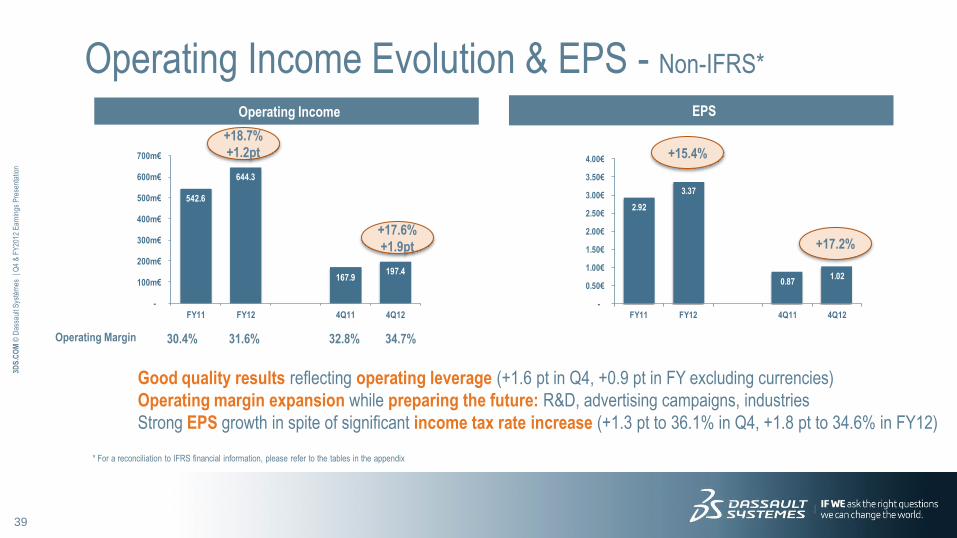
542.6
644.3
167.9197.4
-
100m€
200m€
300m€
400m€
500m€
600m€
700m€
FY11 FY12 4Q11 4Q12
Operating Margin 30.4% 31.6% 32.8% 34.7%
Operating Income Evolution & EPS - Non-IFRS*
Operating Income EPS
Good quality results reflecting operating leverage (+1.6 pt in Q4, +0.9 pt in FY excluding currencies)
Operating margin expansion while preparing the future: R&D, advertising campaigns, industries
Strong EPS growth in spite of significant income tax rate increase (+1.3 pt to 36.1% in Q4, +1.8 pt to 34.6% in FY12)
* For a reconciliation to IFRS financial information, please refer to the tables in the appendix
+17.6%
+1.9pt
+18.7%
+1.2pt
2.92
3.37
0.871.02
-
0.50€
1.00€
1.50€
2.00€
2.50€
3.00€
3.50€
4.00€
FY11 FY12 4Q11 4Q12
+17.2%
+15.4%
40
3DS
.CO
M ©
Das
saul
t Sys
tèm
es
| Q4
& F
Y20
12 E
arni
ngs
Pre
sent
atio
n
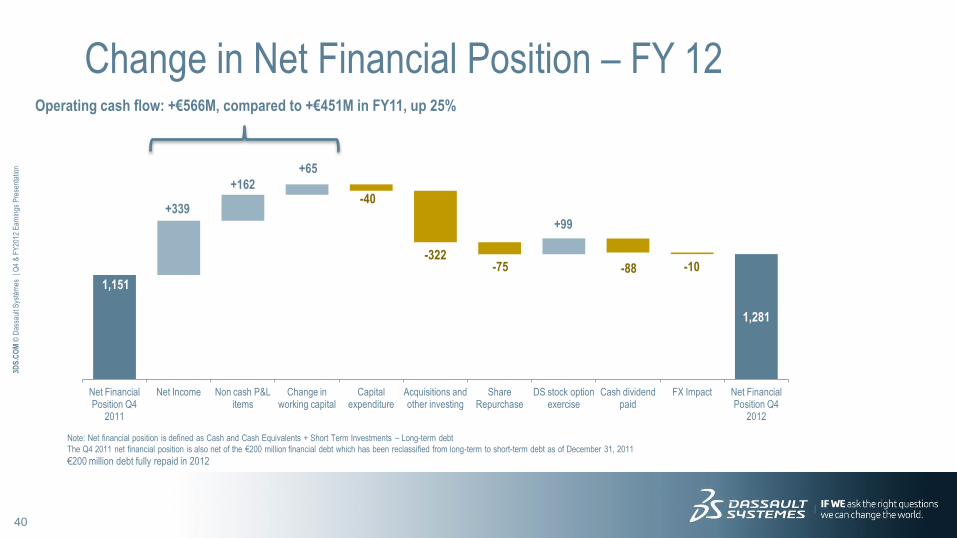
Change in Net Financial Position – FY 12 Operating cash flow: +€566M, compared to +€451M in FY11, up 25%
Note: Net financial position is defined as Cash and Cash Equivalents + Short Term Investments – Long-term debt
The Q4 2011 net financial position is also net of the €200 million financial debt which has been reclassified from long-term to short-term debt as of December 31, 2011
€200 million debt fully repaid in 2012
1,281
1,151
+339
+162
+65
-40
-322 -75
+99
-88 -10
Net Financial Position Q4
2011
Net Income Non cash P&L items
Change in working capital
Capital expenditure
Acquisitions and other investing
Share Repurchase
DS stock option exercise
Cash dividend paid
FX Impact Net Financial Position Q4
2012
41
3DS
.CO
M ©
Das
saul
t Sys
tèm
es
| Q4
& F
Y20
12 E
arni
ngs
Pre
sent
atio
n
1 2012 Strategy
2 2012 Business Review
3 Q4 & FY12 Financial Highlights
4
Q1 & FY13 Financial Objectives
5
5
Financial Information Appendix
Agenda
42
3DS
.CO
M ©
Das
saul
t Sys
tèm
es
| Q4
& F
Y20
12 E
arni
ngs
Pre
sent
atio
n
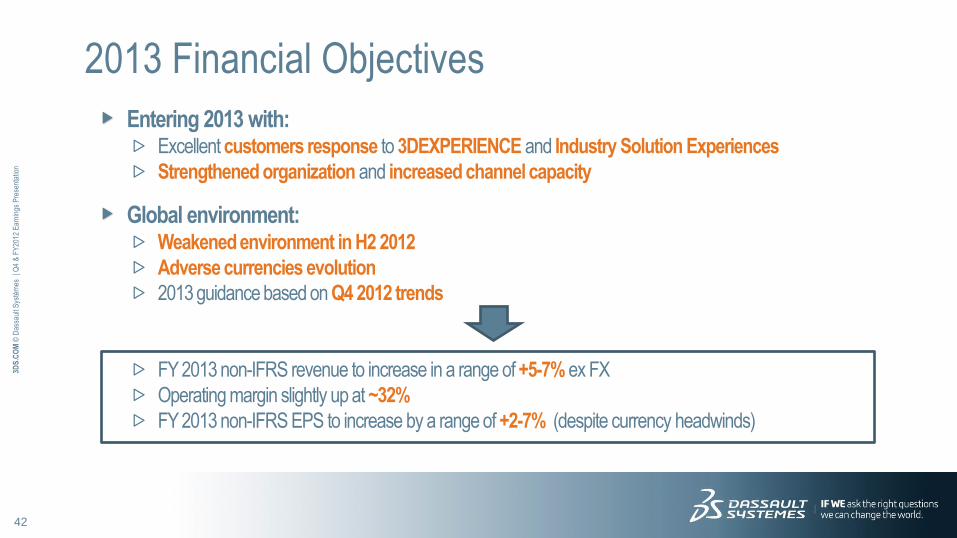
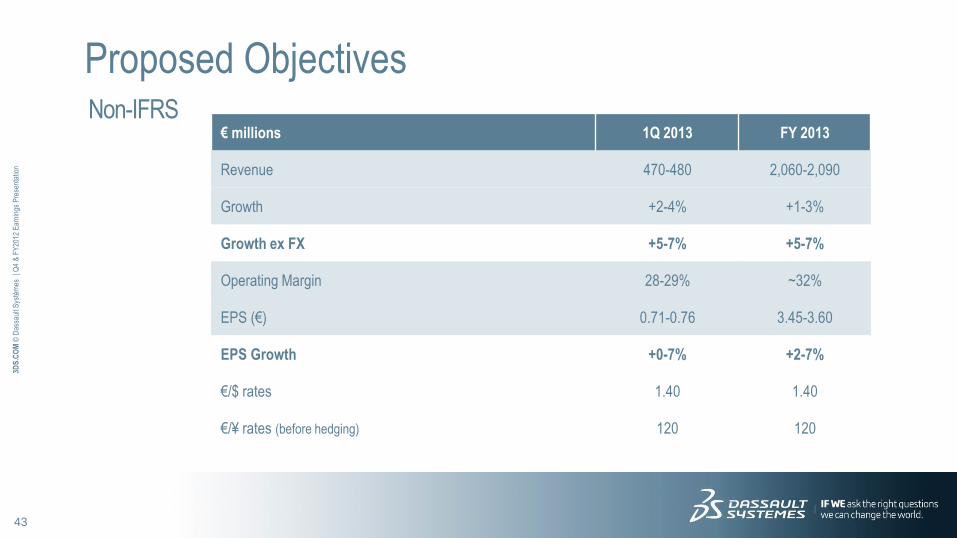
Entering 2013 with: Excellent customers response to 3DEXPERIENCE and Industry Solution Experiences
Strengthened organization and increased channel capacity
Global environment: Weakened environment in H2 2012
Adverse currencies evolution
2013 guidance based on Q4 2012 trends
FY 2013 non-IFRS revenue to increase in a range of +5-7% ex FX
Operating margin slightly up at ~32%
FY 2013 non-IFRS EPS to increase by a range of +2-7% (despite currency headwinds)
2013 Financial Objectives
43
3DS
.CO
M ©
Das
saul
t Sys
tèm
es
| Q4
& F
Y20
12 E
arni
ngs
Pre
sent
atio
n
Non-IFRS
Proposed Objectives
€ millions 1Q 2013 FY 2013
Revenue 470-480 2,060-2,090
Growth +2-4% +1-3%
Growth ex FX +5-7% +5-7%
Operating Margin 28-29% ~32%
EPS (€) 0.71-0.76 3.45-3.60
EPS Growth +0-7% +2-7%
€/$ rates 1.40 1.40
€/¥ rates (before hedging) 120 120
44
3DS
.CO
M ©
Das
saul
t Sys
tèm
es
| Q4
& F
Y20
12 E
arni
ngs
Pre
sent
atio
n
1 2012 Strategy
2 2012 Business Review
3 Q4 & FY12 Financial Highlights
4 Q1 & FY13 Financial Objectives
5
5
Financial Information Appendix
Agenda
45
3DS
.CO
M ©
Das
saul
t Sys
tèm
es
| Q4
& F
Y20
12 E
arni
ngs
Pre
sent
atio
n
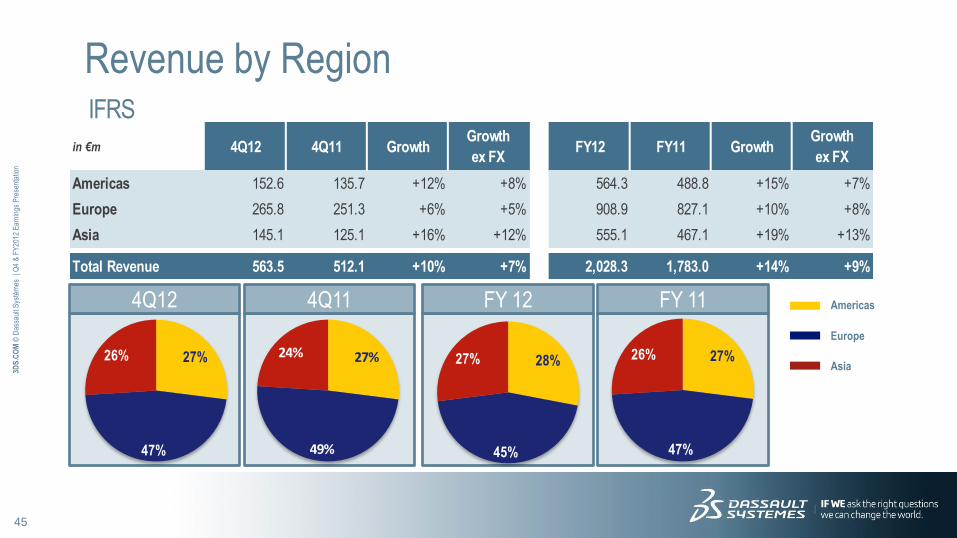
Revenue by Region IFRS
Americas
Europe
Asia
4Q11 FY 11 4Q12 FY 12
in €m 4Q12 4Q11 GrowthGrowth
ex FXFY12 FY11 Growth
Growth
ex FX
Americas 152.6 135.7 +12% +8% 564.3 488.8 +15% +7%
Europe 265.8 251.3 +6% +5% 908.9 827.1 +10% +8%
Asia 145.1 125.1 +16% +12% 555.1 467.1 +19% +13%
Total Revenue 563.5 512.1 +10% +7% 2,028.3 1,783.0 +14% +9%
27%
47%
26% 27%
49%
24%28%
45%
27% 27%
47%
26%

46
3DS
.CO
M ©
Das
saul
t Sys
tèm
es
| Q4
& F
Y20
12 E
arni
ngs
Pre
sent
atio
n
Revenue by Region Non-IFRS*
* For a reconciliation to IFRS
financial information, please
refer to the tables in the
appendix
Americas
Europe
Asia
4Q11 FY 11 4Q12 FY 12
in €m 4Q12 4Q11 GrowthGrowth
ex FXFY12 FY11 Growth
Growth
ex FX
Americas 154.0 135.6 +14% +9% 567.3 488.8 +16% +7%
Europe 266.7 251.4 +6% +5% 910.9 827.3 +10% +8%
Asia 147.5 125.1 +18% +14% 560.3 467.4 +20% +14%
Total Revenue 568.2 512.1 +11% +8% 2,038.5 1,783.5 +14% +9%
27%
47%
26% 27%
49%
24%28%
45%
27% 27%
47%
26%
47
3DS
.CO
M ©
Das
saul
t Sys
tèm
es
| Q4
& F
Y20
12 E
arni
ngs
Pre
sent
atio
n
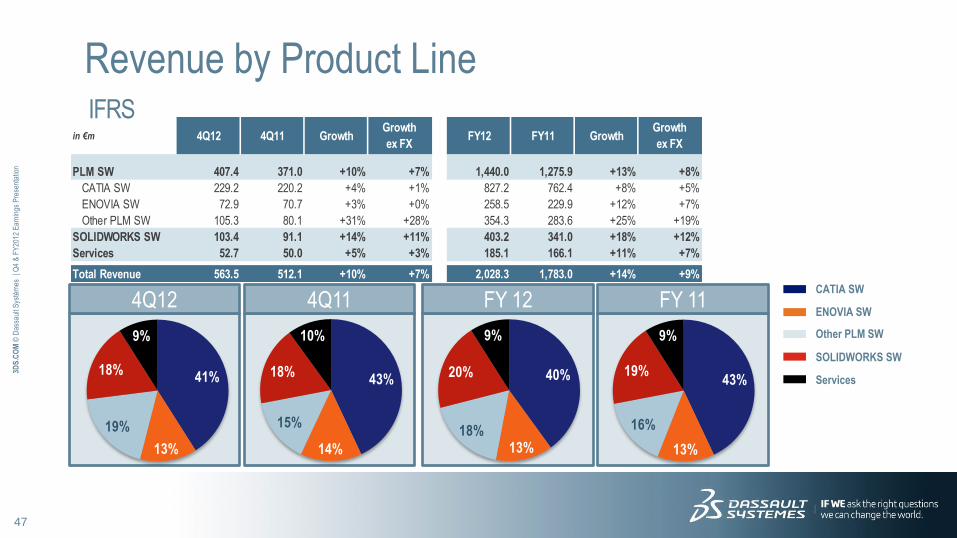
Revenue by Product Line IFRS
4Q11 FY 11 4Q12 FY 12 CATIA SW
ENOVIA SW
Other PLM SW
SOLIDWORKS SW
Services
in €m 4Q12 4Q11 GrowthGrowth
ex FXFY12 FY11 Growth
Growth
ex FX
PLM SW 407.4 371.0 +10% +7% 1,440.0 1,275.9 +13% +8%
CATIA SW 229.2 220.2 +4% +1% 827.2 762.4 +8% +5%
ENOVIA SW 72.9 70.7 +3% +0% 258.5 229.9 +12% +7%
Other PLM SW 105.3 80.1 +31% +28% 354.3 283.6 +25% +19%
SOLIDWORKS SW 103.4 91.1 +14% +11% 403.2 341.0 +18% +12%
Services 52.7 50.0 +5% +3% 185.1 166.1 +11% +7%
Total Revenue 563.5 512.1 +10% +7% 2,028.3 1,783.0 +14% +9%
41%
13%
19%
18%
9%
43%
14%
15%
18%
10%
40%
13%18%
20%
9%
43%
13%
16%
19%
9%
48
3DS
.CO
M ©
Das
saul
t Sys
tèm
es
| Q4
& F
Y20
12 E
arni
ngs
Pre
sent
atio
n
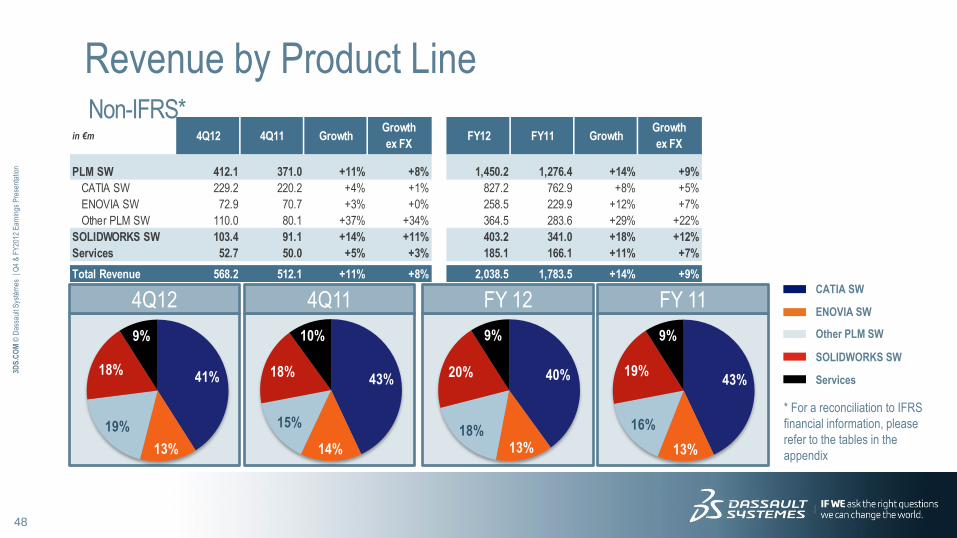
Revenue by Product Line Non-IFRS*
CATIA SW
ENOVIA SW
Other PLM SW
SOLIDWORKS SW
Services
4Q11 FY 11 4Q12 FY 12
* For a reconciliation to IFRS
financial information, please
refer to the tables in the
appendix
in €m 4Q12 4Q11 GrowthGrowth
ex FXFY12 FY11 Growth
Growth
ex FX
PLM SW 412.1 371.0 +11% +8% 1,450.2 1,276.4 +14% +9%
CATIA SW 229.2 220.2 +4% +1% 827.2 762.9 +8% +5%
ENOVIA SW 72.9 70.7 +3% +0% 258.5 229.9 +12% +7%
Other PLM SW 110.0 80.1 +37% +34% 364.5 283.6 +29% +22%
SOLIDWORKS SW 103.4 91.1 +14% +11% 403.2 341.0 +18% +12%
Services 52.7 50.0 +5% +3% 185.1 166.1 +11% +7%
Total Revenue 568.2 512.1 +11% +8% 2,038.5 1,783.5 +14% +9%
41%
13%
19%
18%
9%
43%
14%
15%
18%
10%
40%
13%18%
20%
9%
43%
13%
16%
19%
9%
49
3DS
.CO
M ©
Das
saul
t Sys
tèm
es
| Q4
& F
Y20
12 E
arni
ngs
Pre
sent
atio
n
-
200m€
400m€
600m€
800m€
1,000m€
1,200m€
1,400m€
1,600m€
1,800m€
2,000m€
FY11 FY12 4Q11 4Q12
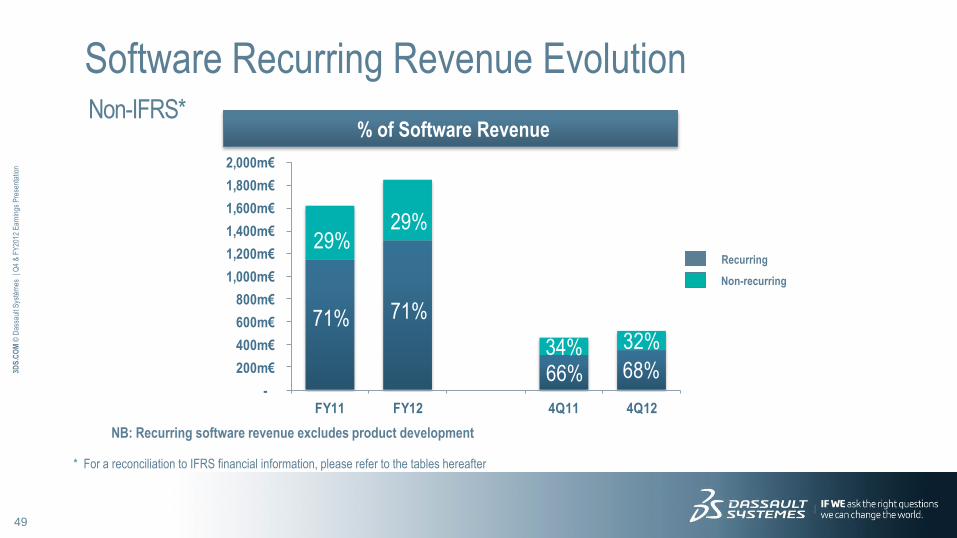
Software Recurring Revenue Evolution Non-IFRS*
% of Software Revenue
NB: Recurring software revenue excludes product development
Recurring
Non-recurring
68%
* For a reconciliation to IFRS financial information, please refer to the tables hereafter
32%
66% 34%
71%
29%
71%
29%
50
3DS
.CO
M ©
Das
saul
t Sys
tèm
es
| Q4
& F
Y20
12 E
arni
ngs
Pre
sent
atio
n
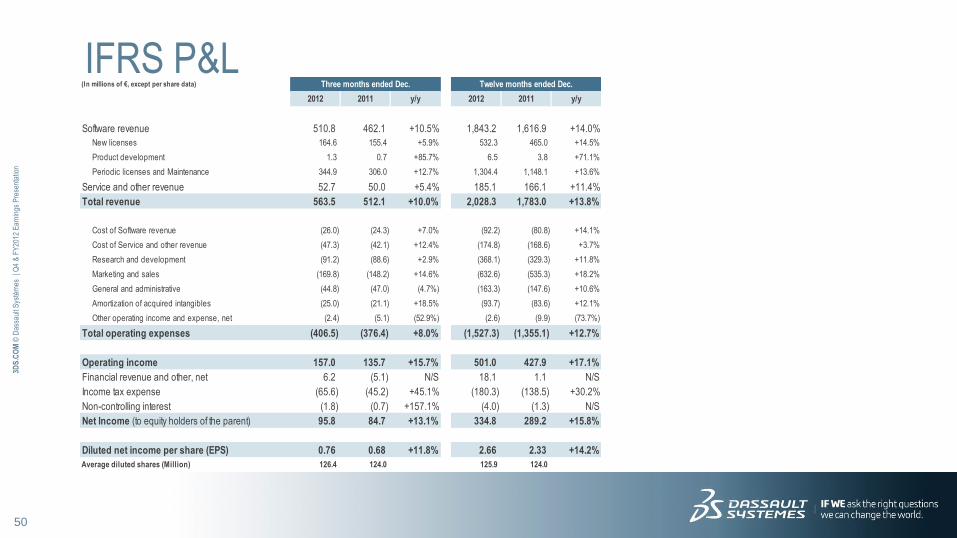
IFRS P&L (In millions of €, except per share data) Three months ended Dec. Twelve months ended Dec.
2012 2011 y/y 2012 2011 y/y
Software revenue 510.8 462.1 +10.5% 1,843.2 1,616.9 +14.0%
New licenses 164.6 155.4 +5.9% 532.3 465.0 +14.5%
Product development 1.3 0.7 +85.7% 6.5 3.8 +71.1%
Periodic licenses and Maintenance 344.9 306.0 +12.7% 1,304.4 1,148.1 +13.6%
Service and other revenue 52.7 50.0 +5.4% 185.1 166.1 +11.4%
Total revenue 563.5 512.1 +10.0% 2,028.3 1,783.0 +13.8%
Cost of Software revenue (26.0) (24.3) +7.0% (92.2) (80.8) +14.1%
Cost of Service and other revenue (47.3) (42.1) +12.4% (174.8) (168.6) +3.7%
Research and development (91.2) (88.6) +2.9% (368.1) (329.3) +11.8%
Marketing and sales (169.8) (148.2) +14.6% (632.6) (535.3) +18.2%
General and administrative (44.8) (47.0) (4.7%) (163.3) (147.6) +10.6%
Amortization of acquired intangibles (25.0) (21.1) +18.5% (93.7) (83.6) +12.1%
Other operating income and expense, net (2.4) (5.1) (52.9%) (2.6) (9.9) (73.7%)
Total operating expenses (406.5) (376.4) +8.0% (1,527.3) (1,355.1) +12.7%
Operating income 157.0 135.7 +15.7% 501.0 427.9 +17.1%
Financial revenue and other, net 6.2 (5.1) N/S 18.1 1.1 N/S
Income tax expense (65.6) (45.2) +45.1% (180.3) (138.5) +30.2%
Non-controlling interest (1.8) (0.7) +157.1% (4.0) (1.3) N/S
Net Income (to equity holders of the parent) 95.8 84.7 +13.1% 334.8 289.2 +15.8%
Diluted net income per share (EPS) 0.76 0.68 +11.8% 2.66 2.33 +14.2%
Average diluted shares (Million) 126.4 124.0 125.9 124.0
51
3DS
.CO
M ©
Das
saul
t Sys
tèm
es
| Q4
& F
Y20
12 E
arni
ngs
Pre
sent
atio
n
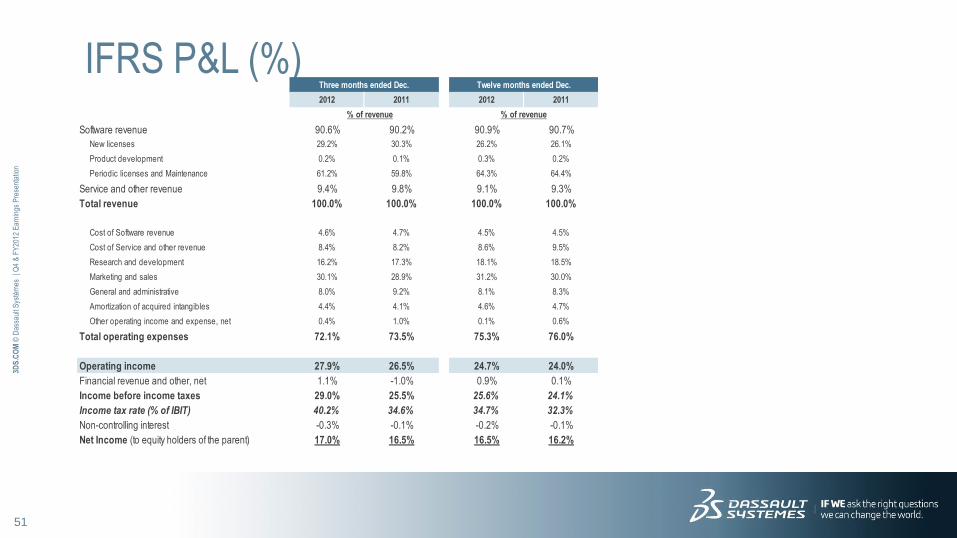
IFRS P&L (%) Three months ended Dec. Twelve months ended Dec.
2012 2011 2012 2011
% of revenue % of revenue
Software revenue 90.6% 90.2% 90.9% 90.7%
New licenses 29.2% 30.3% 26.2% 26.1%
Product development 0.2% 0.1% 0.3% 0.2%
Periodic licenses and Maintenance 61.2% 59.8% 64.3% 64.4%
Service and other revenue 9.4% 9.8% 9.1% 9.3%
Total revenue 100.0% 100.0% 100.0% 100.0%
Cost of Software revenue 4.6% 4.7% 4.5% 4.5%
Cost of Service and other revenue 8.4% 8.2% 8.6% 9.5%
Research and development 16.2% 17.3% 18.1% 18.5%
Marketing and sales 30.1% 28.9% 31.2% 30.0%
General and administrative 8.0% 9.2% 8.1% 8.3%
Amortization of acquired intangibles 4.4% 4.1% 4.6% 4.7%
Other operating income and expense, net 0.4% 1.0% 0.1% 0.6%
Total operating expenses 72.1% 73.5% 75.3% 76.0%
Operating income 27.9% 26.5% 24.7% 24.0%
Financial revenue and other, net 1.1% -1.0% 0.9% 0.1%
Income before income taxes 29.0% 25.5% 25.6% 24.1%
Income tax rate (% of IBIT) 40.2% 34.6% 34.7% 32.3%
Non-controlling interest -0.3% -0.1% -0.2% -0.1%
Net Income (to equity holders of the parent) 17.0% 16.5% 16.5% 16.2%

52
3DS
.CO
M ©
Das
saul
t Sys
tèm
es
| Q4
& F
Y20
12 E
arni
ngs
Pre
sent
atio
n
Non-IFRS P&L (In millions of €, except per share data) Three months ended Dec. Twelve months ended Dec.
2012 2011 y/y 2012 2011 y/y
Software revenue 515.5 462.1 +11.6% 1,853.4 1,617.4 +14.6%
New licenses 164.6 155.4 +5.9% 532.3 465.0 +14.5%
Product development 1.3 0.7 +85.7% 6.5 3.8 +71.1%
Periodic licenses and Maintenance 349.6 306.0 +14.2% 1,314.6 1,148.6 +14.5%
Service and other revenue 52.7 50.0 +5.4% 185.1 166.1 +11.4%
Total revenue 568.2 512.1 +11.0% 2,038.5 1,783.5 +14.3%
Cost of Software revenue (26.0) (24.2) +7.4% (91.9) (80.6) +14.0%
Cost of Service and other revenue (47.6) (42.0) +13.3% (174.5) (168.2) +3.7%
Research and development (89.7) (85.7) +4.7% (353.9) (319.2) +10.9%
Marketing and sales (167.3) (146.7) +14.0% (621.6) (529.8) +17.3%
General and administrative (40.2) (45.6) (11.8%) (152.3) (143.1) +6.4%
Total operating expenses (370.8) (344.2) +7.7% (1,394.2) (1,240.9) +12.4%
Operating income 197.4 167.9 +17.6% 644.3 542.6 +18.7%
Financial revenue and other, net 6.3 (0.8) N/S 10.7 (1.3) N/S
Income tax expense (73.5) (58.1) +26.5% (226.5) (177.6) +27.5%
Non-controlling interest (1.8) (0.6) N/S (4.0) (1.6) N/S
Net Income (to equity holders of the parent) 128.4 108.4 +18.5% 424.5 362.1 +17.2%
Diluted net income per share (EPS) 1.02 0.87 +17.2% 3.37 2.92 +15.4%
Average diluted shares (Million) 126.4 124.0 125.9 124.0
53
3DS
.CO
M ©
Das
saul
t Sys
tèm
es
| Q4
& F
Y20
12 E
arni
ngs
Pre
sent
atio
n
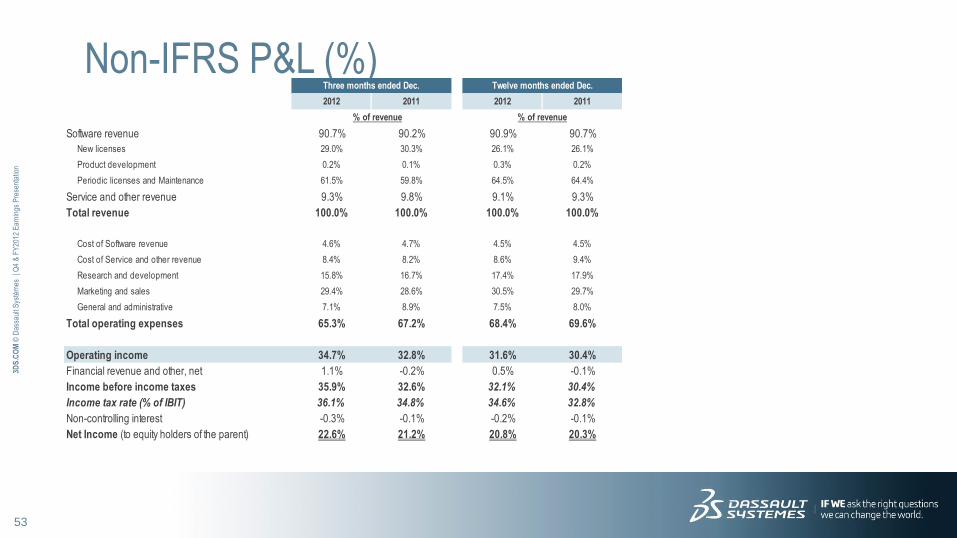
Non-IFRS P&L (%) Three months ended Dec. Twelve months ended Dec.
2012 2011 2012 2011
% of revenue % of revenue
Software revenue 90.7% 90.2% 90.9% 90.7%
New licenses 29.0% 30.3% 26.1% 26.1%
Product development 0.2% 0.1% 0.3% 0.2%
Periodic licenses and Maintenance 61.5% 59.8% 64.5% 64.4%
Service and other revenue 9.3% 9.8% 9.1% 9.3%
Total revenue 100.0% 100.0% 100.0% 100.0%
Cost of Software revenue 4.6% 4.7% 4.5% 4.5%
Cost of Service and other revenue 8.4% 8.2% 8.6% 9.4%
Research and development 15.8% 16.7% 17.4% 17.9%
Marketing and sales 29.4% 28.6% 30.5% 29.7%
General and administrative 7.1% 8.9% 7.5% 8.0%
Total operating expenses 65.3% 67.2% 68.4% 69.6%
Operating income 34.7% 32.8% 31.6% 30.4%
Financial revenue and other, net 1.1% -0.2% 0.5% -0.1%
Income before income taxes 35.9% 32.6% 32.1% 30.4%
Income tax rate (% of IBIT) 36.1% 34.8% 34.6% 32.8%
Non-controlling interest -0.3% -0.1% -0.2% -0.1%
Net Income (to equity holders of the parent) 22.6% 21.2% 20.8% 20.3%
54
3DS
.CO
M ©
Das
saul
t Sys
tèm
es
| Q4
& F
Y20
12 E
arni
ngs
Pre
sent
atio
n
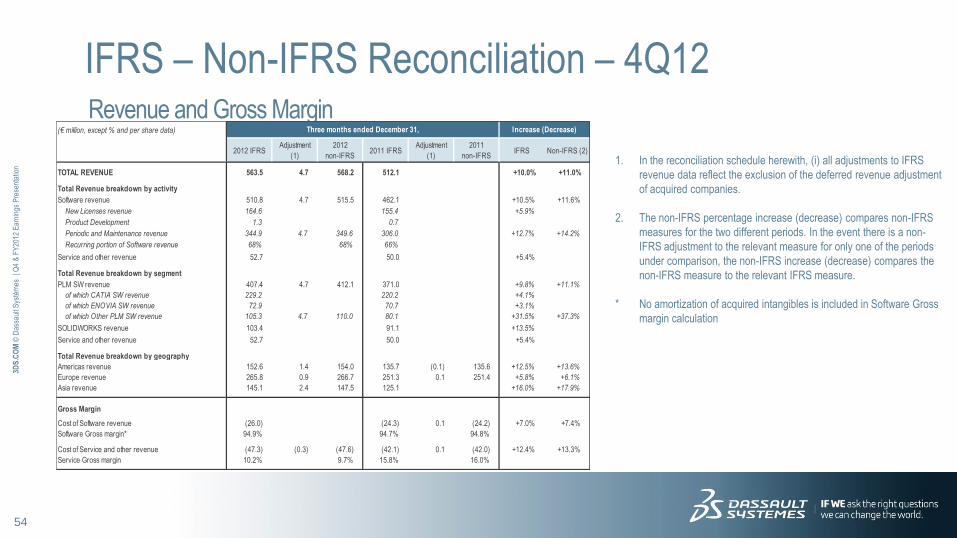
IFRS – Non-IFRS Reconciliation – 4Q12 Revenue and Gross Margin
1. In the reconciliation schedule herewith, (i) all adjustments to IFRS
revenue data reflect the exclusion of the deferred revenue adjustment
of acquired companies.
2. The non-IFRS percentage increase (decrease) compares non-IFRS
measures for the two different periods. In the event there is a non-
IFRS adjustment to the relevant measure for only one of the periods
under comparison, the non-IFRS increase (decrease) compares the
non-IFRS measure to the relevant IFRS measure.
* No amortization of acquired intangibles is included in Software Gross
margin calculation
(€ million, except % and per share data)
2012 IFRSAdjustment
(1)
2012
non-IFRS2011 IFRS
Adjustment
(1)
2011
non-IFRSIFRS Non-IFRS (2)
TOTAL REVENUE 563.5 4.7 568.2 512.1 +10.0% +11.0%
Total Revenue breakdown by activity
Software revenue 510.8 4.7 515.5 462.1 +10.5% +11.6%
New Licenses revenue 164.6 155.4 +5.9%
Product Development 1.3 0.7
Periodic and Maintenance revenue 344.9 4.7 349.6 306.0 +12.7% +14.2%
Recurring portion of Software revenue 68% 68% 66%
Service and other revenue 52.7 50.0 +5.4%
Total Revenue breakdown by segment
PLM SW revenue 407.4 4.7 412.1 371.0 +9.8% +11.1%
of which CATIA SW revenue 229.2 220.2 +4.1%
of which ENOVIA SW revenue 72.9 70.7 +3.1%
of which Other PLM SW revenue 105.3 4.7 110.0 80.1 +31.5% +37.3%
SOLIDWORKS revenue 103.4 91.1 +13.5%
Service and other revenue 52.7 50.0 +5.4%
Total Revenue breakdown by geography
Americas revenue 152.6 1.4 154.0 135.7 (0.1) 135.6 +12.5% +13.6%
Europe revenue 265.8 0.9 266.7 251.3 0.1 251.4 +5.8% +6.1%
Asia revenue 145.1 2.4 147.5 125.1 +16.0% +17.9%
Gross Margin
Cost of Software revenue (26.0) (24.3) 0.1 (24.2) +7.0% +7.4%
Software Gross margin* 94.9% 94.7% 94.8%
Cost of Service and other revenue (47.3) (0.3) (47.6) (42.1) 0.1 (42.0) +12.4% +13.3%
Service Gross margin 10.2% 9.7% 15.8% 16.0%
Increase (Decrease)Three months ended December 31,
55
3DS
.CO
M ©
Das
saul
t Sys
tèm
es
| Q4
& F
Y20
12 E
arni
ngs
Pre
sent
atio
n
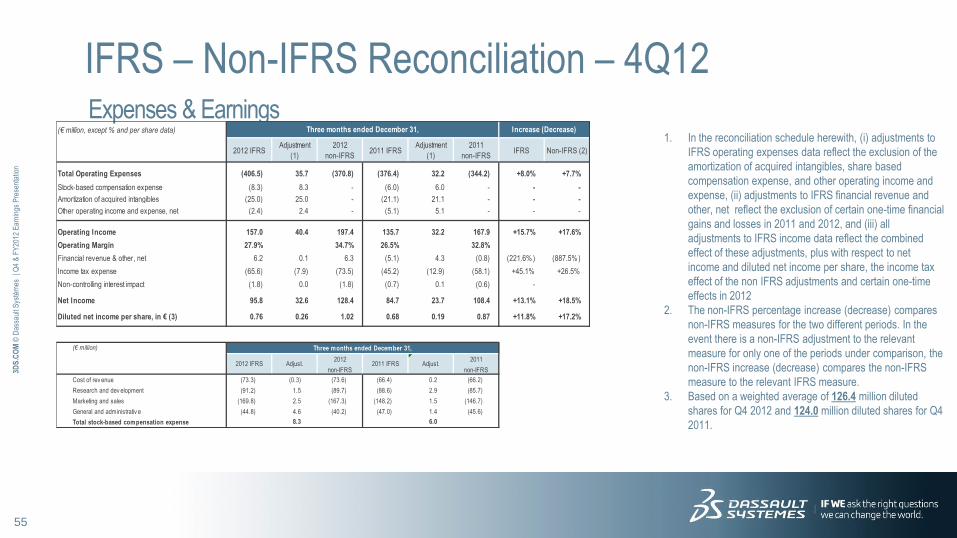
IFRS – Non-IFRS Reconciliation – 4Q12 Expenses & Earnings
1. In the reconciliation schedule herewith, (i) adjustments to
IFRS operating expenses data reflect the exclusion of the
amortization of acquired intangibles, share based
compensation expense, and other operating income and
expense, (ii) adjustments to IFRS financial revenue and
other, net reflect the exclusion of certain one-time financial
gains and losses in 2011 and 2012, and (iii) all
adjustments to IFRS income data reflect the combined
effect of these adjustments, plus with respect to net
income and diluted net income per share, the income tax
effect of the non IFRS adjustments and certain one-time
effects in 2012
2. The non-IFRS percentage increase (decrease) compares
non-IFRS measures for the two different periods. In the
event there is a non-IFRS adjustment to the relevant
measure for only one of the periods under comparison, the
non-IFRS increase (decrease) compares the non-IFRS
measure to the relevant IFRS measure.
3. Based on a weighted average of 126.4 million diluted
shares for Q4 2012 and 124.0 million diluted shares for Q4
2011.
(€ million, except % and per share data)
2012 IFRSAdjustment
(1)
2012
non-IFRS2011 IFRS
Adjustment
(1)
2011
non-IFRSIFRS Non-IFRS (2)
Total Operating Expenses (406.5) 35.7 (370.8) (376.4) 32.2 (344.2) +8.0% +7.7%
Stock-based compensation expense (8.3) 8.3 - (6.0) 6.0 - - -
Amortization of acquired intangibles (25.0) 25.0 - (21.1) 21.1 - - -
Other operating income and expense, net (2.4) 2.4 - (5.1) 5.1 - - -
Operating Income 157.0 40.4 197.4 135.7 32.2 167.9 +15.7% +17.6%
Operating Margin 27.9% 34.7% 26.5% 32.8%
Financial revenue & other, net 6.2 0.1 6.3 (5.1) 4.3 (0.8) (221.6%) (887.5%)
Income tax expense (65.6) (7.9) (73.5) (45.2) (12.9) (58.1) +45.1% +26.5%
Non-controlling interest impact (1.8) 0.0 (1.8) (0.7) 0.1 (0.6) -
Net Income 95.8 32.6 128.4 84.7 23.7 108.4 +13.1% +18.5%
Diluted net income per share, in € (3) 0.76 0.26 1.02 0.68 0.19 0.87 +11.8% +17.2%
(€ million)
Cost of rev enue (73.3) (0.3) (73.6) (66.4) 0.2 (66.2)
Research and dev elopment (91.2) 1.5 (89.7) (88.6) 2.9 (85.7)
Marketing and sales (169.8) 2.5 (167.3) (148.2) 1.5 (146.7)
General and administrativ e (44.8) 4.6 (40.2) (47.0) 1.4 (45.6)
Total stock-based compensation expense 8.3 6.0
Increase (Decrease)Three months ended December 31,
Adjust.
Three months ended December 31,
2012 IFRS Adjust. 2011 IFRS2011
non-IFRS
2012
non-IFRS
56
3DS
.CO
M ©
Das
saul
t Sys
tèm
es
| Q4
& F
Y20
12 E
arni
ngs
Pre
sent
atio
n
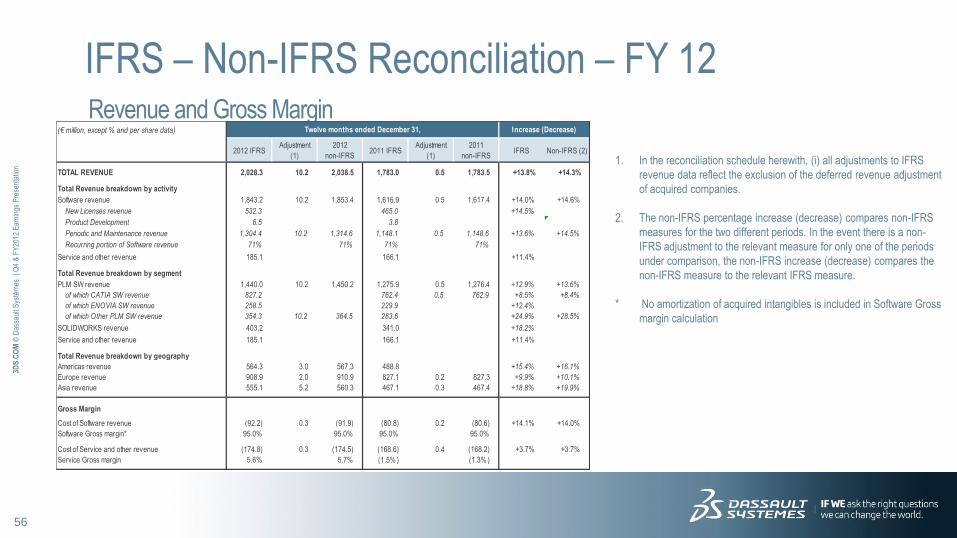
IFRS – Non-IFRS Reconciliation – FY 12 Revenue and Gross Margin
1. In the reconciliation schedule herewith, (i) all adjustments to IFRS
revenue data reflect the exclusion of the deferred revenue adjustment
of acquired companies.
2. The non-IFRS percentage increase (decrease) compares non-IFRS
measures for the two different periods. In the event there is a non-
IFRS adjustment to the relevant measure for only one of the periods
under comparison, the non-IFRS increase (decrease) compares the
non-IFRS measure to the relevant IFRS measure.
* No amortization of acquired intangibles is included in Software Gross
margin calculation
(€ million, except % and per share data)
2012 IFRSAdjustment
(1)
2012
non-IFRS2011 IFRS
Adjustment
(1)
2011
non-IFRSIFRS Non-IFRS (2)
TOTAL REVENUE 2,028.3 10.2 2,038.5 1,783.0 0.5 1,783.5 +13.8% +14.3%
Total Revenue breakdown by activity
Software revenue 1,843.2 10.2 1,853.4 1,616.9 0.5 1,617.4 +14.0% +14.6%
New Licenses revenue 532.3 465.0 +14.5%
Product Development 6.5 3.8
Periodic and Maintenance revenue 1,304.4 10.2 1,314.6 1,148.1 0.5 1,148.6 +13.6% +14.5%
Recurring portion of Software revenue 71% 71% 71% 71%
Service and other revenue 185.1 166.1 +11.4%
Total Revenue breakdown by segment
PLM SW revenue 1,440.0 10.2 1,450.2 1,275.9 0.5 1,276.4 +12.9% +13.6%
of which CATIA SW revenue 827.2 762.4 0.5 762.9 +8.5% +8.4%
of which ENOVIA SW revenue 258.5 229.9 +12.4%
of which Other PLM SW revenue 354.3 10.2 364.5 283.6 +24.9% +28.5%
SOLIDWORKS revenue 403.2 341.0 +18.2%
Service and other revenue 185.1 166.1 +11.4%
Total Revenue breakdown by geography
Americas revenue 564.3 3.0 567.3 488.8 +15.4% +16.1%
Europe revenue 908.9 2.0 910.9 827.1 0.2 827.3 +9.9% +10.1%
Asia revenue 555.1 5.2 560.3 467.1 0.3 467.4 +18.8% +19.9%
Gross Margin
Cost of Software revenue (92.2) 0.3 (91.9) (80.8) 0.2 (80.6) +14.1% +14.0%
Software Gross margin* 95.0% 95.0% 95.0% 95.0%
Cost of Service and other revenue (174.8) 0.3 (174.5) (168.6) 0.4 (168.2) +3.7% +3.7%
Service Gross margin 5.6% 5.7% (1.5%) (1.3%)
Twelve months ended December 31, Increase (Decrease)

57
3DS
.CO
M ©
Das
saul
t Sys
tèm
es
| Q4
& F
Y20
12 E
arni
ngs
Pre
sent
atio
n
IFRS – Non-IFRS Reconciliation – FY 12 Expenses & Earnings
1. In the reconciliation schedule herewith, (i) adjustments to
IFRS operating expenses data reflect the exclusion of the
amortization of acquired intangibles, share based
compensation expense, and other operating income and
expense, (ii) adjustments to IFRS financial revenue and
other, net reflect the exclusion of certain one-time financial
gains and losses in 2011 and 2012, and (iii) all
adjustments to IFRS income data reflect the combined
effect of these adjustments, plus with respect to net
income and diluted net income per share, the income tax
effect of the non IFRS adjustments and certain one-time
effects in 2012
2. The non-IFRS percentage increase (decrease) compares
non-IFRS measures for the two different periods. In the
event there is a non-IFRS adjustment to the relevant
measure for only one of the periods under comparison, the
non-IFRS increase (decrease) compares the non-IFRS
measure to the relevant IFRS measure.
3. Based on a weighted average of 125.9 million diluted
shares for FY 2012 and 124.0 million diluted shares for FY
2011.
(€ million, except % and per share data)
2012 IFRSAdjustment
(1)
2012
non-IFRS2011 IFRS
Adjustment
(1)
2011
non-IFRSIFRS Non-IFRS (2)
Total Operating Expenses (1,527.3) 133.1 (1,394.2) (1,355.1) 114.2 (1,240.9) +12.7% +12.4%
Stock-based compensation expense (36.8) 36.8 - (20.7) 20.7 - - -
Amortization of acquired intangibles (93.7) 93.7 - (83.6) 83.6 - - -
Other operating income and expense, net (2.6) 2.6 - (9.9) 9.9 - - -
Operating Income 501.0 143.3 644.3 427.9 114.7 542.6 +17.1% +18.7%
Operating Margin 24.7% 31.6% 24.0% 30.4%
Financial revenue & other, net 18.1 (7.4) 10.7 1.1 (2.4) (1.3) +1545.5% (923.1%)
Income tax expense (180.3) (46.2) (226.5) (138.5) (39.1) (177.6) +30.2% +27.5%
Non-controlling interest impact (4.0) 0.0 (4.0) (1.3) (0.3) (1.6) -
Net Income 334.8 89.7 424.5 289.2 72.9 362.1 +15.8% +17.2%
Diluted net income per share, in € (3) 2.66 0.71 3.37 2.33 0.59 2.92 +14.2% +15.4%
(€ million)
Cost of rev enue (267.0) 0.6 (266.4) (249.4) 0.6 (248.8)
Research and dev elopment (368.1) 14.2 (353.9) (329.3) 10.1 (319.2)
Marketing and sales (632.6) 11.0 (621.6) (535.3) 5.5 (529.8)
General and administrativ e (163.3) 11.0 (152.3) (147.6) 4.5 (143.1)
Total stock-based compensation expense 36.8 20.7
Twelve months ended December 31,
Twelve months ended December 31, Increase (Decrease)
2012 IFRS Adjust. 2011 IFRS2011
non-IFRS
2012
non-IFRSAdjust.
58
3DS
.CO
M ©
Das
saul
t Sys
tèm
es
| Q4
& F
Y20
12 E
arni
ngs
Pre
sent
atio
n
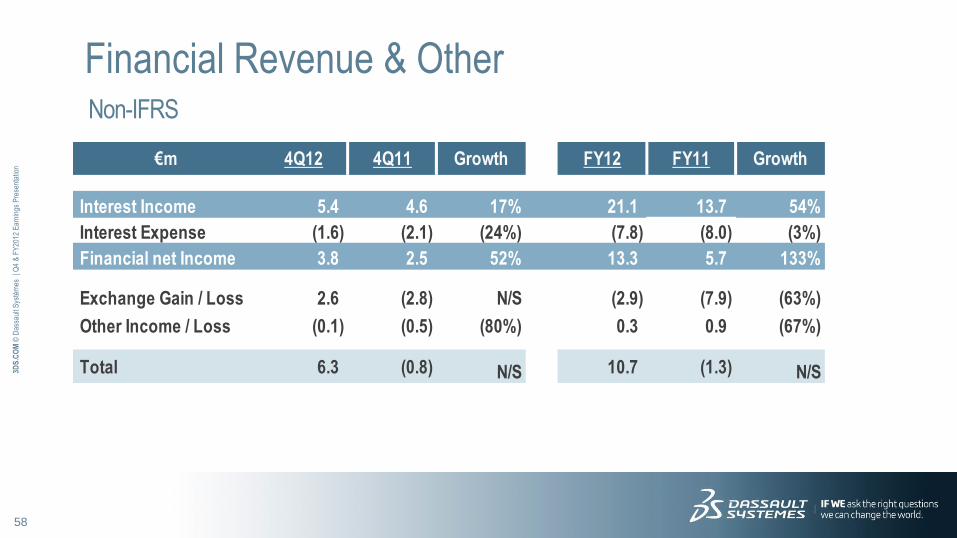
Financial Revenue & Other Non-IFRS
€m 4Q12 4Q11 Growth FY12 FY11 Growth
Interest Income 5.4 4.6 17% 21.1 13.7 54%
Interest Expense (1.6) (2.1) (24%) (7.8) (8.0) (3%)
Financial net Income 3.8 2.5 52% 13.3 5.7 133%
Exchange Gain / Loss 2.6 (2.8) N/S (2.9) (7.9) (63%)
Other Income / Loss (0.1) (0.5) (80%) 0.3 0.9 (67%)
Total 6.3 (0.8) N/S 10.7 (1.3) N/S
59
3DS
.CO
M ©
Das
saul
t Sys
tèm
es
| Q4
& F
Y20
12 E
arni
ngs
Pre
sent
atio
n
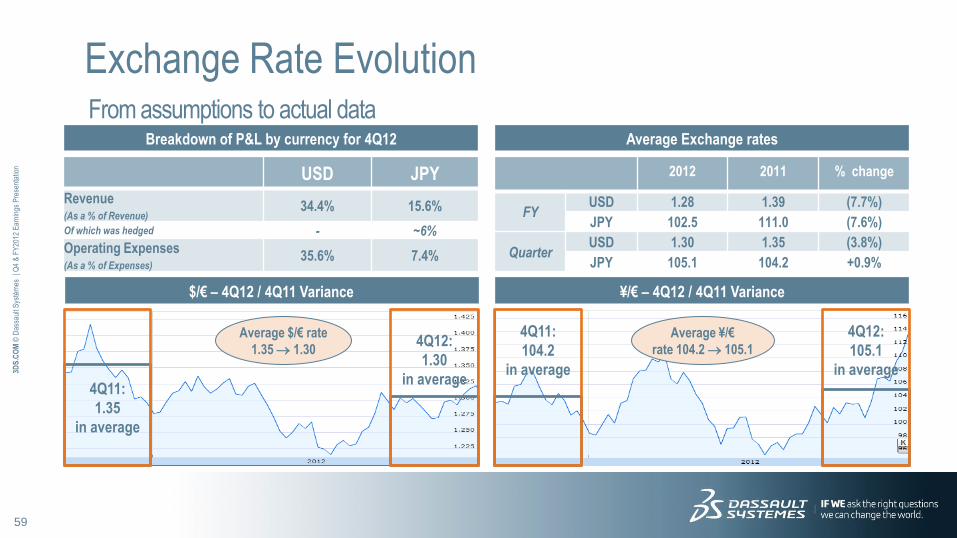
Exchange Rate Evolution From assumptions to actual data
Breakdown of P&L by currency for 4Q12
USD JPY
Revenue (As a % of Revenue)
34.4% 15.6%
Of which was hedged - ~6%
Operating Expenses (As a % of Expenses)
35.6% 7.4%
Average Exchange rates
$/€ – 4Q12 / 4Q11 Variance ¥/€ – 4Q12 / 4Q11 Variance
4Q11:
1.35
in average
Average ¥/€
rate 104.2 105.1
Average $/€ rate
1.35 1.30
4Q12:
1.30
in average
4Q11:
104.2
in average
4Q12:
105.1
in average
2012 2011 % change
FY USD 1.28 1.39 (7.7%)
JPY 102.5 111.0 (7.6%)
Quarter USD 1.30 1.35 (3.8%)
JPY 105.1 104.2 +0.9%
60
3DS
.CO
M ©
Das
saul
t Sys
tèm
es
| Q4
& F
Y20
12 E
arni
ngs
Pre
sent
atio
n
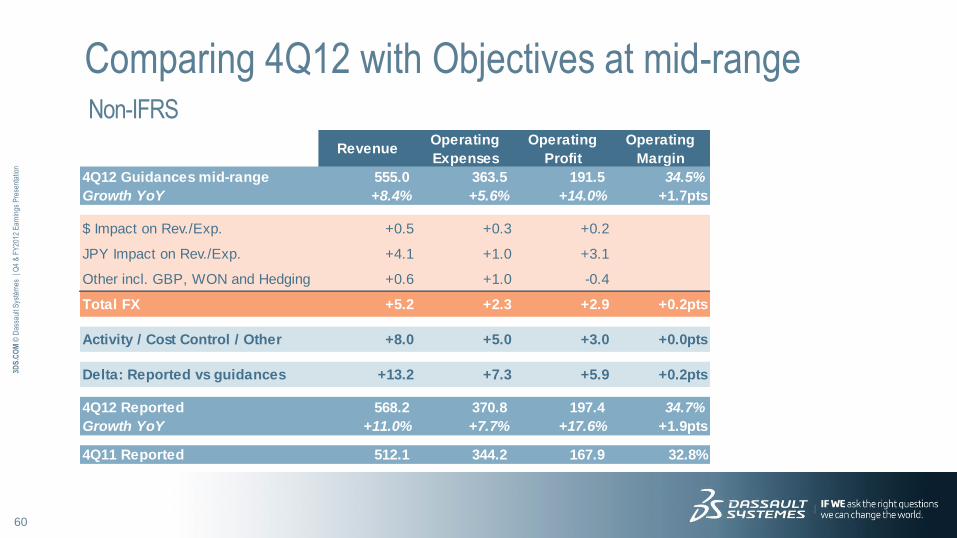
Comparing 4Q12 with Objectives at mid-range Non-IFRS
RevenueOperating
Expenses
Operating
Profit
Operating
Margin
4Q12 Guidances mid-range 555.0 363.5 191.5 34.5%
Growth YoY +8.4% +5.6% +14.0% +1.7pts
$ Impact on Rev./Exp. +0.5 +0.3 +0.2
JPY Impact on Rev./Exp. +4.1 +1.0 +3.1
Other incl. GBP, WON and Hedging +0.6 +1.0 -0.4
Total FX +5.2 +2.3 +2.9 +0.2pts
Activity / Cost Control / Other +8.0 +5.0 +3.0 +0.0pts
Delta: Reported vs guidances +13.2 +7.3 +5.9 +0.2pts
4Q12 Reported 568.2 370.8 197.4 34.7%
Growth YoY +11.0% +7.7% +17.6% +1.9pts
4Q11 Reported 512.1 344.2 167.9 32.8%
61
3DS
.CO
M ©
Das
saul
t Sys
tèm
es
| Q4
& F
Y20
12 E
arni
ngs
Pre
sent
atio
n
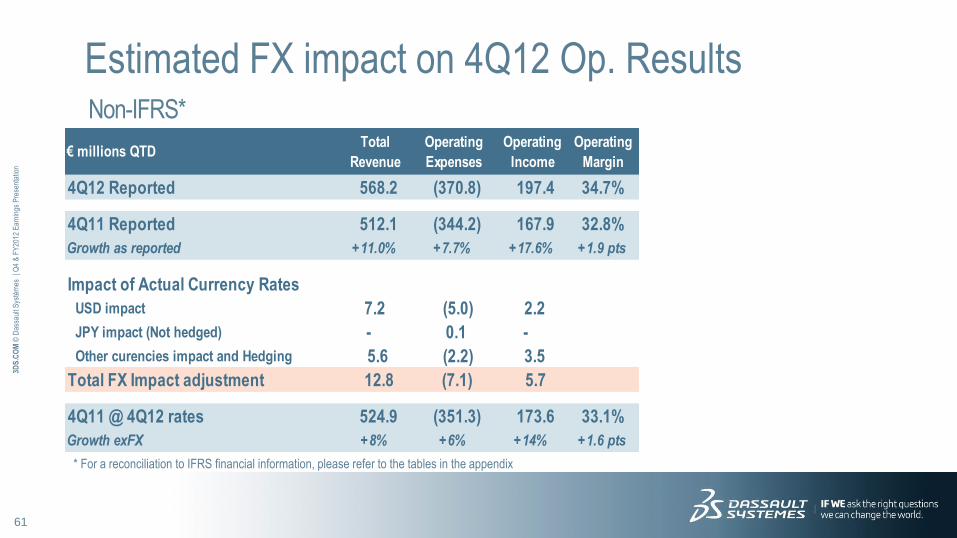
Estimated FX impact on 4Q12 Op. Results Non-IFRS*
* For a reconciliation to IFRS financial information, please refer to the tables in the appendix
€ millions QTDTotal
Revenue
Operating
Expenses
Operating
Income
Operating
Margin
4Q12 Reported 568.2 (370.8) 197.4 34.7%
4Q11 Reported 512.1 (344.2) 167.9 32.8%
Growth as reported +11.0% +7.7% +17.6% +1.9 pts
Impact of Actual Currency Rates
USD impact 7.2 (5.0) 2.2
JPY impact (Not hedged) - 0.1 -
Other curencies impact and Hedging 5.6 (2.2) 3.5
Total FX Impact adjustment 12.8 (7.1) 5.7
4Q11 @ 4Q12 rates 524.9 (351.3) 173.6 33.1%
Growth exFX +8% +6% +14% +1.6 pts
62
3DS
.CO
M ©
Das
saul
t Sys
tèm
es
| Q4
& F
Y20
12 E
arni
ngs
Pre
sent
atio
n
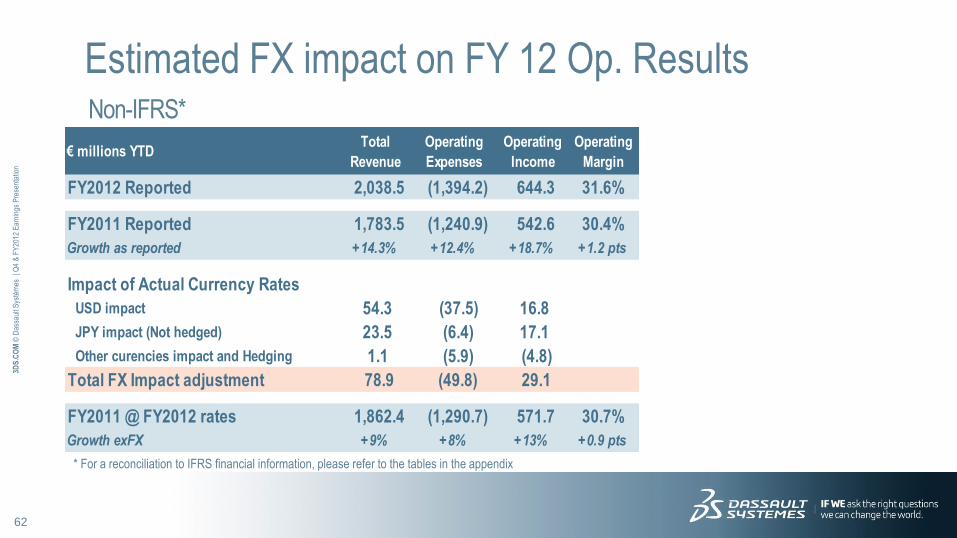
Estimated FX impact on FY 12 Op. Results Non-IFRS*
* For a reconciliation to IFRS financial information, please refer to the tables in the appendix
€ millions YTDTotal
Revenue
Operating
Expenses
Operating
Income
Operating
Margin
FY2012 Reported 2,038.5 (1,394.2) 644.3 31.6%
FY2011 Reported 1,783.5 (1,240.9) 542.6 30.4%
Growth as reported +14.3% +12.4% +18.7% +1.2 pts
Impact of Actual Currency Rates
USD impact 54.3 (37.5) 16.8
JPY impact (Not hedged) 23.5 (6.4) 17.1
Other curencies impact and Hedging 1.1 (5.9) (4.8)
Total FX Impact adjustment 78.9 (49.8) 29.1
FY2011 @ FY2012 rates 1,862.4 (1,290.7) 571.7 30.7%
Growth exFX +9% +8% +13% +0.9 pts
63
3DS
.CO
M ©
Das
saul
t Sys
tèm
es
| Q4
& F
Y20
12 E
arni
ngs
Pre
sent
atio
n
Detailed Balance-Sheet IFRS
End of Variation End of Variation
(in millions of €) Dec-12 Sep-12 Dec-12 / Sep-12 Dec-11 Dec-12 / Dec-11
Cash and cash equivalents 1,159.3 1,280.2 -120.9 1,154.3 +5.0
Short-term investments 159.8 182.4 -22.6 268.7 -108.9
Accounts receivable, net 457.8 358.7 +99.1 494.3 -36.5
Other current assets 154.4 156.5 -2.1 139.4 +15.0
Total current assets 1,931.3 1,977.8 -46.5 2,056.7 -125.4
Property and equipment, net 107.9 112.2 -4.3 106.6 +1.3
Goodwill and Intangible assets, net 1,459.5 1,508.5 -49.0 1,241.9 +217.6
Other non current assets 142.7 137.5 +5.2 111.6 +31.1
Total Assets 3,641.4 3,736.0 -94.6 3,516.8 +124.6
Accounts payable 90.8 78.8 +12.0 99.9 -9.1
Unearned revenue 484.7 502.3 -17.6 492.0 -7.3
Short-term debt 25.5 228.9 -203.4 228.9 -203.4
Other current liabilities 331.0 322.5 +8.5 317.3 +13.7
Total current liabilities 932.0 1,132.5 -200.5 1,138.1 -206.1
Long-term debt 38.3 57.8 -19.5 72.4 -34.1
Other non current obligations 290.1 272.6 +17.5 222.6 +67.5
Total long-term liabilities 328.4 330.4 -2.0 295.0 +33.4
Non-controlling interest 16.2 15.8 +0.4 17.5 -1.3
Parent Shareholders' equity 2,364.8 2,257.3 +107.5 2,066.2 +298.6
Total Liabilities and Shareholders' Equity 3,641.4 3,736.0 -94.6 3,516.8 +124.6
64
3DS
.CO
M ©
Das
saul
t Sys
tèm
es
| Q4
& F
Y20
12 E
arni
ngs
Pre
sent
atio
n
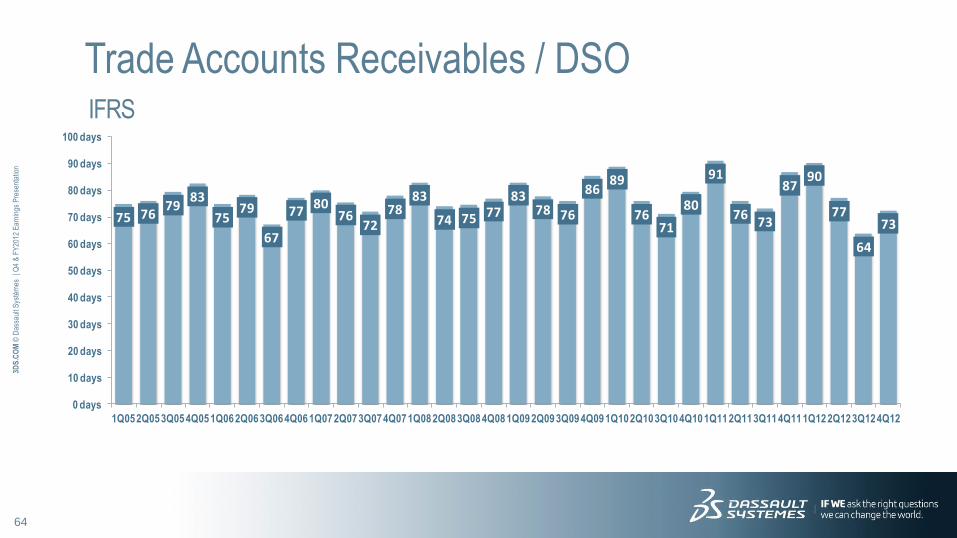
Trade Accounts Receivables / DSO IFRS
75 7679
83
7579
67
7780
7672
7883
74 75 7783
78 76
8689
7671
80
91
7673
8790
77
64
73
0 days
10 days
20 days
30 days
40 days
50 days
60 days
70 days
80 days
90 days
100 days
1Q052Q053Q054Q051Q062Q063Q064Q061Q072Q073Q074Q071Q082Q083Q084Q081Q092Q093Q094Q091Q102Q103Q104Q101Q112Q113Q114Q111Q122Q123Q124Q12
65
3DS
.CO
M ©
Das
saul
t Sys
tèm
es
| Q4
& F
Y20
12 E
arni
ngs
Pre
sent
atio
n
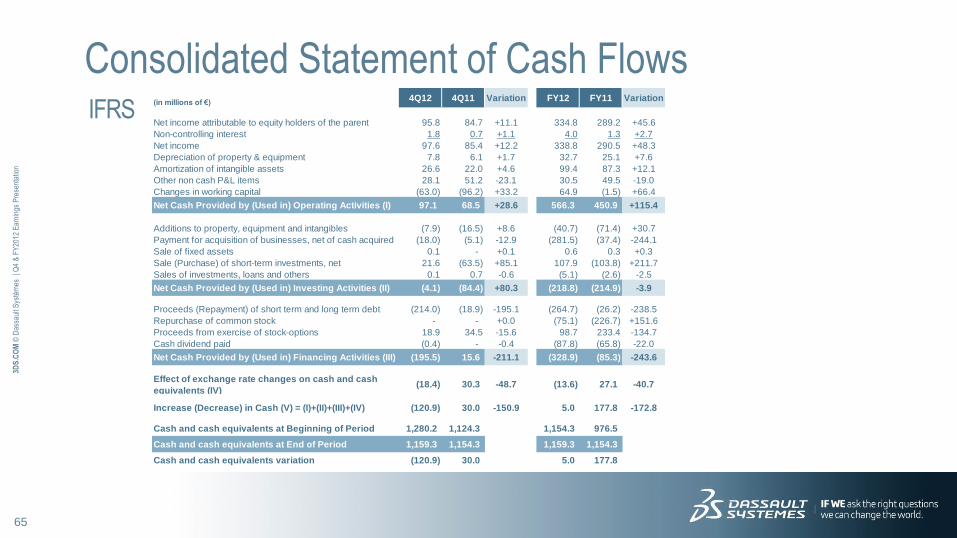
Consolidated Statement of Cash Flows IFRS
(in millions of €)4Q12 4Q11 Variation FY12 FY11 Variation
Net income attributable to equity holders of the parent 95.8 84.7 +11.1 334.8 289.2 +45.6
Non-controlling interest 1.8 0.7 +1.1 4.0 1.3 +2.7
Net income 97.6 85.4 +12.2 338.8 290.5 +48.3
Depreciation of property & equipment 7.8 6.1 +1.7 32.7 25.1 +7.6
Amortization of intangible assets 26.6 22.0 +4.6 99.4 87.3 +12.1
Other non cash P&L items 28.1 51.2 -23.1 30.5 49.5 -19.0
Changes in working capital (63.0) (96.2) +33.2 64.9 (1.5) +66.4
Net Cash Provided by (Used in) Operating Activities (I) 97.1 68.5 +28.6 566.3 450.9 +115.4
Additions to property, equipment and intangibles (7.9) (16.5) +8.6 (40.7) (71.4) +30.7
Payment for acquisition of businesses, net of cash acquired (18.0) (5.1) -12.9 (281.5) (37.4) -244.1
Sale of fixed assets 0.1 - +0.1 0.6 0.3 +0.3
Sale (Purchase) of short-term investments, net 21.6 (63.5) +85.1 107.9 (103.8) +211.7
Sales of investments, loans and others 0.1 0.7 -0.6 (5.1) (2.6) -2.5
Net Cash Provided by (Used in) Investing Activities (II) (4.1) (84.4) +80.3 (218.8) (214.9) -3.9
Proceeds (Repayment) of short term and long term debt (214.0) (18.9) -195.1 (264.7) (26.2) -238.5
Repurchase of common stock - - +0.0 (75.1) (226.7) +151.6
Proceeds from exercise of stock-options 18.9 34.5 -15.6 98.7 233.4 -134.7
Cash dividend paid (0.4) - -0.4 (87.8) (65.8) -22.0
Net Cash Provided by (Used in) Financing Activities (III) (195.5) 15.6 -211.1 (328.9) (85.3) -243.6
(18.4) 30.3 -48.7 (13.6) 27.1 -40.7
Increase (Decrease) in Cash (V) = (I)+(II)+(III)+(IV) (120.9) 30.0 -150.9 5.0 177.8 -172.8
Cash and cash equivalents at Beginning of Period 1,280.2 1,124.3 1,154.3 976.5
Cash and cash equivalents at End of Period 1,159.3 1,154.3 1,159.3 1,154.3
Cash and cash equivalents variation (120.9) 30.0 5.0 177.8
Effect of exchange rate changes on cash and cash
equivalents (IV)
66
3DS
.CO
M ©
Das
saul
t Sys
tèm
es
| Q4
& F
Y20
12 E
arni
ngs
Pre
sent
atio
n
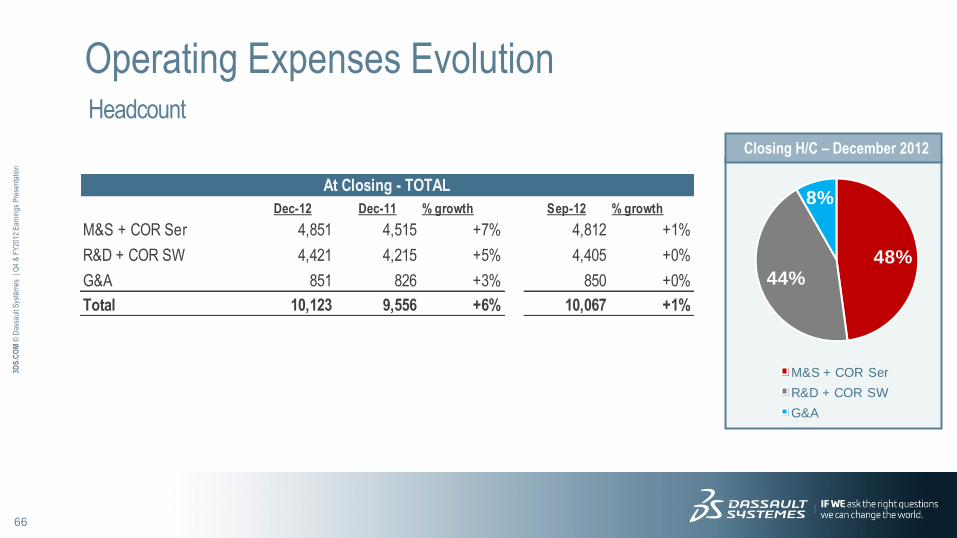
Operating Expenses Evolution Headcount
Closing H/C – December 2012
48%44%
8%
M&S + COR Ser
R&D + COR SW
G&A
At Closing - TOTAL At Closing - TOTAL
Dec-12 Dec-11 % growth Sep-12 % growth
M&S + COR Ser 4,851 4,515 +7% 4,812 +1%
R&D + COR SW 4,421 4,215 +5% 4,405 +0%
G&A 851 826 +3% 850 +0%
Total 10,123 9,556 +6% 10,067 +1%
67
3DS
.CO
M ©
Das
saul
t Sys
tèm
es
| Q4
& F
Y20
12 E
arni
ngs
Pre
sent
atio
n
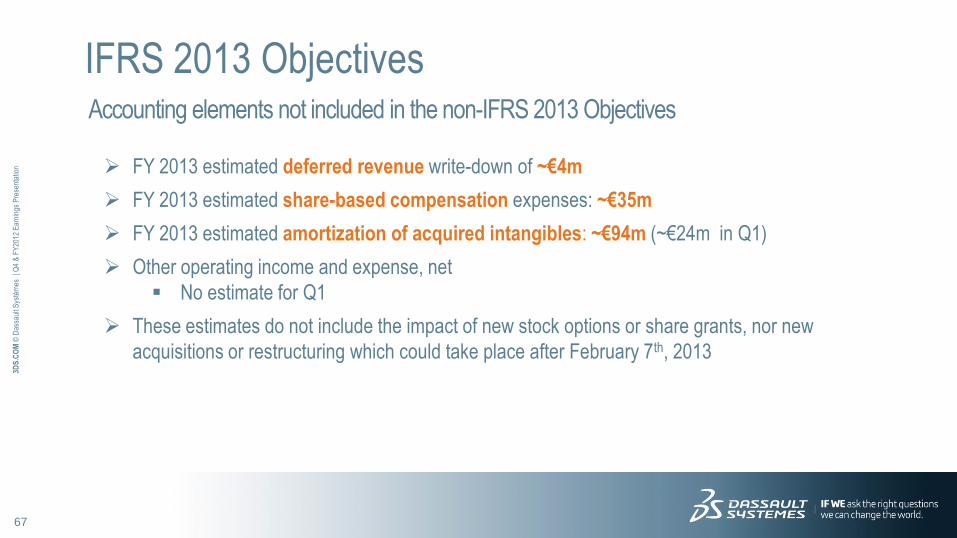
Accounting elements not included in the non-IFRS 2013 Objectives
IFRS 2013 Objectives
FY 2013 estimated deferred revenue write-down of ~€4m
FY 2013 estimated share-based compensation expenses: ~€35m
FY 2013 estimated amortization of acquired intangibles: ~€94m (~€24m in Q1)
Other operating income and expense, net
No estimate for Q1
These estimates do not include the impact of new stock options or share grants, nor new
acquisitions or restructuring which could take place after February 7th, 2013
68
3DS
.CO
M ©
Das
saul
t Sys
tèm
es
| Q4
& F
Y20
12 E
arni
ngs
Pre
sent
atio
n