Embed Size (px)
Citation preview

Analyst Working SessionAnalyst Working Session
May 13, 2010
1
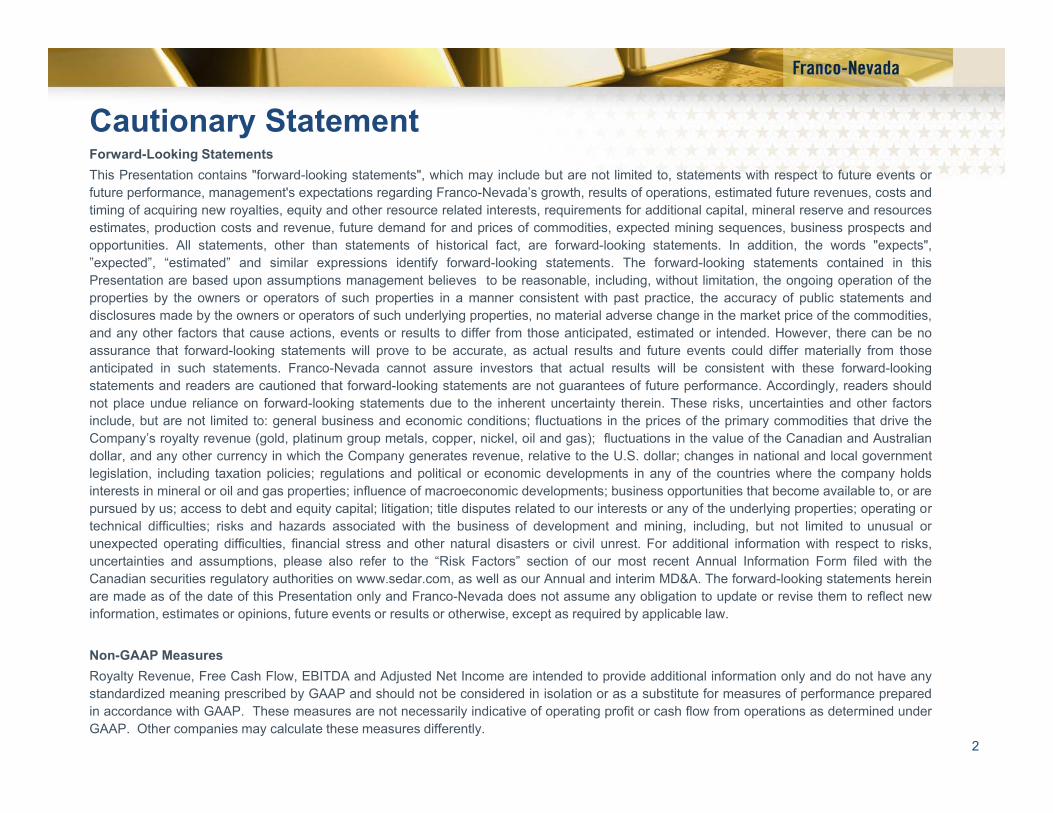
Cautionary StatementF d L ki St t tForward-Looking StatementsThis Presentation contains "forward-looking statements", which may include but are not limited to, statements with respect to future events orfuture performance, management's expectations regarding Franco-Nevada’s growth, results of operations, estimated future revenues, costs andtiming of acquiring new royalties, equity and other resource related interests, requirements for additional capital, mineral reserve and resourcesestimates, production costs and revenue, future demand for and prices of commodities, expected mining sequences, business prospects andopportunities. All statements, other than statements of historical fact, are forward-looking statements. In addition, the words "expects",”expected”, “estimated” and similar expressions identify forward-looking statements. The forward-looking statements contained in thisPresentation are based upon assumptions management believes to be reasonable, including, without limitation, the ongoing operation of theproperties by the owners or operators of such properties in a manner consistent with past practice, the accuracy of public statements anddisclosures made by the owners or operators of such underlying properties, no material adverse change in the market price of the commodities,and any other factors that cause actions, events or results to differ from those anticipated, estimated or intended. However, there can be noassurance that forward-looking statements will prove to be accurate, as actual results and future events could differ materially from thoseg p , yanticipated in such statements. Franco-Nevada cannot assure investors that actual results will be consistent with these forward-lookingstatements and readers are cautioned that forward-looking statements are not guarantees of future performance. Accordingly, readers shouldnot place undue reliance on forward-looking statements due to the inherent uncertainty therein. These risks, uncertainties and other factorsinclude, but are not limited to: general business and economic conditions; fluctuations in the prices of the primary commodities that drive theCompany’s royalty revenue (gold, platinum group metals, copper, nickel, oil and gas); fluctuations in the value of the Canadian and Australiandollar and any other currency in which the Company generates revenue relative to the U S dollar; changes in national and local governmentdollar, and any other currency in which the Company generates revenue, relative to the U.S. dollar; changes in national and local governmentlegislation, including taxation policies; regulations and political or economic developments in any of the countries where the company holdsinterests in mineral or oil and gas properties; influence of macroeconomic developments; business opportunities that become available to, or arepursued by us; access to debt and equity capital; litigation; title disputes related to our interests or any of the underlying properties; operating ortechnical difficulties; risks and hazards associated with the business of development and mining, including, but not limited to unusual orunexpected operating difficulties, financial stress and other natural disasters or civil unrest. For additional information with respect to risks,uncertainties and assumptions please also refer to the “Risk Factors” section of our most recent Annual Information Form filed with theuncertainties and assumptions, please also refer to the Risk Factors section of our most recent Annual Information Form filed with theCanadian securities regulatory authorities on www.sedar.com, as well as our Annual and interim MD&A. The forward-looking statements hereinare made as of the date of this Presentation only and Franco-Nevada does not assume any obligation to update or revise them to reflect newinformation, estimates or opinions, future events or results or otherwise, except as required by applicable law.
Non-GAAP Measures
2
Royalty Revenue, Free Cash Flow, EBITDA and Adjusted Net Income are intended to provide additional information only and do not have anystandardized meaning prescribed by GAAP and should not be considered in isolation or as a substitute for measures of performance preparedin accordance with GAAP. These measures are not necessarily indicative of operating profit or cash flow from operations as determined underGAAP. Other companies may calculate these measures differently.

Agenda
Financial Update (20 Minutes) Sandip Rana• Q1 2010 Financial Results• Revenue & Commodity Contribution• Revenue Sensitivity & Leverage
Operating Mineral Assets Highlights (20 Minutes) Steve Aaker• Goldstrike • RobinsonGo ds e• Palmarejo• Stillwater• Gold Quarry
ob so• Marigold• Bald Mountain
Oil & Gas Assets Highlights (5 Minutes) Geoff Waterman• Oil & Gas Reserves & Production
Advanced Mineral Assets Highlights (15 Minutes) Paul BrinkT i t Oth Ad d A t• Tasiast
• Detour• Subika (Ahafo)
• Other Advanced Assets• Growth Profile
Prosperity Acquisition (20 Minutes) Paul Brink
3
Q&A

Management
Title Canada David Harquail President & CEO
Sandip Rana Chief Financial Officer p
Sharon Dowdall VP, Special Projects
Jacqueline Jones Chief Legal Officer & Corporate Secretary
H. Geoff Waterman Chief Operating Officer
Paul Brink S.V.P. Business Development
Petra Decher VP, Finance & Assistant Secretary
Jason O’Connell Manager, IR & Business Development
Debbie McEnaney Controller
Lena Miller Senior Accountant
Cindy Smith Land Analyst
Donna Andrejek Office Manager - Toronto
U.S. Stephen Alfers Chief of U.S. Operations Steve Aaker S.V.P. Acquisitions
Jeff Jenkins Director of Finance - U.S. Operations
Edward Jackson Director of Mineral Lands
Katie Griffith Land Administrator
Robert Eckles Office Manager - Denver
4
Australia Kevin McElligott Managing Director, Australian Operations

Q1 2010 Results and Financial Highlights
Sandip Rana – CFO
5

Company Continues to Deliver Strong Financial Results
Continued growth in Royalty Revenue• 43% year-over-year increase
Continued growth in Gold Royalty Revenue• 43% year-over-year increase
Strong Earnings & Free Cash Flow
Working Capital Strong – Approximately $600M
Diversification of Revenue
6
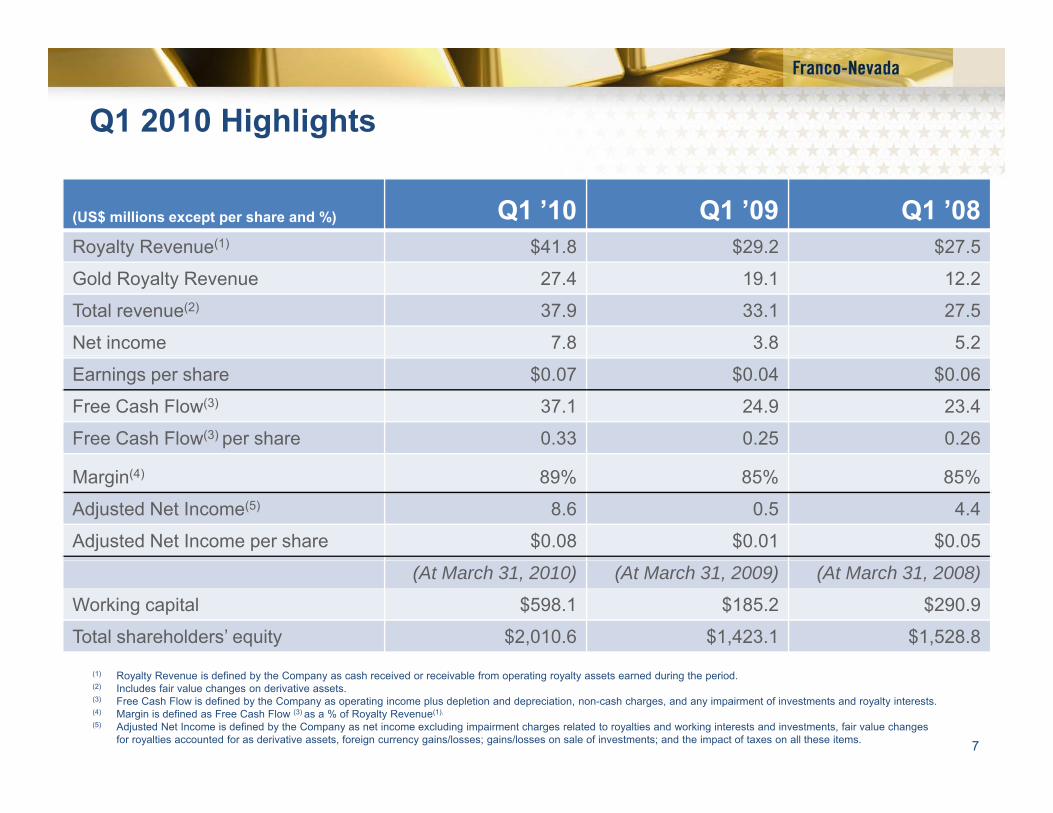
Q1 2010 Highlights
(US$ millions except per share and %) Q1 ’10 Q1 ’09 Q1 ’08Royalty Revenue(1) $41.8 $29.2 $27.5Royalty Revenue $41.8 $29.2 $27.5
Gold Royalty Revenue 27.4 19.1 12.2
Total revenue(2) 37.9 33.1 27.5
Net income 7.8 3.8 5.2
Earnings per share $0.07 $0.04 $0.06
Free Cash Flow(3) 37.1 24.9 23.4
Free Cash Flow(3) per share 0.33 0.25 0.26
Margin(4) 89% 85% 85%
Adjusted Net Income(5) 8.6 0.5 4.4
Adjusted Net Income per share $0.08 $0.01 $0.05
(At March 31, 2010) (At March 31, 2009) (At March 31, 2008)
Working capital $598.1 $185.2 $290.9
Total shareholders’ equity $2,010.6 $1,423.1 $1,528.8
7
(1) Royalty Revenue is defined by the Company as cash received or receivable from operating royalty assets earned during the period.(2) Includes fair value changes on derivative assets. (3) Free Cash Flow is defined by the Company as operating income plus depletion and depreciation, non-cash charges, and any impairment of investments and royalty interests.(4) Margin is defined as Free Cash Flow (3) as a % of Royalty Revenue(1).
(5) Adjusted Net Income is defined by the Company as net income excluding impairment charges related to royalties and working interests and investments, fair value changes for royalties accounted for as derivative assets, foreign currency gains/losses; gains/losses on sale of investments; and the impact of taxes on all these items.

Growth in Royalty Revenue(1) from Precious Metal Assets
45
50
30
35
40
ns)
Oil & Gas
15
20
25
($ m
illio
n Oil & GasBase Metals & OtherPGMGold
0
5
10
75% of Royalty Revenue in Q1’10 derived from precious metals
0Q1 2008 Q2 2008 Q3 2008 Q4 2008 Q1 2009 Q2 2009 Q3 2009 Q4 2009 Q1 2010
8
75% of Royalty Revenue in Q1 10 derived from precious metals
(1) Royalty Revenue is defined by the Company as cash received or receivable from operating royalty assets earned during the period.

Royalty Revenue(1) & Free Cash Flow (“FCF”)(2)
3Royalty Revenue(1)
.5 $3
9.0
$37.
1
2.9 $3
6.4
$44.
3
$41.
8
Free Cash Flow (2)
Royalty Revenue(1)
89%
89%88%
85%$2
4.9 $27.
9 $32 .
$29.
2 $32 $
FCF/Revenue % 85%85%
Q1 2009 Q2 2009 Q3 2009 Q4 2009 Q1 2010
9
(1) Royalty Revenue is defined by the Company as cash received or receivable from operating royalty assets earned during the period. Note revenue figures are in millions. (2) Free Cash Flow is defined by the Company as operating income plus depletion and depreciation, non-cash charges, and any impairment of investments and royalty interests

Royalty Revenue(1) by Commodity
Three months endedYear Ended
Oil and
Three months ended March 31, 2010
Oil & G
Year Ended December 31, 2009
Gold65%PGM
10%
Other Minerals
2%
O a dGas23%
Gold70%
PGM8%
Other Minerals
2%
Oil & Gas20%
10%
10
(1) Royalty Revenue is defined by the Company as cash received or receivable from operating royalty assets earned during the period.

Quality Assets in Quality Jurisdictions
Royalty Revenue(1) by CountryThree Months Ended March 31, 2010
Australia
Royalty Revenue(1) Components Three Months Ended March 31, 2010
Palmarejo22%
B M t l
Edson8%
Midale2%
O&G Other
7%
Mexico
Other3%
Australia3%
Gold Quarry4%
Goldstrike - NSR9%Stillwater
8%
Pandora2%
Base Metals & Other
2%
Weyburn6% US
45%
Mexico22%
Goldstrike - NPI11%
Marigold8%
Gold Other11%
Canada27%
Diversified portfolio generating 89% Margin(2)
11
(1) Royalty Revenue is defined by the Company as cash received or receivable from operating royalty assets earned during the period.(2) Margin is defined as Free Cash Flow as a percentage of Royalty Revenue.

Growing Gold – Less Dependent on Goldstrike
100%
Royalty Revenue(1) Contribution
70%
80%
90%
100%
40%
50%
60%
70%
10%
20%
30%
40%
0%
10%
Q1 2008 Q2 2008 Q3 2008 Q4 2008 Q1 2009 Q2 2009 Q3 2009 Q4 2009 Q1 2010
Goldstrike Precious Metals Remaining Royalty Revenue
12
(1) Royalty Revenue is defined by the Company as cash received or receivable from operating royalty assets earned during the period.

Royalty Revenue(1) Q1 2009 to Q1 2010
8,996
4,1741,905 1,631
1,236
2,220 1,578 1 209
41,805
29,217
8,996 1,578 1,209 347
13(1) Royalty Revenue is defined by the Company as cash received or receivable from operating royalty assets earned during the period. Note, revenue is in thousands of dollars.

Net Income Q1 2009 to Q1 2010
8 414
4,1742,780 459
16,557
8,414
3 797
16,138
7,714
4 548
7,781
3,797 4,548
14Note, net income is in thousands of dollars.

Franco-Nevada’s Capacity for New Projects
Capital Resources @ March 31, 2010 US$ Millions
Working Capital $598
Marketable Investments (Primarily NEM) $52
Available Credit Facility $175
Total Available Capital $825
No debt, hedges or material capital obligations
Plus additional capacity from growing free cash flows
15

Sources of Gold Leverage
Higher leverage from royalty structure:– profit based royalties (Goldstrike, Hemlo …)
l d lti
Working interests
7%
Three months ended March 31, 2010
– scaled royalties (Holloway, Holt …)
– gold streams (Palmarejo)
10% gold price move ≈Revenue-
Based royalties
Profit
Other22%
7%
10% gold price move 13% change in gold revenue*
Higher gold prices add further leverage from:
56%Profit-based
royalties15%
Higher gold prices add further leverage from: – resource to reserve conversion– increased risk capital to advance projects on Franco lands
Royalties provide:- more leverage and yield than an ETF
16* Management estimate based on $1100/oz gold price
- less project, capital and cost risk than an operator
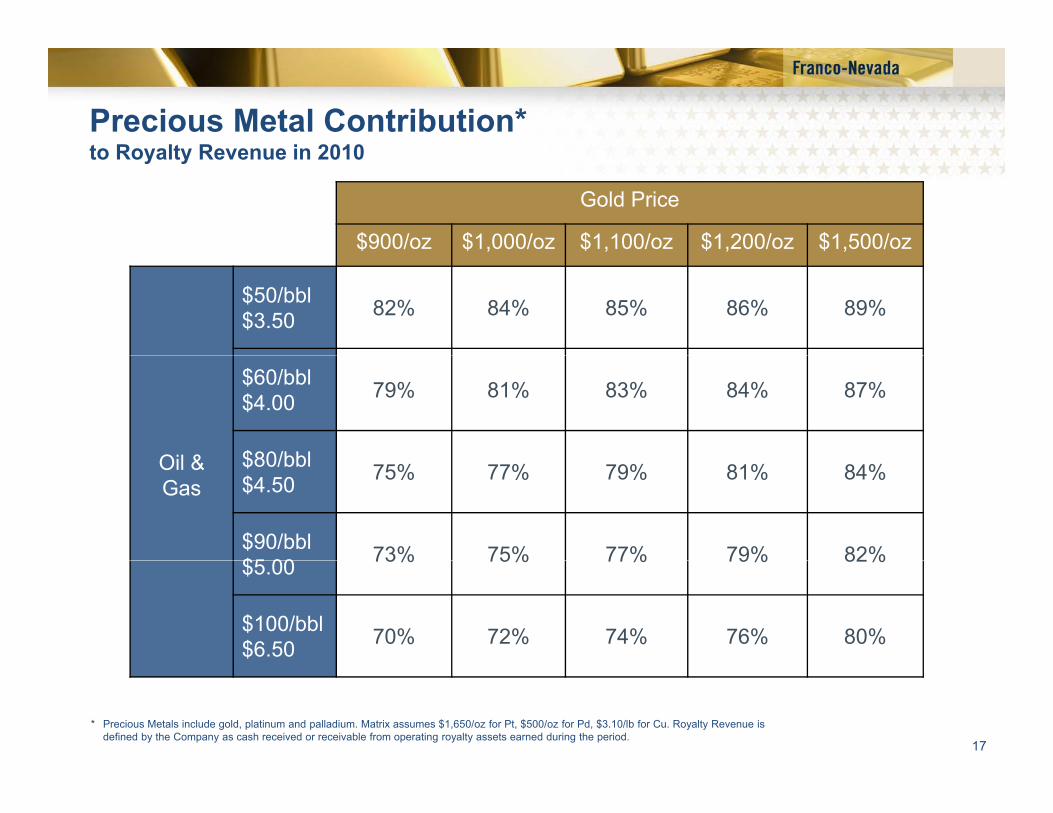
Precious Metal Contribution*to Royalty Revenue in 2010to Royalty Revenue in 2010
Gold Price
$900/oz $1,000/oz $1,100/oz $1,200/oz $1,500/oz
$50/bbl$3.50 82% 84% 85% 86% 89%
Oil &
$60/bbl$4.00 79% 81% 83% 84% 87%
$80/bblOil & Gas
$80/bbl$4.50 75% 77% 79% 81% 84%
$90/bbl$5 00 73% 75% 77% 79% 82%$5.00 73% 75% 77% 79% 82%
$100/bbl$6.50 70% 72% 74% 76% 80%
17
* Precious Metals include gold, platinum and palladium. Matrix assumes $1,650/oz for Pt, $500/oz for Pd, $3.10/lb for Cu. Royalty Revenue is defined by the Company as cash received or receivable from operating royalty assets earned during the period.

Additional Financial Details in Appendices
Accounting Definitions for FCF & Adjusted Net Income
Derivative Accounting for PalmarejoDerivative Accounting for Palmarejo
Book Values
Income TaxesIncome Taxes
– Tax Depletion and Tax Balances
– Applicable Statutory Tax Ratespp y
Costs and Expenses & Interest Expense
Capital Structure
Liquidity & Capital Resources
Security of Investments
18

Operating Mineral Assets
Steve Aaker – Senior VP AcquisitionsSte e a e Se o cqu s t o s
19

Franco- Nevada Royalty Operators include:
Core Operators:
Goldstrike - NevadaBald Mountain - Nevada
Up and Comers:
Palmarejo – Mexico*Bald Mountain - NevadaHemlo - Ontario
Gold Quarry – Nevada*Ah f S th Gh *
Mesquite – CaliforniaCerro San Pedro – Mexico
Holloway - OntarioAhafo South – Ghana*
Marigold - NevadaMusselwhite – Ontario
Hislop - OntarioHolt - Ontario
Tasiast - Mauritania
Stillwater – MontanaEast Boulder - Montana
Detour Lake - Ontario
PalmarejoGoldstrike
Palmarejo
20* post IPO acquisitions

Goldstrike RoyaltiesView looking West
D id S h h h t
Goldstrike Royalties:
• Located in Nevada & Operated by Barrick
• 4% NSR and 5% NPI on the Post and Goldstrike claims
David Schumacher photo
• 4% NSR and 5% NPI on the Post and Goldstrike claims
• 4% NSR and 5% NPI on the Extension and Gold Bug claims
• 2% NSR over the Bazza claims and a 2% NSR and 2.4% NPI over the Bazza Strip area
21
• 6% NPI on the SJ claims and SPLC lease area
• 2% - 4% NSR royalties on other peripheral claim and fee lands.

Goldstrike Royalties
2009 results - Barrick reported:
• Goldstrike produced 1,355 K oz at cash costs of $464/oz
– A major waste removal phase began in 2H-09 with the processing of lower grade ores in theA major waste removal phase began in 2H-09, with the processing of lower grade ores in theBetze-Post pit.
2010 guidance - Barrick expects:
• Goldstrike production to decline to 1,150 to 1,200 K oz at total cash costs of $495 to $515/oz
2008 2009 2010
– grades and recoveries in the first half of the year are expected to be lower due to minesequencing and waste stripping.
Actual Actual Forecast
NSR Revenue ($m) (2) $18.7 $21.5NPI Revenue ($m) (2) $30.9 $20.5Production (K oz)(1) 1,706 1,355 ±1,200P&P Reserves (K o ) (1) 12 839 12 156P&P Reserves (K oz) (1) 12,839 12,156M&I Resources (K oz) (1) 2,312 2,353Inferred Resources (K oz) (1) 1,390 1,046% Oz Prod. (FNV royalty) (2) 86% 100% 85-100%
David Schumacher photo
22
(1) Production and Reserves - Resources are reported on a 100% basis & include ounces not subject to FNV’s royalty. Production forecast based on Barrick guidance. (2) Revenue and % Oz Prod. are for FNV’s pro-rata share of produced ounces and royalty revenues therefrom based on historical results.
Meikle-Rodeo
p

Goldstrike Royalties Indicative Sources for Royalty ProductionIndicative Sources for Royalty Production
±25% of FNV oz±25% of FNV oz
45-50% of FNV oz45-50% of FNV oz
<5% of FNV oz (SP)*<5% of FNV oz (SP)*25-30% of FNV oz25-30% of FNV oz
23* Stock Piles

Palmarejo
Gold Royalty Stream on Coeur’s Ag-Au project in Mexico • $75 million acquisition in January 2009• 50% of gold produced from the 29 000 acre Palmarejo Property (uncapped)50% of gold produced from the 29,000 acre Palmarejo Property (uncapped)• less $400 per oz (increasing by 1% per annum after four years)• Minimum of 50,000 ozs per annum beginning July 1, 2009 until 400,000 ozs have been paid• Additional 316,436 shares of FNV ($5 million at closing) if certain milestones are achieved( g)
24

Palmarejo
Palmarejo began production in April 2009Expanded 11‐year mine plan– Capacity to produce an average of 9 million
silver ounces and 120,000 gold ounces annually
Coeur announced a 54% increase in goldCoeur announced a 54% increase in gold reserves during 2009Capex for 2010 budgeted at $55 million$9.2 million budgeted for exploration at $ g pGuadalupe, La Patria & others in 2010
2009 Actual
2010Forecast
$NSR Revenue ($m) $18.8Production (K oz) (1) 54.7 109% Oz Prod. (FNV royalty) 100% 100%
Minimum 50 koz net
25Diesel Generators(1) Reported on a 100% basis – Production, Production forecast based on Coeur’s 2010 guidance of
which FNV has a 50% interest.
to FNV

Stillwater Royalty
Stillwater Royalty
• 5% NSR o Payable on
production from 813production from 813 of the 995 claims
o Royalty claims cover the majority of the Stillwater mine and all
f th E t B ldof the East Boulder mine
26View looking south View looking south

Stillwater
PGM metal price declines led to a restructuring of operations at the Stillwater complex in 2009, resulting in:g
• reduced production from East Boulder• reduced total company workforce, including
contractors, by 27%.• performance to date under the restructured
mine plan and increased metal prices point to a favorable 2010 operating year
2008 actual
2009 actual
2010 forecast
Revenue ($000) (1) $13,553 $10,135Production (PGM K oz) (2) 499 530 515Production (PGM SW/EB) (2) 384/115 407/123 370/125Production (PGM SW/EB) ( ) 384/115 407/123 370/125P&P Reserve (PGM K oz) (2) 20,461 20,614% Oz Prod. (FNV royalty) (3) 88% 88% 85-90%
27
(1) Revenue is based on FNV’s pro-rata share of production(2) Production and Reserves are reported on a 100% basis & include ounces not subject to FNV’s royalty.
2010 forecast based on Stillwater 2010 guidance.(3) Management estimate

Gold Quarry Royalty
Gold Quarry Royalty is based on:
• 7 29% NSR of “Property” production or7.29% NSR of Property production, or• Minimum Annual Royalties (“MAR”) tied to
unpaid “Property:”1. Reserves2 Stockpiles2. Stockpiles
David Schumacher photo
2009 Totals
2010Forecast
NSR Revenue ($m) $13.8($ ) $Royalty Oz Net to FNV (K oz) (1) 14,431 16,500
28(1) Royalty ounces are 100% net to FNV.

Gold Quarry – West Wall Layback
Newmont’s GQ West Wall Layback
In Feb-2010 NEM announced a 2 9 Moz ProvenIn Feb 2010, NEM announced a 2.9 Moz Proven and Probable reserve increase at Gold Quarry
• Increase resulted from conversion of West Wall Layback resources announced last year
• New P&P ounces will extend mine life of Gold Quarry
• The P&P ounces on the Property will NeNe p y
positively impact the life of Franco’s MAR/reserves
• In 2010 Q-1 conference call, Newmont reports continued exploration success at
ew
P&P?
ew
P&P?
reports continued exploration success at Gold Quarry
29Exact portion of deposit subject to royalty is uncertain

Gold Quarry RoyaltyNewmont’s GQ geotechnical failure
In Feb-2010, NEM announced a geotechnical failure occurred at GQ, resulting in the deferral of 150,000 oz/year in production for both 2010 and 2011. NEM
ti i t i i th d f d i 2012 danticipates mining the deferred ounces in 2012 and 2013.
• Franco understands the event occurred in the SE portion of the pit, for the most part off the “P t ”“Property”
• The deferral of GQ production will impact Franco’s royalty payments only if the new mine plan results in unexpected changes to Property
Revised Outlook
Stockpiles and/or Reserves and the associated MAR calculation based thereon.
Revised OutlookAt acquisition, guidance for the GQ Royalty was “on average, greater than
11,200 gold royalty ounces per annum”. In 2009, the MAR-Stockpile payment increased to 14,431 ozs. For 2010, initial guidance, based on the MAR-
Stockpile is expected to be 16 500 oz
30
Stockpile, is expected to be 16,500 oz
FNV accrues for minimum royalty provision in Q4 only

Robinson Cu-Au Royalties
Robinson Royaltiesy• 0.225% NSR royalty
• 10% price participation royalty on 51% of the gold produced above 60,000 oz
Unpatented Claims
Patented Claims
above 60,000 oz
• A price participation royalty on 51% of each pound of copper produced in excess of 130 million pounds multiplied by a
Kimbley Wedge
5¢/lb minimum plus 40% of the difference between the average spot price less a threshold price of $1.00 per pound adjusted for inflation (CPI 1990 basis)
31
(CPI -1990 basis).

Robinson Cu-Au Royalties
2008Actual
2009 Actual
2010 Forecast
Au Revenue ($000) $2,868 $1,946Cu Revenue ($000) $10 534 $512Cu Revenue ($000) $10,534 $512Production (K oz Au) (1) 137.6 99.0 80P&P Reserves (K oz Au) 905 704M&I Resources (K oz Au) (2) 1,901 1,993
Production (Mlbs Cu) 159.7 122.5 135( )P&P Reserves (K t Cu) 728 546M&I Resources (K t Cu) (2) 2,082 1,974% Oz Prod. (FNV royalty) 100% 100% 100%
(1) 2010 production forecast based on Quadra guidance.(2) Resources & reserves from Quadra website. M&I are inclusive of P&P but do not include
stockpiles. M&I are at a 0.3% Cu Cutoff.
32
David Schumacher photo

Marigold
Marigold Royalties:
• A variety of royalties exist on different sections of the property, including; a 1.75% sect o s o t e p ope ty, c ud g; a 5%NSR, 5% NSR, 0.5%-1.5% GR & a 2.5%-4% GR
• FNV increased royalty exposure via a $20M acquisition in November 2009
• JV: 66.6% Goldcorp, 33.3% Barrick • Multiple open pits operated by Goldcorp in
Nevada• Recent exploration in the Red Dot area
resulted in a 730,000 ounce reserve addition
2008 actual
2009 actual
2010 forecast
Revenue ($000) $6,111 $7,263P d ti (A ‘000 ) 144 3 146 9 145Production (Au ‘000 oz) 144.3 146.9 145
est(1)
P&P Reserve (K oz)(2) 1,530 2,410M&I Resources (K oz) (2) 756 660Inferred (K oz) (2) 690 1,169
33
(1) Marigold has not given guidance for 2010, FNV estimate –only based on ‘08 & ‘09 production levels(2) Production and Reserves - Resources are reported on a 100% basis & include ounces which may not be subject to
FNV’s royalty
% Oz Prod. (FNV royalty) 88% 100% 80-85%

Bald MountainBald Mountain Royalties:
• Located in Nevada & operated by Barrick
• Royalties cover only a portion ofRoyalties cover only a portion of the eastern side of the Bald Mountain mine
• 4% NSR on most of the resources & 2.418% NSR on an area f l k Littl B ld Mtformerly known as Little Bald Mtn
• Exploration success resulted in a P&P reserve increase of 57% in 2009
2008 2009 2010 actual actual forecast
Revenue ($000) $2,546 $2,056
Production (Au ‘000 oz) 105 75 75-100 est(1)
P&P Reserve (K oz) (2) 2,846 4,489M&I Resources (K oz) (2) 1,718 1,178Inferred (K oz) (2) 1,525 468% Oz Prod. (FNV royalty) (3) 70% 73% ≈45%
(1) Barrick has not provided guidance for 2010 – FNV forecast is estimate-only based on
34
p g yproduction from 2008-9
(2) Production and Reserves - Resources are reported on a 100% basis & include ounces not subject to FNV’s royalty
(3) Historic % production from FNV lands are back calculated based on average gold price in 2008-2009, 2010 forecast is based on 2003-2007 average % of production off FNV lands
Royalty Lands Only

Other Operating Assets
Asset Operator/ LocationReserves(1)
(‘000 oz)
2009 Production
(‘000 oz)
2009 Royalty
Revenue(‘000 $US)
Estimated 2010Prod. Subject to FNV Royalty (%)
2010 Operator Forecast(2)
(‘000 oz)
Hollister(3)
(3-5% NSR)Great Basin/ Nevada 1,122 44.7 $1,555 100% 135
Holloway/Hislop (4)
(6% & 4% NSR)
St Andrew/ Ontario 119/142 18.8 $1,068 100% 85
(6% & 4% NSR)
Mesquite(0.5-2% NSR)
New Gold/ California 3,137 150 $2,832 100% 145-155
Cerro San Pedro(3)
New Gold/ Mexico 1,408 95.5 $2,245 100% 95-100(Au) 1,400-1,600(Ag)Pedro
(1.95% GR)1,400 1,600(Ag)
Mt Muro7% NSR of 90% (>$410/oz)
Straits Resources/ Indonesia
210 37.4 (Au)208,000 (Ag)
$2,201 60-70% 48
North Lanut5% NSR on 80% of production
Avocet/ Indonesia
216 46.9 $1,760 100% 48
Mt. Keith (0.25% NPI &
BHP/Australia
$720 100% 35-40 Kt Ni
35
(0.375% GR)
(1) Reserves reported by operator for 100% of property & may include ounces not subject to FNV’s royalty(2) 2010 guidance disclosed by operator for 100% of production from the property – Note: Mt Muro production forecast based on June 2010 year end & North Lanut forecast
based on company guidance of 4,000 ounces of production per month, annualized(3) Hollister assumes AuEq ounces, Cerro San Pedro includes gold only ounces except where noted(4) 2010 forecast includes some production from Hislop

Oil and Gas
Geoff Waterman – Chief Operating OfficerGeoff Waterman Chief Operating Officer
36

Oil and Gas
Over 100 royalty and/or working interests in oil and natural gas propertiesproperties
~72% of oil & gas Royalty Revenue(1) from Edson, WeyburnUnit and Midale UnitU t a d da e U t
Long-life proved plus probable reserves (“2P”) of 6.6 mmboe for the above properties and 8.6 mmboe for p pall producing properties
37(1) Royalty Revenue is defined by the Company as cash received or receivable from operating royalty assets earned during the period.

Reserves
8 589
2P (mboe)942 mboe added during period (867 mboe at no $$)
8,350 8,589Net reserve additions 239 mboe
11 4 year reserve life index11.4 year reserve life index
2009 GLJ Reserve report available on web site
942
-703
2008 Production Additions 2009
38

2P Oil and Gas Reserves and RLI (years)
12.0
9 000
10,000
8.0
10.0
6 000
7,000
8,000
9,000
ex in
yea
rs)
4 0
6.0
4,000
5,000
6,000
erve
Life
Inde
(mbo
e)
2.0
4.0
1,000
2,000
3,000
RLI
(Res
e
--12/31/2007 12/31/2008 12/31/2009
Oil (mboe) Gas (mboe) RLI
39
Reserve replacement without exploration costs

Reserves
2P by Area
NG
2P by Commodity (mboe)
Edson25%
Other23%
Oil
NGL6%
Weyburn40%
Midale12%
62%Gas32% 2P Reserves (mboe)
ORR
WI36%
ORR64%
40

Production History (mboe)(Actual & Forecast)(Actual & Forecast)
900Actual & GLJ Forecast
808
703 750
663 700
800
900
591
500
600 tio
n
reca
st
orec
ast
reca
st
tion
200
300
400
Act
ual
Prod
uct
2009
Fo
2009
Fo
2009
Fo
Act
ual
Prod
uct
-
100
200
41
2008 2009 2010E 2011E 2012E
Ad d Mi l A tAdvanced Mineral Assets
Paul Brink – S.V.P. Business Developmentp
42

SubikaSubika Royalty:
• 2% NSR on a portion of Ahafo South• Beginning after 1.2Moz are produced
f th lt t (887 000 ffrom the royalty property (887,000 oz of production to the end of 2009)
• Covers ~78 km2 and all or portions of 3 of the 4 pits at Ahafo South
• Announced in late 2009 for $58 million• Announced in late 2009 for $58 million• Operated by Newmont in Ghana
Recent Developments:
Project Details
• Newmont exploring Subika Expansion project through deepening of pit and possible new UG mine
• Potential to develop 7-9 million oz, i l di t t S bik
Expected Royalty Start-up(1) 2012Production Subject to Royalty(2) ~50%P&P Reserves (K oz) (3) 9,380M&I Resources (K oz)(3) 7,600A l P d ti ( ) (3) 500 550 k
including current reserves, at Subika(most if not all on FNV ground)
• $40-$60 million in exploration budget for 2010
• In 2010 Q 1 conference call Newmont
43
Annual Production (K oz) (3) 500-550 koz • In 2010 Q-1 conference call, Newmont reports continued drill success at Subika
(1) Start-up based on management estimate of 1.2Moz threshold having been reached.(2) Historically ~ 50% or production has come from royalty ground.(3) Production and Reserves - Resources are reported on a 100% basis & include ounces not subject
to FNV’s royalty

TasiastTasiast Royalty:
• 2% NSR
• Beginning after 600,000 oz are produced from the property (313 502 oz of production to the end of 2009)(313,502 oz of production to the end of 2009)
• Operated by Red Back in Mauritania
Recent Developments:
• Red Back has forecasted production of 245koz – 265koz in 2010
• March 2010 announced reserve increase of 64% to 5.03 M oz
• According to company, both resources and reserves have the potential for significant expansion with new reserves expected in Q3/2010 and an expansion feasibility study in 2011
Cd $600 illi i l i h Ki i M f
Project Details
• Cdn$600 million private placement with Kinross in May for an anticipated processing and mining expansion at Tasiast.
Expected Royalty Start-up(1) 2011Production Subject to Royalty 100%P&P Reserves (K oz) (2) 5,030M&I Resources (K oz) (2) 6,510Inferred Resources (K oz) (2) 1 300
44
Inferred Resources (K oz) 1,300Annual Production (K oz) (2) >250
(1) Start-up based on management estimate of 600 koz threshold having been reached.(2) Production and Reserves - Resources are reported on a 100% basis – M&I resources include
reserves.

DetourDetour Royalty:
• 2% NSR• Full feasibility stage project owned by Detour Gold in
Recent Developments:
• Detour completed a C$275 million financing in November, 2009 toward development of the projectOntario
Project DetailsExpected Royalty Start-up(1) End of 2012Production Subject to Royalty 100%P&P Reserves (K oz) (2) 8,813
development of the project• Pre-feasibility study in September, 2009
outlined 560koz annual production at $404/oz
• Detour now expects to exceed 10 millionM&I Resources (K oz)(2) 17,263Inferred Resources (K oz) (2) 5,189Annual Production (K oz) (2) 600Expected Mine Life 14.5 yrs
Detour now expects to exceed 10 million ounces in reserves and achieve production of over 600,000 ounces of gold per year
• Permitting is underway and feasibility study is expected in mid-2010
(1) St t b d t ’ ti li & l d ti b d D t id(1) Start-up based on operator’s timeline & annual production based on Detour guidance.(2) Production and Reserves - Resources are reported on a 100% basis – M&I resources include
reserves.
45

Recent Development Project News
Property Royalty Update
Hollister 3-5% NSR Great Basin recently signed an agreement with Newmont to process 30 000 t 50 000 t f t k il d t b h d b NEM t30,000 to 50,000 tons of stockpiled to be purchased by NEM at $1,000/oz. Currently 51,000 tons are stockpiled containing 49,000 AuEq oz. Hollister also had its first gold pour at its Esmeralda Mill on April 14 and has guided 2010 production of 135,000 oz (including stockpiles).p )
Hemlo 3% NSR &50% NPI
FNV began receiving some initial revenue-based royalties in 2009 and the current operating plan projects the production of 200koz from the property between 2010-2015.
Perama Hill 2% NSR Eldorado is in the process of permitting the project and could begin construction in early 2011 if permits are received as planned. Production is expected to be 110koz per year.
$Rosemont 1.5% NSR Augusta has been focused on permitting and financing the $900 million Rosemont project and recently closed a $43 million off-take financing with Red Kite, an equity financing, and the sale of a precious metals stream to Silver Wheaton for $230 million.
Other Various Dee/Arturo Duketon Kirkland Lake Pinson Ity Falcondo
46
Other Various Dee/Arturo, Duketon, Kirkland Lake, Pinson, Ity, Falcondo

Outlook for Longer Term Gold GrowthGold only royalty revenues excluding other revenues (1)Gold only royalty revenues excluding other revenues (1)
H l $5 15
$100 5m
Palmarejo $16-19mHolloway-Hislop 4-5m
Tasiast $10-11mHolt 3-4mMarigold 1-4mDuketon 2-3m
Hemlo $5-15mDetour 12-13mAhafo 6-11mRosemont 1-2mGoldfields 1-2mPerama Hill 2-3m
$70.7m
$100.5m y pHollister 3-5mOther 1-2m
Ity 1m
Fully paid assets no further investment in $ or mgm’t timeFully paid assets – no further investment in $ or mgm’t time
2008A 2009A 2010/11E 2011/12E 2012/14E
~$100m in potential new gold Royalty Revenues(1) by 2014
47
$100m in potential new gold Royalty Revenues by 2014
(1) Royalty Revenue is defined by the Company as cash received or receivable from operating royalty assets earned during the period. *Appendix provides detail to pro-forma estimates assuming $1100 gold.

Prosperity Gold Stream
Paul Brink – S.V.P Business Developmentau S us ess e e op e t
48

Prosperity Gold Stream Overview
Gold stream on LOM gold production from Prosperity
Overview
production from Prosperity
Long life project in Canada
Focus asset for Taseko MinesFocus asset for Taseko Mines Ltd.
Proven operator in the region p
Open pit copper/gold porphyry
Asset value is approx. 50% copper and 50% gold(1)
p
copper and 50% gold
49
(1) Revenue calculated at $1,100/oz Au and $2.50/lb Cu.

Prosperity Gold StreamTermsTerms
$350 million deposit funded pro-rata during construction with other financing for the project and 2 million FNV 2017 share warrantsg p j
Right to purchase gold equal to 22% of LOM gold in concentrate for $400/oz (inflation adjusted)
Funding contingent on:Funding contingent on:
– permitting,
– project being fully financed, and
– 75% of concentrate contracted for 5 years
Deposit funded pro-rata with other sources of capital
Completion test at 90% level
Minimum gold delivery after 27 months from first draw at 80% of plan until completion
50
Secured by a lien on the Prosperity property

Prosperity Gold StreamAsset ProfileAsset Profile
Parameter Metric
P&P Recoverable Reserves(1) 3.6 Blb Cu7.7 Moz Au
MI&I Resources 5.3 Blb Cu13.3 Moz Au
Avg. Annual Gold Production First five years (2)
Life-of-mine294 koz Au, 122Mlb Cu247 koz Au 108Mlb CuLife-of-mine 247 koz Au, 108Mlb Cu
Cash costs net of byproducts(3)
First five years (2)
Life-of-mine$0.28/lb$0.59/lb
(1) The mineral resources and reserve estimates set forth above have been taken from the technical report entitled "Technical Report on the 344 Million Tonne Increase in Mineral Reserves at the Prosperity Gold-Copper Project, British Columbia, Canada" dated December 17, 2009 filed (with an effective date of November 2, 2009) by Taseko on SEDAR
51
and completed by Taseko staff under the supervision of Scott Jones, P. Eng., Vice-President, Engineering of Taseko and a qualified person under National Instrument 43-101. The technical report contains detailed information with respect to resource and reserve quantities and grades; key assumptions, parameters and methods used in preparing the resource and reserve estimates; and the extent to which the resources and reserves may be materially affected by any known environmental, permitting, legal, title, taxation, socio-political, marketing or other relevant issues. Mr. Jones has reviewed and approved the information set forth above.
(2) First year is half year(3) $1.65/lb Cu and $650/oz Au, C$/US$ of $0.82 as per Taseko January 2010 Presentation.

Prosperity Gold StreamDevelopment StatusDevelopment Status
BC environmental assessment certificate issued January 2010
Federal environmental assessment process expected to be complete – Q3 2010*
Following permitting, expect two and a half years of construction and commissioning
52
commissioning
* Taseko May 12th, 2010 Press Release

Prosperity Gold StreamProduction ProfileProduction Profile
180200350
120140160180
200
250
300
C
406080100
50
100
150
old
(Koz
)C
opper (Mlb)
020
0
50
1 3 5 7 9 11 13 15 17 19 21 23 25 27 29 31 33
Go
Long mine life
Au in Conc. Production Profile (Koz) FNV Gold Stream (Koz) Cu in Conc. Production Profile (Mlb)
53
Long mine lifeSource: Based on Mine Production Profile in Taseko Technical Report dated November 2, 2009. Current environmental approval applications are for a mine plan with a 20 year mine life.

Prosperity Gold StreamA t Q litAsset Quality
1st 5 Yrs$0 28/lb
LOM$0.59/lb
$0.28/lb
Low total operating costs net of byproducts
54
(1) First year of the five years is a half year(2) By-product cost calculated assuming $1.65/lb Cu and $650/oz Au, C$/US$ of $0.82(3) Costs are shown before impact of gold stream. Stream at 22% adds ~ $0.24/lb at $650/oz Au for the first five years.
Source: Taseko Technical Report dated November 2, 2009, Taseko January 2010 Presentation

Prosperity Gold StreamContribution Analysis
95%
100%
Contribution Analysis
11.1%15.8% 17.6%
14.1%
85%
90%
95%
utio
n (%
)
88.9%84 2% 85.9%
75%
80%
ativ
e C
ontr
ibu
ProsperityFNV
84.2% 82.4%85.9%
60%
65%
70%Rel
a
60%EV 2014 Revenue 2014 CF NAV
Prosperity contribution is highly accretive
55
Note: Revenue and CF for estimates for FNV for 2014 are assumed to be the same as the BMO research revenue and CF estimate for 2013 at $925/oz Au. Revenue and CF for Prosperity are based on $925/oz for 2014 (first full year of payments). EV is based on May 6, 2010 closing price for FNV. NPV estimate for FNV and Prosperity is based on analyst consensus estimates. The long term average consensus price used for gold is $860/oz.

Prosperity Gold StreamPotential UpsidePotential Upside
Gold resource of 13.3Moz* is approx 20% larger thanapprox. 20% larger than current reserve
Change in mill configuration may increase throughput currently planned >70,000 tpd
Exploration potential on the p p85km2 concession
56
* See Taseko Technical Report dated November 2, 2009 for Assumptions

Strengthening the Leading Gold Royalty Portfolio
PRO-FORMA NAV BREAKDOWN
Prosperity18%
Oil & Gas16%
Base Metals8%
Palmarejo14%
Other Gold20%
Goldstrike12%
Stillwater6%
Gold Quarry6%
A key long-life addition to the portfolio
57
Source: Broker research at analyst consensus prices. Includes NAV of mining assets only, cash is not reflected. Prosperity NAV calculated using long term average consensus price for gold of $860/oz

Increasing Precious Metals Exposure
2010E Revenue 2014E Revenue
Oil & Gas
Base Metal5% Oil &
Gas
Base Metal2%
Oil & Gas18% 10%
Precious Metal80%
Precious Metal85%
Pro-forma revenue 85% precious metals
58
Estimates using current prices of $1,100/oz Au, $78/bbl oil, $4.00/mcf gas, $1,650/oz Pt & $500/oz Pd . 2014 revenue estimate includes Prosperity.

Geopolitical Stability
2010E Revenue 2014E Revenue
Australia3%
Other4% Australia
3% Other10%
Canada21%
Mexico21%
Canada38%Mexico
15%
10%
US US
Prosperity increases revenue from Canada
51% 34%
59
Franco-Nevada estimates using current prices of $1,100/oz Au, $78/bbl oil, $4.00/mcf gas, $1,650/oz Pt & $500/oz Pd. 2014 revenue estimate includes Prosperity.
y

Substantial Long Term Gold GrowthGold only royalty revenues excluding other revenues (1)Gold only royalty revenues excluding other revenues (1)
Prosperity $44-48m
Hemlo $5-15mD t 12 13
$100.5m Palmarejo $16-19mHolloway-Hislop 4-5mHollister 3-5mOther 1 2m
Tasiast $10-11mHolt 3-4mMarigold 1-4mDuketon 2-3mIty 1m
Detour 12-13mAhafo 6-11mRosemont 1-2mGoldfields 1-2mPerama Hill 2-3m
$70.7m Other 1-2m
2008A 2009A 2010/11E 2011/12E 2012/14E
$ (1)
60
~$150m in potential new gold Royalty Revenues(1) by 2014(1) Royalty Revenue is defined by the Company as cash received or receivable from operating royalty assets earned during the period. Appendix provides detail to pro-forma
estimates assuming $1,100/oz gold.
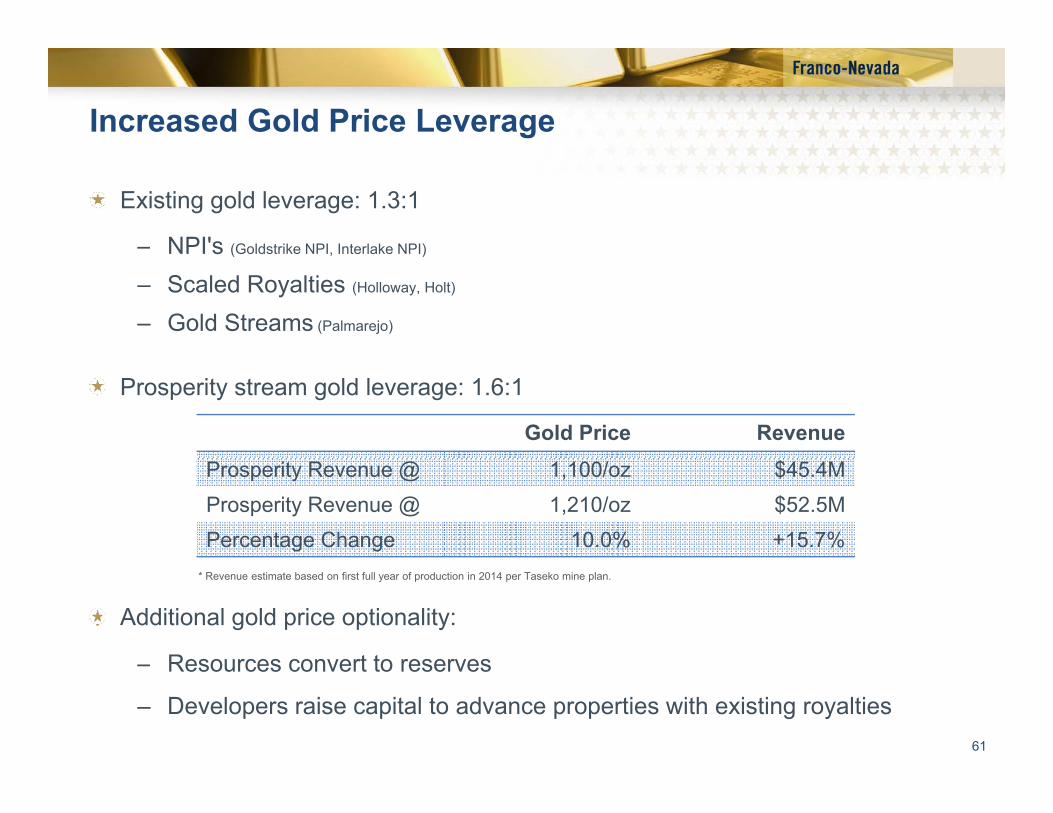
Increased Gold Price Leverage
Existing gold leverage: 1.3:1
– NPI's (Goldstrike NPI, Interlake NPI)NPI s (Goldstrike NPI, Interlake NPI)
– Scaled Royalties (Holloway, Holt)
– Gold Streams (Palmarejo)
Prosperity stream gold leverage: 1.6:1
Gold Price RevenueProsperity Revenue @ 1,100/oz $45.4MProsperity Revenue @ 1,210/oz $52.5MPercentage Change 10.0% +15.7%
Additional gold price optionality:
Resources convert to reserves
* Revenue estimate based on first full year of production in 2014 per Taseko mine plan.
61
– Resources convert to reserves
– Developers raise capital to advance properties with existing royalties

Current Capital Resources Untouched
Franco-Nevada expects to generate sufficient funds from operations to fund its commitment without using current capital resourcesto fund its commitment without using current capital resources
Capital Resources @ March 31, 2010 US$ Millions
Working Capital $598
Marketable Investments (Primarily NEM) $52
A ailable Credit Facilit $175Available Credit Facility $175
Total Available Capital $825
>$800 million remains available for other transactionsPortfolio continues to generate strong free cash flow
62

Summary
Accretive acquisition on all metrics
Long life asset in Canada with proven operator and exploration upside
fFNV funds only as project is de-risked
22% of 13.3 million ounces* of gold
63
* See Taseko Technical Report dated November 2, 2009 for Assumptions

Summary
David Harquail – CEOa d a qua C O
64

Franco-Nevada’s two year performance
Dec. 2007 IPO of new Franco-Nevada for $1.26B (C$15.20/sh.)
In two years Franco-Nevada has delivered:In two years, Franco-Nevada has delivered:
– $250M of Free Cash Flow(1)
– 80% share price increase – $50M in dividends– 300 royalty interests– $600M in liquidity FNV vs S&P/TSX since IPO FNV S&P
– $3B in market cap
150%
200%
250%FNV vs S&P/TSX since IPO FNV S&P
50%
100%
65
0%
(1) Free Cash Flow is defined by the Company as operating income plus depletion and depreciation, non-cash charges, and any impairment of investments and royalty interests.

Dividends paid to date
C$/sh US$ millions
June 2008 $0.12$21.8m
Dec 2008 $0 12Dec. 2008 $0.12
June 2009 $0.14$28 2m$28.2m
Dec. 2009 $0.14
$50 million in dividends paid to date
66

Indicated Dividends for 2010**
Final semi-annual dividend to be paid in June followed by start of monthly dividends in Julymonthly dividends in July
C$/share US$
June 2010 $0.150$July $0.025
August $0.025September $0.025October $0.025November $0.025December $0 025December $0.025
$0.30 $34 million*
Three years of growing annual dividends
67
** September to December dividends subject to board declaration* Based on C$=$US and 114m shares outstanding.
Three years of growing annual dividends

Franco-Nevada’s Advantages
Royalty Business Model
rike
Established Diversified Portfolio
89% Cash Flow Margins
Gol
dstr
% g
Most Available Capital
No Debt or Hedges ldQ
uarr
y
No Debt or Hedges
Strong Organic Growth Profile
$30M f A l I di t d Di id d oG
o
>$30M of Annual Indicated Dividends
Track Record of Value Accretion Palm
arej
o
68

Thank You
Bald Mountain ‐ BarrickGoldstrike ‐ Barrick East Boulder ‐ StillwaterWeyburn ‐ Cenovus
Cerro San Pedro ‐ New Gold Mesquite – New GoldPalmarejo ‐ Coeur
Marigold ‐ Goldcorp
Robinson ‐ Quadra Tasiast ‐ Red BackMarigold ‐ Goldcorp
69

Appendices
70

Appendix - Table of Contents
Accounting Definitions for FCF & Adjusted Net Income
Derivative Accounting for PalmarejoDerivative Accounting for Palmarejo
Book Values
Income Taxes
– Tax Depletion and Tax Balances
– Applicable Statutory Tax Rates
C t d E & I t t ECosts and Expenses & Interest Expense
Capital Structure
Liquidity & Capital Resourcesq y p
Security of Investments
Gold Growth Profile - Asset Details
71
Oil & Gas Assets

Appendix - Free Cash Flow
Free Cash Flow is defined by the Company as operating income plus depletion and depreciation non cash chargesincome plus depletion and depreciation, non-cash charges, and any impairment of investments and royalty interests.
Q1 2010 Q1 2009
(millions) (millions)
Operating income $11 7 $4 7Operating income $11.7 $4.7
Depletion and depreciation 20.2 23.0
Stock-based compensation expense 1.1 0.9Loss/gain in fair value of royalties accounted for as derivative assets 4.1 (3.7)
Free Cash Flow $37.1 $24.9
72

Appendix - Adjusted Net Income
Adjusted Net Income is defined by the Company as Net Income excluding; impairment charges related to royalties working interestsexcluding; impairment charges related to royalties, working interests and investments; fair value changes for royalties accounted for as derivative assets; foreign currency gains/losses; gains/losses on sale of investments; and the impact of taxes on all of these items.sale of investments; and the impact of taxes on all of these items.
Q1 2010 Q1 2009
(millions) (millions)( ) ( )
Net Income $7.8 $3.8
Foreign exchange loss (gain), net of income tax 12.0 (0.8)(Gain) loss on sale of investments net of(Gain) loss on sale of investments, net of income tax (14.0) 0.2Loss (gain)in fair value of royalties accounted for as derivative assets, net of income tax 2.8 (2.7)
73
Adjusted Net Income $8.6 $0.5

Appendix - Palmarejo Gold Stream Accounting
Accounting Treatment
– Minimum Royalty (“MR”)• Fair value accounting required to be used;• MR will be marked to fair value at each balance sheet date;;• Adjustments in fair value recognized in income as a separate
income statement caption;• Separate depletion charge not recorded as inherent in fair value
calculation.
– Non-MR Portion • Standard royalty accounting appliesStandard royalty accounting applies
Contingent consideration– Special warrants exercisable, for no additional consideration, into
74
316,436 FNV shares when project meets certain time-based completion tests

Appendix - Palmarejo Gold Stream Accounting
Fair Value of Palmarejo MR is sensitive to changes in key assumptions (discount rate, gold prices, project parameters);
Generates significant non-cash variations to total revenue and earnings, which will be recognized quarter by quarter.
$30
$40
$50
)
Palmarejo Royalty Revenue Versus Total Revenue
$0
$10
$20
$30
Millions (SU$
Royalty Revenue
Fair Value
Total Revenue
-$10
$0
Q1 2009 Q2 2009 Q3 2009 Q4 2009 Q1 2010
75
Further reinforces our belief that Royalty Revenue & Free Cash Flow are the most effective metrics to measure our business

Appendix - Net Book ValuesAt December 31 2009At December 31, 2009
ProducingExploration
& DevelopmentGold
Barrick Goldstrike 183$ $ - Barrick Goldstrike 183$ $Bald Mountain 17 - Gold Quarry 94 - Palmarejo 135 - Marigold 24 - Other 78 125Other 78 125
531$ 125$ PGMsStillwater $ 210 $ - Pandora 19
$ 229 $ $ 229 $ - Other MineralsRobinson $ 9 - Falcondo 29 - Other 6 29
$ 44 $ 29 $ 44 $ 29 Oil and GasEdson $ 125 $ - Weyburn 58 - Midale 17 -
76
Other 68 123 $ 268 $ 123
TOTAL $ 1,072 $ 277 $ 1,349
Note, figures are in millions of dollars.
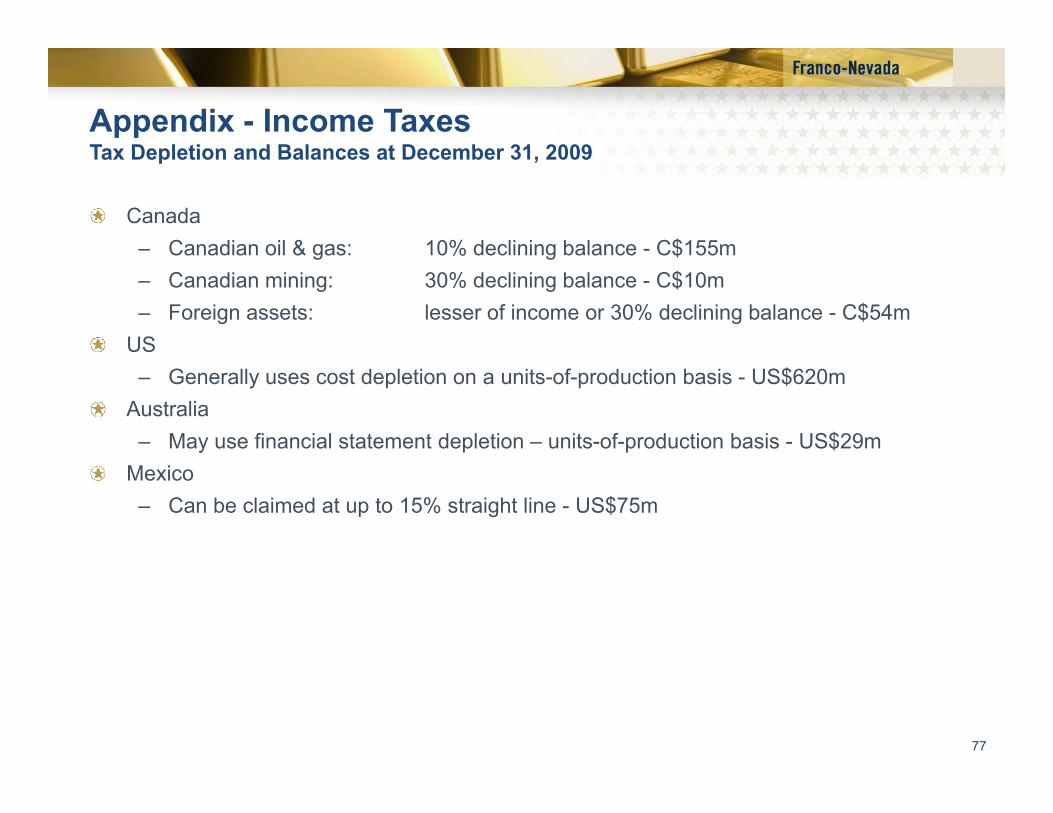
Appendix - Income TaxesTax Depletion and Balances at December 31 2009Tax Depletion and Balances at December 31, 2009
Canada– Canadian oil & gas: 10% declining balance - C$155mCanadian oil & gas: 10% declining balance C$155m– Canadian mining: 30% declining balance - C$10m– Foreign assets: lesser of income or 30% declining balance - C$54m
US– Generally uses cost depletion on a units-of-production basis - US$620m
Australia– May use financial statement depletion – units-of-production basis - US$29m
Mexico– Can be claimed at up to 15% straight line - US$75m
77

Appendix - Income TaxesApplicable Statutory Tax Rates (At March 31 2010)Applicable Statutory Tax Rates (At March 31, 2010)
Canadian combined(1) income tax rates declining
– 2010 – 28.34%
– 2011 – 26.29%
2012 24 %– 2012 – 24.57%
– 2013 – 24.24%
US combined(1) income tax rate is 37 12%(2)US combined( ) income tax rate is 37.12%( )
Australian income tax rate is 30%
Mexican income tax rate in 2010 is 30%Mexican income tax rate in 2010 is 30%
78
(1) Combined is federal plus provincial or state tax. (2) Effective rate after deduction for state tax in federal tax calculation

Appendix - Costs and Expenses
Total $6.6 million (For the year ended December 31, 2009)
Nevada Net Proceeds Taxes 52%Oil & Gas Production Taxes 22%Oil & Gas Operating Costs on WI 17%
Expense components
Oil & Gas Operating Costs on WI 17%Montana Net Proceeds Taxes 9%
pe se co po e ts
– Standby fee for Credit Facility ~ $250,000 per quarter @ current leverage ratio
– Amortization of credit facility expenses – Total cost of $2.1 million being amortized over 3 years on a straight-line basis
– Capital tax eliminated in July 2010 (2009 - $1.1 million)
79
p y ( )

Appendix - Liquidity & Capital Resources
Full Credit facility of $175 million available Total Liquidity of $621.5 million at March 31, 2010
Current cost of advances
– – BMO Prime Rate plus 0.125%
,
– – BMO Base Rate plus 0.125%
Subject to 0.5625% standby fee on
Short-term investments
28%
Cash and cashj y
undrawn balances ($985k/year) Available-for-sale
securities8%
cash equivalents
64%
80

Appendix - Organic Gold Growth Potential
Project Operator Royalty
Annual Incremental Royalty Potential
@ $1100 gold
Palmarejo Coeur d’Alene 50% stream $16-19m
2010
a a ejo Coeu d e e 50% st ea $ 6 9Holloway–Hislop St Andrew Gold 4-6% NSR 4-5m Hollister Great Basin Gold 3-5% NSR 3-5m Hemlo NSR Barrick Gold 3% NSR 1-2m $24-31m
2011
Tasiast Red Back Mining 2% NSR $10-11m Holt St Andrew Gold 10% NSR 3-4m Marigold Goldcorp 1.4-4% NSR 1-4m Duketon Regis Resources 2% NSR 2-3m Ity La Mancha 1-1.5% NSR 1mIty La Mancha 1 1.5% NSR 1m $17-23m
Hemlo NPI Barrick Gold 50% NPI $5-15m Detour Detour Gold 2% NSR 12-13m Ahafo Newmont 2% NSR 6-11m
2012+ Rosemont Augusta Resources 1.5% NSR 1-2m Goldfields Linear Gold 2% NSR 1-2m Perama Hill Eldorado Gold 2% NSR 2-3m $27-46m
Management ‘s projection of start of royalty
81
Management s projection of start of royalty. Applicable royalty rate at $1,100 gold for sliding scale royalties.Reflects operators’ public guidance as of December 2009.Reflects management’s projections based on available data for production and costs (where applicable).2009 was a half year of production. 2010 is increment for full year.Gold only. With copper & silver, royalty potential is $7-9m.

Appendix - Edson (Alberta)
Liquids-rich gas play 209 km. west of Edmontonof Edmonton
15% ORR over 25,920 gross acres
AECO-C spot prices less GCA i tprocessing cost
Wells drilled at no cost to Franco-Nevada
RLI: 7 years
Operator:
82

Appendix - Weyburn/Midale Units (Saskatchewan)
MidaleWeyburnUnitUnit
83

Appendix - Weyburn Unit (Saskatchewan)
Unitized oil play 129 km. southeast of Regina
Medium sour crude (28 to 31 degree API, 2% sulphur)
1.11% non-operated working interest, 0.44% royalty
C$10 t C$15/bbl diff ti l t Ed t Li ht iC$10 to C$15/bbl differential to Edmonton Light price
CO2 miscible flood started in 2000 (>15 million tonnes sequestered to date)
CO2 flood rolled out to ~60% of unit
CO2 flood and infill drilling has increased production 65%
RLI: 22 years
Operator: Cenovus Energy Inc.
84

Appendix - Midale Unit (Saskatchewan)
Unitized oil play 40 km southeast of Weyburn
( % )Medium sour crude (28 to 31 degree API, 2% sulphur)
1.59% non-operated working interest, 1.18% royalty
C$10 to C$15/bbl differential to Edmonton Light priceC$10 to C$15/bbl differential to Edmonton Light price
CO2 injection began in 2005, over 10 patterns operating, 41 patterns by 2010
CO2 injection over next 20 years to assist in recovery of an additional 45-60 mmbbl (1.2-1.5 mmbbl net to FN)
Potential to sequester ~ 8.75 million tonnes of CO2
RLI: 16 years
Operator:
85

Appendix - Exploration
Non-producing land– 12,000 net acres of unproved non
producing land under lease
– Interests in 184 non producing agreements which include ~100,000 gross acres of undeveloped mineral title,gross acres of undeveloped mineral title, available for farm out
Arctic Gas– Discovered by Panarctic Oils between
1969 and 1986
– > 130 wells drilled at cost of ~C$254 millionWI between 3% and 15%– WI between 3% and 15%
– Contingent recoverable resource of 428 bcf (net)
– Economic models based on production
86
of 1 bcf/d over 20 years

Franco-Nevada CorporationCapital Structure(2)
Shares Outstanding 114.02m
Warrants @ C$32/sh March 2012 5.75m
Analyst Coverage
BMO Capital Markets David Haughton
BOA/Merrill Lynch Mike Jalonen
Warrants @ C$75/sh June 2017 5.75m
Options (Avg C$16.00/sh) 2.43m
Other 0.43m
128 38m
CIBC Capital Markets Cosmos Chiu
GMP Securities Craig West
National Bank Financial Tanya Jakusconek128.38m
Share Price Range(1) C$32.12-C$23.10
Market Capitalization(2) $3.3B
Working Capital + Marketable (3) $650 3m
Paradigm Capital Don MacLean
RBC Capital Markets Stephen Walker
UBS Securities Brian MacArthur
Wellington West Paolo LostrittoInvestments(3) $650.3m
Available Credit Facilities $175m
Debt or Hedges Nil
2010 Dividends (Indicative) (4) $34.21m
Wellington West Paolo Lostritto
Major ShareholdersFidelity US
I T i k C d2010 Dividends (Indicative) $34.21m (C$0.30/share)
Management Ownership (3) 5.0%(6.3% diluted)
Invesco Trimark Canada
T. Rowe Price US
Blackrock Europe
Oppenheimer US
87
(1) Previous 52 weeks(2) As at April 30, 2010(3) As at March 31, 2010 (4) @ $CAN/$US = 1.00