Embed Size (px)
Citation preview

This is an Accepted Manuscript, which has been through the Royal Society of Chemistry peer review process and has been accepted for publication.
Accepted Manuscripts are published online shortly after acceptance, before technical editing, formatting and proof reading. Using this free service, authors can make their results available to the community, in citable form, before we publish the edited article. We will replace this Accepted Manuscript with the edited and formatted Advance Article as soon as it is available.
You can find more information about Accepted Manuscripts in the Information for Authors.
Please note that technical editing may introduce minor changes to the text and/or graphics, which may alter content. The journal’s standard Terms & Conditions and the Ethical guidelines still apply. In no event shall the Royal Society of Chemistry be held responsible for any errors or omissions in this Accepted Manuscript or any consequences arising from the use of any information it contains.
Accepted Manuscript
Analyst
www.rsc.org/analyst
1
Fine Structural Features of Nanoscale Zero-Valent Iron
Characterized by
Spherical Aberration Corrected Scanning Transmission Electron
Microscopy (Cs-STEM)
Airong Liu and Wei-xian Zhang1
State Key Laboratory for Pollution Control and Resource Reuse
School of Environmental Science and Engineering
Tongji University
Shanghai, China 200092
Abstract
An angstrom-resolution physical model of nanoscale zero-valent iron
(nZVI) is generated with a combination of spherical aberration corrected
scanning transmission electron microscopy (Cs-STEM), selected area electron
diffraction (SAED), energy-dispersive X-ray spectroscopy (EDS) and electron
energy-loss spectroscopy (EELS) on the Fe L-edge. Bright-field (BF),
high-angle annular dark-field (HAADF) and secondary electron (SE) imaging of
nZVI acquired by a Hitachi HD-2700 STEM present near atomic resolution
images and detailed morphological and structural information of nZVI. The
STEM-EDS technique confirms that the fresh nZVI comprises of a metallic iron
core encapsulated with a thin layer of iron oxides or oxyhydroxides. SAED
patterns of the Fe core suggest the polycrystalline structure in the metallic core
and amorphous nature of the oxide layer. Furthermore, Fe L-edge of EELS
shows varied structural features from the innermost Fe core to the outer oxide
shell. Particularly, a qualitative analysis of the Fe L2,3 edge fine structures
reveals that the shell of nZVI consists of a mixed Fe (II)/Fe (III) phase close to
the Fe (0) interface and a predominantly Fe (III) at the outer surface of nZVI.
1 To whom all correspondence should be addressed. Tel: +86-21-6598-2684; Fax:
+86-21-6598-3689
E-mail address: [email protected] (Wei-xian Zhang)
Page 1 of 24 Analyst
123456789101112131415161718192021222324252627282930313233343536373839404142434445464748495051525354555657585960
Ana
lyst
Acc
epte
dM
anus
crip
t
2
1 Introduction
Nanoscale zero-valent iron (nZVI) is a multifunctional nanomaterial for
treatment of a growing number of toxic and hazardous substances, including
both organic (e.g., halogenated hydrocarbons ) 1-5 and inorganic (e.g., nitrate,
chromate, perchlorate, metal ions) contaminants in the environment.[6-11]
Favorable chemical and physical factors of nZVI contribute to its increasing
environmental applications. nZVI has a core-shell structure with a metallic core
surrounded by an iron oxide/hydroxide shell.12-17 The core-shell structure with
two nano-constituents bestows multifaceted chemical properties for
contaminant removal and transformation: the metallic iron serves as an
electron source and exerts a reducing character, while the oxide shell
facilitates sorption of contaminants via electrostatic interactions and surface
complexation, and at the same time, permits efficient electron passage from
the metal core to the surface. The defective and disordered nature of the oxide
shell renders it potentially more reactive than a plain passive oxide layer on top
of bulk iron materials.17 Current understandings on the structure of nZVI are
based on a combination of spectroscopic and diffractometric methods whose
spatial resolution is larger than the key features of core-shell nanoparticles.14-19
For study of chemical reactions in solid materials, STEM provides
enhanced capability on direct physical imaging and chemical identification at
atomic resolution.20-23 The spherical aberration corrector allows a larger probe
current to be focused in a very fine probe, making atomic resolution
spectroscopy possible. Bright field (BF) STEM imaging mode allows structure
Page 2 of 24Analyst
123456789101112131415161718192021222324252627282930313233343536373839404142434445464748495051525354555657585960
Ana
lyst
Acc
epte
dM
anus
crip
t
3
imaging on the basis of phase contrast similar to a typical transmission
electron microscopy imaging. High-angle annular dark-field (HAADF) STEM
imaging, which uses high-angle elastic (or phonon) scattering, enables
high-spatial-resolution (0.14 nm) imaging. By integrating energy-dispersive
X-ray spectroscopy (EDS) with the Cs-STEM techniques, 24-26 direct
visualization of nanoscale structural and compositional evolution at atomic
scale can be achieved at the same time. Furthermore, elemental and chemical
bonding information can be obtained from electron energy-loss spectroscopy
(EELS) on both O K-edge and Fe L-edge. For example, EELS can probe atom
bonding environments, and thus provides valuable information regarding the
elemental valences of the particle.
Objective of work is to obtain STEM imaging with detailed physical and
chemical information of nZVI at atomic resolution. The state-of-the-art
Cs-STEM is applied to obtain direct evidence on the core-shell structure of
nZVI and elemental distributions of nZVI. High spatial resolution images are
then applied to construct a high-resolution model of fresh nZVI and interpret
chemical reaction mechanisms in nZVI.
2 Experimental Section
2.1 Preparation of Nanoscale Zero-Valent Iron
Procedures used in the preparation of iron nanoparticles have been
published previously.27,28 The procedures are based on chemical reduction
and precipitation of ferric ion with sodium borohydride in water. The
Page 3 of 24 Analyst
123456789101112131415161718192021222324252627282930313233343536373839404142434445464748495051525354555657585960
Ana
lyst
Acc
epte
dM
anus
crip
t
4
nanoparticle aggregates are collected by vacuum filtration and refrigerated in a
sealed polyethylene container at 4°C under 95% ethanol until use. The
residual water content of the nanoparticles as used typically varies between 40
and 50%. Average size of the synthesized nZVI is 60 nm with BET surface
approximately at 30 m2/g.
2.2 Electron Microscopy Analysis
Samples for the STEM analysis is prepared by allowing a drop of a dilute
ethanol suspension of the nanoparticles to dry on a lacey-carbon film
supported on a 300-mesh copper STEM grid. A Hitachi HD-2700 STEM
operated at 200 kV is used. A schematic of Hitachi HD-2700 STEM is provided
in supporting information (Fig. S1). The Hitachi HD-2700 allows simultaneous
acquisition of bright-field (BF), high-angle annular dark-field (HAADF),
secondary electron (SE) imaging, as well as electron diffraction.
3 Results and Discussion
3.1 Structural Features Derived from STEM Imaging
3.1.1 STEM Imaging
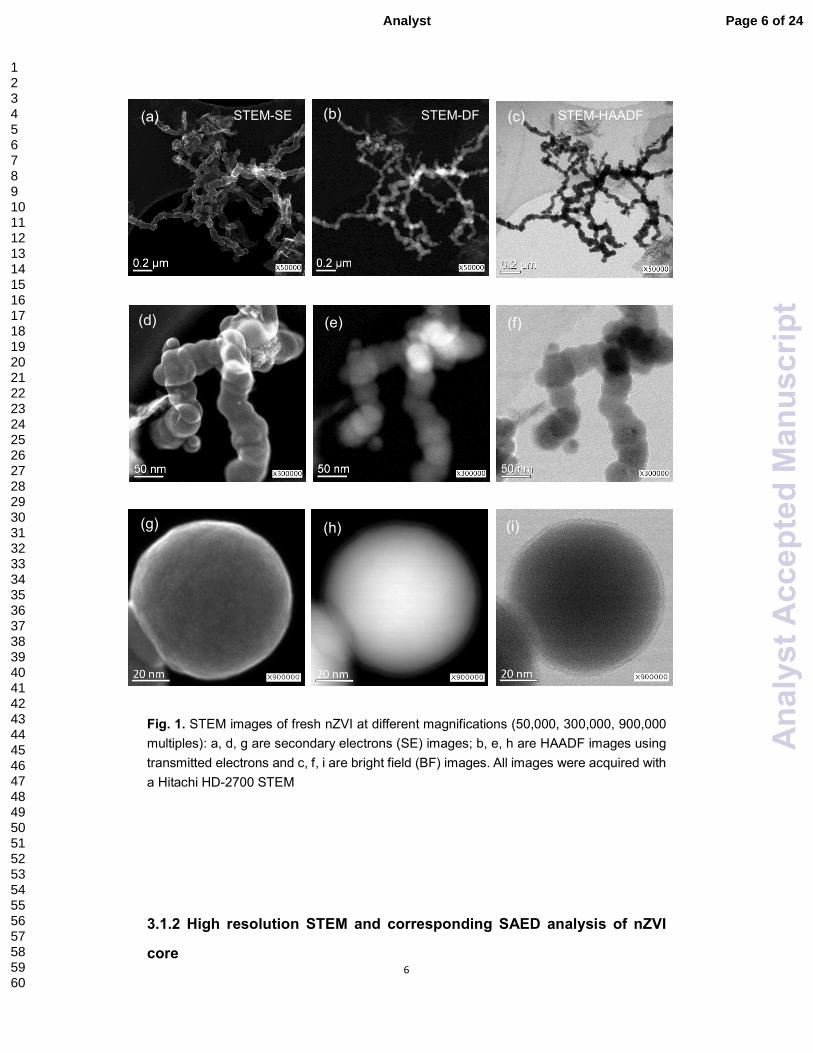
Low magnification STEM images (Fig. 1a, b, c at 50,000X) show
morphology and degree of nZVI aggregation through SE, BF and HADDF
imaging. The nanoparticles are mostly spherical in shape with majority in the
size range of 50-100 nm and present as chain-like aggregates. The connected
Page 4 of 24Analyst
123456789101112131415161718192021222324252627282930313233343536373839404142434445464748495051525354555657585960
Ana
lyst
Acc
epte
dM
anus
crip
t
5
nanoparticles have a continuous oxide shell, but the metallic cores are
separated from each other by a thin (~1 nm) interfacial iron oxide layer.
The SE images (Fig.1a, d, g) offer near three-dimensional characteristics
of the nZVI particles. The images constructed from secondary electron
diffraction clearly give rich depth information about the particle surface. Figure
1b, e, h show a series of HAADF images of nZVI. HAADF images are often
described as the Z-contrast (atomic number) imaging since the measured
intensity is approximately proportional to the square of the atomic number. The
STEM-HAADF imaging mode is a high-resolution technique that generates
readily interpretable images of nanoscale structures,29 that is, regions of the
specimen with greater atomic number appear brighter in the image. For
example, the particles in Figure1 b, e, h consist of a bright core, corresponding
to the metallic iron. The outer layer composed of oxygen and iron is darker
than the core area.
According to the BF images (Fig.1c, f, i), the surface layer has a thickness
of 2-3 nm and is more transparent than the core region. The BF imaging mode,
complementary to HAADF allows observations of inherent structures on the
basis of phase contrast similar to typical TEM imaging. It is clearly shown in
the image (Fig. 1i, at 900,000 multiples) that a single particle comprises of a
dense core surrounded by a thin shell exhibiting markedly less contrast than
the core area.
Page 5 of 24 Analyst
123456789101112131415161718192021222324252627282930313233343536373839404142434445464748495051525354555657585960
Ana
lyst
Acc
epte
dM
anus
crip
t
6
Fig. 1. STEM images of fresh nZVI at different magnifications (50,000, 300,000, 900,000
multiples): a, d, g are secondary electrons (SE) images; b, e, h are HAADF images using
transmitted electrons and c, f, i are bright field (BF) images. All images were acquired with
a Hitachi HD-2700 STEM
3.1.2 High resolution STEM and corresponding SAED analysis of nZVI
core
(a) (b) (c)
(d) (e) (f)
(g) (h) (i)
STEM-SE STEM-DF STEM-HAADF
Page 6 of 24Analyst
123456789101112131415161718192021222324252627282930313233343536373839404142434445464748495051525354555657585960
Ana
lyst
Acc
epte
dM
anus
crip
t
7
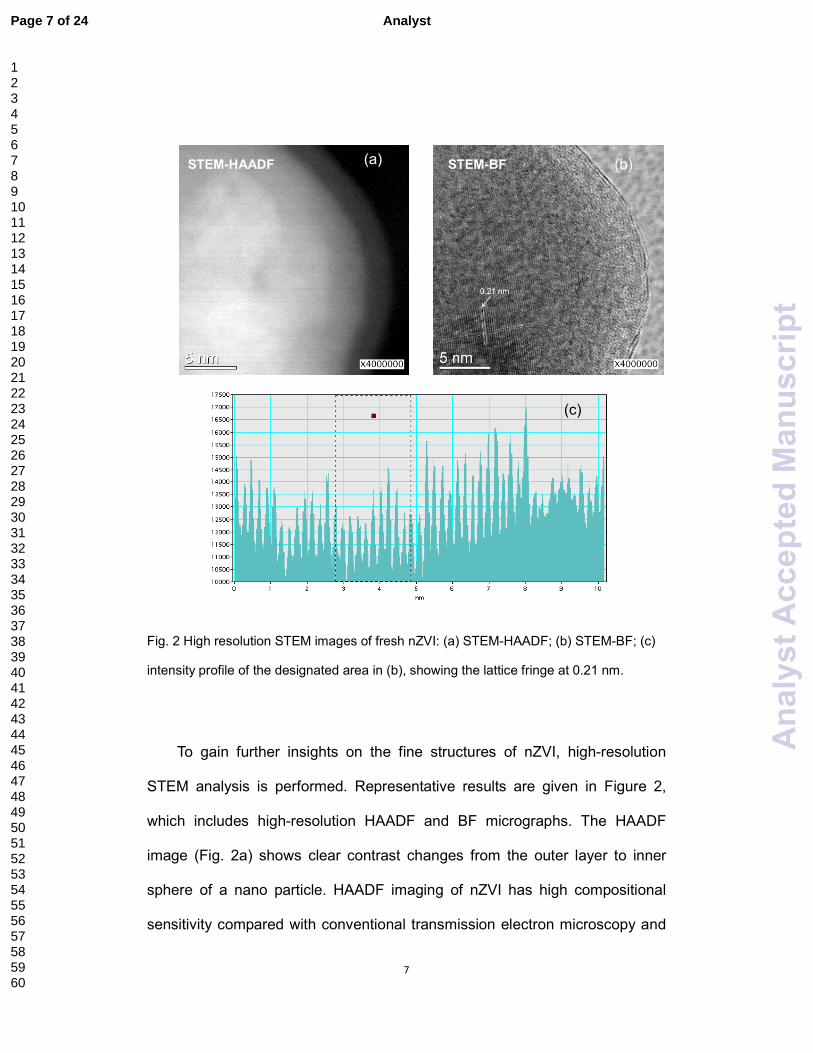
Fig. 2 High resolution STEM images of fresh nZVI: (a) STEM-HAADF; (b) STEM-BF; (c)
intensity profile of the designated area in (b), showing the lattice fringe at 0.21 nm.
To gain further insights on the fine structures of nZVI, high-resolution
STEM analysis is performed. Representative results are given in Figure 2,
which includes high-resolution HAADF and BF micrographs. The HAADF
image (Fig. 2a) shows clear contrast changes from the outer layer to inner
sphere of a nano particle. HAADF imaging of nZVI has high compositional
sensitivity compared with conventional transmission electron microscopy and
(a) (b)
(c)
STEM-HAADF STEM-BF
Page 7 of 24 Analyst
123456789101112131415161718192021222324252627282930313233343536373839404142434445464748495051525354555657585960
Ana
lyst
Acc
epte
dM
anus
crip
t
8
enables higher spatial resolution images. The larger contrast corresponds to
the high density of iron materials, whereas the lighter contrast suggests a
mixture of lighter elements (e.g., O).
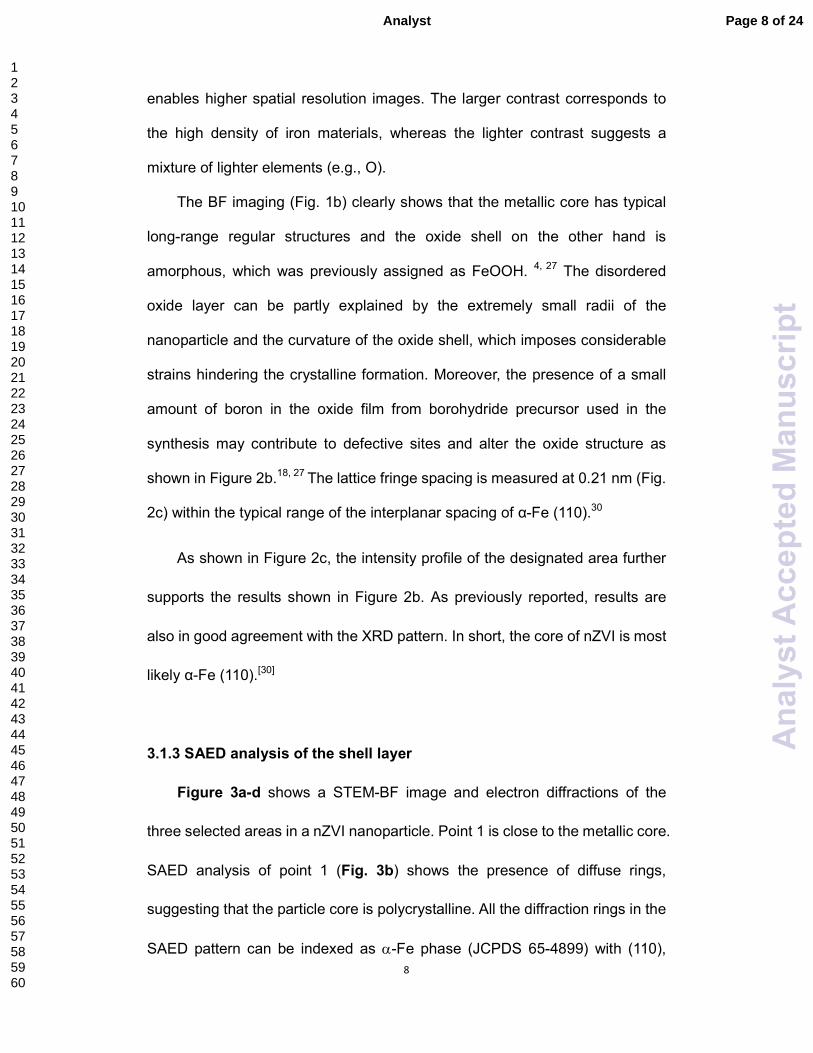
The BF imaging (Fig. 1b) clearly shows that the metallic core has typical
long-range regular structures and the oxide shell on the other hand is
amorphous, which was previously assigned as FeOOH. 4, 27 The disordered
oxide layer can be partly explained by the extremely small radii of the
nanoparticle and the curvature of the oxide shell, which imposes considerable
strains hindering the crystalline formation. Moreover, the presence of a small
amount of boron in the oxide film from borohydride precursor used in the
synthesis may contribute to defective sites and alter the oxide structure as
shown in Figure 2b.18, 27 The lattice fringe spacing is measured at 0.21 nm (Fig.
2c) within the typical range of the interplanar spacing of α-Fe (110).30
As shown in Figure 2c, the intensity profile of the designated area further
supports the results shown in Figure 2b. As previously reported, results are
also in good agreement with the XRD pattern. In short, the core of nZVI is most
likely α-Fe (110).[30]
3.1.3 SAED analysis of the shell layer
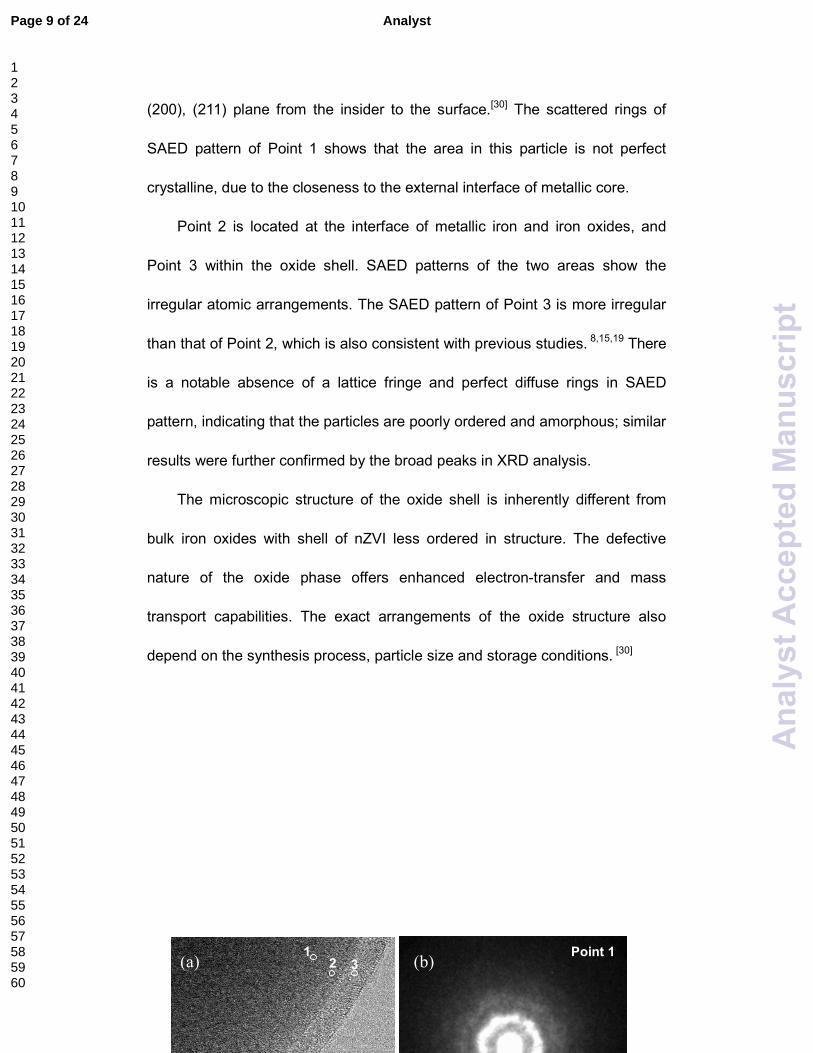
Figure 3a-d shows a STEM-BF image and electron diffractions of the
three selected areas in a nZVI nanoparticle. Point 1 is close to the metallic core.
SAED analysis of point 1 (Fig. 3b) shows the presence of diffuse rings,
suggesting that the particle core is polycrystalline. All the diffraction rings in the
SAED pattern can be indexed as α-Fe phase (JCPDS 65-4899) with (110),
Page 8 of 24Analyst
123456789101112131415161718192021222324252627282930313233343536373839404142434445464748495051525354555657585960
Ana
lyst
Acc
epte
dM
anus
crip
t
9
(200), (211) plane from the insider to the surface.[30] The scattered rings of
SAED pattern of Point 1 shows that the area in this particle is not perfect
crystalline, due to the closeness to the external interface of metallic core.
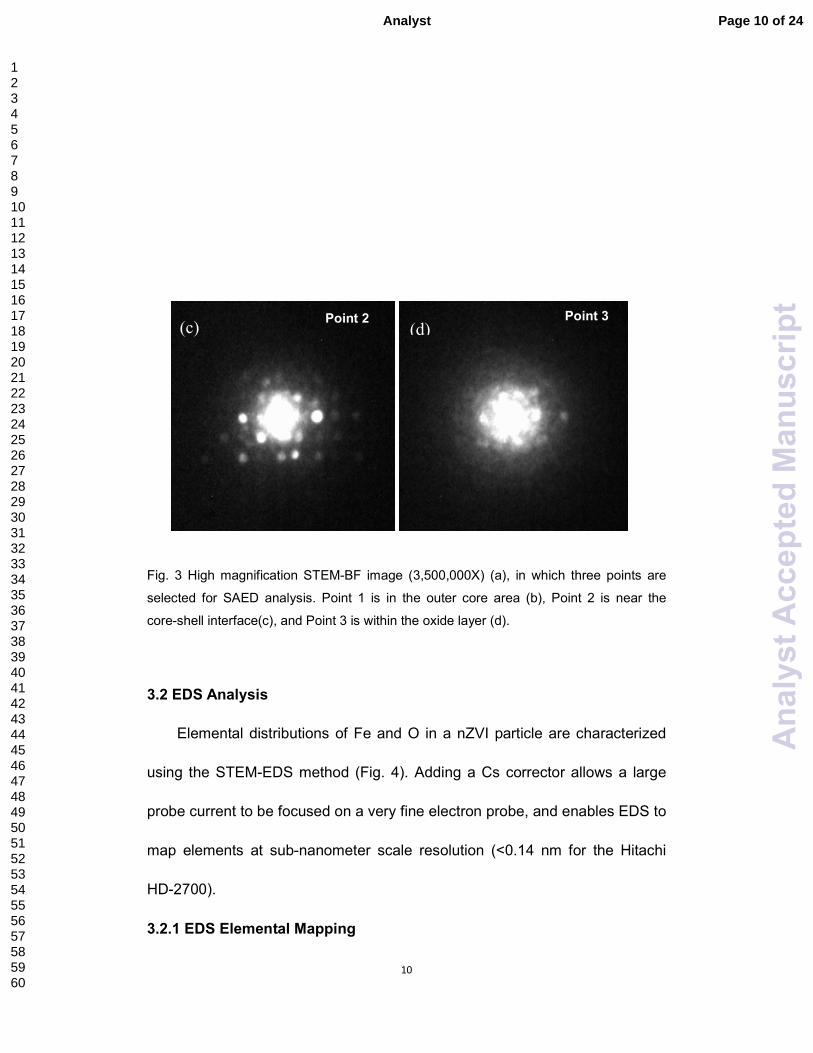
Point 2 is located at the interface of metallic iron and iron oxides, and
Point 3 within the oxide shell. SAED patterns of the two areas show the
irregular atomic arrangements. The SAED pattern of Point 3 is more irregular
than that of Point 2, which is also consistent with previous studies. 8,15,19 There
is a notable absence of a lattice fringe and perfect diffuse rings in SAED
pattern, indicating that the particles are poorly ordered and amorphous; similar
results were further confirmed by the broad peaks in XRD analysis.
The microscopic structure of the oxide shell is inherently different from
bulk iron oxides with shell of nZVI less ordered in structure. The defective
nature of the oxide phase offers enhanced electron-transfer and mass
transport capabilities. The exact arrangements of the oxide structure also
depend on the synthesis process, particle size and storage conditions. [30]
1
3 2 (a) (b) Point 1
Page 9 of 24 Analyst
123456789101112131415161718192021222324252627282930313233343536373839404142434445464748495051525354555657585960
Ana
lyst
Acc
epte
dM
anus
crip
t
10
Fig. 3 High magnification STEM-BF image (3,500,000X) (a), in which three points are
selected for SAED analysis. Point 1 is in the outer core area (b), Point 2 is near the
core-shell interface(c), and Point 3 is within the oxide layer (d).
3.2 EDS Analysis
Elemental distributions of Fe and O in a nZVI particle are characterized
using the STEM-EDS method (Fig. 4). Adding a Cs corrector allows a large
probe current to be focused on a very fine electron probe, and enables EDS to
map elements at sub-nanometer scale resolution (<0.14 nm for the Hitachi
HD-2700).
3.2.1 EDS Elemental Mapping
(c) (d) Point 2 Point 3
Page 10 of 24Analyst
123456789101112131415161718192021222324252627282930313233343536373839404142434445464748495051525354555657585960
Ana
lyst
Acc
epte
dM
anus
crip
t
11
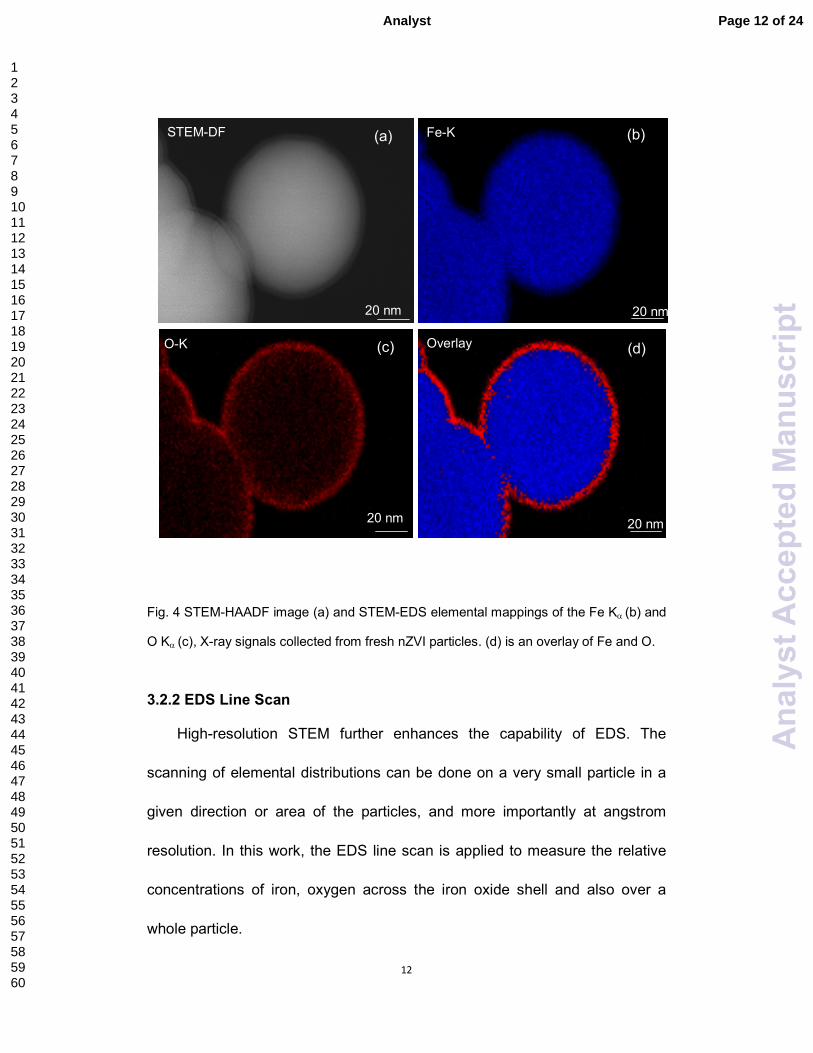
Figure 4 presents a HAADF image (Fig. 4a) and the corresponding EDS
elemental maps (Fig.4b-d) of a typical nZVI nanoparticle. Elements of Fe, O
are denoted in blue and red respectively in the figure. As shown in Figure 4b,
the Fe Kα signal exhibits strong intensity in the particle center and a sharp
decline in the shell layer. In contrast, the presence of O atoms is mainly within
the surface layer. From the O mapping, a ring of 2-4 nm is apparent, which is in
agreement with the shell thickness. 13 Overlay of the two elemental maps is
shown in Figure 4d, which clearly illustrates the spatial presence of the
amorphous oxide phase both at the particle surface and in space between the
two particles. The STEM-EDS technique employed in this study is able to map
out elemental distribution at a nanometer-scale spatial resolution, and provides
a detailed physical model of the layered structure in nZVI. While the nZVI
structure has been characterized by various microscopic, spectroscopic and
chemical reduction methods in recent studies,13,15,27 direct visual presentation
of the chemical composition and the micro-structure at such a high resolution
has yet been reported.
Page 11 of 24 Analyst
123456789101112131415161718192021222324252627282930313233343536373839404142434445464748495051525354555657585960
Ana
lyst
Acc
epte
dM
anus
crip
t
12
Fig. 4 STEM-HAADF image (a) and STEM-EDS elemental mappings of the Fe Kα (b) and
O Kα (c), X-ray signals collected from fresh nZVI particles. (d) is an overlay of Fe and O.
3.2.2 EDS Line Scan
High-resolution STEM further enhances the capability of EDS. The
scanning of elemental distributions can be done on a very small particle in a
given direction or area of the particles, and more importantly at angstrom
resolution. In this work, the EDS line scan is applied to measure the relative
concentrations of iron, oxygen across the iron oxide shell and also over a
whole particle.
STEM-DF
20 nm
Fe-K
20 nm
O-K
20 nm
Overlay
20 nm
(a) (b)
(c) (d)
Page 12 of 24Analyst
123456789101112131415161718192021222324252627282930313233343536373839404142434445464748495051525354555657585960
Ana
lyst
Acc
epte
dM
anus
crip
t
13
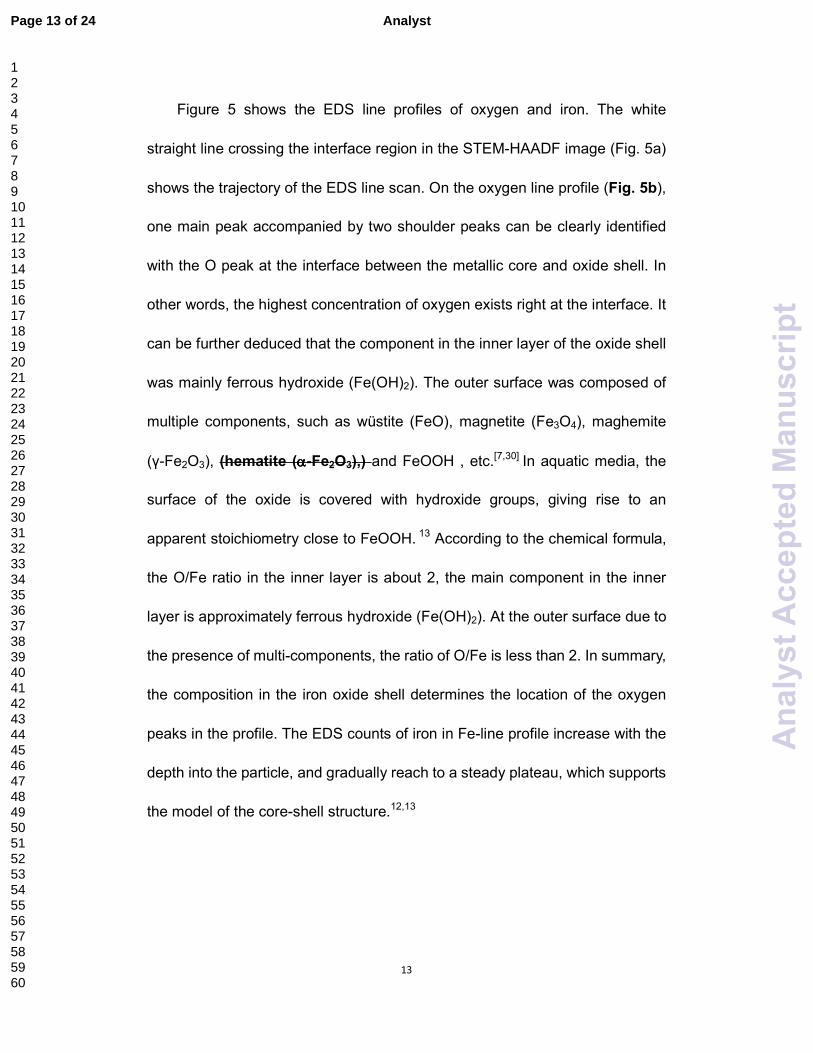
Figure 5 shows the EDS line profiles of oxygen and iron. The white
straight line crossing the interface region in the STEM-HAADF image (Fig. 5a)
shows the trajectory of the EDS line scan. On the oxygen line profile (Fig. 5b),
one main peak accompanied by two shoulder peaks can be clearly identified
with the O peak at the interface between the metallic core and oxide shell. In
other words, the highest concentration of oxygen exists right at the interface. It
can be further deduced that the component in the inner layer of the oxide shell
was mainly ferrous hydroxide (Fe(OH)2). The outer surface was composed of
multiple components, such as wüstite (FeO), magnetite (Fe3O4), maghemite
(γ-Fe2O3), (hematite (αααα-Fe2O3),) and FeOOH , etc.[7,30] In aquatic media, the
surface of the oxide is covered with hydroxide groups, giving rise to an
apparent stoichiometry close to FeOOH. 13 According to the chemical formula,
the O/Fe ratio in the inner layer is about 2, the main component in the inner
layer is approximately ferrous hydroxide (Fe(OH)2). At the outer surface due to
the presence of multi-components, the ratio of O/Fe is less than 2. In summary,
the composition in the iron oxide shell determines the location of the oxygen
peaks in the profile. The EDS counts of iron in Fe-line profile increase with the
depth into the particle, and gradually reach to a steady plateau, which supports
the model of the core-shell structure.12,13
Page 13 of 24 Analyst
123456789101112131415161718192021222324252627282930313233343536373839404142434445464748495051525354555657585960
Ana
lyst
Acc
epte
dM
anus
crip
t
14
0 5 10 15 20 250
50
100
150
200
250
300
Intensity
Distance (nm)
Fe
o
B A
15 nm
17 nm
21 nm
(b)
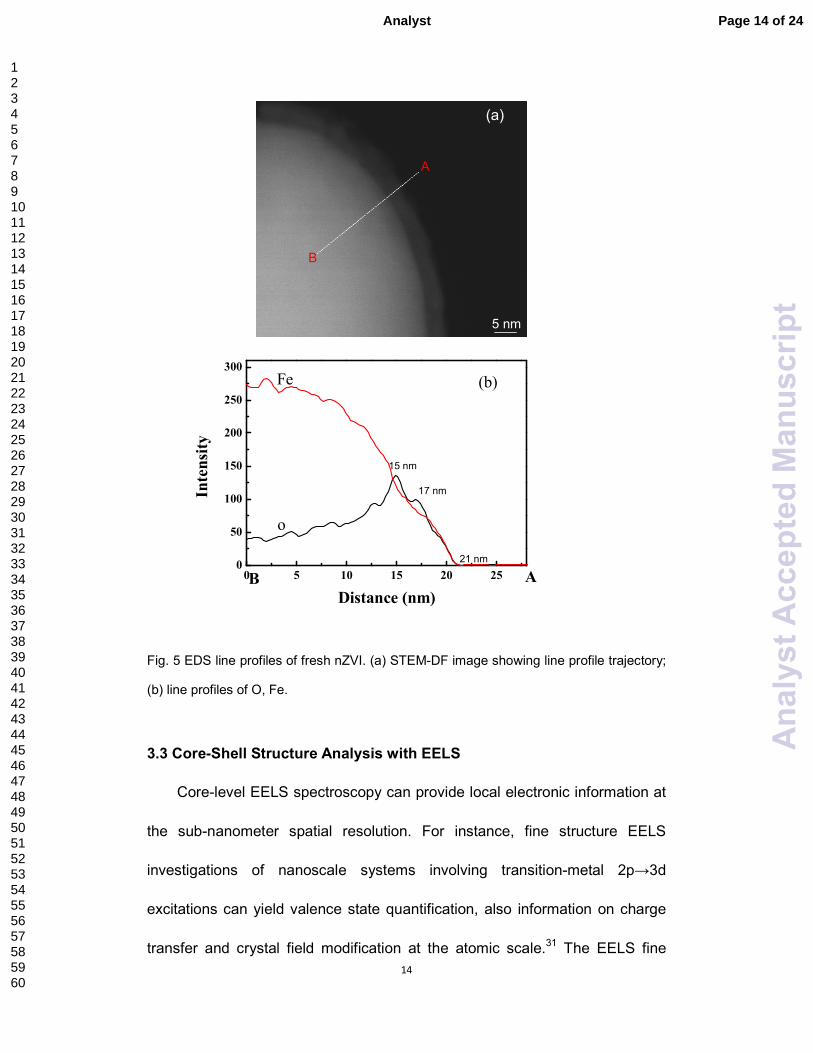
Fig. 5 EDS line profiles of fresh nZVI. (a) STEM-DF image showing line profile trajectory;
(b) line profiles of O, Fe.
3.3 Core-Shell Structure Analysis with EELS
Core-level EELS spectroscopy can provide local electronic information at
the sub-nanometer spatial resolution. For instance, fine structure EELS
investigations of nanoscale systems involving transition-metal 2p→3d
excitations can yield valence state quantification, also information on charge
transfer and crystal field modification at the atomic scale.31 The EELS fine
5 nm
A
B
(a)
Page 14 of 24Analyst
123456789101112131415161718192021222324252627282930313233343536373839404142434445464748495051525354555657585960
Ana
lyst
Acc
epte
dM
anus
crip
t
15
structures of both the O K-edge and the Fe L2.3-edges imprint these structural
differences and therefore can be used to identify a specific Fe phase.19 The
valence state of Fe can often be determined from the following three aspects
of the Fe L2.3 EELS fine structure spectrum: chemical shift (dependence of the
edge position with respect to the valence), fine structural features (splitting of
the peaks), and the white-line ratios of the Fe L2 and Fe L3 spectra. In particular,
spatially resolved EELS analysis on the Fe L2,3 edge fine structures can
determine iron(II) and iron(III), and yields a much more precise description of
the core-shell structure. 10, 30, 32-35
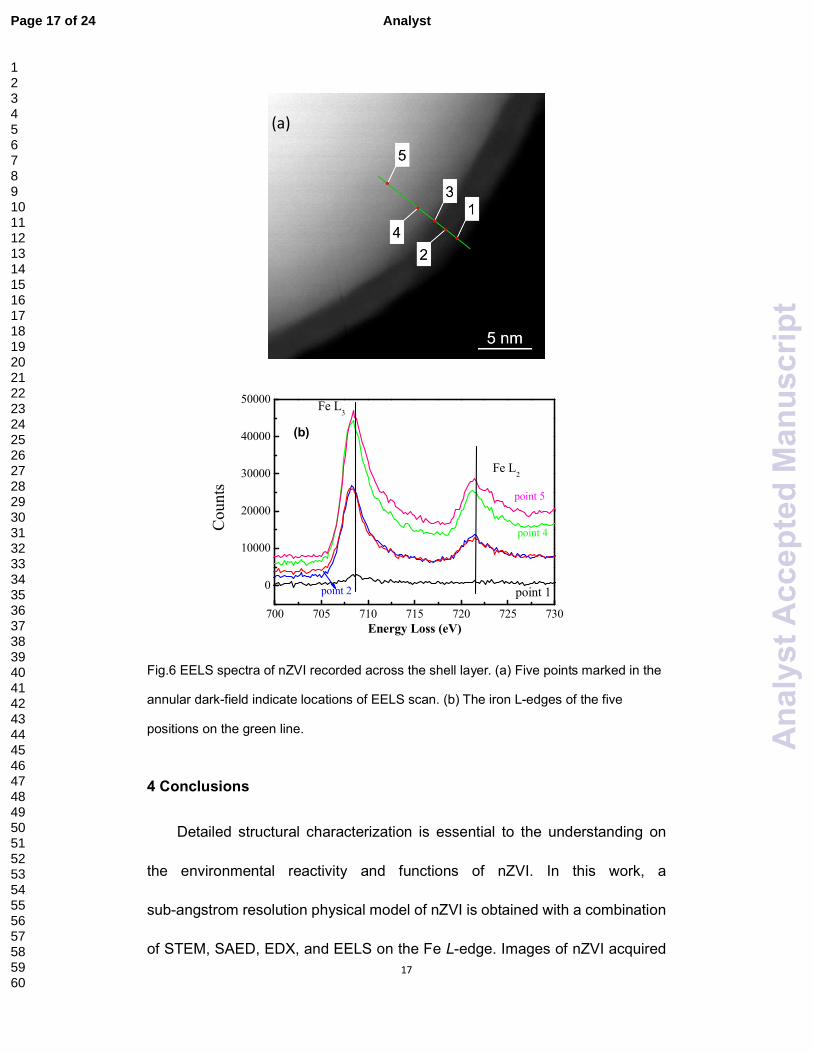
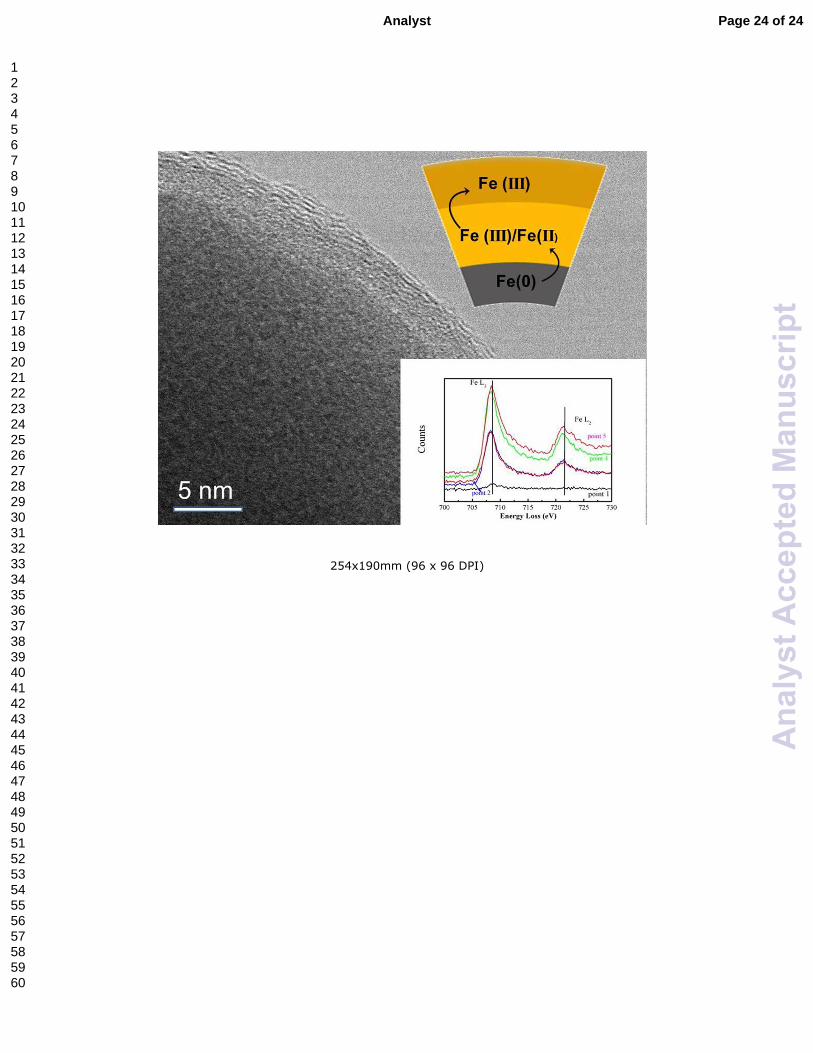
The HAADF image in Figure 6a shows a quarter of one nanoparticle and
locations where the five EELS spectra are acquired. The EELS scans progress
from the solution-nZVI interface to the core area. The five spectra in the energy
loss region of Fe L2,3 edges appear in Figure 6b. The L3 peak is situated at
708.8 eV in the spectrum acquired at the surface (point 1), 708.6 eV in the
middle of the oxide layer (point 2), 708.4 eV in the oxide-ZVI interface (point 3)
and 708.2 eV recorded in the core area (points 4 and 5). The L2 peaks are
located at 723.2 eV (point 1), 721.4 eV (point 2), and 721.2 eV (points 4 and 5)
respectively.
The chemical shift on the positions of the L3 and L2 peaks from the surface
to the core area is apparent. This change of chemical shift in the fine structure
of the spectra correlates with changes in the oxidation state of iron. According
to Gálvez et al., the much bigger L3 value of chemical shift shows a maximum
Page 15 of 24 Analyst
123456789101112131415161718192021222324252627282930313233343536373839404142434445464748495051525354555657585960
Ana
lyst
Acc
epte
dM
anus
crip
t
16
for iron (III) species.[35-36] Consequently, the EELS results in this paper
represent clearly evidence on the presence of a higher fraction of iron (III)
species at the surface. These results are in agreement with findings of
previous XPS studies that the shell of nZVI consisted of a mixed Fe (II)/Fe (III)
phase close to the Fe (0) interface and a predominantly Fe (III) oxide at the
exterior surface of the nanoparticles.37-38
Page 16 of 24Analyst
123456789101112131415161718192021222324252627282930313233343536373839404142434445464748495051525354555657585960
Ana
lyst
Acc
epte
dM
anus
crip
t
17
700 705 710 715 720 725 730
0
10000
20000
30000
40000
50000
Counts
Energy Loss (eV)
Fe L3
Fe L2
point 1point 2
point 4
point 5
(b)
Fig.6 EELS spectra of nZVI recorded across the shell layer. (a) Five points marked in the
annular dark-field indicate locations of EELS scan. (b) The iron L-edges of the five
positions on the green line.
4 Conclusions
Detailed structural characterization is essential to the understanding on
the environmental reactivity and functions of nZVI. In this work, a
sub-angstrom resolution physical model of nZVI is obtained with a combination
of STEM, SAED, EDX, and EELS on the Fe L-edge. Images of nZVI acquired
(a)
Page 17 of 24 Analyst
123456789101112131415161718192021222324252627282930313233343536373839404142434445464748495051525354555657585960
Ana
lyst
Acc
epte
dM
anus
crip
t
18
by a Hitachi HD-2700 STEM provide detailed morphology and structure
information. Cs-corrected STEM-EDS technique illustrates that the nZVI
nanoparticle comprises of a metal iron core encapsulated by a thin layer of iron
oxides or oxyhydroxides. Patterns of SAED suggest polycrystalline structures
in the core area and confirm the amorphous structures of the surface layer.
The unique configuration and the nature of the core-shell structure allow the
particle to possess the reductive character of metallic iron and the adsorptive
and coordinative properties of iron oxides. The Fe L-edge of EELS shows
varied chemical features from the innermost Fe core to the outermost oxide
shell. It demonstrates that the shell of nZVI consists of a mixed Fe (II)/Fe (III)
phase close to the Fe (0) interface and a predominantly Fe (III) oxide at the
exterior surface of the nanoparticle. The defective nature of the oxide shell is
expected to influence the chemical activity and lifetime in the aqueous
environment.
Acknowledgments
Research described in this work has been supported by the Science and
Technology Commission of Shanghai (Grant 11JC1412600) and by the
National Science Foundation of China (NSFC Grants 21277102, 21003151).
The authors thank Hitachi High-Technologies Corporation for the use of
HD-2700 STEM and Dr. Xiaofeng Zhang for his assistance in the STEM
analysis and interpretation.
Page 18 of 24Analyst
123456789101112131415161718192021222324252627282930313233343536373839404142434445464748495051525354555657585960
Ana
lyst
Acc
epte
dM
anus
crip
t
19
Reference
1. C. B. Wang and W. X. Zhang, Synthesizing nanoscale iron particles for
rapid and complete dechlorination of TCE and PCBs, Environ. Sci.
Technol., 1997, 31, 2154–2156.
2. D. W. Elliott and W. X. Zhang, Field assessment of nanoscale bimetallic
particles for groundwater treatment, Environ. Sci. Technol., 2001, 35,
4922–4926.
3. G. V. Lowry and K. M. Johnson, Congener-specific dechlorination of
dissolved PCBs by microscale and nanoscale zerovalent iron in a
water/methanol solution, Environ. Sci. Technol., 2004, 38, 5208–5216.
4. X. Q. Li, D.W. Elliott and W. X. Zhang, Zero-valent iron nanoparticles for
abatement of environmental pollutants: materials and engineering aspects,
Crit. Rev. Solid State., 2006, 31, 111–122.
5. Y. H. Tee, E. Grulke and D. Bhattacharyya, Role of Ni/Fe nanoparticle
composition on the degradation of trichloroethylene from water, Ind. Eng.
Chem. Res., 2005, 44, 7062–7070.
6. S. M. Ponder, J. G. Darab and T. E. Mallouk, Remediation of Cr (VI) and
Pb (II) aqueous solutions using supported, nanoscale zero-valent iron,
Environ. Sci. Technol., 2000, 34, 2564–2569.
7. S. R. Kanel, B. Manning, L. Charlet and H. Choi, Removal of arsenic(III)
from groundwater by nanoscale zero-valent iron, Environ. Sci. Technol.,
2005, 39, 1291–1298.
8. X. Q. Li and W. X. Zhang, Sequestration of metal cations with zerovalent
iron nanoparticles — A study with high resolution X–ray photoelectron
spectroscopy (HR–XPS), J. Phys. Chem. C, 2007, 111, 6939–6946.
9. J. Antony, Y. Qiang, D. R. Baer and C. M. Wang, Synthesis and
characterization of stable iron–iron oxide core–shell nanoclusters for
environmental applications, J. Nanosci. Nanotechnol., 2006, 6, 568–572.
10. S. M. Ponder, J. G. Darab, J. Bucher, D. Caulder, I. Craig, L. Davis, N.
Page 19 of 24 Analyst
123456789101112131415161718192021222324252627282930313233343536373839404142434445464748495051525354555657585960
Ana
lyst
Acc
epte
dM
anus
crip
t

20
Edelstein, W. Lukens, H. Nitsche, L. F. Rao, D. K. Shuh and T. E. Mallouk,
Surfacechemistry and electrochemistry of supported zerovalent iron
nanoparticles in the remediation of aqueous metal contaminants, Chem.
Mater., 2001, 13, 479–486.
11. S. R. Kanel, B. Manning, L. Charlet and H. Choi, Arsenic (V) Removal from
Groundwater Using Nano Scale Zero-Valent Iron as a Colloidal Reactive
Barrier Material, Environ. Sci. Technol., 2006, 40, 2045-2050.
12. T. Masciangioli and W. X. Zhang, Environmental technologies at the
nanoscale, Environ. Sci. Technol., 2003, 37, 102A-108A.
13. J. E. Martin, A. A. Herzing, W. L. Yan, X. Q. Li, B. E. Koel, C. J. Kiely and
W. X. Zhang, Determination of the Oxide Layer Thickness in Core–Shell
Zerovalent Iron Nanoparticles, Langmuir, 2008, 24, 4329–4334.
14. M. A. V. Ramos, W. Yan, X. Q. Li, B. E. Koel and W. X. Zhang,
Simultaneous Oxidation and Reduction of Arsenic by Zero-Valent Iron
Nanoparticles: Understanding the Significance of the Core-Shell Structure,
J. Phys. Chem. C, 2009, 113, 14591-14594.
15. J. T. Nurmi, P. G. Tratnyek, V. Sarathy, D. R. Baer, J. E. Amonette, K.
Pecher, C. M. Wang, J. C. Linehan, D. W. Matson, R. L. Penn and M. D.
Driessen, Characterization and properties of metallic iron nanoparticles:
Spectroscopy, electrochemistry, and kinetics, Environ. Sci. Technol., 2005,
39, 1221–1230.
16. C. M. Wang, D. R. Baer, J. E. Amonette, M. H. Engelhard, Y. Qiang and J.
Antony, Morphology and oxide shell structure of iron nanoparticles grown
by sputter–gas–aggregation, Nanotechnol., 2007, 18, 255603.
17. L. Signorini, L. Pasquini, L. Savini, R. Carboni, F. Boscherini, E. Bonetti, A.
Giglia, M. Pedio, N. Mahne and S. Nannarone, Size–dependent oxidation
in iron/iron oxide core–shell nanoparticles, Phys. Rev. B., 2003, 68,
195423.
18. E. E. Carpenter, S. Calvin, R. M. Stroud and V. G. Harris, Passivated iron
Page 20 of 24Analyst
123456789101112131415161718192021222324252627282930313233343536373839404142434445464748495051525354555657585960
Ana
lyst
Acc
epte
dM
anus
crip
t
21
as core-shell nanoparticles, Chem. Mater., 2003, 15, 3245-3246.
19. C. M. Wang, D. R. Baer, J. E. Amonette, M. H. Engelhard, J. Antony and Y.
Qiang, Morphology and Electronic Structure of the Oxide Shell on the
Surface of Iron Nanoparticles, J. Am. Chem. Soc., 2009, 131, 8824-8832.
20. K. Kimoto, T. Asaka, T. Nagai, M. Saito, Y. Matsuil and K. Ishizuka,
Element–selective imaging of atomic columns in a crystal using STEM and
EELS, Nature, 2007, 450, 702–704.
21. D. A. Muller, Structure and bonding at the atomic scale by scanning
transmission electron microscopy, Nature Mater., 2009, 8, 263–270.
22. N. D. Browning, M. F. Chisholm and S. J. Pennycook, Atomic-resolution
chemical analysis using a scanning transmission electron microscope,
Nature, 1993, 366, 143-146.
23. D. A. Muller, L. Fitting Kourkoutis, M. Murfitt, J. H. Song, H. Y. Hwang, J.
Silcox, N. Dellby and O. L. Krivane, Atomic-Scale Chemical Imaging of
Composition and Bonding by aberration-Corrected Microscopy, Science,
2008, 319, 1073-1076.
24. S. J. Pennycook and L. A. Boatner, Chemically sensitive structure–
imaging with a scanning transmission electron microscope, Nature, 1988,
336, 565–567.
25. P. E. Batson, N. Dellby and O. L. Krivanek, Sub–angstrom resolution using
aberration corrected electron optics, Nature, 2002, 418, 617–620.
26. D. A. Muller, N. Nakagawa, A. Ohtomo, J. L. Grazul and H. Y. Hwang,
Atomic–scale imaging of nanoengineered oxygen vacancy profiles in
SrTiO3, Nature, 2004, 430, 657–661.
27. X. Q. Li and W. X. Zhang, Iron nanoparticles: the core–shell structure and
unique properties for Ni (II) sequestration, Langmuir, 2006, 22, 4638–4642.
28. Y. P. Sun, X. Q. Li, J. S. Cao, W.-X. Zhang and H. P. Wang,
Characterization of zero–valent iron nanoparticles, Adv. Colloid Interfac.,
2006, 120, 47–56.
Page 21 of 24 Analyst
123456789101112131415161718192021222324252627282930313233343536373839404142434445464748495051525354555657585960
Ana
lyst
Acc
epte
dM
anus
crip
t
22
29. W. L. Yan, A. A. Herzing, X. Q. Li, C. J. Kiely and W. X. Zhang, Structural
Evolution of Pd–Doped nanoscale zerovalent iron (nZVI) in aqueous
media and implications for particle aging and reactivity, Environ. Sci.
Technol., 2010, 44, 4288–4294.
30. Q. Wang, S. Lee and H. C. Choi, Aging Study on the Structure of
Fe0-Nanoparticles: Stabilization, Characterization, and Reactivity, J. Phys.
Chem. C, 2010, 114, 2027–2033.
31. Q. Wang, S. Snyder, J. Kim and H. C. Choi, Aqueous Ethanol modified
Nanoscale Zerovalent Iron in Bromate Reduction: Synthesis,
Characterization, and Reactivity, Environ. Sci. Technol., 2009, 43,
3292–3299.
32. S. Kahle, Z. Deng, N. Malinowski , C. Tonnoir, A. Forment-Aliaga, N.
Thontasen, G. Rinke, D. Le, V. Turkowski, T. S. Rahman, S.
Rauschenbach, M. Ternes and K. Kern, The Quantum Magnetism of
Individual Manganese-12-Acetate Molecular Magnets Anchored at
Surfaces, Nano Lett., 2012, 12, 518−521.
33. G. Huang, X. Shi, R. A. Pinto, E. Petersen and W. J. Weber, Tunable
Synthesis and Immobilization of Zero–Valent Iron Nanoparticles for
Environmental Applications, Environ. Sci. Technol., 2008, 42, 8884–8889.
34. J. Lai, K. V. P. M. Shafi, A. Ulman, K. Loos, R. Popovitz–Biro, Y. Lee, T.
Vogt and C. Estournes, One–Step Synthesis of Core(Cr)/Shell(γ-Fe2O3)
Nanoparticles, J. Am. Chem. Soc., 2005, 127, 5730–5731.
35. C. Colliex, T. Manoubi and C. Ortiz, Electron–energy–loss–spectroscopy
near–edge fine structures in the iron–oxygen system, Phys. Rev. B, 1991,
44, 11402–11411.
36. N. Galvez, B. Fernandez and P. Sanchez, Comparative structural and
chemical studies of ferritin cores with gradual removal of their iron contents,
J. Am. Chem. Soc., 2008, 130, 8062–8068.
37. T. G. Sparrow, and B. G. Williams, C. N. R. Rao and J. M. Thomas, L3/L2
white–line intensity ratios in the electron energy–loss spectra of 3d
Page 22 of 24Analyst
123456789101112131415161718192021222324252627282930313233343536373839404142434445464748495051525354555657585960
Ana
lyst
Acc
epte
dM
anus
crip
t
23
transition-metal oxides, Chem. Phys. Lett., 1984, 108, 547-550.
38. W. L. Yan, A. A. Herzing, X. Q. Li, C. J. Kiely and W.-X. Zhang, Nanoscale
zero–valent iron (nZVI): Aspects of the core–shell structure and reactions
with inorganic species in water, J. Contam. Hydrol., 2010, 118, 96–104.
Page 23 of 24 Analyst
123456789101112131415161718192021222324252627282930313233343536373839404142434445464748495051525354555657585960
Ana
lyst
Acc
epte
dM
anus
crip
t
254x190mm (96 x 96 DPI)
Page 24 of 24Analyst
123456789101112131415161718192021222324252627282930313233343536373839404142434445464748495051525354555657585960
Ana
lyst
Acc
epte
dM
anus
crip
t