Embed Size (px)
Citation preview

Analyst Presentation Q1 2016Frankfurt – May 4, 2016
Dr. Matthias Zieschang
CFO

Disclaimer
This document has been prepared by Fraport solely for use in this presentation.
The information contained in this document has not been independently verified. No representation or warranty – whetherexpress or implied – is made as to, and no reliance should be placed on, the fairness, accuracy, completeness or correctnessof the information or opinions contained therein. Neither the company nor any of its affiliates, advisors or representatives shallhave any liability whatsoever (in negligence or otherwise) for any loss arising from any use of this document or its content orotherwise arising in connection with this document.
This document does not constitute an offer or invitation to purchase or subscribe for any shares and neither this document norany part of it shall form the basis of, or be relied upon in connection with, any contract or commitment whatsoever.
This document contains forward-looking statements that are based on current estimates and assumptions made by themanagement of Fraport to the best of its knowledge. Such forward-looking statements are subject to risks and uncertainties,the non-occurrence or occurrence of which could cause the actual results – including the financial condition and profitability ofFraport – to differ materially from or be more negative than those expressed or implied by such forward-looking statements.This also applies to the forward looking estimates and forecasts derived from third-party studies. Consequently, neither thecompany nor its management can give any assurance regarding the future accuracy of the opinions set forth in this documentor the actual occurrence of the predicted developments.
By accepting this document, you agree with the foregoing.
Fraport Analyst Presentation Q120162

Fraport Analyst Presentation Q120163
Agenda
- Traffic Insight
- Business Update
- Q1 2016 Financials
- FY 2016 Outlook

Traffic Insight
Group Passenger Results (stakes above 10%)
Fraport Analyst Presentation Q120164
IATA
CodeAirport Share
March
2016
Dprevious
year
YTD
2016
Dprevious
year
FY
2015
CAGR
2010-
2015
FRA Frankfurt, Germany 100% 4,787 +3.9% 12,926 +3.3% 61,032 +2.9%
LJU Ljubljana, Slovenia 100% 94 +3.3% 245 +3.9% 1,438 +0.7%
LIM Lima, Peru 70% 1,502 +12.1% 4,482 +11.5% 17,113 +10.7%
BOJ Burgas, Bulgaria 60% 12 +29.6% 35 +15.4% 2,360 +4.7%
VAR Varna, Bulgaria 60% 29 +20.1% 83 +23.4% 1,399 +3.1%
AYT Antalya, Turkey 51% 999 -4.0% 2,352 -2.8% 27,523 +4.4%
LED St. Petersburg, Russia 35.5% 830 -3.9% 2,316 -6.2% 13,500 +9.8%
HAJ Hanover, Germany 30% 406 +0.9% 1,008 +3.4% 5,453 +1.5%
XIY Xi‘an, China 24.5% 2,911 +7.5% 8,596 +13.0% 32,970 +12.9%

Traffic Insight
Focus Frankfurt
Passengers
Movements
MTOW
Cargo
MAR 2016 YTD 2016
12,296
105,844
6,861
497
4,787
37,503
2,447
183
+3.9
+0.8
+3.2
-1.6
+3.3
+1.0
+3.4
-1.2
D %D %
in `000
in `000 tons
65%
70%
75%
80%
85%
90%
Jan Feb Mar Apr May Jun Jul Aug Sep Oct Nov Dec
Seat load factor
2016 2015
FY 2015
in `000 tons
Passenger per movement
120 125 130 135 140
Passenger guidance FY2016:
Growth between ~1% and ~3%
+2.6 Pass.
YTD 2016
YTD 2015
61,032
468,153
29,543
2,077
Passenger figures according to ACI, commercial traffic only; cargo includes air freight and air mail
Fraport Analyst Presentation Q120165

Traffic Insight
Focus Frankfurt
Fraport Analyst Presentation Q120166
Northern Africa
-18%
-14%-21%
-17%
Far East
-3%
Middle East
+3%
-23%
FRA
• Weakness on outbound routes esp. to touristic destinations of Islamic countries
• Strong increase on routes to the Caribbean, Thailand, and Middle East
• Far East among others down due to stop of Malaysian services
• China with growth in April
• Pre-bookings for Summer period show continuation of negative trend with regard
to Northern Africa and Turkey
Change vs. April 2015
Central America
+20%
Major declining destinations
Traffic Insight
Focus Antalya
Fraport Analyst Presentation Q120167
0.0
0.5
1.0
1.5
2.0
2.5
3.0
3.5
4.0
4.5
January February March April May June July August September October November December
Domestic 2016 Domestic 2015 International 2016 International 2015
• Strong seasonality in passenger traffic: <10% of total traffic in q1
• Low seasonality in domestic traffic: each month only between 400k and 600k
• Domestic traffic = between 20 and 25% of total traffic on FY basis
• High seasonality in international traffic: 5% of total in q1, 15% in q4 and
80% in q2 and q3
• Q1 figures positively impacted by domestic traffic: +13% compared to 2015 and
negatively by international traffic -22%
Passengers in million
Traffic Insight
Focus Antalya
0
1
2
3
4
January February March April May June July August September October November December
2015 2016
Fraport Analyst Presentation Q120168
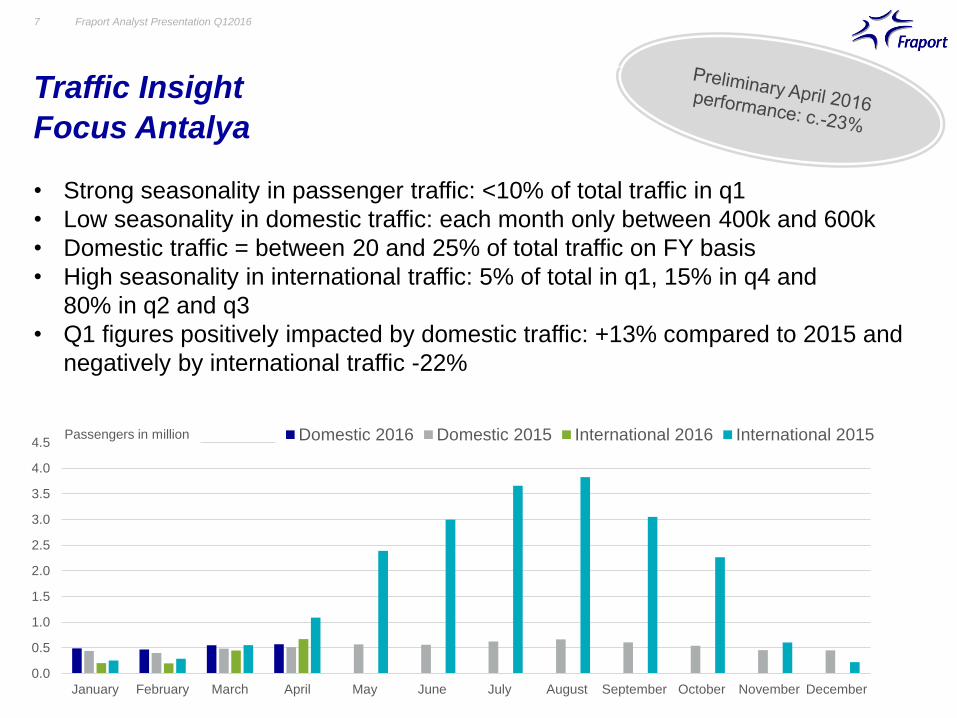
• High volatility due to Russian sanctions and terrorist attacks in Ankara and Istanbul
• Decrease driven by Russian (-85%) and German passengers (-27%)
• Compensating effects from domestic traffic (YTD April +13%)
• Increased uncertainty regarding traffic development in main season
• Feedback from tour operators and tourism fairs: No Russian charter flights
in 2016 expected, strong decrease of European passengers possible
• Last-minute bookings could mitigate the decrease
YTD April: c.-30%
International passengers in million

Fraport Analyst Presentation Q120169
Agenda
- Traffic Insight
- Business Update
- Q1 2016 Financials
- FY 2016 Outlook

10
Business Update
Frankfurt & External Activities
Fraport Analyst Presentation Q12016
Terminal 3
• Excavation work finished on time
• Special civil engineering to follow up from Q4/2016
• Landside access also to be started in next few months
Multichannel
• New stores included in online platform
• Test phase of lounge-delivery and inflight shopping started
Greek regional airports
• +21% passengers in q1 2016
• Antitrust approval granted
• Good process in project financing
• CEO and CTO appointed

Fraport Analyst Presentation Q1201611
Agenda
- Traffic Insight
- Business Update
- Q1 2016 Financials
- FY 2016 Outlook

Group P&L Q1 2016
Decline in EBITDA, good Net Result
Fraport Analyst Presentation Q12016
P&L in € mil. Q1 16 Q1 15 %
Revenue 573 576 -0.6
- excl. IFRIC 12 568 572 -0.8
EBITDA 146 153 -4.9
EBIT 64 72 -10.7
EBT 22 16 +39.7
Group result 15 11 +42.5
EPS in € 0.16 0.11 +45.5
› Adjusted for consolidation effects:
c.15m revenue growth
› Headwind from Retail revenue, non-
capitalizbl. capex & multi channel cost
› Improvement in financial result from
lower interest expenses and strong
negative 2015 CHF loan revaluation
› Bottom-line results with good growth
Comments
Revenue by segment in € mil.
Revenue
Q1 2015
Aviation Retail &
Real Estate
Ground
Handling
External
Activities &
Services
Revenue
Q1 2016
±0
-8
+6 573-1
External
Activities
Services
EBITDA by segment in € mil.
EBITDA
Q1 2015
Aviation Retail &
Real Estate
Ground
Handling
EBITDA
Q1 2016
153+2 +1 146
-9
-1
External
Activities &
Services
Due to commercial rounding slight discrepancies may occur when summing up, percent changes based on unrounded figures
576
12

Group P&L Q1 2016
Growth in External & Ground Handling EBITDA
Fraport Analyst Presentation Q12016
EBITDA
Q1 2015
Other
income
Cost of
materials ex.
IFRIC 12
Staff
cost
EBITDA
Q1 2016
Revenue
ex. IFRIC 12
Other
opex
153
-2 -1
146
€ -7.5 mil.
-1
IFRIC 12
revenue
IFRIC 12
cost of
materials
-5+1
20.0%
58.2%
21.8%
Segment share in Group EBITDA Q1 2015 Segment share in Group EBITDA Q1 2016
20.4%
55.1%
1.3%
23.2%Aviation
Retail &
Real Estate
External
Activities &
Services Aviation
Retail &
Real Estate
External
Activities &
Services
Ground
Handling:
negative
Ground
Handling
Due to commercial rounding slight discrepancies may occur when summing up
+1
13
€ mil.
-1

Group P&L Q1 2016
Group Result up due to Improvement in Financial Result
Fraport Analyst Presentation Q12016
Split of financial result Comments
Group result
Q1 2015
EBITDA D&A Financial
result
Taxes Group result
Q1 2016
EPS
Q1 2015
EPS
Q1 2016
€ mil Q1 16 Q1 15 %
Interest income 9 8 +10.3
Interest
expenses-38 -42 -
At equity result -12 -13 -
Other result -1 -9 -
Financial result -43 -56 -
› Improved interest result from lower interest
rates and lower indebtedness
› Antalya in off-season mildly negative on at
equity result
› Positive results in Hanover and Xi’an with
compensating effects
› Other financial result up, due to lack of strong
negative CHF loan revaluation effect in
previous year
11 -7
15
±0
-2
+€4.5 mil.
€0.16
€0.11
+€0.05
+13
Due to commercial rounding slight discrepancies may occur when summing up, percent changes based on unrounded figures
14
€ mil.
Group Asset & Financial Situation Q1 2016
Lower Off-Season OCF leads to decline in Free Cash Flow
Fraport Analyst Presentation Q12016
FY 2016 OutlookQ1 2016 development
PPEInvestment
property
Operating
cash flow
Intangible
assets
Airport
operating
projects
90
45
114 -3 -46
-4-4
-1 -58
-5±0
+19
DVDs from
investments
Free cash
flow
+8 65
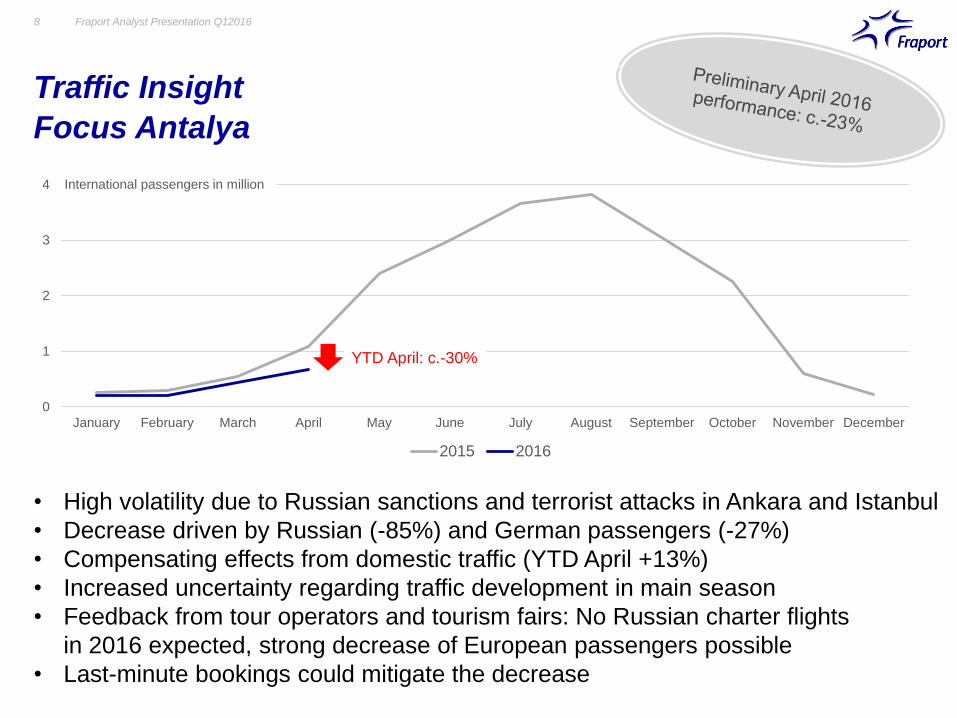
› 2016 capex on 2015 level or slightly above
› Subject to dividends from Antalya, 2016 FCF
expected to be on 2015 level
› Including DVD payout, 2016 FCF with
potential to de-lever Group by up to c.10 % to
net debt/EBITDA < 3x w/o Greek deal
› Lower OCF due to c.€13 mil. increase in one-
off tax payments and minor changes in
working capital
› Spending on PPE ahead of q1 2015 due to
mild winter
› Seasonal increase in DVDs from investments
leads to FCF of €45 mil.
Due to commercial rounding slight discrepancies may occur when summing up
Q1 2016 Q1 2015
€ mil.
15

Group Asset & Financial Situation Q1 2016
Slight De-Leverage to €2.75 bn
Fraport Analyst Presentation Q12016
Balance sheet
› Equity unchanged at €3.5 bn.
› Gearing ratio at 83%, slightly down on
Dec. 31, 2015
› Equity ratio w/o profit earmarked for
distribution and minority interests at 38%
(Dec. 31, 2015: 37%)
Cash development
› FCF slightly takes up liquidity
› Net debt slightly down at €2.75 bn.
› Despite positive FCF: FY 2016 liquidity to go
down due to debt repayments, DVD cash out
+ potential Greek upfront payment
4565
1,070 1,043
3,819 3,817
2,749 2,774
3,520 3,512
83% 84%
March 31, 2016
Liquidity Gross debt Net debt Equity Gearing2FCF1
Dec. 31, 2015
€ mil.
Due to commercial rounding slight discrepancies may occur when summing up
1) FCF pre-dividend payout; figures correspond to Q1 figures 2) Net debt divided by equity less non-controlling interests and profit earmarked for distribution
16

Segment Aviation Q1 2016
Flat Revenue and Earnings
Fraport Analyst Presentation Q12016
P&L in € mil. Q1 16 Q1 15 %
Revenue 200 200 -0.2
- Airport charges 166 164 +0.9
- Security Services 25 27 -5.6
- Other revenue 9 10 -4.1
EBITDA 30 31 -3.3
EBIT -1 0 -
Employees 6,091 5,976 +1.9
› Increase in airport charges due to +3%
passengers and +1% movements
› Security business down due to loss of
T1 concourse B contract
› Headwind from non-capitalizable capex
and higher maintenance cost
Comments
EBITDA
Q1 2016
Revenue Other
income
Staff
cost
Other EBITDA
Q1 2016
31 ±0 -2 30
EBITDA performance in € mil. Revenue split
Aviation charges83.0%
12.5%
4.5%
Due to commercial rounding slight discrepancies may occur when summing up, percent changes based on unrounded figures
17
Other
+2 -1Security Services

Segment Retail & Real Estate Q1 2016
Weak Retail & additional Cost decrease EBITDA
Fraport Analyst Presentation Q12016
P&L in € mil. Q1 16 Q1 15 %
Revenue 113 113 -0.6
- Retail 44 46 -6.0
- Real Estate 49 47 +4.1
- Parking 19 19 -1.1
- Other revenue 2 1 +30.8
EBITDA 80 89 -10.0
EBIT 59 68 -13.2
Employees 645 611 +5.6
› Decline in Retail revenue despite
growth in passenger volume
› Higher cost from non-capitalizable
capex, cost to start multi-channel
program & allocation of internal cost
› EBITDA and EBIT down on previous
year
› EBITDA margin at 71%
Comments
EBITDA
Q1 2015
Revenue Other
income
Staff
cost
Other EBITDA
Q1 2016
89 -1 -1 -6 80
EBITDA performance in € mil. Revenue split
38.7%
43.1%
16.7%
1.5%
Due to commercial rounding slight discrepancies may occur when summing up, percent changes based on unrounded figures
-1
18
Other
Parking
Real Estate
Retail

Segment Retail & Real Estate Q1 2016
Retail per Passenger c.8% down on PY
Fraport Analyst Presentation Q1201619
Retail revenue per Passenger
3.743.42 3.24
4.113.69
3.22 3.04
3.95 3.93
3.41 3.26
4.053.62
Q1 Q2 Q3 Q4 Q1 Q2 Q3 Q4 Q1 Q2 Q3 Q4 Q1
€ mil.
Shopping
Services
Advertis.
Q1 13: €3.74 Q1 14: €3.69 Q1 15: €3.93 Q1 16: €3.62
FY 13: €3.60 FY 14: €3.43 FY 15: €3.62
27 31 33 33
11 13 14 13
6 8 9 11
26 29 32 32
12 14 14 13
7 7 8 10
30 34 35 32
13 14 16 14
7 9 10 10
28
13
7

Segment Retail & Real Estate Q1 2016
Negative Development of Core Spending Destinations
Fraport Analyst Presentation Q1201620
Volume
Development
Change vs. q1 2015
in %
Retail Revenue
per Passenger
in EUR
Change vs. q1 2015
in %
-2-13
5 1
-7
-16
-25
-2-11
10
China Russia South
Korea
Japan Vietnam USA Turkey Germany India
71
4
-2
7
12
-3
210 6
Source: sales/revenue data of Gebr. Heinemann by destinations
Top 5 by Retail Value Top 5 by Volume
UAE

Segment Ground Handling Q1 2016
Disposal of Cargo Subsidiary grows EBITDA & margin
Fraport Analyst Presentation Q12016
P&L in € mil. Q1 16 Q1 15 %
Revenue 146 155 -5.4
- Ground Handling 73 88 -17.0
- Infrastructure 69 66 +3.8
- Other revenue 4 - >100
EBITDA 2 0 >100
EBIT -8 -10 -
Employees 8,993 9,505 -5.4
› Adjusted for consolidation effect:
c.6m revenue & 0.5m EBITDA growth,
EBIT: flat
› Traffic performance leads to underlying
revenue and EBITDA growth
› Slightly higher D&A leads to flat
underlying EBIT
Comments
EBITDA
Q1 2015
Revenue Other
income
Staff
cost
Other EBITDA
Q1 2016
0 -8
+0
+2
+82
EBITDA performance in € mil. Revenue split
Ground Handling50.1%
47.0%
2.9%
Infrastructure
Due to commercial rounding slight discrepancies may occur when summing up, percent changes based on unrounded figures
21
Other revenues

Segment External Activities & Services Q1 2016
Lima, Ljubljana and Twin Star continue to perform
Fraport Analyst Presentation Q12016
Comments
LAP Other EBITDA
Q1 2016
33+4
34
EBITDA performance in € mil. Revenue split
63.1%
2.0%
11.9%
6.5%16.5%
Due to commercial rounding slight discrepancies may occur when summing up, percent changes based on unrounded figures
Lima
Other
Twin Star
Ljubljana
+1
LJU Twin
Star
AMU Air IT
+1 -5
Airmall
P&L in € mil. Q1 16 Q1 15 %
Revenue 113 107 +5.6
- excl. IFRIC 12 109 104 +4.5
EBITDA 34 33 +1.2
EBIT 14 13 +4.6
Employees 4,516 4,550 -0.7
› Adjusted for consolidation effect:
c.9m revenue, 0.7m EBITDA & 0.8m
EBIT growth
› Good growth in Lima from traffic and
positive US$ effect
› Ljubljana, Twin Star & AMU with solid
operations
› Additional maintenance cost in FRA
22
EBITDA
Q1 2015
±0 ±0
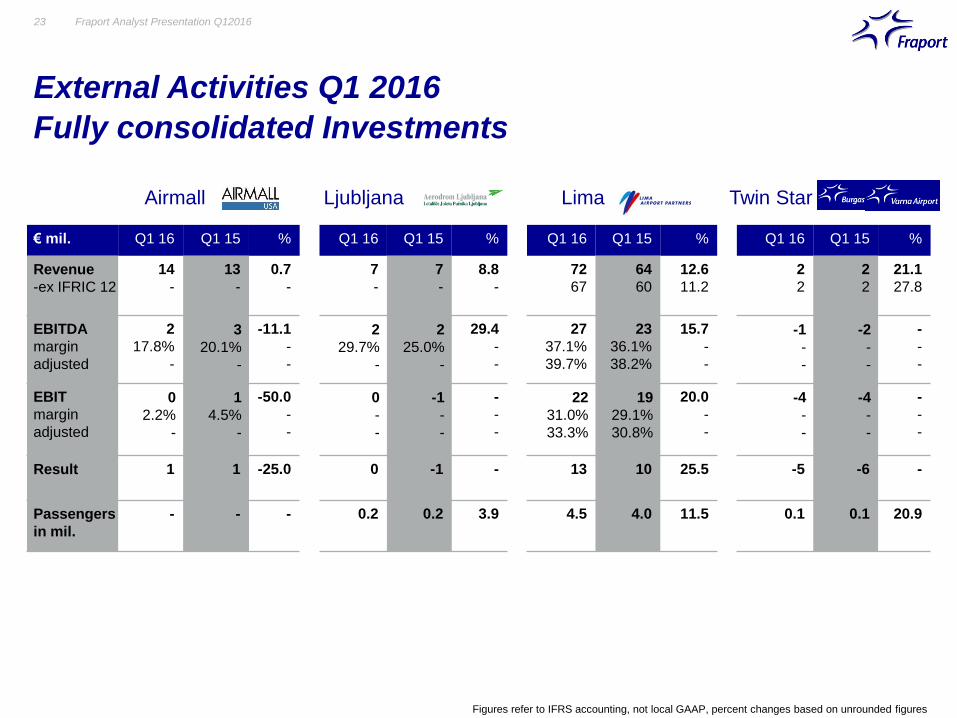
External Activities Q1 2016
Fully consolidated Investments
Fraport Analyst Presentation Q1201623
Figures refer to IFRS accounting, not local GAAP, percent changes based on unrounded figures
€ mil. Q1 16 Q1 15 % Q1 16 Q1 15 % Q1 16 Q1 15 % Q1 16 Q1 15 %
Revenue
-ex IFRIC 12
14
-
13
-
0.7
-
7
-
7
-
8.8
-
72
67
64
60
12.6
11.2
2
2
2
2
21.1
27.8
EBITDA
margin
adjusted
2
17.8%
-
3
20.1%
-
-11.1
-
-
2
29.7%
-
2
25.0%
-
29.4
-
-
27
37.1%
39.7%
23
36.1%
38.2%
15.7
-
-
-1
-
-
-2
-
-
-
-
-
EBIT
margin
adjusted
0
2.2%
-
1
4.5%
-
-50.0
-
-
0
-
-
-1
-
-
-
-
-
22
31.0%
33.3%
19
29.1%
30.8%
20.0
-
-
-4
-
-
-4
-
-
-
-
-
Result 1 1 -25.0 0 -1 - 13 10 25.5 -5 -6 -
Passengers
in mil.
- - - 0.2 0.2 3.9 4.5 4.0 11.5 0.1 0.1 20.9
Airmall Twin StarLjubljana Lima

External Activities Q1 2016
At Equity consolidated Investments
Fraport Analyst Presentation Q1201624
Except for Xi’an all figures refer to IFRS accounting, percent changes based on unrounded figures
€ mil. Q1 16 Q1 15 % Q1 16 Q1 15 % Q1 16 Q1 15 % Q1 16 Q1 15 %
Revenue
-ex IFRIC 12
18
-
21
-
-16.2
-
33
33
46
44
-27.9
-24.5
32
-
31
-
2.6
-
51
-
44
-
16.6
-
EBITDA
margin
adjusted
8
46.0%
-
12
55.2%
-
-30.2
-
-
12
35.9%
35.9%
19
42.1%
44.0%
-38.5
-
-
5
14.8%
-
3
8.7%
-
74.1
-
-
24
46.7%
-
19
43.7%
-
24.5
-
-
EBIT
margin
adjusted
-16
-
-
-13
-
-
-
-
-
4
12.5%
12.5%
9
20.2%
21.1%
-55.4
-
-
0
-
-
-2
-
-
-
-
-
11
21.3%
-
8
18.0%
-
38.0
-
-
Result -33 -31 - -9 34 - -1 -4 - 7 4 86.6
Passengers
in mil.
2.4 2.4 -2.8 2.3 2.5 -6.2 1.0 1.0 3.4 8.6 7.5 13.0
Xi‘AnPulkovo HanoverAntalya

Fraport Analyst Presentation Q1201625
Agenda
- Traffic Insight
- Business Update
- Q1 2016 Financials
- FY 2016 Outlook
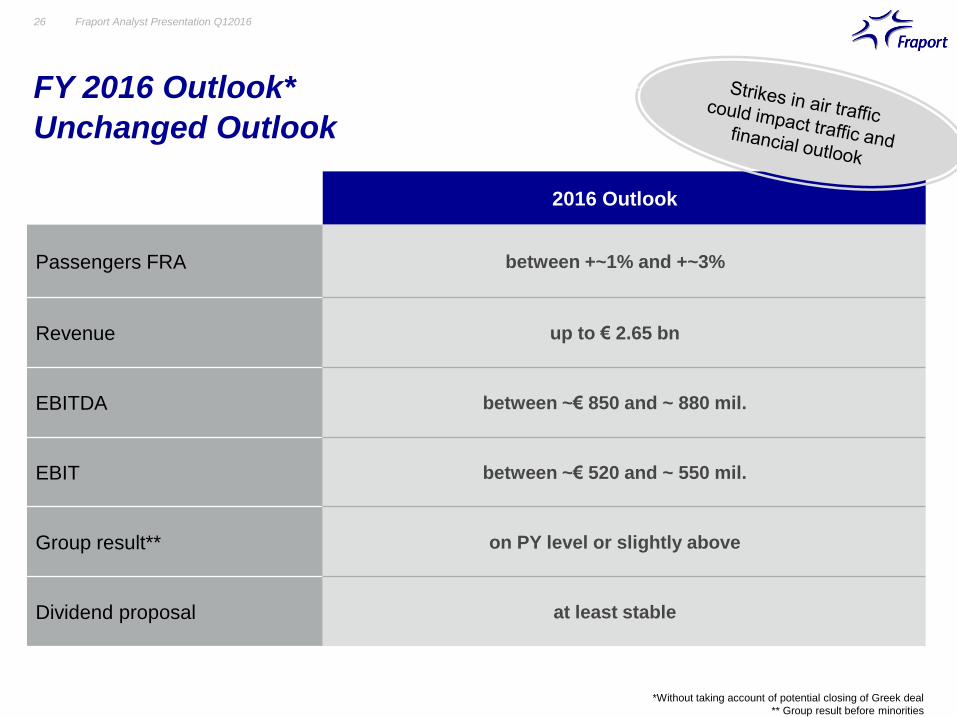
FY 2016 Outlook*
Unchanged Outlook
Fraport Analyst Presentation Q1201626
2016 Outlook
Passengers FRA between +~1% and +~3%
Revenue up to € 2.65 bn
EBITDA between ~€ 850 and ~ 880 mil.
EBIT between ~€ 520 and ~ 550 mil.
Group result** on PY level or slightly above
Dividend proposal at least stable
*Without taking account of potential closing of Greek deal
** Group result before minorities

Thank you for your Attention!
www.meet-ir.com

Fraport Analyst Presentation Q1201628
Appendix
– Subsequent financial information –
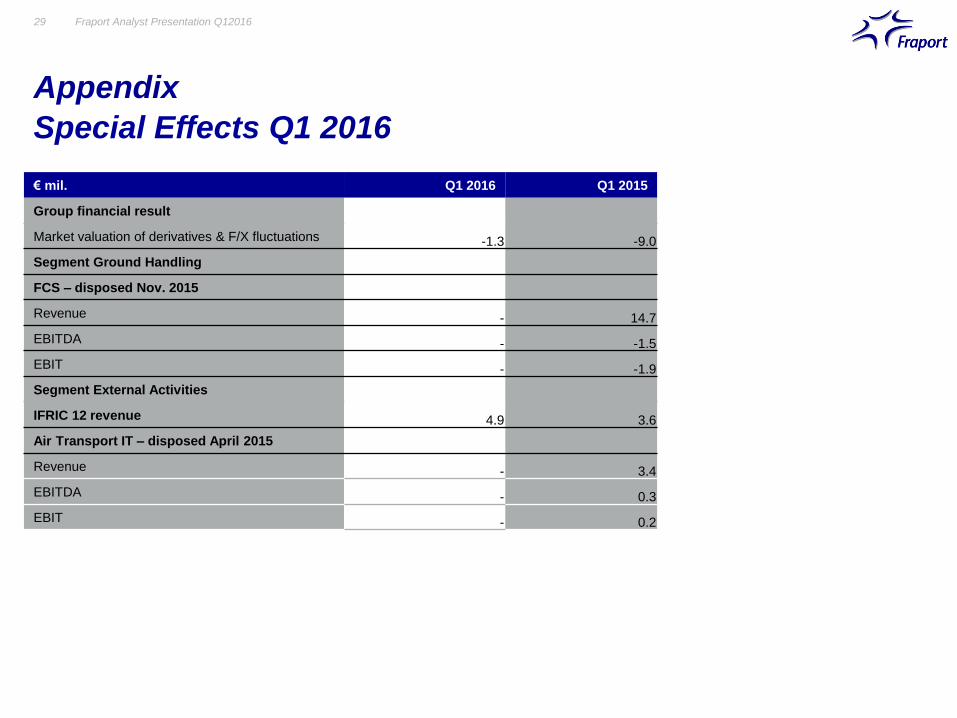
Appendix
Special Effects Q1 2016
Fraport Analyst Presentation Q1201629
€ mil. Q1 2016 Q1 2015
Group financial result
Market valuation of derivatives & F/X fluctuations -1.3 -9.0
Segment Ground Handling
FCS – disposed Nov. 2015
Revenue - 14.7
EBITDA - -1.5
EBIT - -1.9
Segment External Activities
IFRIC 12 revenue 4.9 3.6
Air Transport IT – disposed April 2015
Revenue - 3.4
EBITDA - 0.3
EBIT - 0.2

1,070.4
3,819.4
441.5295.0
517.0
1,132.6
185.8422.5 400.7
32.6 2.6
348.6
0
500
1,000
1,500
2,000
2,500
3,000
3,500
4,000
4,500
Liquidityas of Mar31, 2016
FinancialLiabilities
2016 2017 2018 2019 2020 2021 2022 2023 2024 2025++
nominal
Bookvalue
Fraport debt conditions on average
~ 3.4% interest rate
~ 4.5 years maturity
€ mil.
Appendix
Maturity Profile & Cash Position as at March 31, 2016
Fraport Analyst Presentation Q1201630

Appendix
Status Greece Acquisition
Fraport Analyst Presentation Q1201631
Airports 14 Greek regional airports, 77% international share, around 23 million passengers in 2015
Fraport Share &
Partner
Fraport will hold minimum 65 percent
Upfront payment € 1.2 bn. upfront payment
Concession Payment 22.9 mil. fixed annual concession payments (indexed with Greek inflation rate)
From 2020 variable payment of ~28.5% of EBITDA (before variable concession payment )
Concession Length 40 years
Capex ~€ 330 mil. capex requirements between 2017-2020, afterwards maintenance capex,
capex for further extension depending on traffic growth
Regulation Dual Till
Airport
Charges
Capped at € 13 per departing passenger in 2017, after initial capex capped at € 18.50, thereafter
indexation with 90% of the Greek inflation rate annually
Retail Development Very small retail outlets existing; space will roughly triple after first construction phase; new
operating concepts like walk through will be introduced
Traffic Growth
Assumption
Not disclosed in detail - business case assumes conservative growth over concession period of
about 2.5% p.a.

Appendix
IR Contact
Fraport Analyst Presentation Q1201632
Fraport AG
Frankfurt Airport Services Worldwide
60547 Frankfurt am Main
www.meet-ir.com
+49 69 690 – [email protected]
Stefan J. Rüter
Head of Finance
& Investor Relations
+49 69 690-74840
Svenja Ebeling
Investor Relations Assistant
+49 69 690-74842
Florian Fuchs
Investor Relations Manager
+49 69 690-74844
Maximilian Schultheis
Financial Reporting Manager
+49 69 690-29996
Tanja Nagel
Financial Reporting Manager
+49 69 690-74846