Embed Size (px)
Citation preview
Analyst Presentation
October 24, 2013
www.eqt.com 2
EQT Corporation (NYSE: EQT) EQT Plaza 625 Liberty Avenue, Suite 1700 Pittsburgh, PA 15222 Pat Kane - Chief Investor Relations Officer (412) 553-7833
The Securities and Exchange Commission (the "SEC") permits oil and gas companies, in their filings with the SEC, to disclose only proved, probable and possible reserves that a
company anticipates as of a given date to be economically and legally producible and deliverable by application of development projects to known accumulations. We use certain
terms in this presentation, such as “EUR” (estimated ultimate recovery), “3P” (proved, probable and possible) and total resource potential, that the SEC's rules strictly prohibit us
from including in filings with the SEC. We caution you that the SEC views such estimates as inherently unreliable and these estimates may be misleading to investors unless the
investor is an expert in the natural gas industry. We also note that the SEC strictly prohibits us from aggregating proved, probable and possible reserves in filings with the SEC
due to the different levels of certainty associated with each reserve category.
Disclosures in this presentation contain certain forward-looking statements. Statements that do not relate strictly to historical or current facts are forward-looking. Without limiting
the generality of the foregoing, forward-looking statements contained in this presentation specifically include the expectations of plans, strategies, objectives and growth and
anticipated financial and operational performance of the company and its subsidiaries, including guidance regarding the company’s strategy to develop its Marcellus and other
reserves; drilling plans and programs (including spacing, such as the use of reduced cluster spacing, the number, type, average lateral length, and location of wells to be drilled,
the conversion of drilling rigs to utilize natural gas and the availability of capital to complete these plans and programs); natural gas prices, including liquids price uplift and basis;
total resource potential, reserves, EUR, expected decline curve, reserve replacement ratio, reserves to production ratio, and production sales volume and growth rates (including
liquids sales volume and growth rates and the projected additional production sales volume attributable to the Marcellus wells acquired from Chesapeake Energy Corporation
(Chesapeake)); internal rate of return (IRR), compound annual growth rate (CAGR) and expected after-tax returns per well; F&D costs, operating costs, unit costs, well costs and
EQT Midstream costs; gathering and transmission volume and growth rates; processing capacity; infrastructure programs (including the timing, cost and capacity of the
transmission and gathering expansion projects); technology (including drilling techniques); projected EQT Midstream EBITDA and growth rates; projected EQT Midstream
Partners, LP (EQT Midstream Partners) EBITDA and the cash flows resulting from, and the value of, the company’s general partner and limited partner interests and incentive
distribution rights in EQT Midstream Partners; monetization transactions, including midstream asset sales (dropdowns) to EQT Midstream Partners and other asset sales and
joint ventures or other transactions involving the company’s assets (including the timing of receipt, if at all, of any additional consideration from EQT Midstream Partners for new
transportation agreements entered into by EQT Midstream Partners on the Sunrise Pipeline); the proposed transfer of Equitable Gas Company, LLC (Equitable Gas) to Peoples
Natural Gas (Peoples); the timing of receipt of required approvals for the proposed Equitable Gas transaction; the expected form and amount of midstream assets to be
exchanged in the Equitable Gas transaction; the expected EBITDA to be generated from the midstream assets and commercial arrangements transferred by or entered into with
Peoples or its affiliates; uses of capital provided by the Sunrise Pipeline and Equitable Gas transactions; the number of developable acres acquired from Chesapeake; projected
capital expenditures; liquidity and financing requirements, including funding sources and availability; projected operating revenues and cash flows; hedging strategy; the effects of
government regulation and litigation; the annual dividend rate; the expected economics of public-access natural gas refueling stations; and tax position (including the company’s
ability to complete like-kind exchanges and projected tax rates.) These forward-looking statements involve risks and uncertainties that could cause actual results to differ
materially from projected results. Accordingly, investors should not place undue reliance on forward-looking statements as a prediction of actual results. The company has based
these forward-looking statements on current expectations and assumptions about future events. While the company considers these expectations and assumptions to be
reasonable, they are inherently subject to significant business, economic, competitive, regulatory and other risks and uncertainties, most of which are difficult to predict and many
of which are beyond the company’s control. With respect to the proposed Equitable Gas transaction, these risks and uncertainties include, among others, the ability to obtain
regulatory approvals for the transaction on the proposed terms and schedule; disruption to the company's business, including customer, employee and supplier relationships
resulting from the transaction; and risks that the conditions to closing may not be satisfied. The risks and uncertainties that may affect the operations, performance and results of
the company’s business and forward-looking statements include, but are not limited to, those set forth under Item 1A, “Risk Factors” of the company’s Form 10-K for the year
ended December 31, 2012, as updated by any subsequent Form 10-Qs. Any forward-looking statement speaks only as of the date on which such statement is made and the
company does not intend to correct or update any forward-looking statement, whether as a result of new information, future events or otherwise.
EQT Cautionary Statements
The Company uses adjusted EQT Midstream EBITDA as a financial measure in this presentation. Adjusted EQT Midstream EBITDA is defined as EQT Midstream operating income (loss) plus depreciation and amortization expense less gains on dispositions. Adjusted EQT Midstream EBITDA also excludes EQT Midstream results associated with the Big Sandy Pipeline and Langley processing facility. Adjusted EQT Midstream EBITDA is not a financial measure calculated in accordance with generally accepted accounting principles (GAAP). Adjusted EQT Midstream EBITDA is a non-GAAP supplemental financial measure that Company management and external users of the Company’s financial statements, such as industry analysts, investors, lenders and rating agencies, may use to assess: (i) the Company’s performance versus prior periods; (ii) the Company’s operating performance as compared to other companies in its industry; (iii) the ability of the Company’s assets to generate sufficient cash flow to make distributions to its investors; (iv) the Company’s ability to incur and service debt and fund capital expenditures; and (v) the viability of acquisitions and other capital expenditure projects and the returns on investment of various investment opportunities.
The Company believes that the presentation of adjusted EQT Midstream EBITDA in this presentation provides useful information in assessing its financial condition and results of operations. Adjusted EQT Midstream EBITDA should not be considered as an alternative to operating income or any other measure of financial performance or liquidity presented in accordance with GAAP. Adjusted EQT Midstream EBITDA has important limitations as an analytical tool because it excludes some but not all items that affect operating income. Additionally, because adjusted EQT Midstream EBITDA may be defined differently by other companies in the Company’s industry, the Company’s definition of adjusted EQT Midstream EBITDA will most likely not be comparable to similarly titled measures of other companies, thereby diminishing the utility of the measure. Please see the Appendix for reconciliations of adjusted EQT Midstream EBITDA to operating income, its most directly comparable financial measure calculated and presented in accordance with GAAP.
EQT is unable to provide a reconciliation of projected EBITDA to projected net income, the most comparable financial measure calculated in accordance with GAAP, due to the unknown effect, timing and potential significance of certain income statement items.
www.eqt.com 3
EQT Non-GAAP Measures
Calculations Within This Presentation
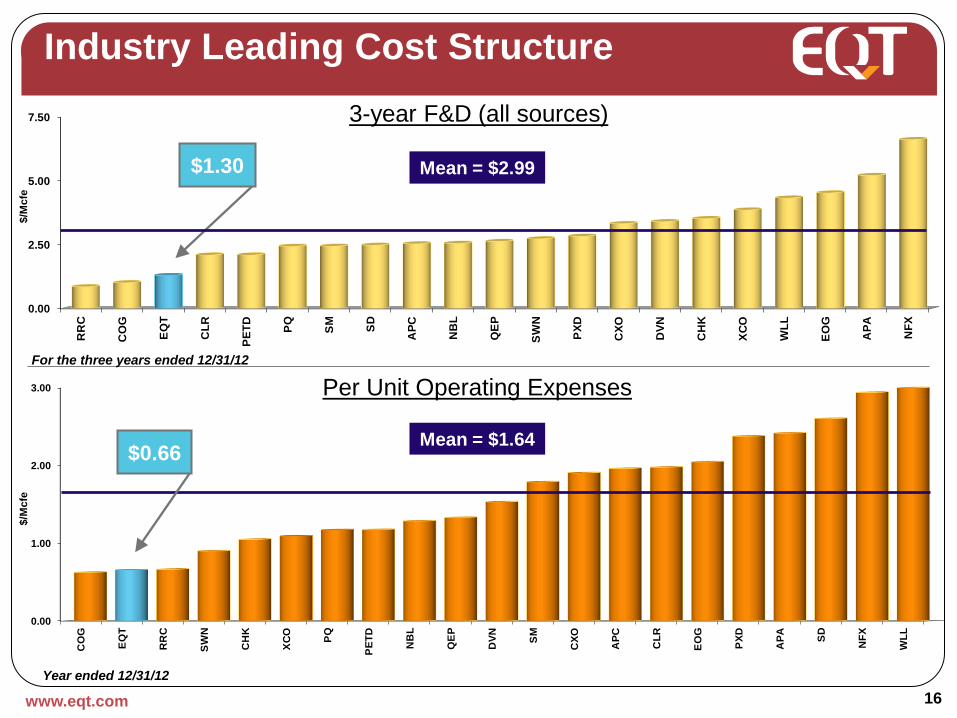
Finding and development costs (F&D costs) from all sources for peer companies presented in this presentation are calculated as the cost incurred, relating to natural gas and oil activities in accordance with Financial Accounting Standards Board Accounting Standards Codification 932 (ASC 932), divided by the sum of extensions, discoveries and other additions; purchase of natural gas and oil in place; and revisions of previous estimates, as provided for years 2010 – 2012.
Per unit operating expenses are calculated by dividing the sum of lease operating expenses, production taxes and the gathering and transmission costs for equity gas, by production sales volumes for the same period. Per unit operating expenses in the presentation are calculated for the year ended December 31, 2012.
www.eqt.com 4
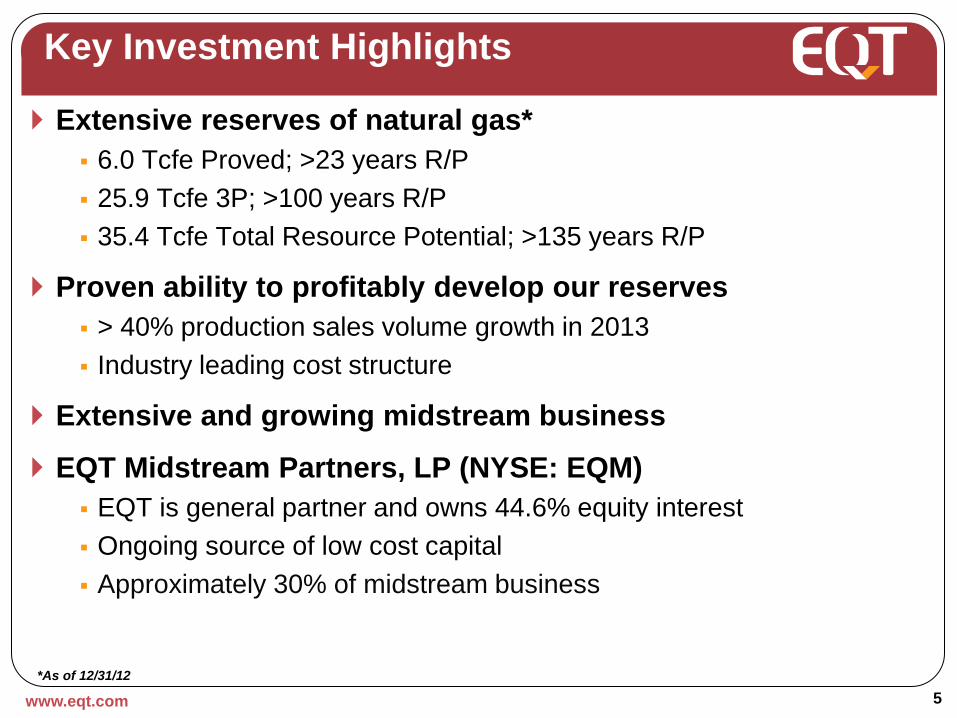
Key Investment Highlights
Extensive reserves of natural gas*
6.0 Tcfe Proved; >23 years R/P
25.9 Tcfe 3P; >100 years R/P
35.4 Tcfe Total Resource Potential; >135 years R/P
Proven ability to profitably develop our reserves
> 40% production sales volume growth in 2013
Industry leading cost structure
Extensive and growing midstream business
EQT Midstream Partners, LP (NYSE: EQM)
EQT is general partner and owns 44.6% equity interest
Ongoing source of low cost capital
Approximately 30% of midstream business
www.eqt.com 5
*As of 12/31/12
www.eqt.com 6
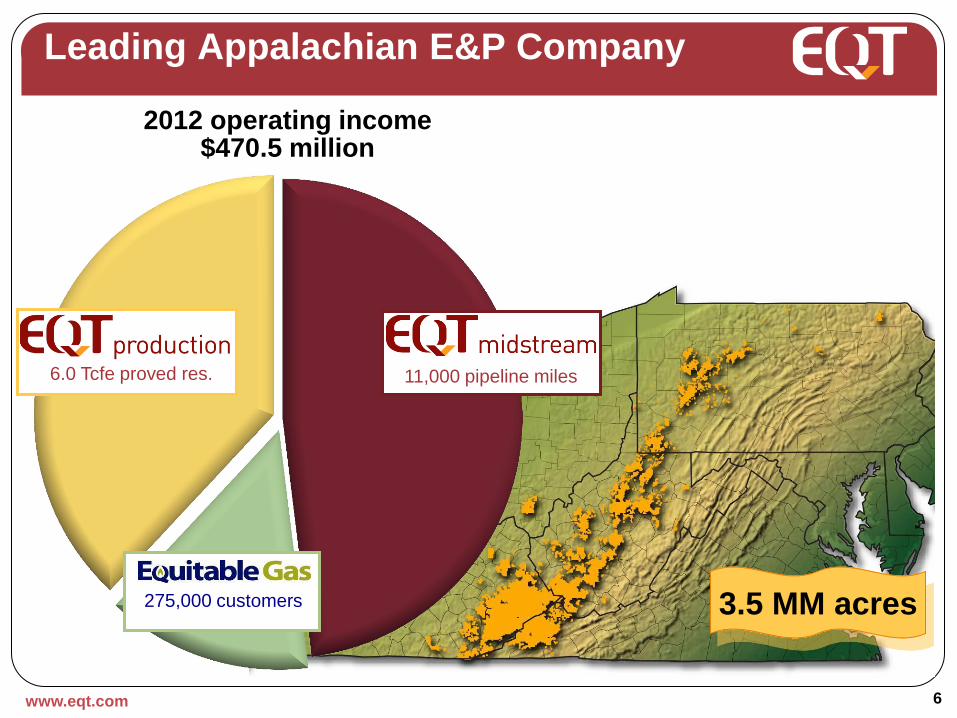
275,000 customers
6.0 Tcfe proved res. 11,000 pipeline miles
3.5 MM acres
2012 operating income $470.5 million
Leading Appalachian E&P Company
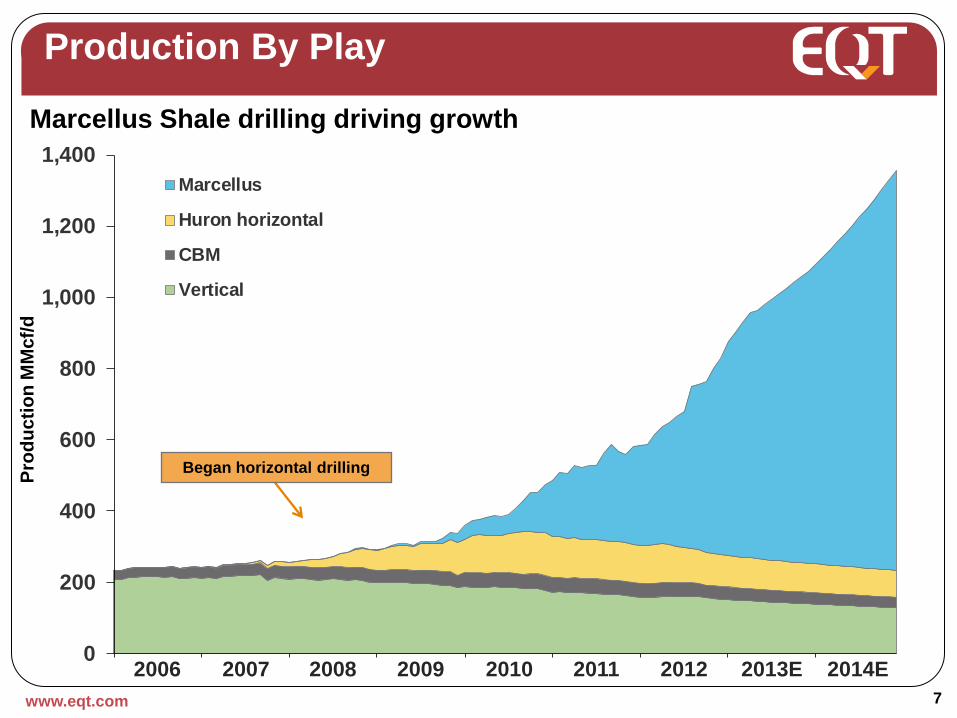
Marcellus Shale drilling driving growth
Production By Play
www.eqt.com 7
0
200
400
600
800
1,000
1,200
1,400
Marcellus
Huron horizontal
CBM
Vertical
Pro
du
cti
on
MM
cf/
d
Began horizontal drilling
2006 2007 2008 2009 2010 2011 2012 2013E 2014E
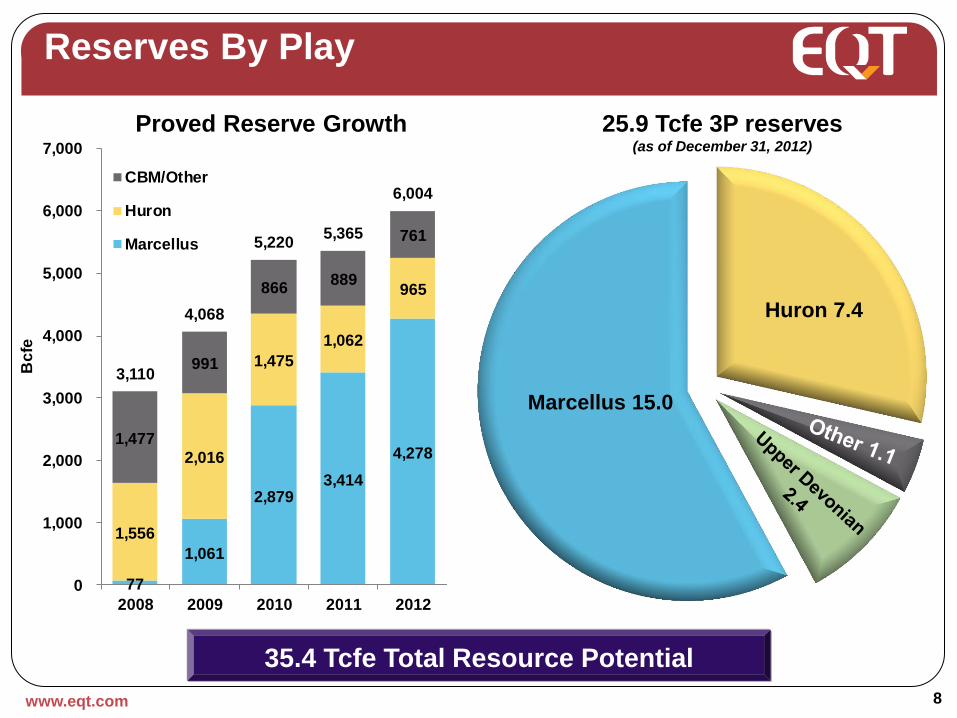
Reserves By Play
www.eqt.com 8
Marcellus 15.0
Huron 7.4
Other 0.8
25.9 Tcfe 3P reserves (as of December 31, 2012)
35.4 Tcfe Total Resource Potential
77
1,061
2,879 3,414
4,278
1,556
2,016
1,475
1,062
965
1,477
991
866 889
761
3,110
4,068
5,220 5,365
6,004
0
1,000
2,000
3,000
4,000
5,000
6,000
7,000
2008 2009 2010 2011 2012
Bc
fe
CBM/Other
Huron
Marcellus
Proved Reserve Growth
www.eqt.com 9
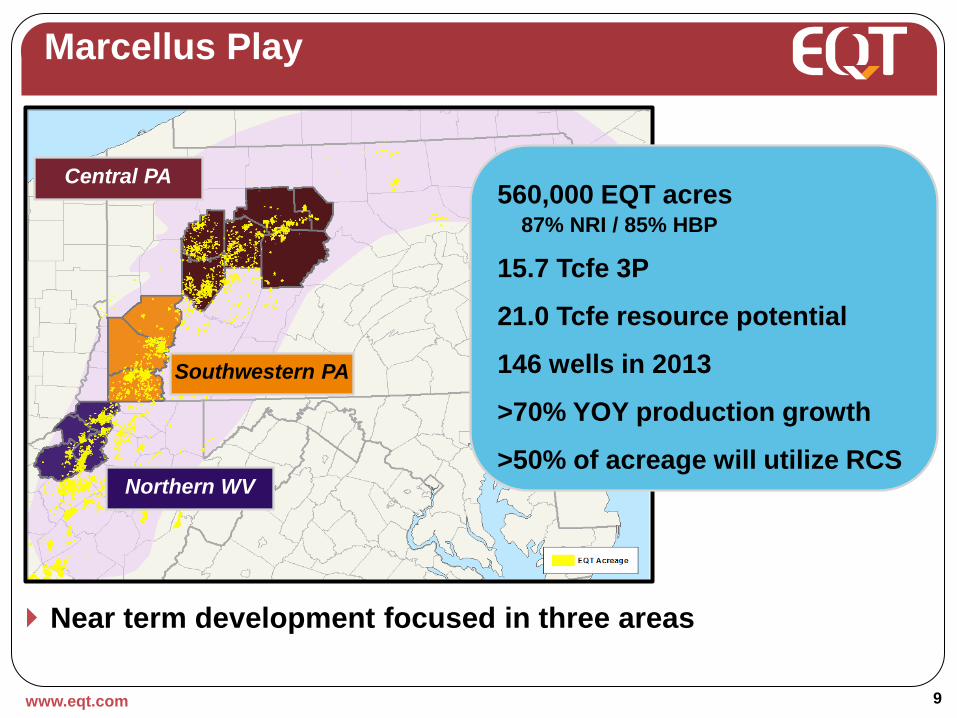
560,000 EQT acres 87% NRI / 85% HBP
15.7 Tcfe 3P
21.0 Tcfe resource potential
146 wells in 2013
>70% YOY production growth
>50% of acreage will utilize RCS
Marcellus Play
Central PA
Southwestern PA
Northern WV
Near term development focused in three areas
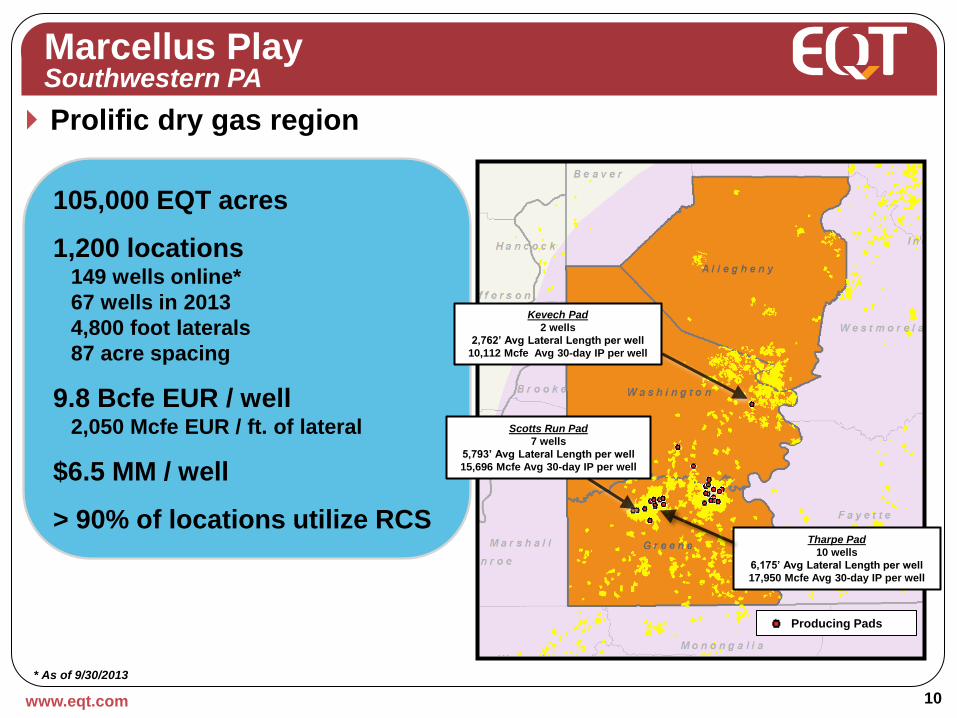
105,000 EQT acres
1,200 locations 149 wells online*
67 wells in 2013
4,800 foot laterals
87 acre spacing
9.8 Bcfe EUR / well 2,050 Mcfe EUR / ft. of lateral
$6.5 MM / well
> 90% of locations utilize RCS
Prolific dry gas region
www.eqt.com 10
* As of 9/30/2013
Marcellus Play Southwestern PA
Producing Pads
Tharpe Pad
10 wells
6,175’ Avg Lateral Length per well
17,950 Mcfe Avg 30-day IP per well
Scotts Run Pad
7 wells
5,793’ Avg Lateral Length per well
15,696 Mcfe Avg 30-day IP per well
Kevech Pad
2 wells
2,762’ Avg Lateral Length per well
10,112 Mcfe Avg 30-day IP per well
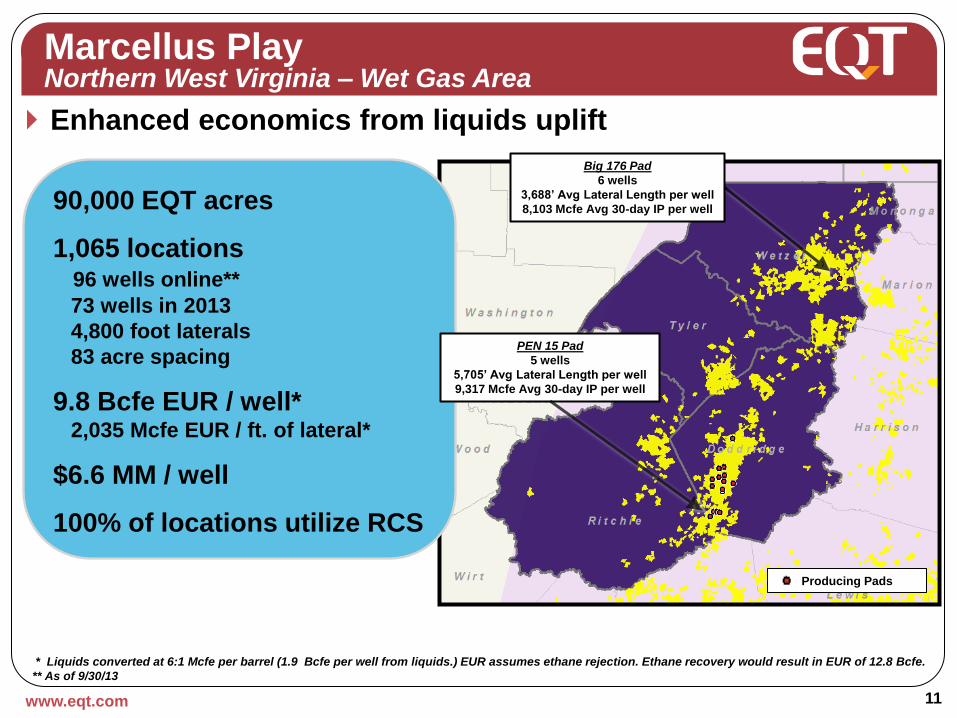
Enhanced economics from liquids uplift
www.eqt.com 11
90,000 EQT acres
1,065 locations 96 wells online**
73 wells in 2013
4,800 foot laterals
83 acre spacing
9.8 Bcfe EUR / well* 2,035 Mcfe EUR / ft. of lateral*
$6.6 MM / well
100% of locations utilize RCS
Marcellus Play Northern West Virginia – Wet Gas Area
* Liquids converted at 6:1 Mcfe per barrel (1.9 Bcfe per well from liquids.) EUR assumes ethane rejection. Ethane recovery would result in EUR of 12.8 Bcfe.
** As of 9/30/13
Producing Pads
Big 176 Pad
6 wells
3,688’ Avg Lateral Length per well
8,103 Mcfe Avg 30-day IP per well
PEN 15 Pad
5 wells
5,705’ Avg Lateral Length per well
9,317 Mcfe Avg 30-day IP per well
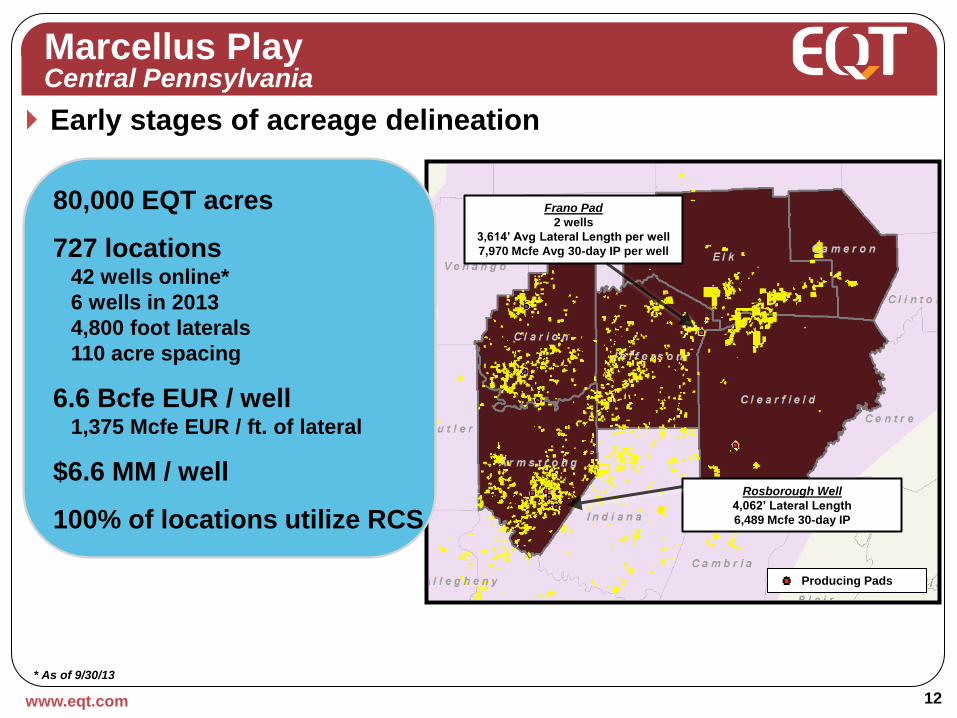
Early stages of acreage delineation
www.eqt.com 12
80,000 EQT acres
727 locations 42 wells online*
6 wells in 2013
4,800 foot laterals
110 acre spacing
6.6 Bcfe EUR / well 1,375 Mcfe EUR / ft. of lateral
$6.6 MM / well
100% of locations utilize RCS
Marcellus Play Central Pennsylvania
* As of 9/30/13
Producing Pads
Frano Pad
2 wells
3,614’ Avg Lateral Length per well
7,970 Mcfe Avg 30-day IP per well
Rosborough Well
4,062’ Lateral Length
6,489 Mcfe 30-day IP
0%
50%
100%
150%
200%
250%
$3.00 $3.50 $4.00 $4.50 $5.00
Wellhead After OpEx After Tax
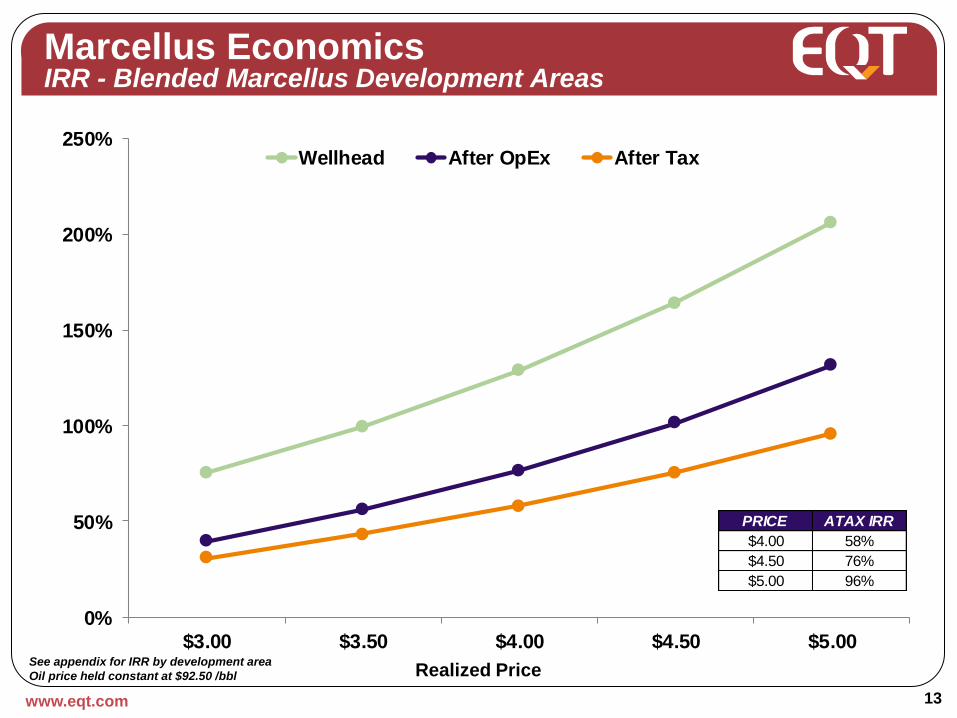
www.eqt.com 13
Marcellus Economics IRR - Blended Marcellus Development Areas
See appendix for IRR by development area
Oil price held constant at $92.50 /bbl Realized Price
PRICE ATAX IRR
$4.00 58%
$4.50 76%
$5.00 96%
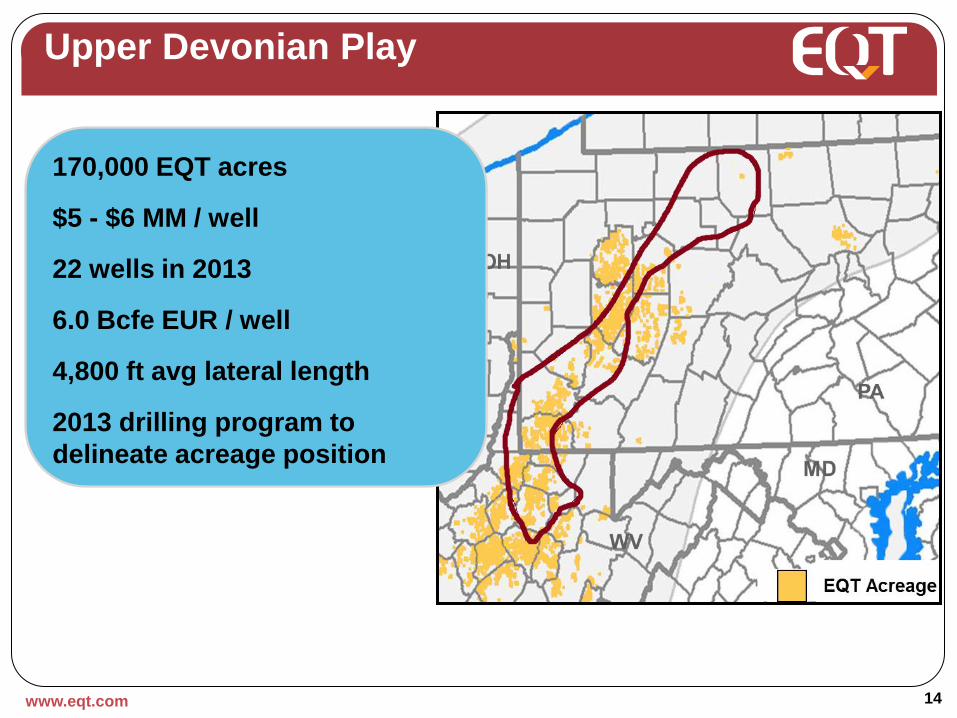
Upper Devonian Play
14
170,000 EQT acres
$5 - $6 MM / well
22 wells in 2013
6.0 Bcfe EUR / well
4,800 ft avg lateral length
2013 drilling program to
delineate acreage position
www.eqt.com
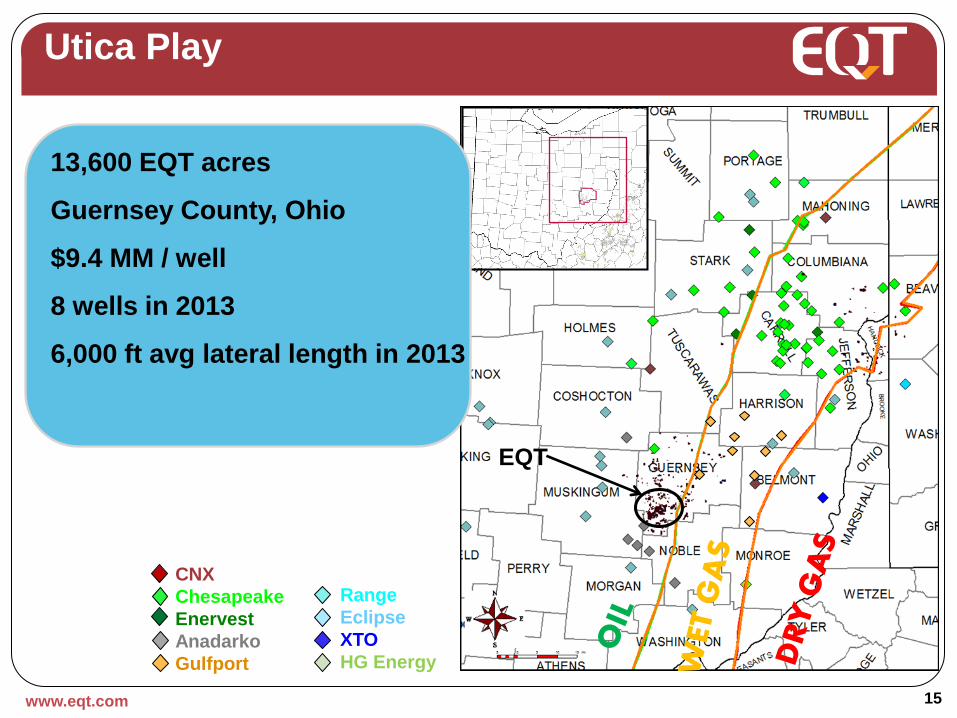
Utica Play
15
Range
Eclipse
XTO
HG Energy
CNX
Chesapeake
Enervest
Anadarko
Gulfport
EQT
www.eqt.com
13,600 EQT acres
Guernsey County, Ohio
$9.4 MM / well
8 wells in 2013
6,000 ft avg lateral length in 2013
0.00
1.00
2.00
3.00
CO
G
EQ
T
RR
C
SW
N
CH
K
XC
O
PQ
PE
TD
NB
L
QE
P
DV
N
SM
CX
O
AP
C
CL
R
EO
G
PX
D
AP
A
SD
NF
X
WL
L
0.00
2.50
5.00
7.50
RR
C
CO
G
EQ
T
CL
R
PE
TD
PQ
SM
SD
AP
C
NB
L
QE
P
SW
N
PX
D
CX
O
DV
N
CH
K
XC
O
WL
L
EO
G
AP
A
NF
X
Industry Leading Cost Structure
www.eqt.com 16
$/M
cfe
$/M
cfe
3-year F&D (all sources)
Per Unit Operating Expenses
Mean = $1.64
Mean = $2.99 $1.30
$0.66
For the three years ended 12/31/12
Year ended 12/31/12
0
500
1,000
1,500
2,000
2,500
3,000
3,500
4,000
4,500
5,000
2008 2009 2010 2011 2012 2013E
Mb
bls
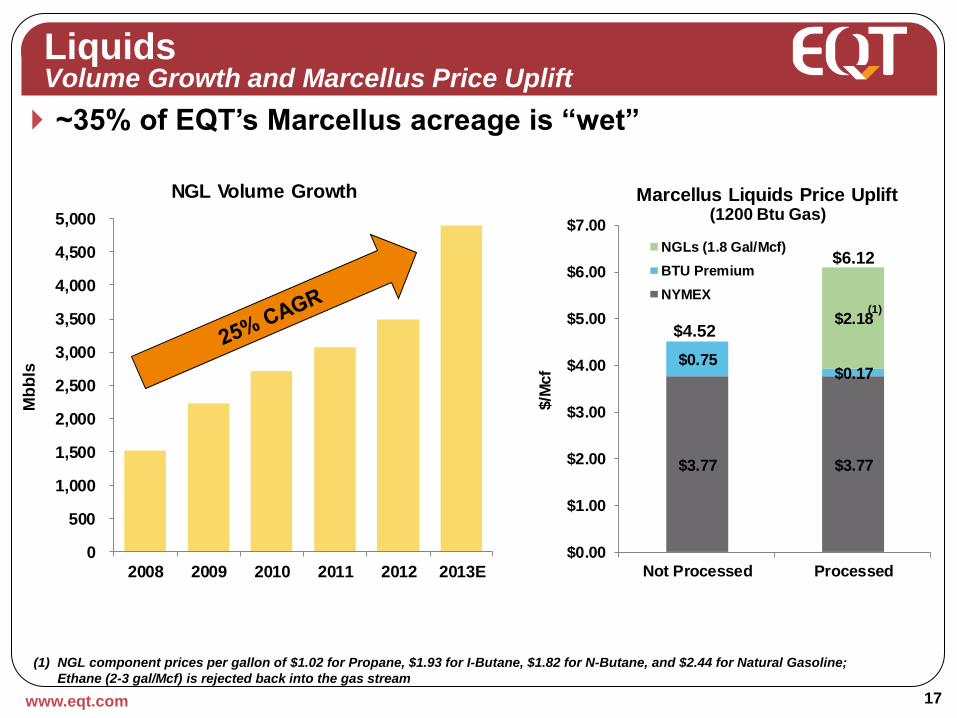
NGL Volume Growth
Liquids Volume Growth and Marcellus Price Uplift
17
(1) NGL component prices per gallon of $1.02 for Propane, $1.93 for I-Butane, $1.82 for N-Butane, and $2.44 for Natural Gasoline;
Ethane (2-3 gal/Mcf) is rejected back into the gas stream
~35% of EQT’s Marcellus acreage is “wet”
www.eqt.com
$3.77 $3.77
$0.75$0.17
$2.18
$0.00
$1.00
$2.00
$3.00
$4.00
$5.00
$6.00
$7.00
Not Processed Processed
$/M
cf
Marcellus Liquids Price Uplift(1200 Btu Gas)
NGLs (1.8 Gal/Mcf)
BTU Premium
NYMEX
$4.52
$6.12
(1)
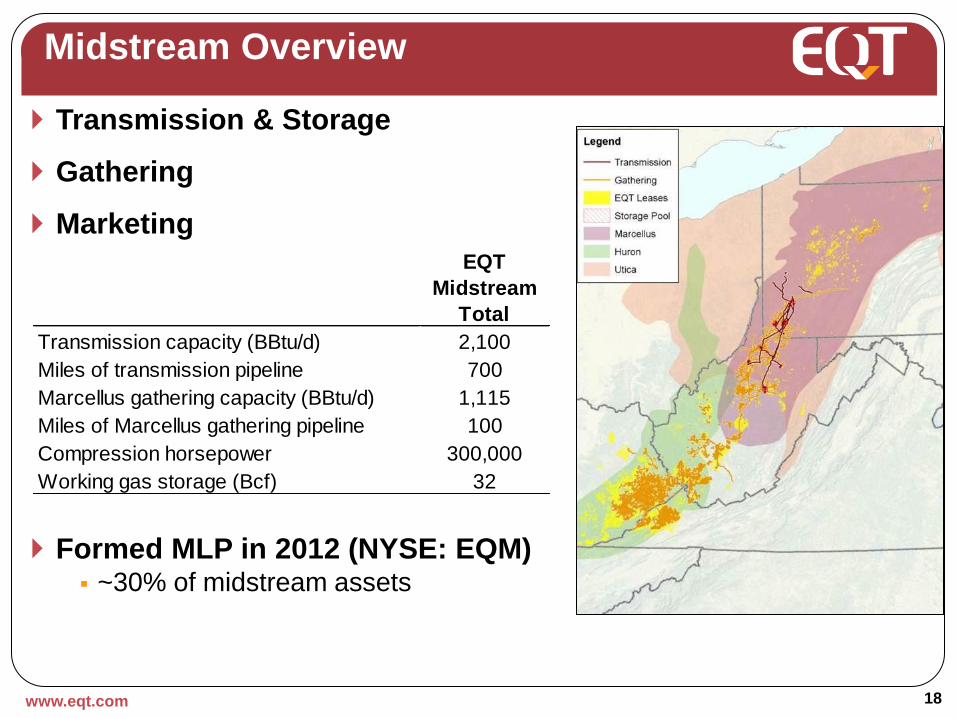
Midstream Overview
18
Transmission & Storage
Gathering
Marketing
Formed MLP in 2012 (NYSE: EQM) ~30% of midstream assets
EQT
Midstream
Total
Transmission capacity (BBtu/d) 2,100
Miles of transmission pipeline 700
Marcellus gathering capacity (BBtu/d) 1,115
Miles of Marcellus gathering pipeline 100
Compression horsepower 300,000
Working gas storage (Bcf) 32
www.eqt.com
0
100
200
300
400
$0
$100
$200
$300
$400
2008 2009 2010 2011 2012 2013E
EQT Midstream
EQT Midstream Partners, LP
Production Sales Volumes (Bcfe)
*Based on revenues
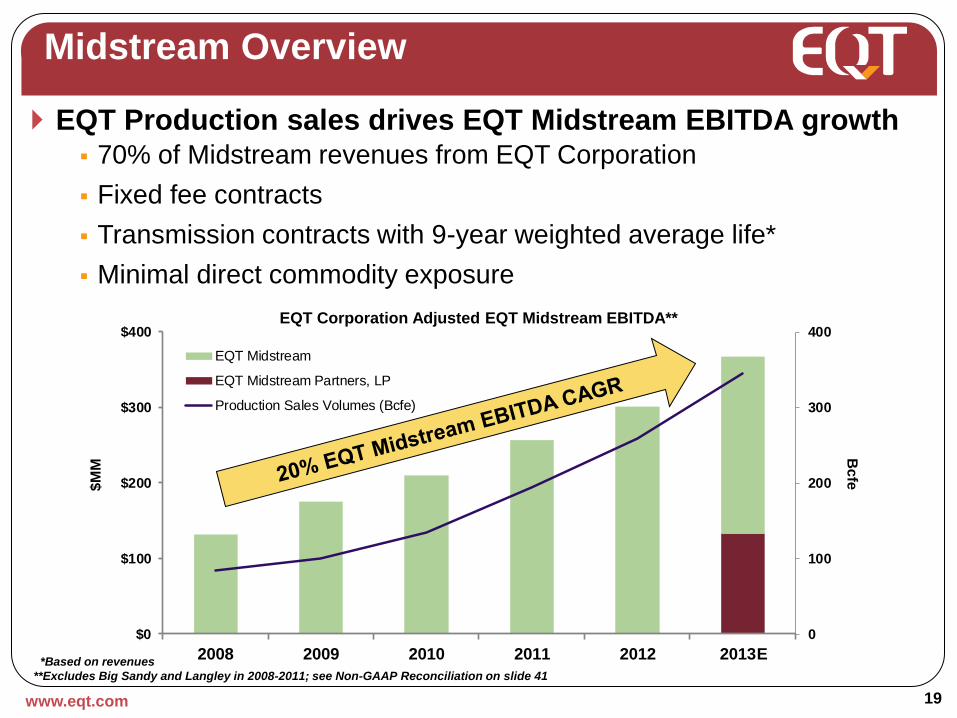
**Excludes Big Sandy and Langley in 2008-2011; see Non-GAAP Reconciliation on slide 41
Midstream Overview
www.eqt.com 19
EQT Production sales drives EQT Midstream EBITDA growth 70% of Midstream revenues from EQT Corporation
Fixed fee contracts
Transmission contracts with 9-year weighted average life*
Minimal direct commodity exposure
Bc
fe $
MM
EQT Corporation Adjusted EQT Midstream EBITDA**
EQT Midstream Partners, LP (NYSE: EQM)
www.eqt.com 20
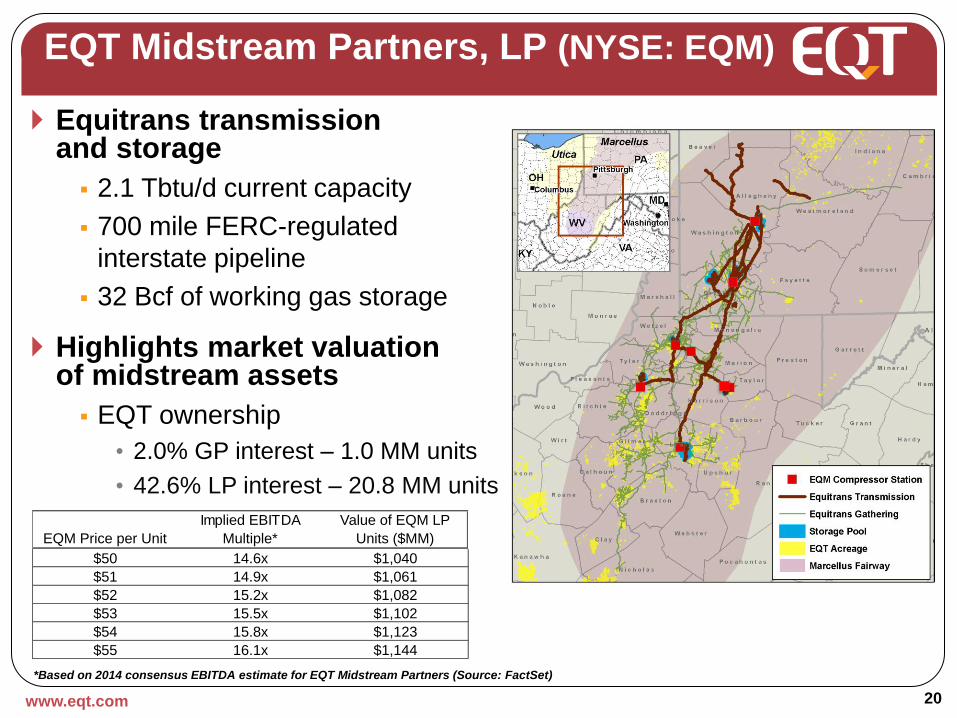
*Based on 2014 consensus EBITDA estimate for EQT Midstream Partners (Source: FactSet)
Equitrans transmission and storage
2.1 Tbtu/d current capacity
700 mile FERC-regulated
interstate pipeline
32 Bcf of working gas storage
Highlights market valuation of midstream assets
EQT ownership
• 2.0% GP interest – 1.0 MM units
• 42.6% LP interest – 20.8 MM units
EQM Price per Unit
Implied EBITDA
Multiple*
Value of EQM LP
Units ($MM)
$50 14.6x $1,040
$51 14.9x $1,061
$52 15.2x $1,082
$53 15.5x $1,102
$54 15.8x $1,123
$55 16.1x $1,144
www.eqt.com 21
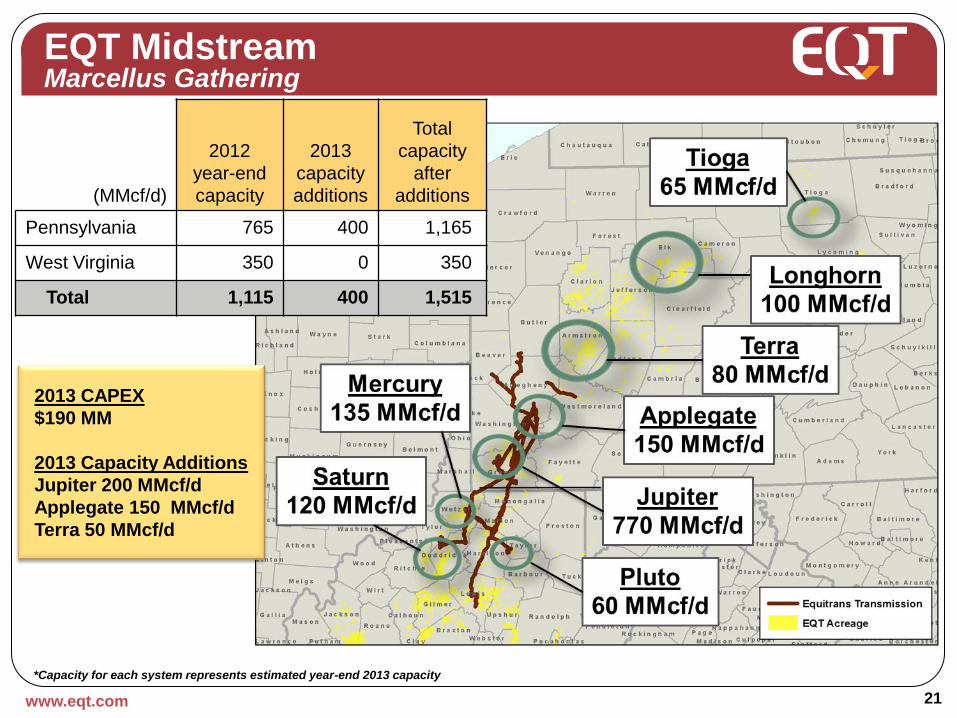
EQT Midstream Marcellus Gathering
(MMcf/d)
2012
year-end
capacity
2013
capacity
additions
Total
capacity
after
additions
Pennsylvania 765 400 1,165
West Virginia 350 0 350
Total 1,115 400 1,515
*Capacity for each system represents estimated year-end 2013 capacity
2013 CAPEX
$190 MM
2013 Capacity Additions
Jupiter 200 MMcf/d
Applegate 150 MMcf/d
Terra 50 MMcf/d
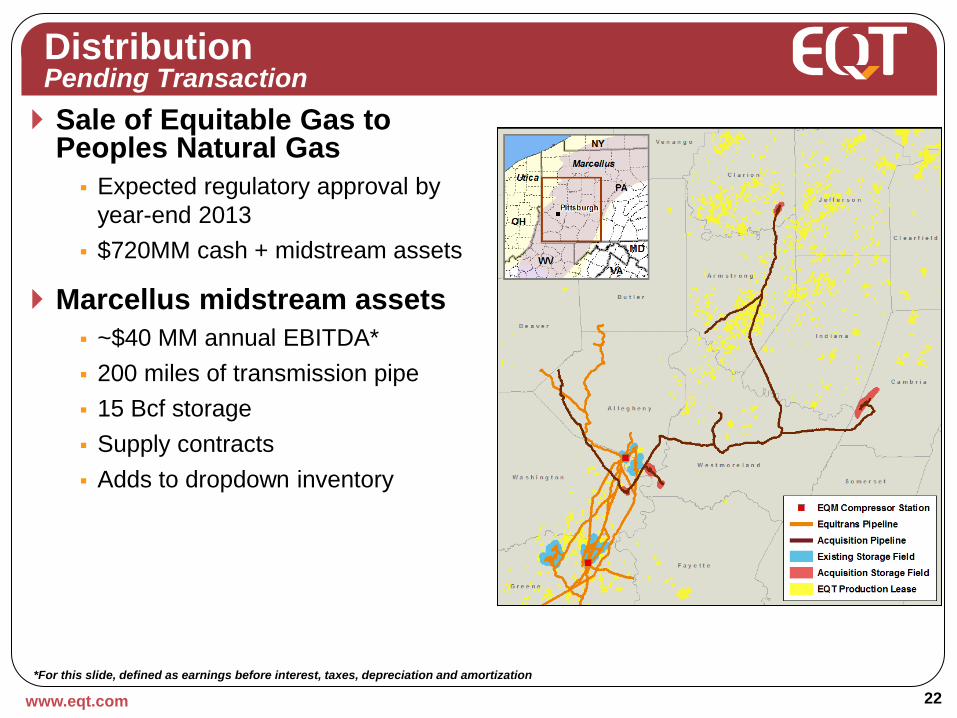
Sale of Equitable Gas to Peoples Natural Gas
Expected regulatory approval by
year-end 2013
$720MM cash + midstream assets
Marcellus midstream assets
~$40 MM annual EBITDA*
200 miles of transmission pipe
15 Bcf storage
Supply contracts
Adds to dropdown inventory
Distribution Pending Transaction
www.eqt.com 22
*For this slide, defined as earnings before interest, taxes, depreciation and amortization
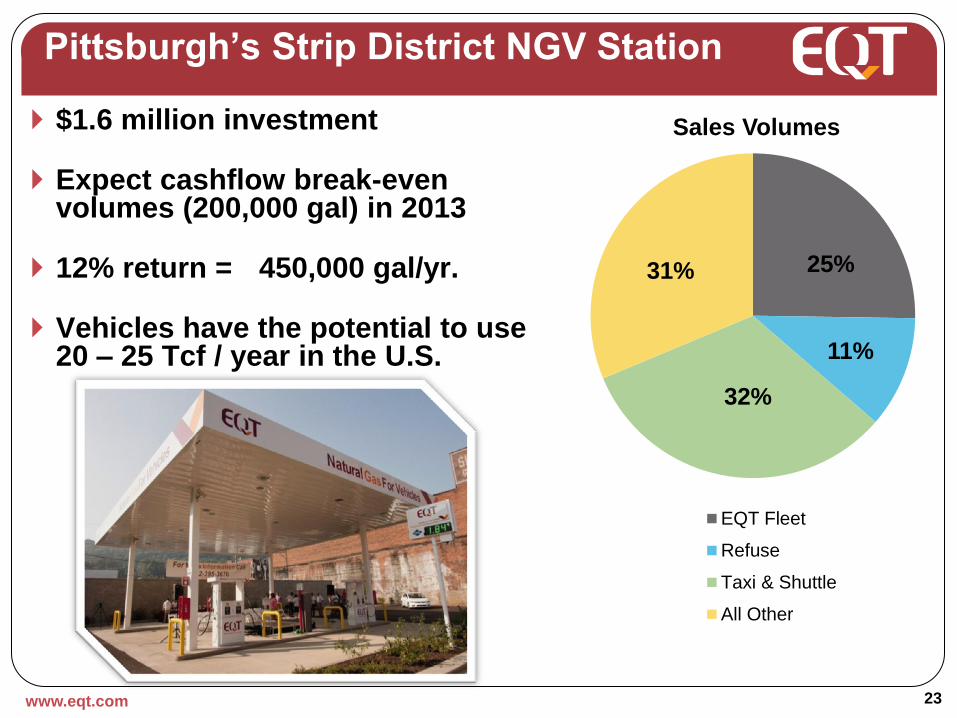
$1.6 million investment
Expect cashflow break-even volumes (200,000 gal) in 2013
12% return = 450,000 gal/yr.
Vehicles have the potential to use 20 – 25 Tcf / year in the U.S.
www.eqt.com 23
Pittsburgh’s Strip District NGV Station
25%
11%
32%
31%
Sales Volumes
EQT Fleet
Refuse
Taxi & Shuttle
All Other
Corporate Citizenship
Safety – Our first priority
All accidents are preventable
Company goal = zero incidents
Committed to:
The environment
Our employees and contractors
The communities where we drill and work
• EQT Foundation charitable giving of >$4 million / year
• More than $20 million / year in state and local taxes
www.eqt.com 24
Drilling and Hydraulic Fracturing
EQT meets or exceeds all federal, state and local regulations
Industry leading spill prevention plans and results
Supports the disclosure of frac fluid additives
Utilize multiple barriers to protect drinking water supplies
Pre-drilling water sampling within 2,500’ of drilling locations
Multi-well pads reduce surface impacts
www.eqt.com 25
Investment Summary
Extensive reserves of natural gas
Proven ability to profitably develop our reserves
Committed to maximize shareholder value by:
Accelerating the monetization of our vast reserves
Operating in a safe and environmentally responsible manner
Funding with cash flow and debt capacity
www.eqt.com 26
www.eqt.com 27
Appendix
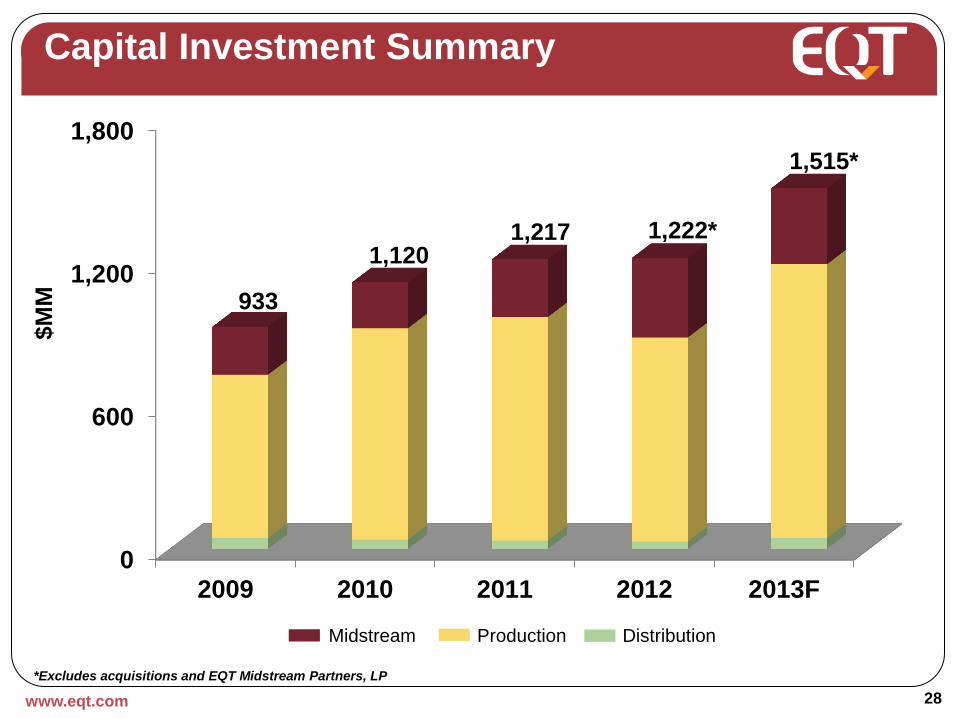
Capital Investment Summary
www.eqt.com 28
*Excludes acquisitions and EQT Midstream Partners, LP
0
600
1,200
1,800
2009 2010 2011 2012 2013F
933
1,120 1,217
Midstream Production Distribution
$M
M
1,222*
1,515*
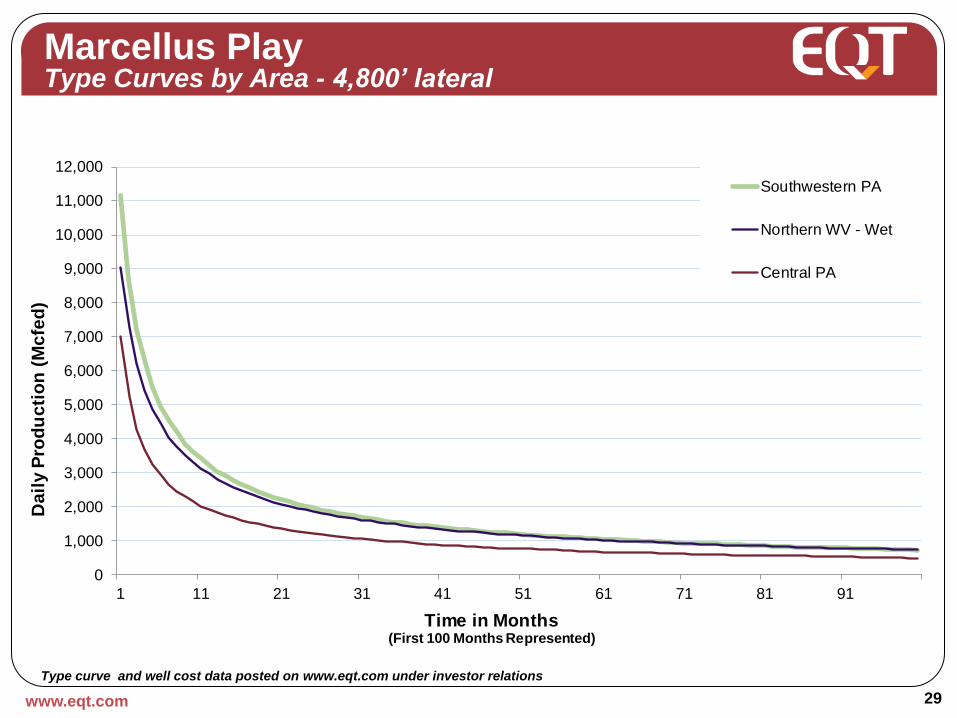
Marcellus Play Type Curves by Area - 4,800’ lateral
www.eqt.com 29
Type curve and well cost data posted on www.eqt.com under investor relations
0
1,000
2,000
3,000
4,000
5,000
6,000
7,000
8,000
9,000
10,000
11,000
12,000
1 11 21 31 41 51 61 71 81 91
Da
ily P
rod
uc
tio
n (
Mc
fed
)
Time in Months (First 100 Months Represented)
Southwestern PA
Northern WV - Wet
Central PA
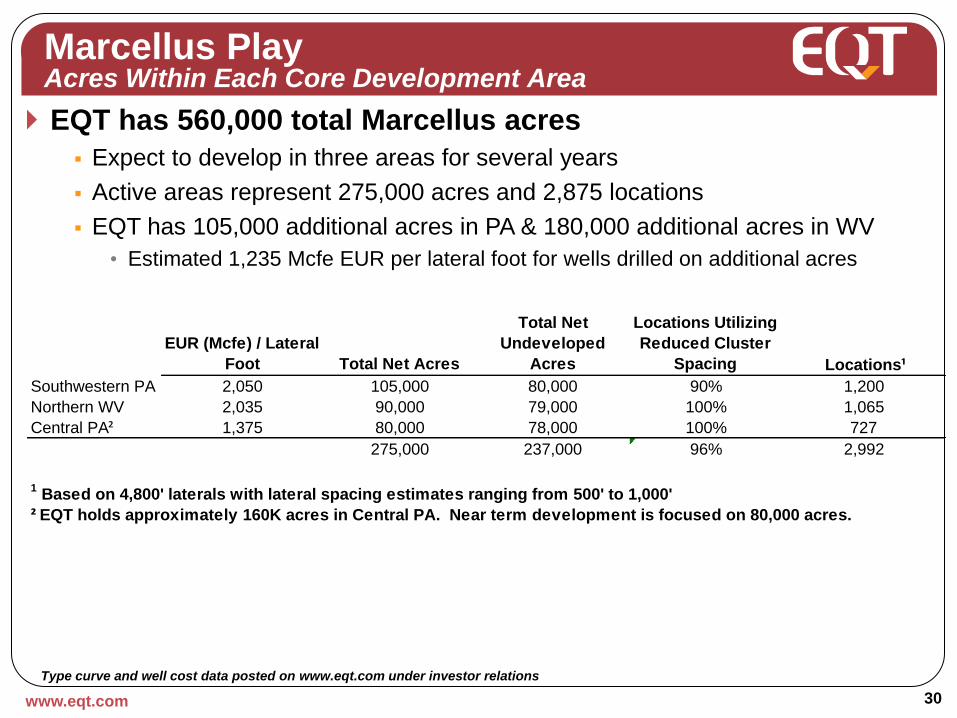
Marcellus Play Acres Within Each Core Development Area
www.eqt.com 30
EQT has 560,000 total Marcellus acres
Expect to develop in three areas for several years
Active areas represent 275,000 acres and 2,875 locations
EQT has 105,000 additional acres in PA & 180,000 additional acres in WV
• Estimated 1,235 Mcfe EUR per lateral foot for wells drilled on additional acres
EUR (Mcfe) / Lateral
Foot Total Net Acres
Total Net
Undeveloped
Acres
Locations Utilizing
Reduced Cluster
Spacing Locations¹
Southwestern PA 2,050 105,000 80,000 90% 1,200
Northern WV 2,035 90,000 79,000 100% 1,065
Central PA² 1,375 80,000 78,000 100% 727
275,000 237,000 96% 2,992
1 Based on 4,800' laterals with lateral spacing estimates ranging from 500' to 1,000'
² EQT holds approximately 160K acres in Central PA. Near term development is focused on 80,000 acres.
Type curve and well cost data posted on www.eqt.com under investor relations
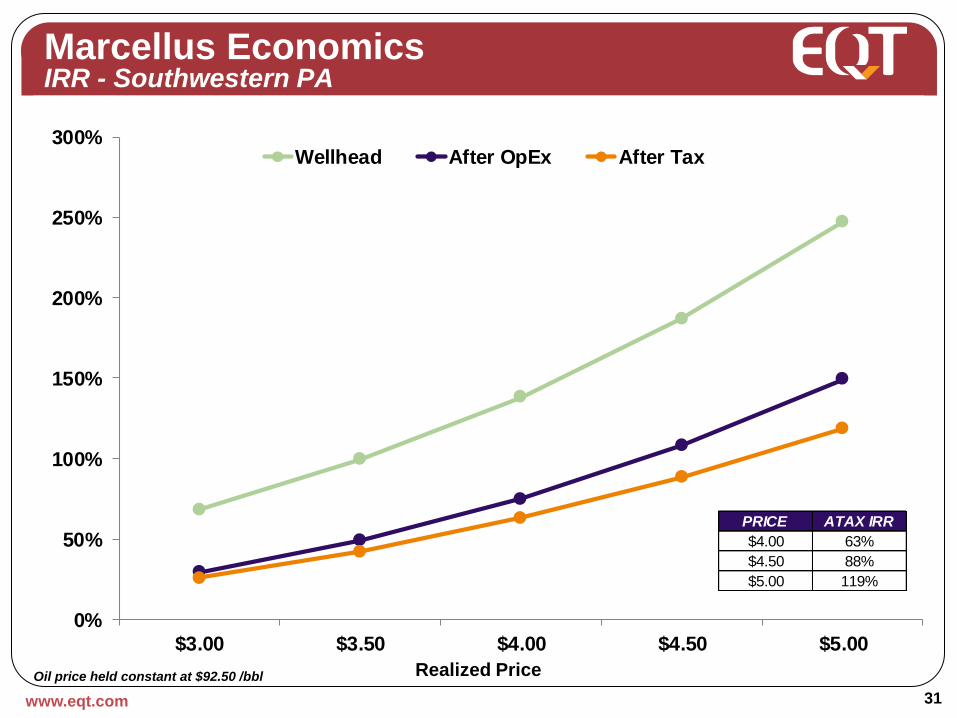
0%
50%
100%
150%
200%
250%
300%
$3.00 $3.50 $4.00 $4.50 $5.00
Wellhead After OpEx After Tax
www.eqt.com 31
Marcellus Economics IRR - Southwestern PA
Oil price held constant at $92.50 /bbl Realized Price
PRICE ATAX IRR
$4.00 63%
$4.50 88%
$5.00 119%
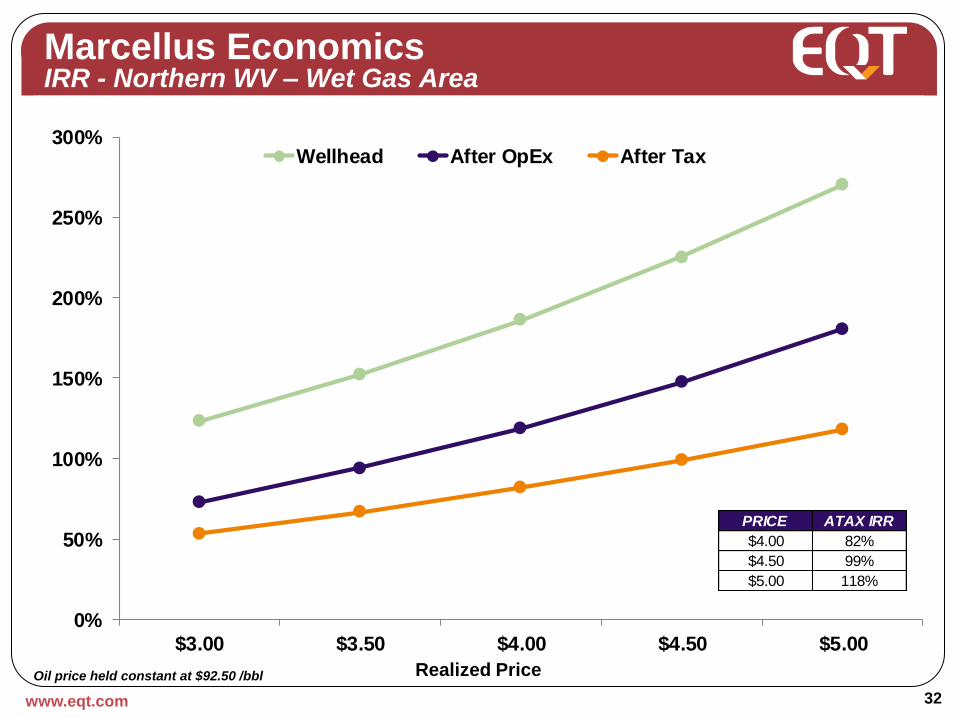
0%
50%
100%
150%
200%
250%
300%
$3.00 $3.50 $4.00 $4.50 $5.00
Wellhead After OpEx After Tax
www.eqt.com 32
Marcellus Economics IRR - Northern WV – Wet Gas Area
Oil price held constant at $92.50 /bbl Realized Price
PRICE ATAX IRR
$4.00 82%
$4.50 99%
$5.00 118%
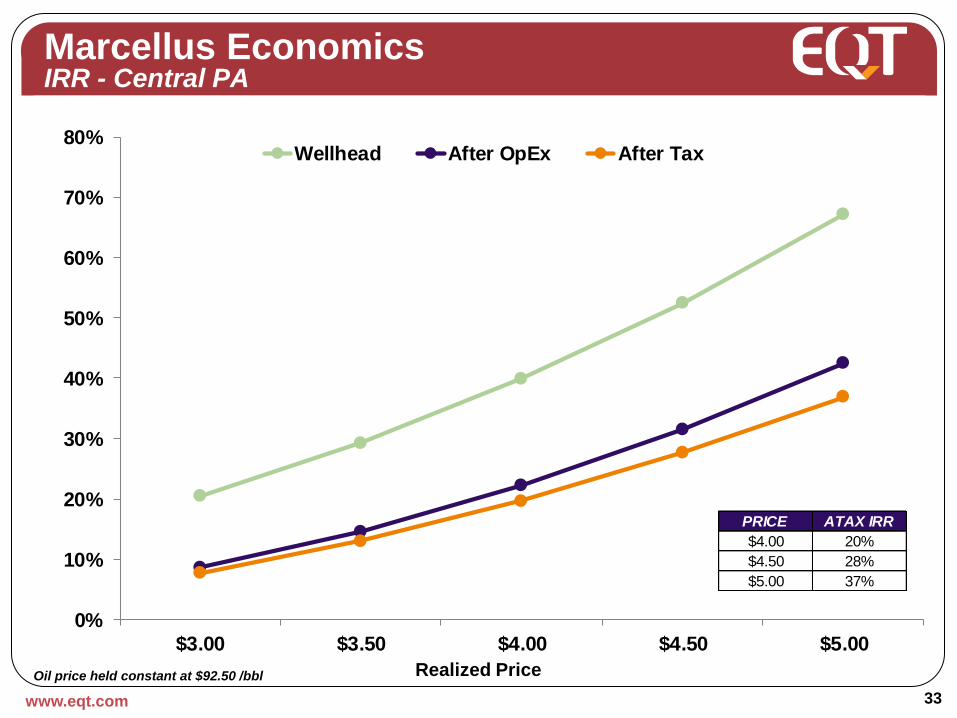
0%
10%
20%
30%
40%
50%
60%
70%
80%
$3.00 $3.50 $4.00 $4.50 $5.00
Wellhead After OpEx After Tax
www.eqt.com 33
Marcellus Economics IRR - Central PA
Oil price held constant at $92.50 /bbl Realized Price
PRICE ATAX IRR
$4.00 20%
$4.50 28%
$5.00 37%
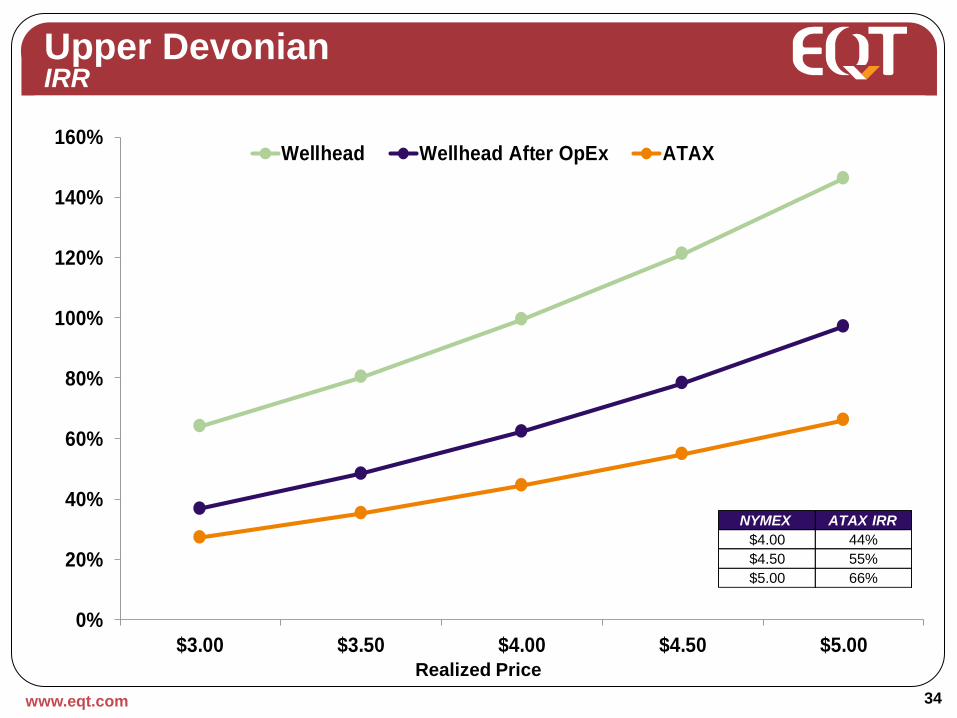
Upper Devonian IRR
www.eqt.com 34
Realized Price
0%
20%
40%
60%
80%
100%
120%
140%
160%
$3.00 $3.50 $4.00 $4.50 $5.00
Wellhead Wellhead After OpEx ATAX
NYMEX ATAX IRR
$4.00 44%
$4.50 55%
$5.00 66%
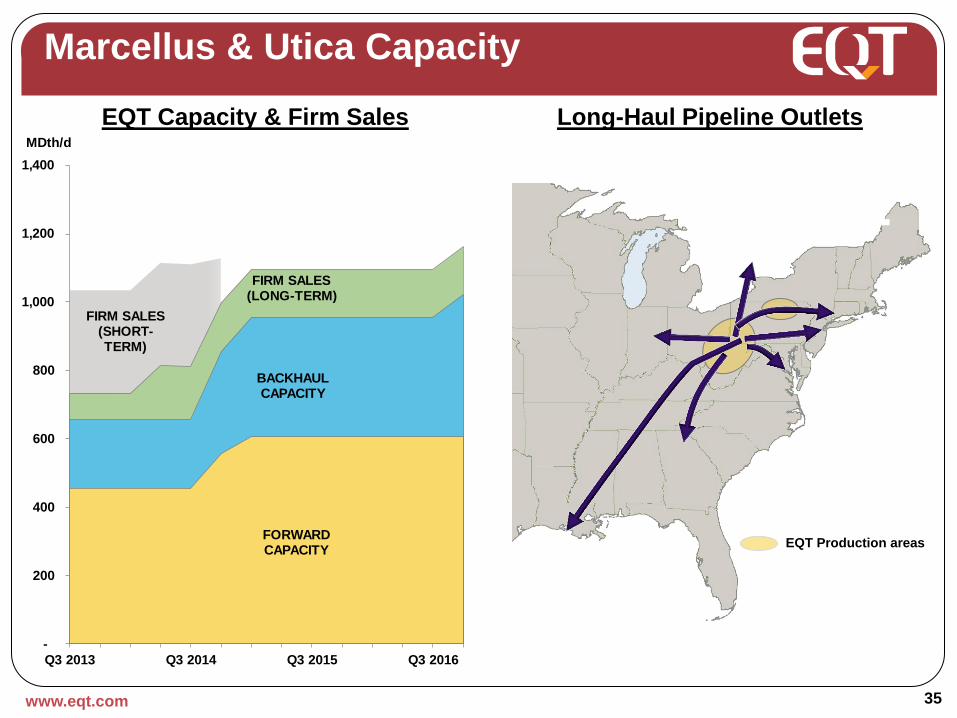
Marcellus & Utica Capacity
www.eqt.com 35
EQT Capacity & Firm Sales Long-Haul Pipeline Outlets
FIRM SALES (SHORT-TERM)
FIRM SALES (LONG-TERM)
BACKHAUL CAPACITY
FORWARD CAPACITY
-
200
400
600
800
1,000
1,200
1,400
Q3 2013 Q3 2014 Q3 2015 Q3 2016
MDth/d
EQT Production areas
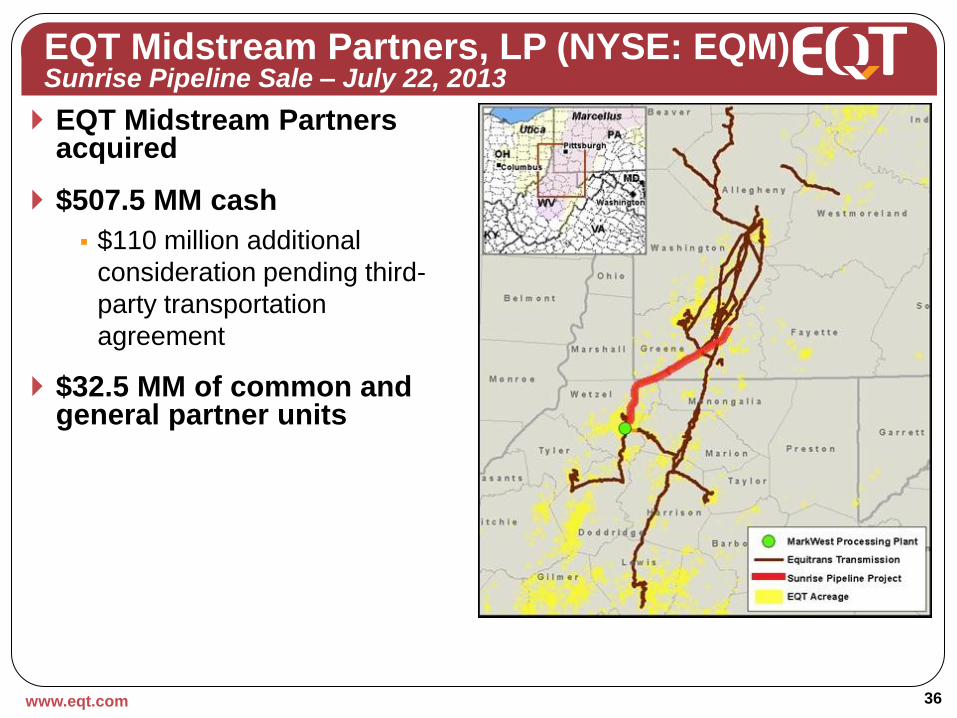
EQT Midstream Partners, LP (NYSE: EQM) Sunrise Pipeline Sale – July 22, 2013
EQT Midstream Partners acquired
$507.5 MM cash
$110 million additional
consideration pending third-
party transportation
agreement
$32.5 MM of common and general partner units
www.eqt.com 36
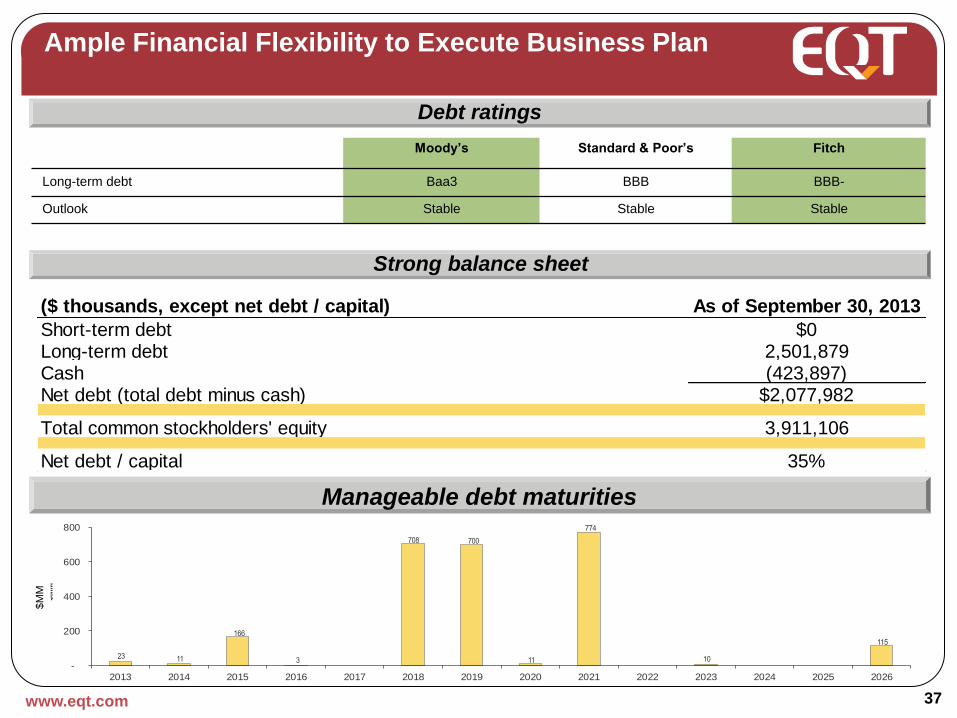
($ thousands, except net debt / capital) As of September 30, 2013
$0 2,501,879(423,897)
$2,077,982
3,911,106
35%Net debt / capital
Short-term debtLong-term debtCashNet debt (total debt minus cash)
Total common stockholders' equity
23 11
166
3
708 700
11
774
10
115
-
200
400
600
800
2013 2014 2015 2016 2017 2018 2019 2020 2021 2022 2023 2024 2025 2026
$M
M
www.eqt.com 37
Moody’s Standard & Poor’s Fitch
Long-term debt Baa3 BBB BBB-
Outlook Stable Stable Stable
Debt ratings
Strong balance sheet
Manageable debt maturities
$M
M
Ample Financial Flexibility to Execute Business Plan
www.eqt.com 38
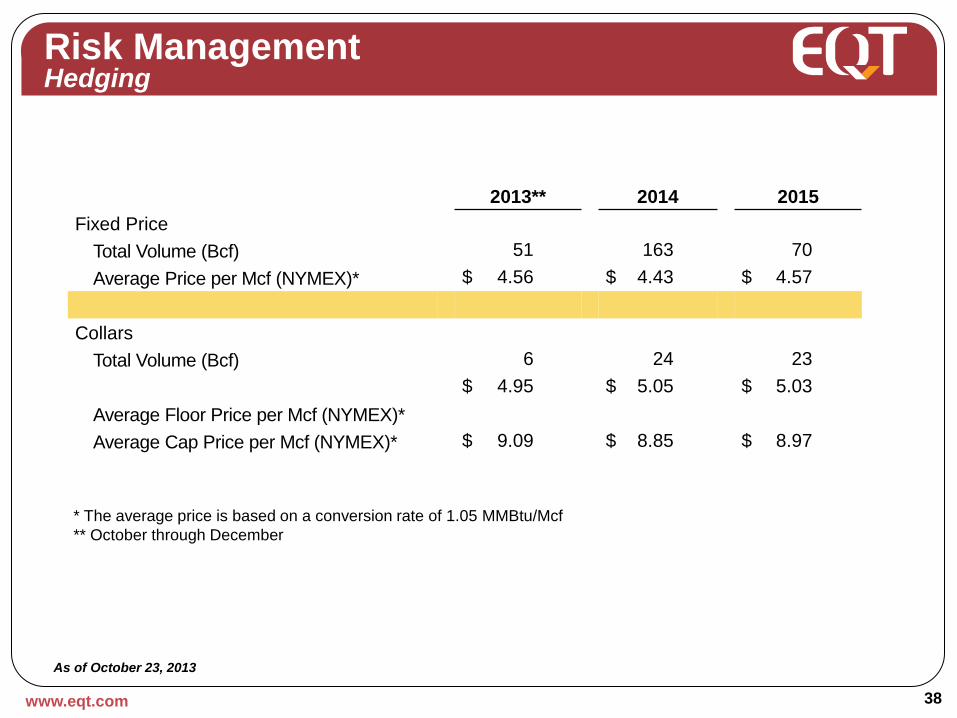
Risk Management Hedging
As of October 23, 2013
* The average price is based on a conversion rate of 1.05 MMBtu/Mcf
** October through December
2013** 2014 2015
Fixed Price
Total Volume (Bcf) 51 163 70
Average Price per Mcf (NYMEX)* $ 4.56 $ 4.43 $ 4.57
Collars
Total Volume (Bcf) 6 24 23
Average Floor Price per Mcf (NYMEX)*
$ 4.95 $ 5.05 $ 5.03
Average Cap Price per Mcf (NYMEX)* $ 9.09 $ 8.85 $ 8.97
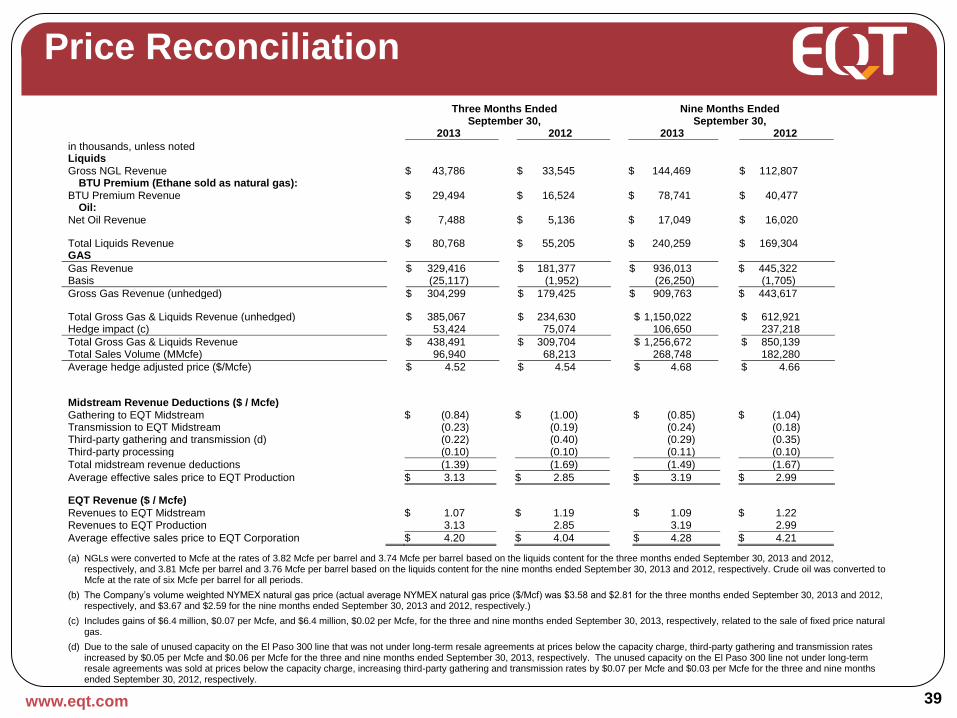
Price Reconciliation
www.eqt.com 39
Three Months Ended Nine Months Ended
September 30, September 30,
2013 2012 2013 2012
in thousands, unless noted Liquids Gross NGL Revenue $ 43,786 $ 33,545 $ 144,469 $ 112,807
BTU Premium (Ethane sold as natural gas): BTU Premium Revenue $ 29,494 $ 16,524 $ 78,741 $ 40,477
Oil: Net Oil Revenue $ 7,488 $ 5,136 $ 17,049 $ 16,020
Total Liquids Revenue $ 80,768 $ 55,205 $ 240,259 $ 169,304 GAS
Gas Revenue $ 329,416 $ 181,377 $ 936,013 $ 445,322 Basis (25,117) (1,952) (26,250) (1,705)
Gross Gas Revenue (unhedged) $ 304,299 $ 179,425 $ 909,763 $ 443,617
Total Gross Gas & Liquids Revenue (unhedged) $ 385,067 $ 234,630 $ 1,150,022 $ 612,921 Hedge impact (c) 53,424 75,074 106,650 237,218
Total Gross Gas & Liquids Revenue $ 438,491 $ 309,704 $ 1,256,672 $ 850,139 Total Sales Volume (MMcfe) 96,940 68,213 268,748 182,280
Average hedge adjusted price ($/Mcfe) $ 4.52 $ 4.54 $ 4.68 $ 4.66
Midstream Revenue Deductions ($ / Mcfe)
Gathering to EQT Midstream $ (0.84) $ (1.00) $ (0.85) $ (1.04) Transmission to EQT Midstream (0.23) (0.19) (0.24) (0.18) Third-party gathering and transmission (d) (0.22) (0.40) (0.29) (0.35) Third-party processing (0.10) (0.10) (0.11) (0.10)
Total midstream revenue deductions (1.39) (1.69) (1.49) (1.67)
Average effective sales price to EQT Production $ 3.13 $ 2.85 $ 3.19 $ 2.99
EQT Revenue ($ / Mcfe) Revenues to EQT Midstream $ 1.07 $ 1.19 $ 1.09 $ 1.22 Revenues to EQT Production 3.13 2.85 3.19 2.99
Average effective sales price to EQT Corporation $ 4.20 $ 4.04 $ 4.28 $ 4.21
(a) NGLs were converted to Mcfe at the rates of 3.82 Mcfe per barrel and 3.74 Mcfe per barrel based on the liquids content for the three months ended September 30, 2013 and 2012, respectively, and 3.81 Mcfe per barrel and 3.76 Mcfe per barrel based on the liquids content for the nine months ended September 30, 2013 and 2012, respectively. Crude oil was converted to Mcfe at the rate of six Mcfe per barrel for all periods.
(b) The Company’s volume weighted NYMEX natural gas price (actual average NYMEX natural gas price ($/Mcf) was $3.58 and $2.81 for the three months ended September 30, 2013 and 2012, respectively, and $3.67 and $2.59 for the nine months ended September 30, 2013 and 2012, respectively.)
(c) Includes gains of $6.4 million, $0.07 per Mcfe, and $6.4 million, $0.02 per Mcfe, for the three and nine months ended September 30, 2013, respectively, related to the sale of fixed price natural gas.
(d) Due to the sale of unused capacity on the El Paso 300 line that was not under long-term resale agreements at prices below the capacity charge, third-party gathering and transmission rates increased by $0.05 per Mcfe and $0.06 per Mcfe for the three and nine months ended September 30, 2013, respectively. The unused capacity on the El Paso 300 line not under long-term resale agreements was sold at prices below the capacity charge, increasing third-party gathering and transmission rates by $0.07 per Mcfe and $0.03 per Mcfe for the three and nine months ended September 30, 2012, respectively.
www.eqt.com 40
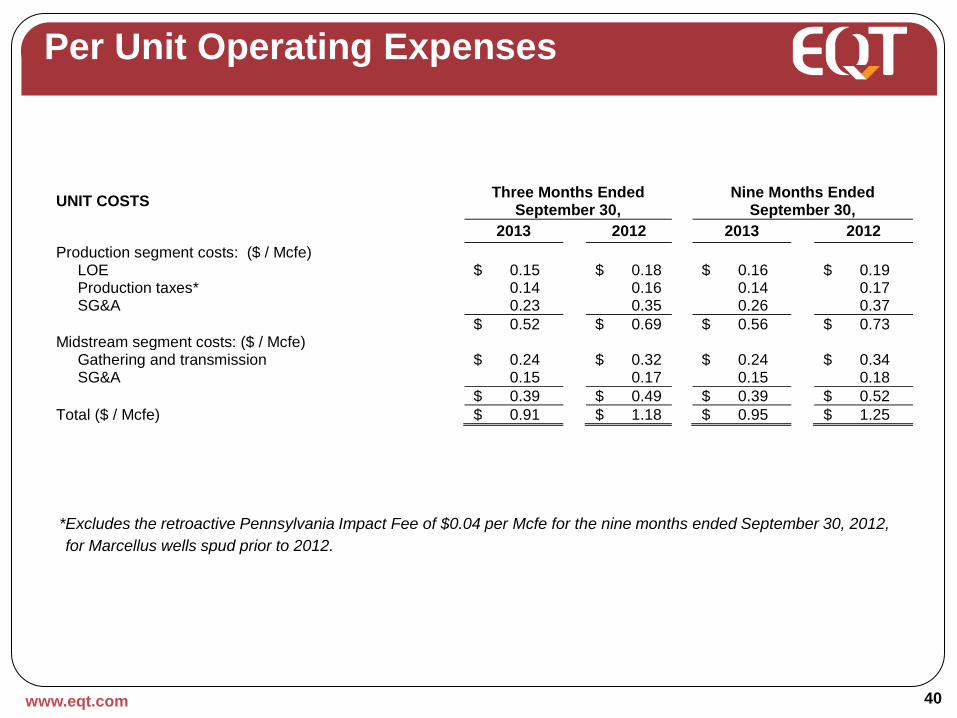
Per Unit Operating Expenses
*Excludes the retroactive Pennsylvania Impact Fee of $0.04 per Mcfe for the nine months ended September 30, 2012,
for Marcellus wells spud prior to 2012.
UNIT COSTS Three Months Ended
September 30,
Nine Months Ended September 30,
2013 2012 2013 2012
Production segment costs: ($ / Mcfe) LOE $ 0.15 $ 0.18 $ 0.16 $ 0.19 Production taxes* 0.14 0.16 0.14 0.17 SG&A 0.23 0.35 0.26 0.37
$ 0.52 $ 0.69 $ 0.56 $ 0.73 Midstream segment costs: ($ / Mcfe) Gathering and transmission $ 0.24 $ 0.32 $ 0.24 $ 0.34 SG&A 0.15 0.17 0.15 0.18
$ 0.39 $ 0.49 $ 0.39 $ 0.52
Total ($ / Mcfe) $ 0.91 $ 1.18 $ 0.95 $ 1.25
www.eqt.com
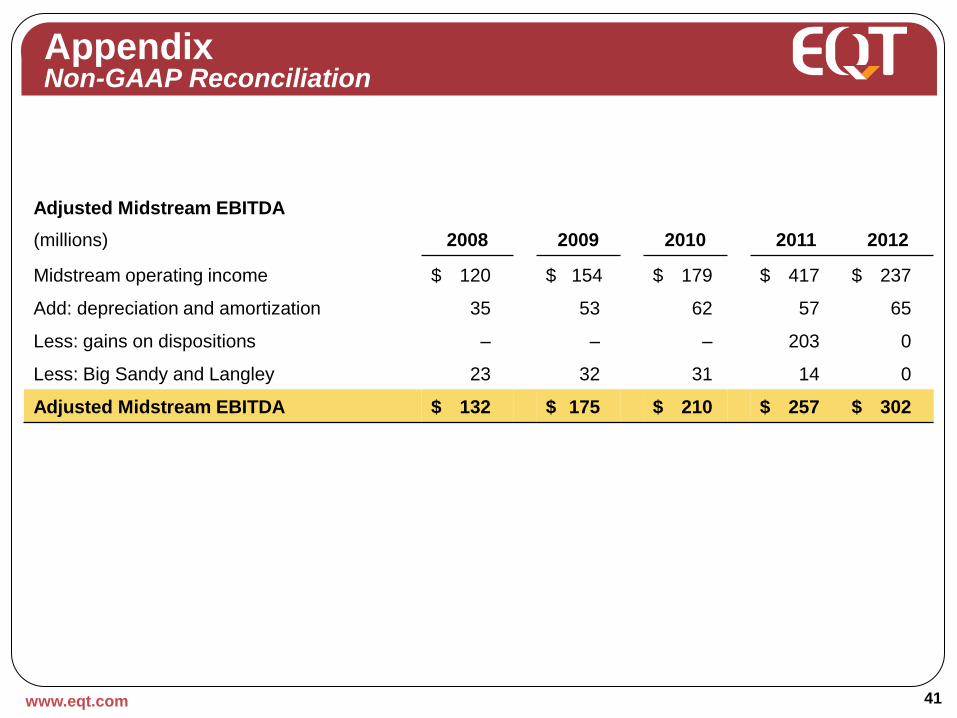
Appendix Non-GAAP Reconciliation
41
Adjusted Midstream EBITDA
(millions) 2008 2009 2010 2011 2012
Midstream operating income $ 120 $ 154 $ 179 $ 417 $ 237
Add: depreciation and amortization 35 53 62 57 65
Less: gains on dispositions – – – 203 0
Less: Big Sandy and Langley 23 32 31 14 0
Adjusted Midstream EBITDA $ 132 $ 175 $ 210 $ 257 $ 302