Embed Size (px)
Citation preview

Analyst Meeting
October 2003

2
Cautionary Statements And Risk Factors That May Affect Future Results
In connection with the safe harbor provisions of the Private Securities Litigation Reform Act of 1995 (Reform Act), FPL Group, Inc. (FPL Group) and Florida Power & Light Company (FPL) are hereby filing cautionary statements identifying important factors that could cause FPL Group's or FPL's actual results to differ materially from those projected in forward-looking statements (as such term is defined in the Reform Act) made by or on behalf of FPL Group and FPL in this presentation, in response to questions or otherwise. Any statements that express, or involve discussions as to expectations, beliefs, plans, objectives, assumptions or future events or performance (often, but not always, through the use of words or phrases such as will likely result, are expected to, will continue, is anticipated, believe, could, estimated, may, plan, potential, projection, target, outlook) are not statements of historical facts and may be forward-looking. Forward-looking statements involve estimates, assumptions and uncertainties. Accordingly, any such statements are qualified in their entirety by reference to, and are accompanied by, the following important factors (in addition to any assumptions and other factors referred to specifically in connection with such forward-looking statements) that could cause FPL Group's or FPL's actual results to differ materially from those contained in forward-looking statements made by or on behalf of FPL Group and FPL.
Any forward-looking statement speaks only as of the date on which such statement is made, and FPL Group and FPL undertake no obligation to update any forward-looking statement to reflect events or circumstances after the date on which such statement is made or to reflect the occurrence of unanticipated events. New factors emerge from time to time and it is not possible for management to predict all of such factors, nor can it assess the impact of each such factor on the business or the extent to which any factor, or combination of factors, may cause actual results to differ materially from those contained in any forward-looking statement.
The following are some important factors that could have a significant impact on FPL Group's and FPL's operations and financial results, and could cause FPL Group's and FPL's actual results or outcomes to differ materially from those discussed in the forward-looking statements:
FPL Group and FPL are subject to changes in laws or regulations, including the Public Utility Regulatory Policies Act of 1978, as amended (PURPA), and the Public Utility Holding Company Act of 1935, as amended (Holding Company Act), changing governmental policies and regulatory actions, including those of the Federal Energy Regulatory Commission (FERC), the Florida Public Service Commission (FPSC) and the utility commissions of other states in which FPL Group has operations, and the U.S. Nuclear Regulatory Commission (NRC), with respect to, among other things, allowed rates of return, industry and rate structure, operation of nuclear power facilities, operation and construction of plant facilities, operation and construction of transmission facilities, acquisition, disposal, depreciation and amortization of assets and facilities, recovery of fuel and purchased power costs, decommissioning costs, return on common equity and equity ratio limits, and present or prospective wholesale and retail competition (including but not limited to retail wheeling and transmission costs). The FPSC has the authority to disallow recovery of costs that it considers excessive or imprudently incurred.
The regulatory process generally restricts FPL's ability to grow earnings and does not provide any assurance as to achievement of earnings levels.
FPL Group and FPL are subject to extensive federal, state and local environmental statutes, rules and regulations relating to air quality, water quality, waste management, natural resources and health and safety that could, among other things, restrict or limit the output of certain facilities or the use of certain fuels required for the production of electricity and/or increase costs. There are significant capital, operating and other costs associated with compliance with these environmental statutes, rules and regulations, and those costs could be even more significant in the future.

3
The operation of power generation facilities involves many risks, including start up risks, breakdown or failure of equipment, transmission lines or pipelines, use of new technology, the dependence on a specific fuel source or the impact of unusual or adverse weather conditions (including natural disasters such as hurricanes), as well as the risk of performance below expected levels of output or efficiency. This could result in lost revenues and/or increased expenses. Insurance, warranties or performance guarantees may not cover any or all of the lost revenues or increased expenses, including the cost of replacement power. In addition to these risks, FPL Group's and FPL's nuclear units face certain risks that are unique to the nuclear industry including the ability to dispose of spent nuclear fuel, as well as additional regulatory actions up to and including shutdown of the units stemming from public safety concerns, whether at FPL Group's and FPL's plants, or at the plants of other nuclear operators. Breakdown or failure of an FPL Energy, LLC (FPL Energy) operating facility may prevent the facility from performing under applicable power sales agreements which, in certain situations, could result in termination of the agreement or incurring a liability for liquidated damages.
FPL Group's and FPL's ability to successfully and timely complete their power generation facilities currently under construction, those projects yet to begin construction or capital improvements to existing facilities is contingent upon many variables and subject to substantial risks. Should any such efforts be unsuccessful, FPL Group and FPL could be subject to additional costs, termination payments under committed contracts and/or the write-off of their investment in the project or improvement.
FPL Group and FPL use derivative instruments, such as swaps, options, futures and forwards to manage their commodity and financial market risks, and to a lesser extent, engage in limited trading activities. FPL Group could recognize financial losses as a result of volatility in the market values of these contracts, or if a counterparty fails to perform. In the absence of actively quoted market prices and pricing information from external sources, the valuation of these derivative instruments involves management's judgment or use of estimates. As a result, changes in the underlying assumptions or use of alternative valuation methods could affect the value of the reported fair value of these contracts. In addition, FPL's use of such instruments could be subject to prudency challenges by the FPSC and if found imprudent, cost disallowance.
There are other risks associated with FPL Group's non-rate regulated businesses, particularly FPL Energy. In addition to risks discussed elsewhere, risk factors specifically affecting FPL Energy's success in competitive wholesale markets include the ability to efficiently develop and operate generating assets, the successful and timely completion of project restructuring activities, the price and supply of fuel, transmission constraints, competition from new sources of generation, excess generation capacity and demand for power. There can be significant volatility in market prices for fuel and electricity, and there are other financial, counterparty and market risks that are beyond the control of FPL Energy. FPL Energy's inability or failure to effectively hedge its assets or positions against changes in commodity prices, interest rates, counterparty credit risk or other risk measures could significantly impair its future financial results. In keeping with industry trends, a portion of FPL Energy's power generation facilities operate wholly or partially without long-term power purchase agreements. As a result, power from these facilities is sold on the spot market or on a short-term contractual basis, which may affect the volatility of FPL Group's financial results. In addition, FPL Energy's business depends upon transmission facilities owned and operated by others; if transmission is disrupted or capacity is inadequate or unavailable, FPL Energy's ability to sell and deliver its wholesale power may be limited.
FPL Group is likely to encounter significant competition for acquisition opportunities that may become available as a result of the consolidation of the power industry. In addition, FPL Group may be unable to identify attractive acquisition opportunities at favorable prices and to successfully and timely complete and integrate them.
FPL Group and FPL rely on access to capital markets as a significant source of liquidity for capital requirements not satisfied by operating cash flows. The inability of FPL Group and FPL to maintain their current credit ratings could affect their ability to raise capital on favorable terms, particularly during times of uncertainty in the capital markets which, in turn, could impact FPL Group's and FPL's ability to grow their businesses and would likely increase interest costs.
4
FPL Group's and FPL's results of operations can be affected by changes in the weather. Weather conditions directly influence the demand for electricity and natural gas and affect the price of energy commodities, and can affect the production of electricity at wind and hydro-powered facilities. In addition, severe weather can be destructive, causing outages and/or property damage, which could require additional costs to be incurred.
FPL Group and FPL are subject to costs and other effects of legal and administrative proceedings, settlements, investigations and claims; as well as the effect of new, or changes in, tax rates or policies, rates of inflation, accounting standards, securities laws or corporate governance requirements.
FPL Group and FPL are subject to direct and indirect effects of terrorist threats and activities. Generation and transmission facilities, in general, have been identified as potential targets. The effects of terrorist threats and activities include, among other things, terrorist actions or responses to such actions or threats, the inability to generate, purchase or transmit power, the risk of a significant slowdown in growth or a decline in the U.S. economy, delay in economic recovery in the U.S., and the increased cost and adequacy of security and insurance.
FPL Group's and FPL's ability to obtain insurance, and the cost of and coverage provided by such insurance, could be affected by national events as well as company-specific events.
FPL Group and FPL are subject to employee workforce factors, including loss or retirement of key executives, availability of qualified personnel, collective bargaining agreements with union employees or work stoppage.
The issues and associated risks and uncertainties described above are not the only ones FPL Group and FPL may face. Additional issues may arise or become material as the energy industry evolves. The risks and uncertainties associated with these additional issues could impair FPL Group's and FPL's businesses in the future.

6
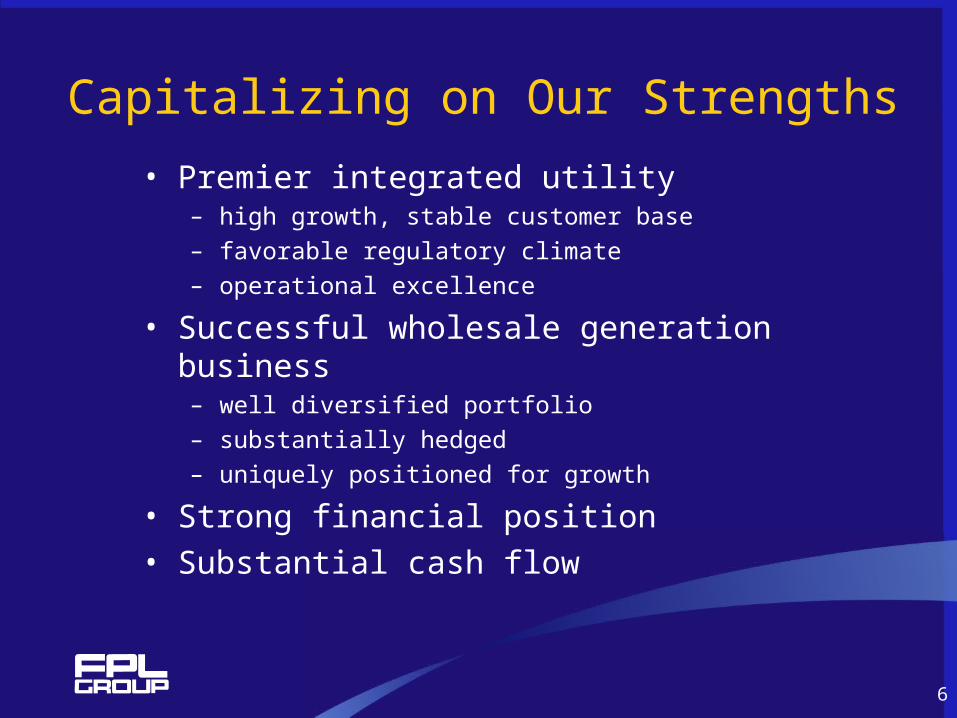
Capitalizing on Our Strengths
• Premier integrated utility– high growth, stable customer base
– favorable regulatory climate
– operational excellence
• Successful wholesale generation business– well diversified portfolio
– substantially hedged
– uniquely positioned for growth
• Strong financial position• Substantial cash flow
7
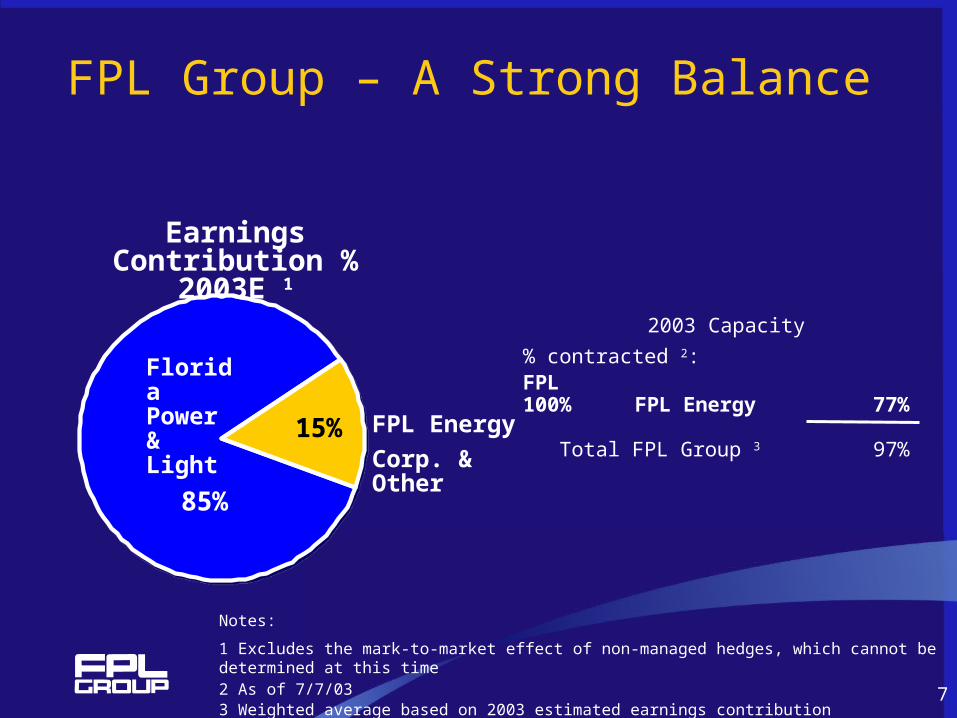
FPL Group – A Strong Balance
2003 Capacity
% contracted 2:FPL 100%FPL Energy 77%
Total FPL Group 3 97%
85%
15%
85%
15%
Florida Power & Light FPL Energy
Corp. & Other
Earnings Contribution %2003E 1
Notes:
1 Excludes the mark-to-market effect of non-managed hedges, which cannot be determined at this time2 As of 7/7/033 Weighted average based on 2003 estimated earnings contribution

9
92 93 94 95 96 97 98 99 00 01 02
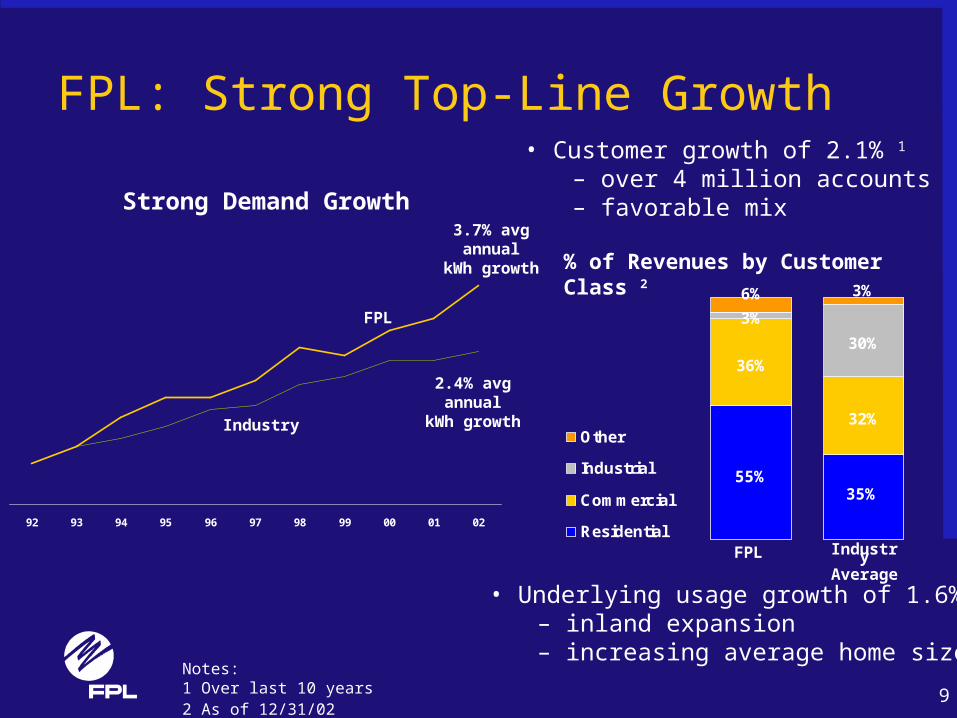
FPL: Strong Top-Line Growth
36%
32%
3%
30%
3%6%
Other
Industrial
Commercial
Residential
Strong Demand Growth3.7% avgannual
kWh growth
2.4% avgannual
kWh growth
• Customer growth of 2.1% 1
– over 4 million accounts– favorable mix
• Underlying usage growth of 1.6% 1
– inland expansion– increasing average home size
Notes:1 Over last 10 years2 As of 12/31/02
Industry
FPL
% of Revenues by Customer Class 2
FPL IndustryAverage
55%35%
10
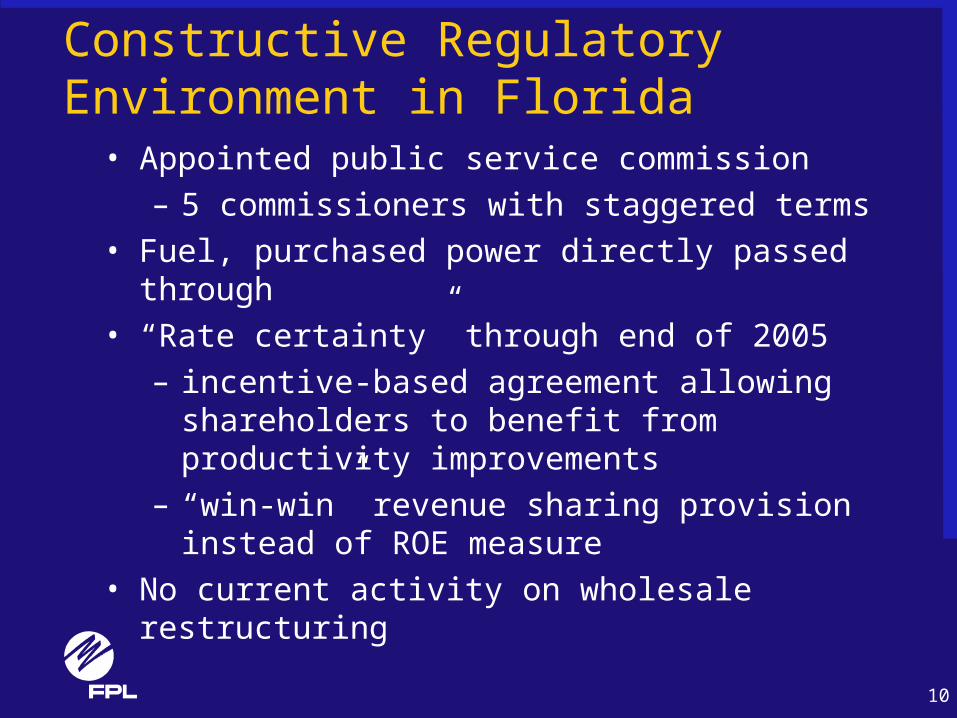
Constructive Regulatory Environment in Florida
• Appointed public service commission– 5 commissioners with staggered terms
• Fuel, purchased power directly passed through• “Rate certainty” through end of 2005
– incentive-based agreement allowing shareholders to benefit from productivity improvements
– “win-win” revenue sharing provision instead of ROE measure
• No current activity on wholesale restructuring
11
$-
$10
$20
$30
$40
$50
$60
$70
$80
85 87 89 91 93 95 97 99 01 03
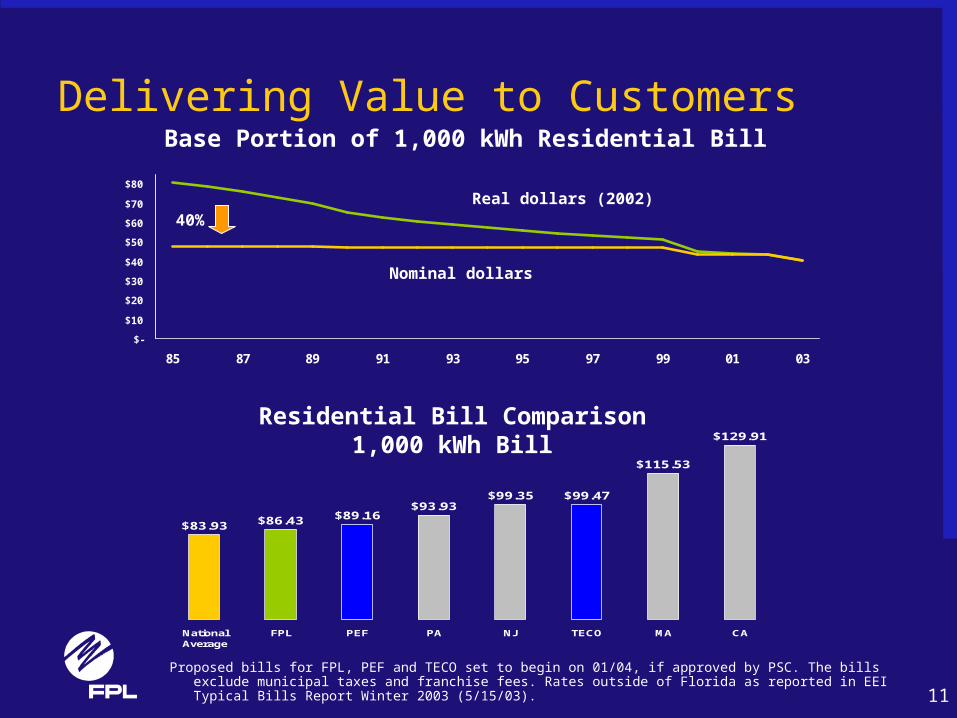
Delivering Value to Customers
$83.93 $86.43 $89.16$93.93
$99.35 $99.47
$115.53
$129.91
NationalAverage
FPL PEF PA NJ TECO MA CA
Proposed bills for FPL, PEF and TECO set to begin on 01/04, if approved by PSC. The bills exclude municipal taxes and franchise fees. Rates outside of Florida as reported in EEI Typical Bills Report Winter 2003 (5/15/03).
Residential Bill Comparison1,000 kWh Bill
Base Portion of 1,000 kWh Residential Bill
Nominal dollars
Real dollars (2002)40%
12
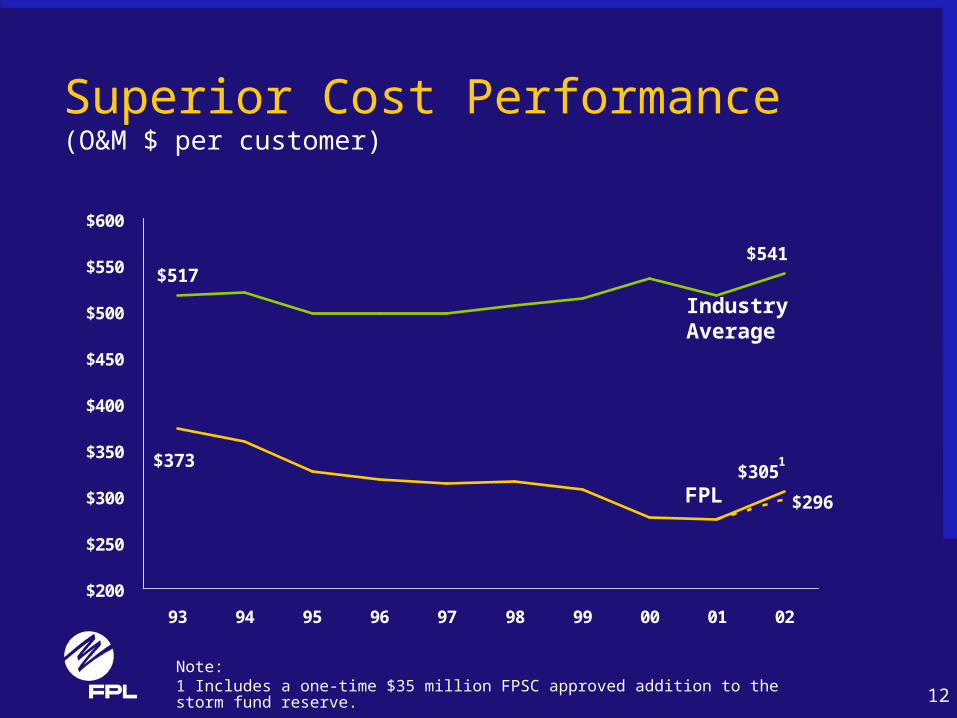
Superior Cost Performance(O&M $ per customer)
$296
$541$517
$373$305
$200
$250
$300
$350
$400
$450
$500
$550
$600
93 94 95 96 97 98 99 00 01 02
Industry Average
FPL
Note:1 Includes a one-time $35 million FPSC approved addition to the storm fund reserve.
1
13
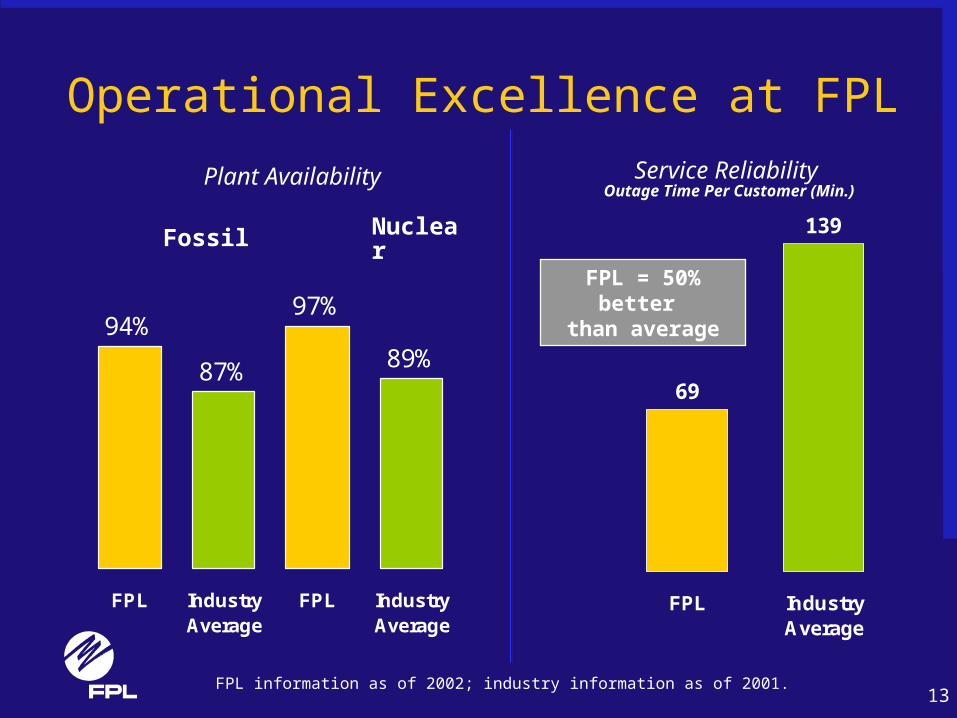
94%
87%
97%
89%
FPL IndustryAverage
FPL IndustryAverage
69
139
FPL IndustryAverage
Operational Excellence at FPL
Plant Availability
FPL = 50% better than average
Service Reliability Outage Time Per Customer (Min.)
Fossil Nuclear
FPL information as of 2002; industry information as of 2001.
14
0.5
1.0
1.5
2.0
2.5
3.0
3.5
4.0
4.5
5.0
5.5
6.0
6.5
7.0
7.5
8.0
98 99 00 01 02 03P 04P 05P
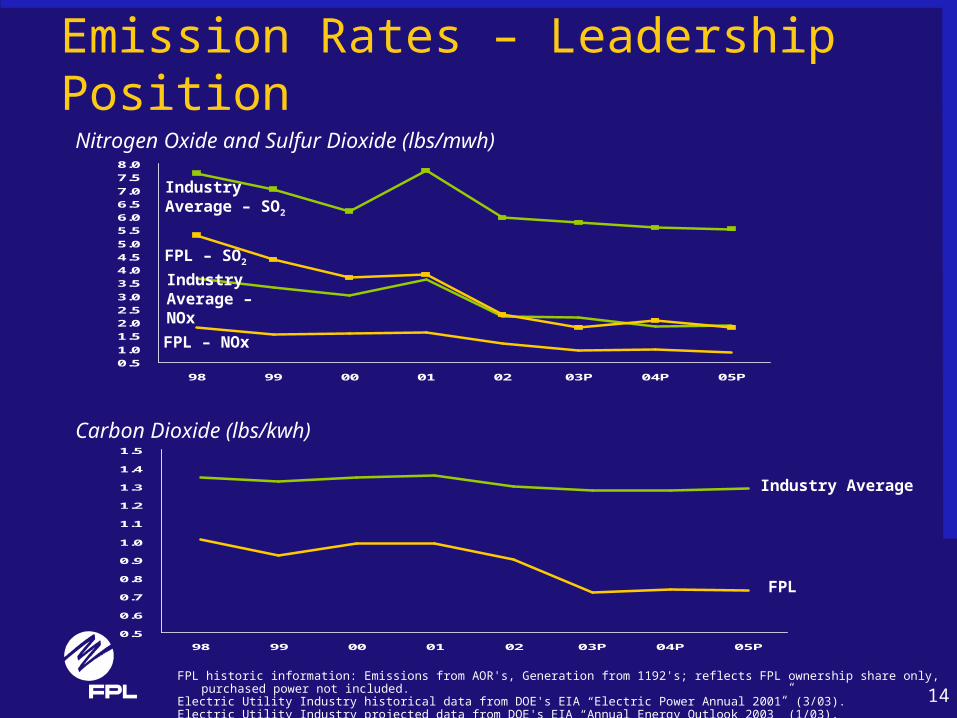
Emission Rates – Leadership Position
0.5
0.6
0.7
0.8
0.9
1.0
1.1
1.2
1.3
1.4
1.5
98 99 00 01 02 03P 04P 05P
Nitrogen Oxide and Sulfur Dioxide (lbs/mwh)
Industry Average – NOx
FPL – NOx
Carbon Dioxide (lbs/kwh)
Industry Average
FPL
FPL historic information: Emissions from AOR's, Generation from 1192's; reflects FPL ownership share only, purchased power not included. Electric Utility Industry historical data from DOE's EIA “Electric Power Annual 2001” (3/03).Electric Utility Industry projected data from DOE's EIA “Annual Energy Outlook 2003” (1/03).
FPL – SO2
Industry Average – SO2
15
FPL Value Proposition
• Growing demand for electricity in our service territory
• Collaborative and progressive regulatory environment
• Outstanding operating performance• Low environmental risk
Strong earnings and cash flow potential

17
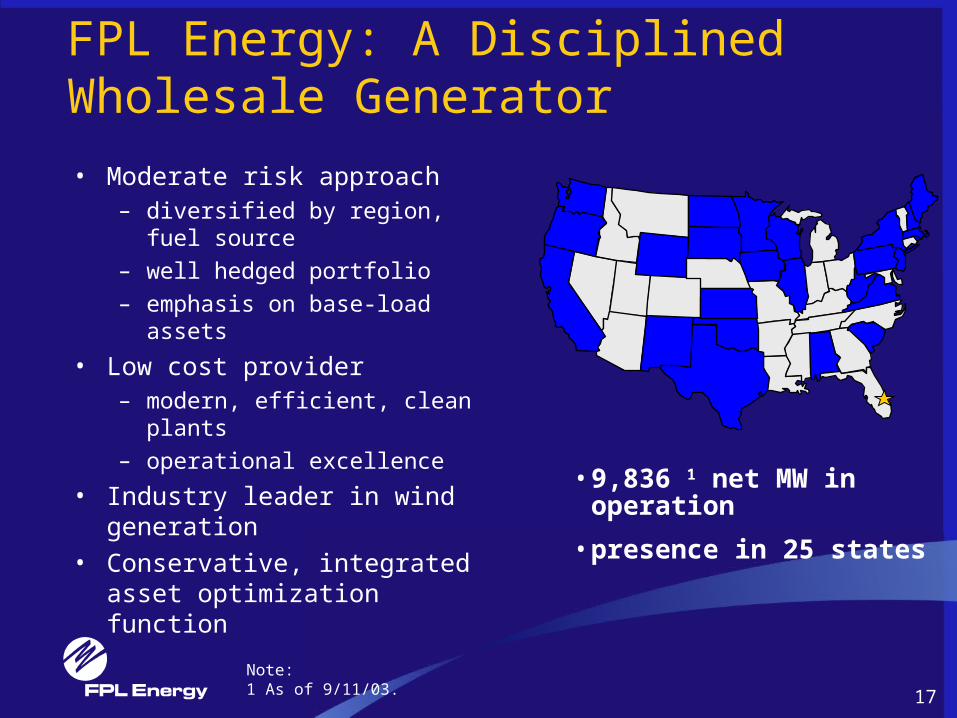
FPL Energy: A DisciplinedWholesale Generator
• Moderate risk approach– diversified by region, fuel source
– well hedged portfolio
– emphasis on base-load assets
• Low cost provider– modern, efficient, clean plants
– operational excellence
• Industry leader in wind generation
• Conservative, integrated asset optimization function
• 9,836 1 net MW in operation
• presence in 25 states
Note:1 As of 9/11/03.
18
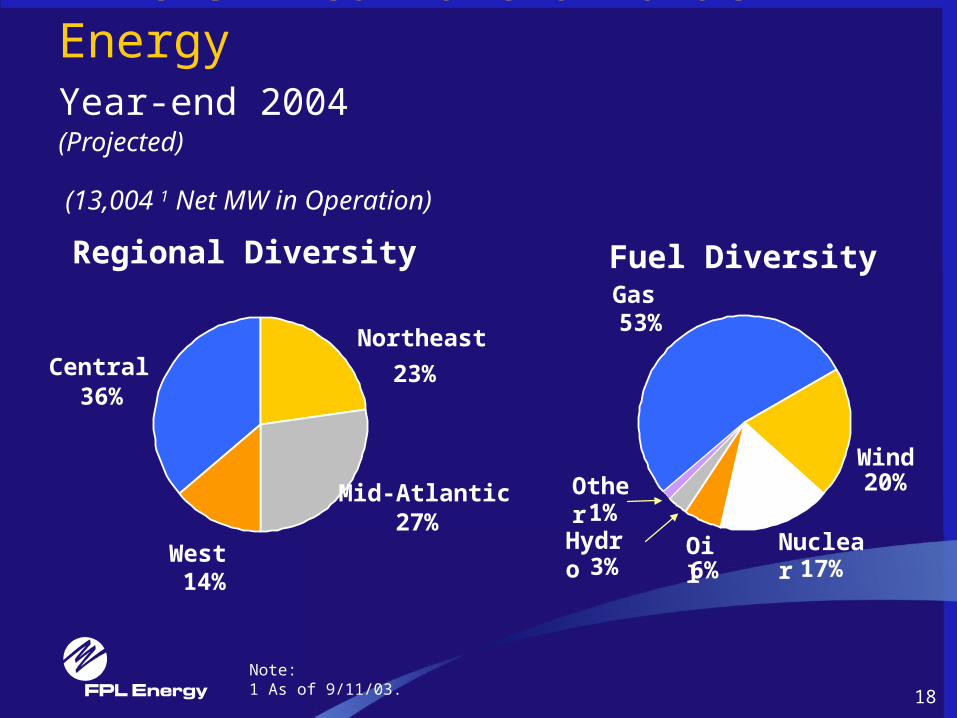
Northeast
Mid-Atlantic27%
23%
14%
36%
West
Regional Diversity
Wind
Diversified Portfolio at FPL EnergyYear-end 2004 (Projected)
(13,004 1 Net MW in Operation)
Central
Fuel DiversityGas53%
20%Other1%
Hydro3% 6%
Oil Nuclear17%
Note:1 As of 9/11/03.
19
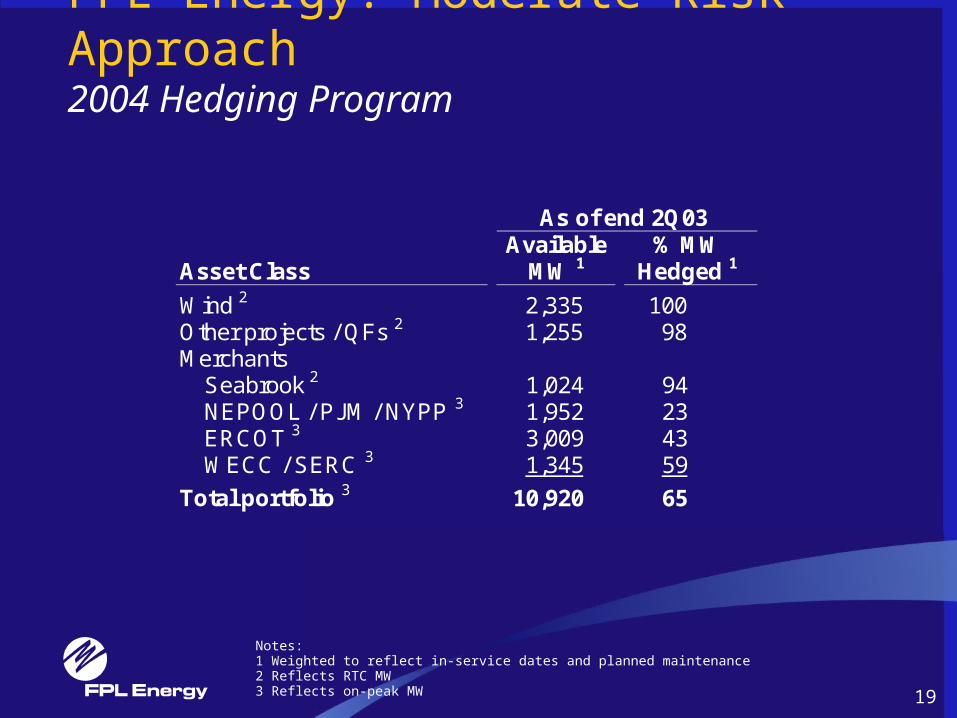
FPL Energy: Moderate Risk Approach2004 Hedging Program
As of end 2Q03
Asset Class Available
MW 1 % MW
Hedged 1
Wind 2 2,335 100 Other projects / QFs 2 1,255 98 Merchants
Seabrook 2 1,024 94 NEPOOL / PJM / NYPP 3 1,952 23 ERCOT 3 3,009 43 WECC / SERC 3 1,345 59
Total portfolio 3 10,920 65
Notes:1 Weighted to reflect in-service dates and planned maintenance2 Reflects RTC MW3 Reflects on-peak MW
20
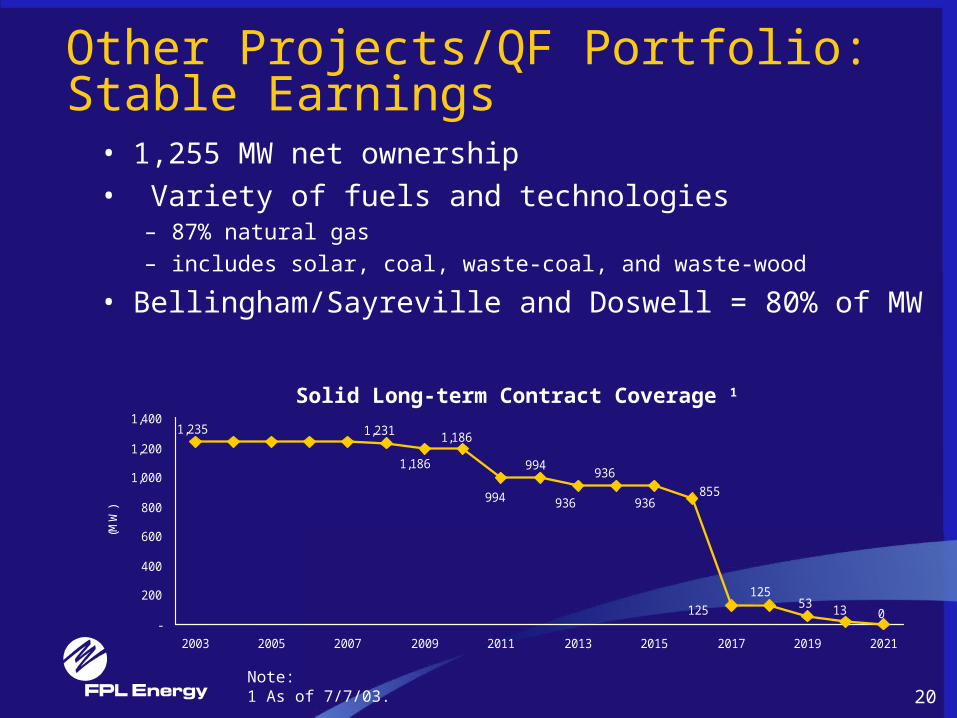
Other Projects/QF Portfolio: Stable Earnings
• 1,255 MW net ownership • Variety of fuels and technologies
– 87% natural gas
– includes solar, coal, waste-coal, and waste-wood
• Bellingham/Sayreville and Doswell = 80% of MW
1,235
013125
12553
936994
994936
936855
1,186
1,1861,231
-
200
400
600
800
1,000
1,200
1,400
2003 2005 2007 2009 2011 2013 2015 2017 2019 2021
(MW
)
Solid Long-term Contract Coverage 1
Note:1 As of 7/7/03.
21
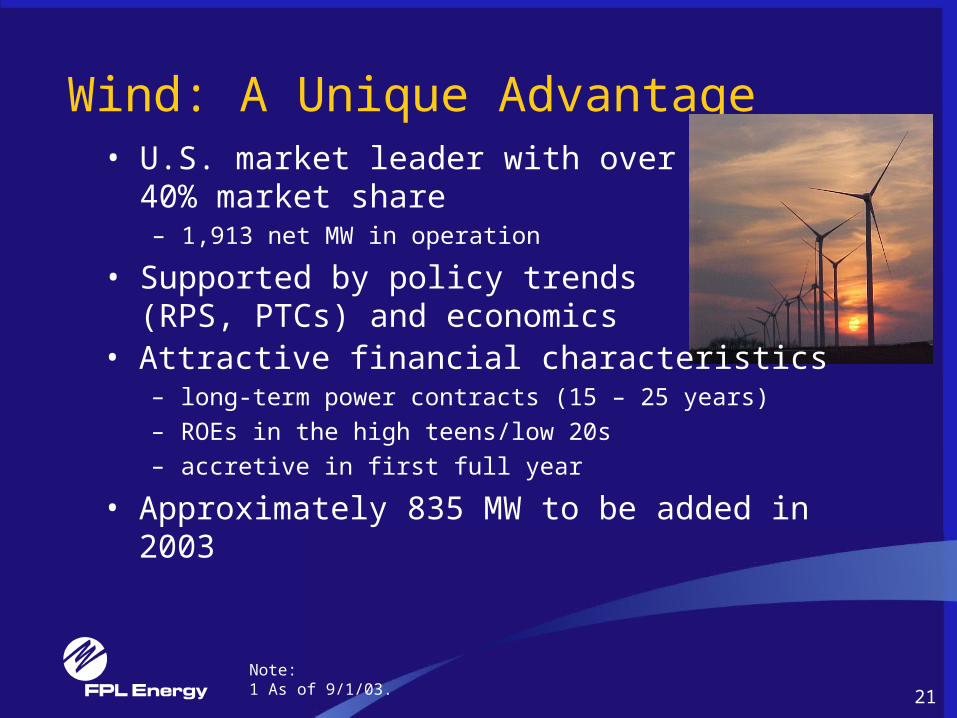
Wind: A Unique Advantage• U.S. market leader with over
40% market share– 1,913 net MW in operation
• Supported by policy trends (RPS, PTCs) and economics
• Attractive financial characteristics– long-term power contracts (15 – 25 years)
– ROEs in the high teens/low 20s
– accretive in first full year
• Approximately 835 MW to be added in 2003
Note:1 As of 9/1/03.
22
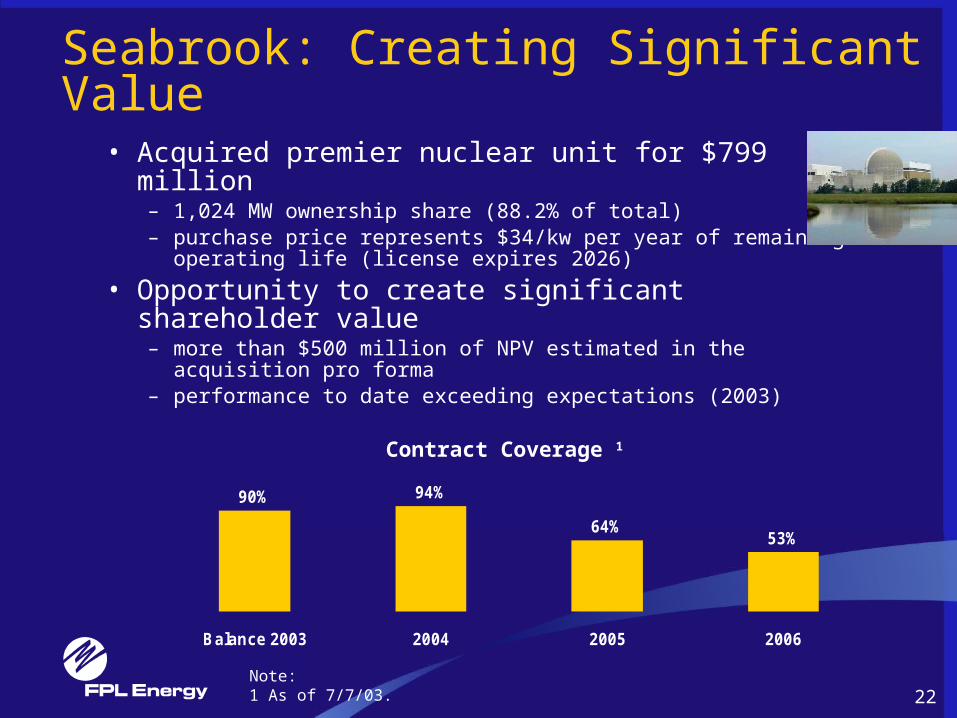
Seabrook: Creating Significant Value• Acquired premier nuclear unit for $799 million
– 1,024 MW ownership share (88.2% of total)– purchase price represents $34/kw per year of remaining
operating life (license expires 2026)
• Opportunity to create significant shareholder value– more than $500 million of NPV estimated in the
acquisition pro forma– performance to date exceeding expectations (2003)
90% 94%
64%53%
Balance 2003 2004 2005 2006
Contract Coverage 1
Note:1 As of 7/7/03.
23
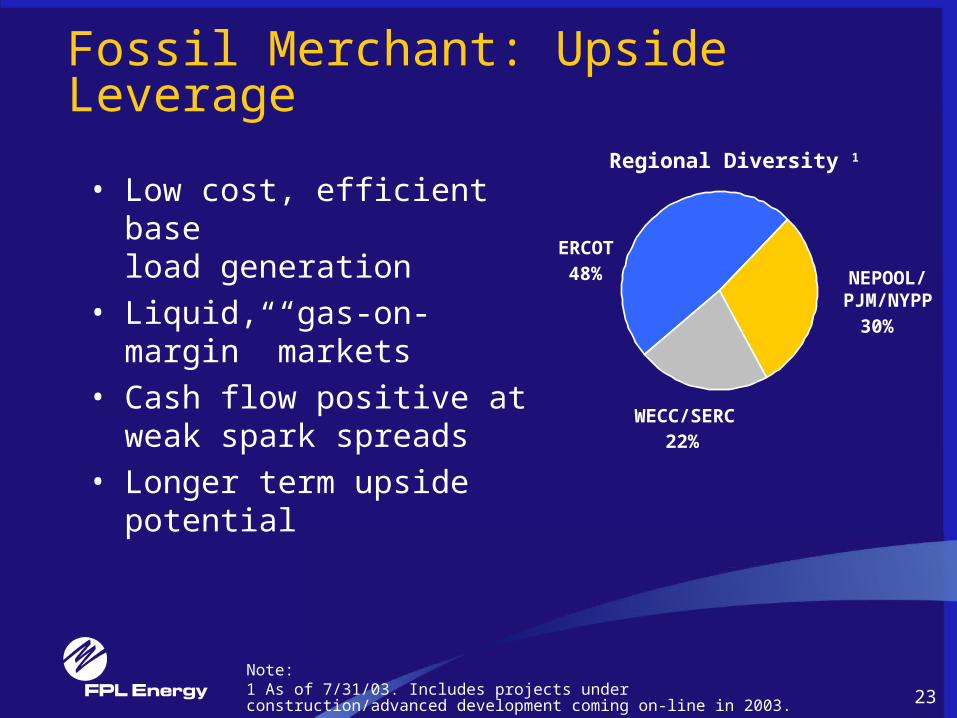
Fossil Merchant: Upside Leverage
• Low cost, efficient base load generation
• Liquid, “gas-on-margin” markets
• Cash flow positive at weak spark spreads
• Longer term upside potential 22%
48%
Regional Diversity 1
ERCOT
30%
NEPOOL/PJM/NYPP
WECC/SERC
Note:1 As of 7/31/03. Includes projects under construction/advanced development coming on-line in 2003.
24
Acquisition of AmerGen Interest
• Financially attractive– attractive purchase price of $247/kW 1
– immediately accretive
• Long term contracts with strong counter-party– fully contracted through current license period
• High quality assets, with moderate risk profile– 1,241 net MW in three plants– good safety and operating track records
• Enhances FPL Energy portfolio diversification• Partnership with an industry leader
– opportunity to share best practices
Note:1 Includes fuel cost and British Energy’s portion of AmerGen debt
25
FPL Energy Value Proposition
• Moderate risk approach
• Well diversified by region and fuel source
• Growth opportunities in wind building on our competitive advantage
• Nuclear creating substantial value
• Merchant portfolio offers longer term upside leverage
• Disciplined hedging/optimization
• Opportunity to pursue acquisitions that are accretive, strategically attractive and financeable

27
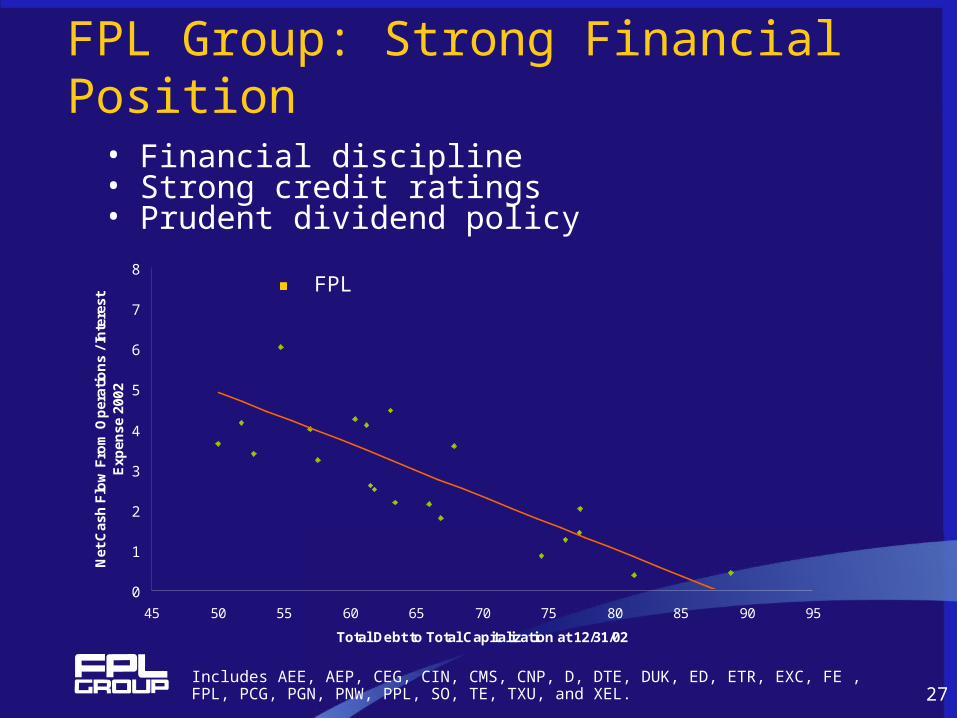
FPL Group: Strong Financial Position• Financial discipline• Strong credit ratings• Prudent dividend policy
Includes AEE, AEP, CEG, CIN, CMS, CNP, D, DTE, DUK, ED, ETR, EXC, FE , FPL, PCG, PGN, PNW, PPL, SO, TE, TXU, and XEL.
0
1
2
3
4
5
6
7
8
45 50 55 60 65 70 75 80 85 90 95
Total Debt to Total Capitalization at 12/31/02
Net
Cas
h F
low
Fro
m O
per
atio
ns
/ In
tere
st
Exp
ense
200
2
FPL
28
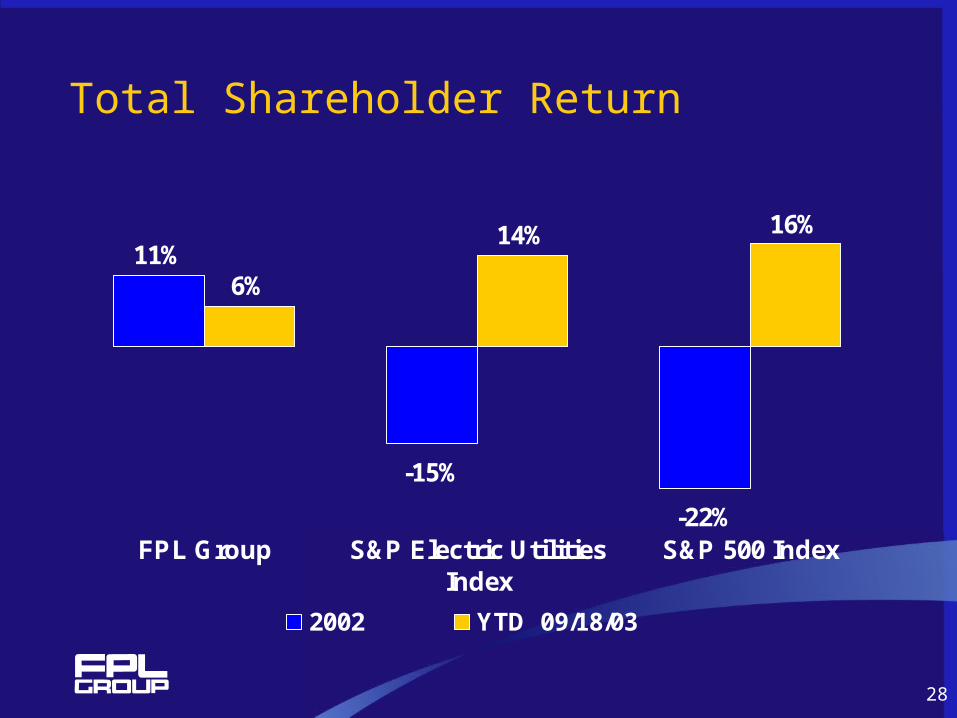
Total Shareholder Return
11%
-15%
-22%
6%
14% 16%
FPL Group S&P Electric UtilitiesIndex
S&P 500 Index
2002 YTD 09/18/03
29
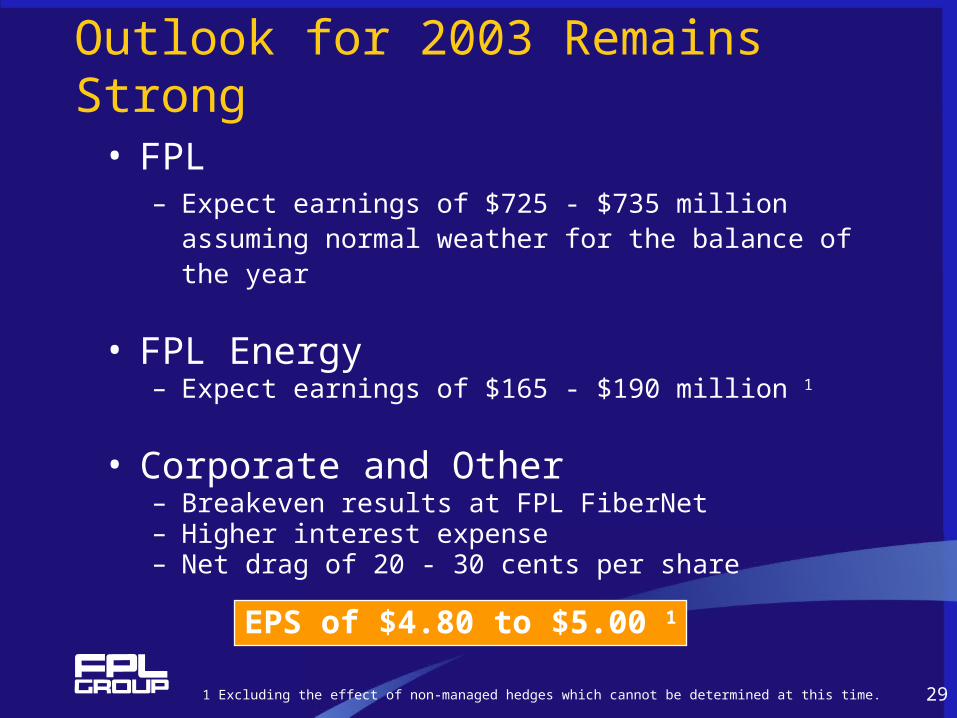
Outlook for 2003 Remains Strong• FPL
– Expect earnings of $725 - $735 million assuming normal weather for the balance of the year
• FPL Energy– Expect earnings of $165 - $190 million 1
• Corporate and Other– Breakeven results at FPL FiberNet– Higher interest expense– Net drag of 20 - 30 cents per share
EPS of $4.80 to $5.00 1
1 Excluding the effect of non-managed hedges which cannot be determined at this time.
30
FPL Group: A Solid Investment
• Premier integrated utility serving a vibrant territory• Growing wholesale generation business with moderate
risk profile• Operational and environmental excellence• Financial strength and discipline• Proven track record• Solid corporate governance policies and practices

Appendix
32
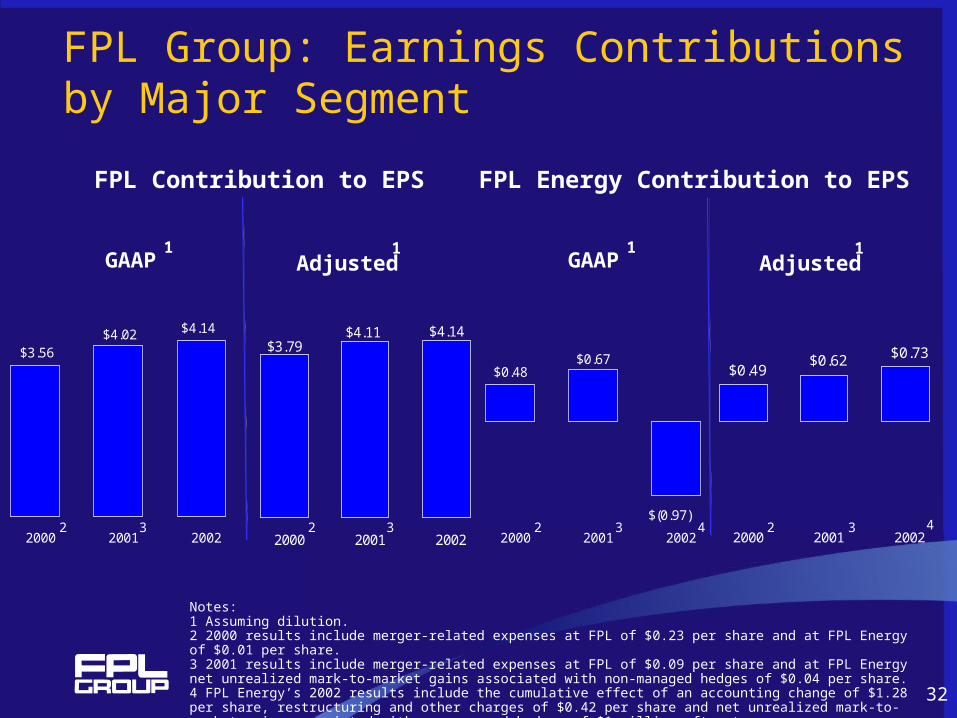
Notes:1 Assuming dilution.2 2000 results include merger-related expenses at FPL of $0.23 per share and at FPL Energy of $0.01 per share. 3 2001 results include merger-related expenses at FPL of $0.09 per share and at FPL Energy net unrealized mark-to-market gains associated with non-managed hedges of $0.04 per share.4 FPL Energy’s 2002 results include the cumulative effect of an accounting change of $1.28 per share, restructuring and other charges of $0.42 per share and net unrealized mark-to-market gains associated with non-managed hedges of $1 million after-tax.
FPL Group: Earnings Contributions by Major Segment
$0.49$0.62 $0.73
2000 2001 2002
FPL Energy Contribution to EPSFPL Contribution to EPS
$0.48$0.67
$(0.97)
2000 2001 2002
GAAP Adjusted1 1
$3.79$4.11 $4.14
2000 2001 2002
$3.56
$4.14$4.02
2000 2001 2002
GAAP Adjusted1 1
2 2 2 2 3333 4 4
33
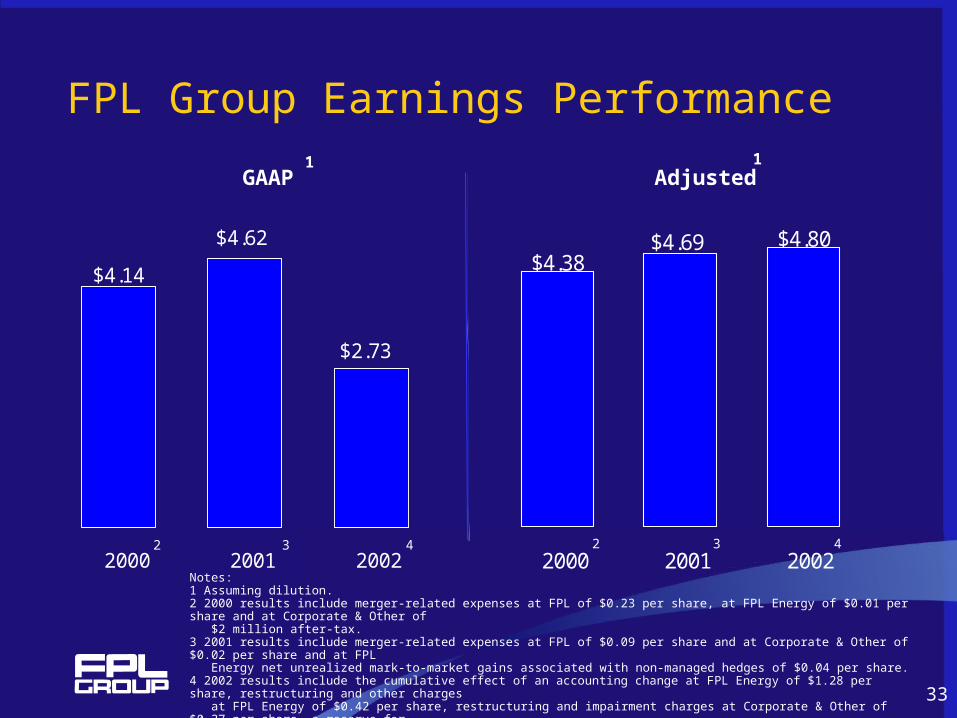
$4.14
$2.73
$4.62
2000 2001 2002Notes:1 Assuming dilution.2 2000 results include merger-related expenses at FPL of $0.23 per share, at FPL Energy of $0.01 per share and at Corporate & Other of $2 million after-tax.3 2001 results include merger-related expenses at FPL of $0.09 per share and at Corporate & Other of $0.02 per share and at FPL Energy net unrealized mark-to-market gains associated with non-managed hedges of $0.04 per share.4 2002 results include the cumulative effect of an accounting change at FPL Energy of $1.28 per share, restructuring and other charges at FPL Energy of $0.42 per share, restructuring and impairment charges at Corporate & Other of $0.37 per share, a reserve for leveraged leases at Corporate & Other for $0.17 per share, a favorable settlement of litigation with IRS at Corporate & Other of $0.17 per share, and net unrealized mark-to-market gains associated with non-managed hedges at FPL Energy of $1 million after-tax.
FPL Group Earnings Performance
$4.38$4.69 $4.80
2000 2001 2002
GAAP Adjusted1 1
2 3 42 3 4
34
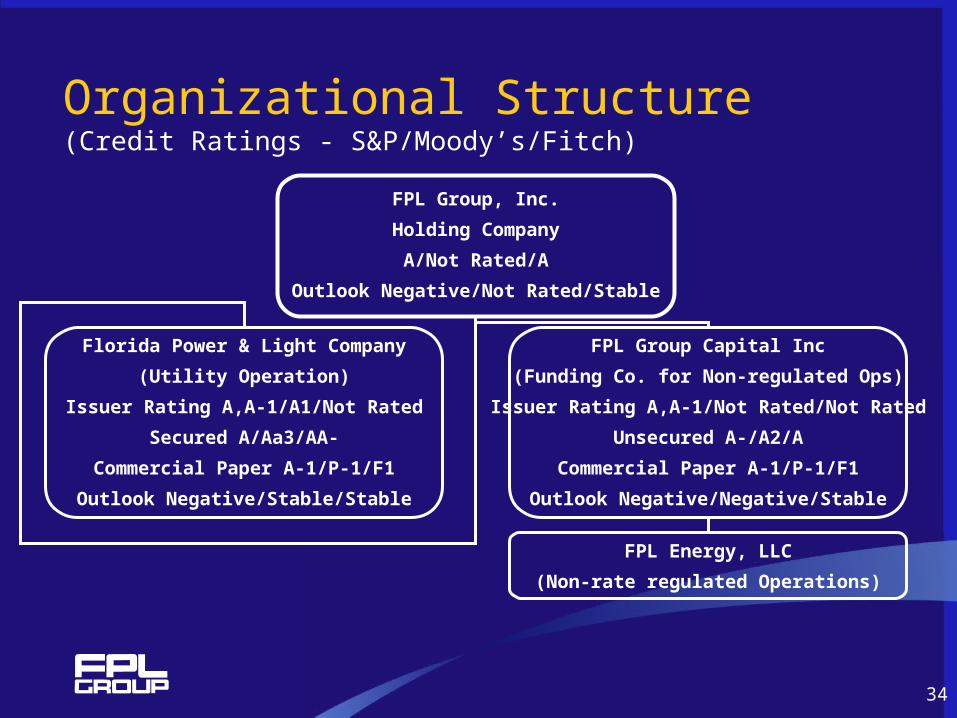
Organizational Structure(Credit Ratings - S&P/Moody’s/Fitch)
FPL Group, Inc.
Holding Company
A/Not Rated/A
Outlook Negative/Not Rated/Stable
Florida Power & Light Company
(Utility Operation)
Issuer Rating A,A-1/A1/Not Rated
Secured A/Aa3/AA-
Commercial Paper A-1/P-1/F1
Outlook Negative/Stable/Stable
FPL Group Capital Inc
(Funding Co. for Non-regulated Ops)
Issuer Rating A,A-1/Not Rated/Not Rated
Unsecured A-/A2/A
Commercial Paper A-1/P-1/F1
Outlook Negative/Negative/Stable
FPL Energy, LLC
(Non-rate regulated Operations)
35
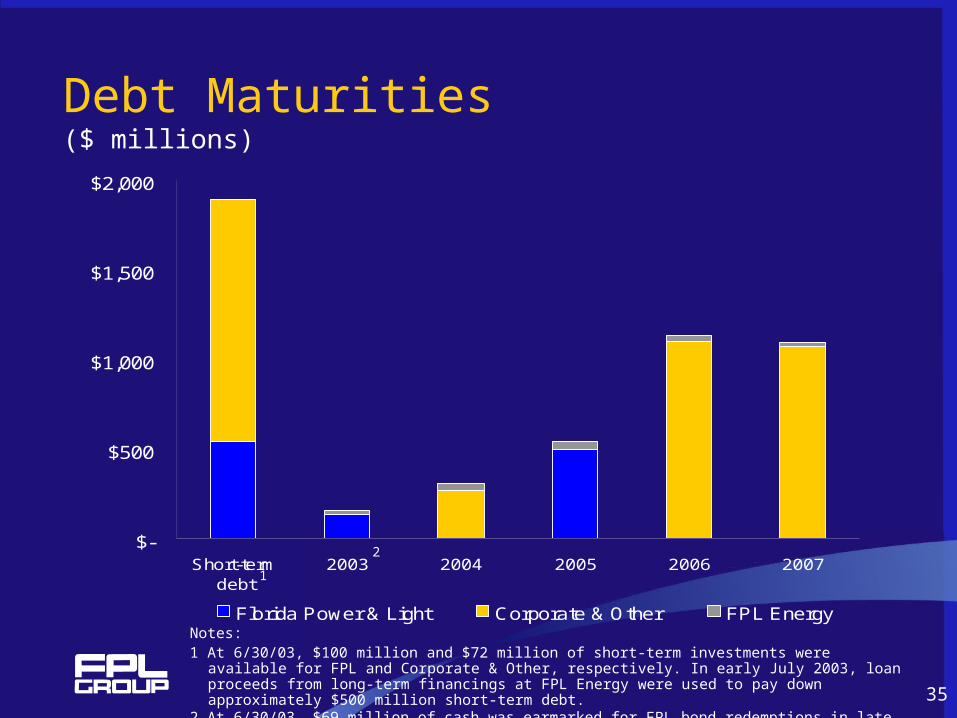
Debt Maturities($ millions)
$-
$500
$1,000
$1,500
$2,000
Short-termdebt
2003 2004 2005 2006 2007
Florida Power & Light Corporate & Other FPL Energy
1
2
Notes:1 At 6/30/03, $100 million and $72 million of short-term investments were available for FPL and Corporate &
Other, respectively. In early July 2003, loan proceeds from long-term financings at FPL Energy were used to pay down approximately $500 million short-term debt.
2 At 6/30/03, $69 million of cash was earmarked for FPL bond redemptions in late July 2003.
36
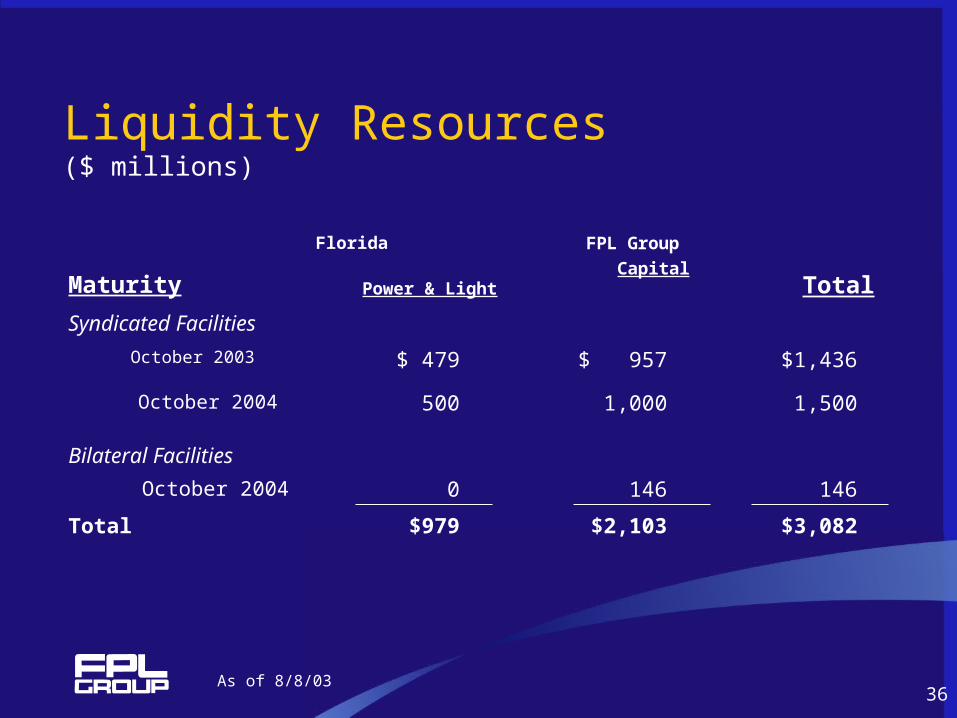
$3,082$2,103$979Total
Bilateral Facilities
146 146 0 October 2004
October 2004
October 2003
Syndicated Facilities
Maturity
$1,436$ 957$ 479
1,500 1,000 500
Total
FPL Group
Capital
Florida
Power & Light
Liquidity Resources($ millions)
As of 8/8/03
37
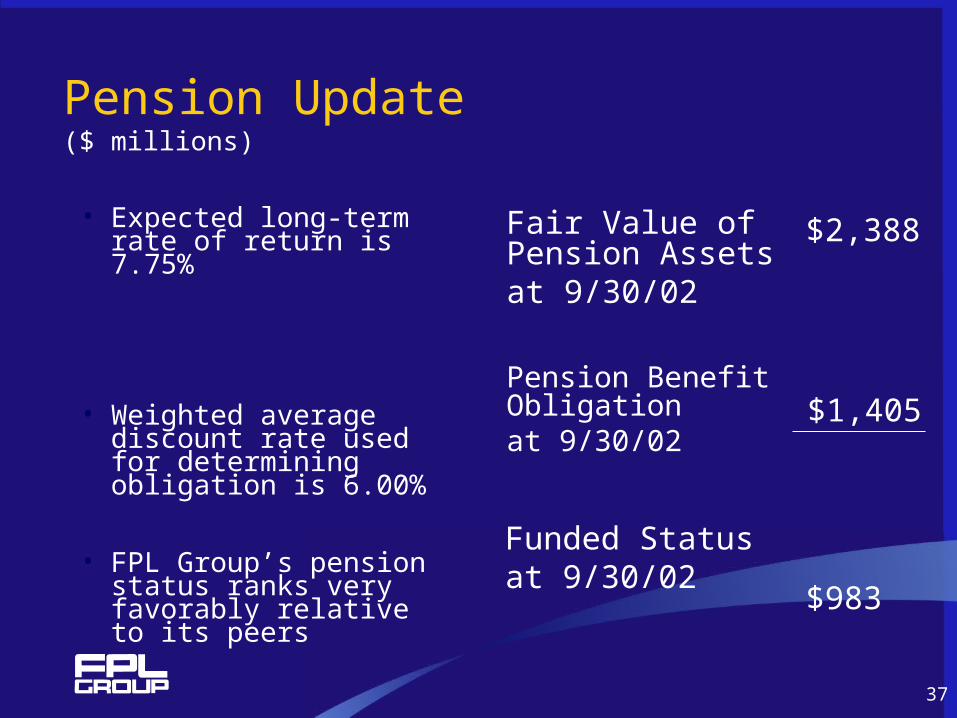
Pension Update($ millions)
• Expected long-term rate of return is 7.75%
• Weighted average discount rate used for determining obligation is 6.00%
• FPL Group’s pension status ranks very favorably relative to its peers
$983Funded Statusat 9/30/02
$1,405Pension Benefit Obligationat 9/30/02
$2,388Fair Value of Pension Assetsat 9/30/02
38
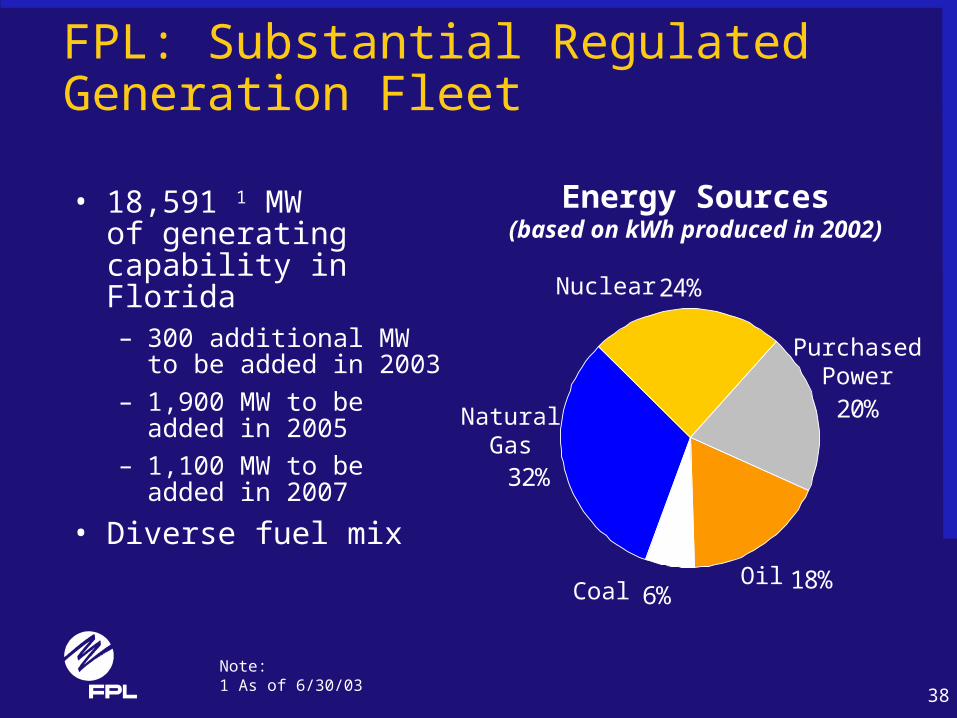
FPL: Substantial Regulated Generation Fleet
• 18,591 1 MW of generating capability in Florida– 300 additional MW to be
added in 2003
– 1,900 MW to be added in 2005
– 1,100 MW to be added in 2007
• Diverse fuel mix
24%
32%
20%
18%6%
Oil
Natural Gas
Nuclear
Coal
Purchased Power
Energy Sources(based on kWh produced in 2002)
Note:1 As of 6/30/03
39
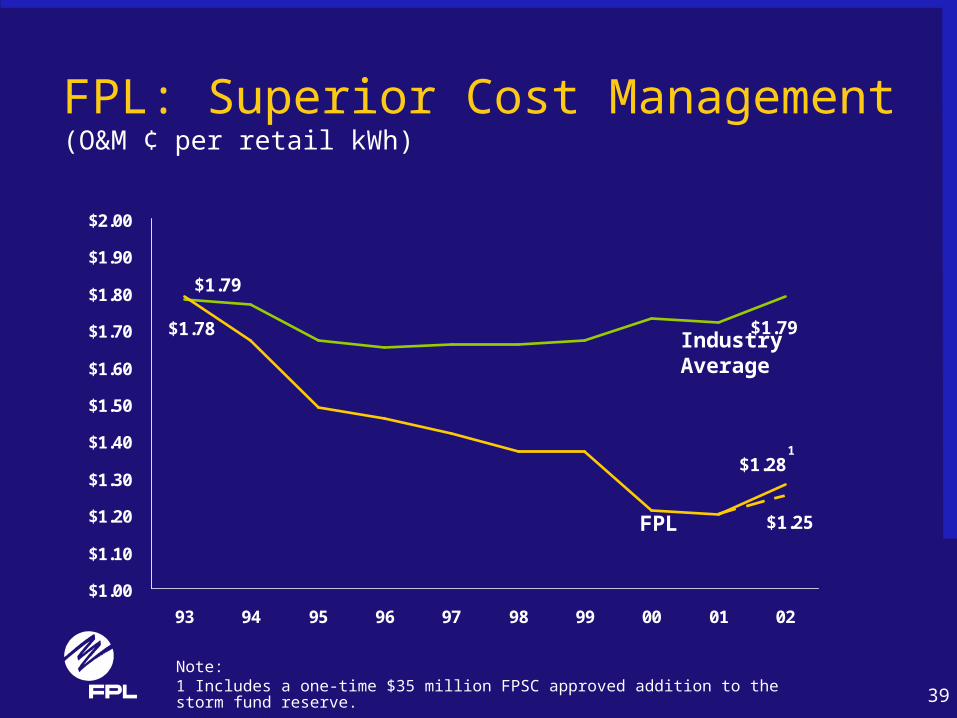
FPL: Superior Cost Management(O&M ¢ per retail kWh)
$1.79$1.78
$1.79
$1.28
$1.25
$1.00
$1.10
$1.20
$1.30
$1.40
$1.50
$1.60
$1.70
$1.80
$1.90
$2.00
93 94 95 96 97 98 99 00 01 02
Industry Average
FPL
1
Note:1 Includes a one-time $35 million FPSC approved addition to the storm fund reserve.

40
FPL: Potential Drivers of 2003Earnings Variability
See Safe Harbor Statement and SEC filings for full discussion of risks
Issue Variability Potential 2003 Impact
Balance of Year 1 Weather variability at 80% probability ±13¢
Customer growth ±1 to 2¢
Usage growth ±3 to 4¢
O&M expenses sensitivity
2% variation ±4¢
Note:1 As of 2Q03
41
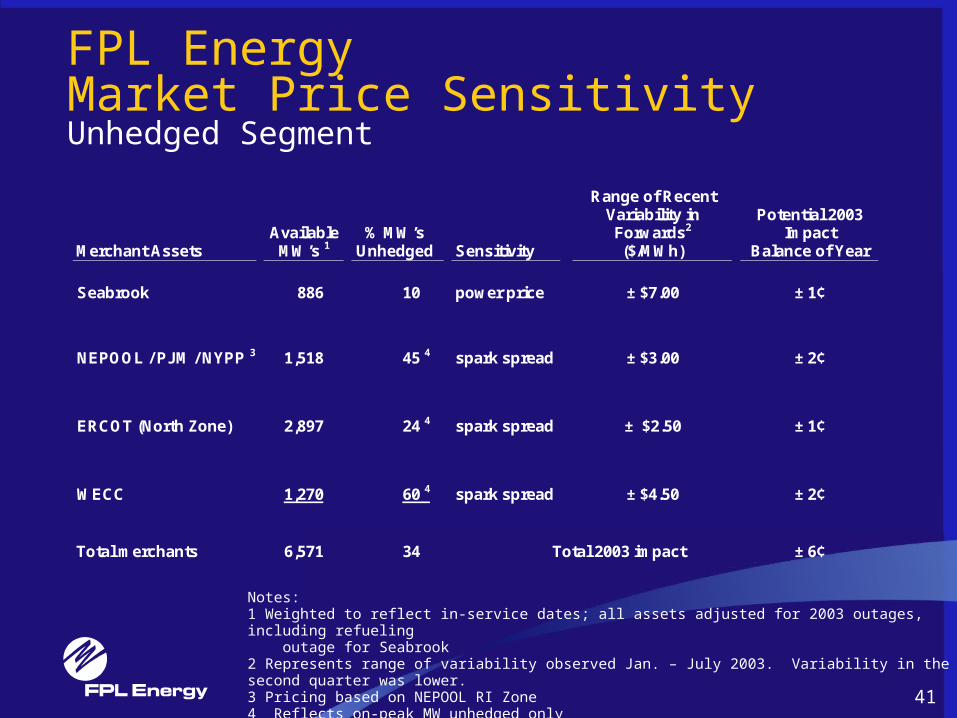
FPL Energy Market Price SensitivityUnhedged Segment
Notes:1 Weighted to reflect in-service dates; all assets adjusted for 2003 outages, including refueling outage for Seabrook2 Represents range of variability observed Jan. – July 2003. Variability in the second quarter was lower.3 Pricing based on NEPOOL RI Zone4 Reflects on-peak MW unhedged onlyAs of 2Q03
Merchant Assets Available
MW’s 1 % MW’s
Unhedged
Sensitivity
Range of Recent Variability in Forwards2 ($/MWh)
Potential 2003
Impact Balance of Year
Seabrook
886
10
power price
± $7.00
± 1¢
NEPOOL / PJM / NYPP 3
1,518
45 4
spark spread
± $3.00
± 2¢
ERCOT (North Zone)
2,897
24 4
spark spread
± $2.50
± 1¢
WECC
1,270
60 4
spark spread
± $4.50
± 2¢
Total merchants
6,571
34
Total 2003 impact ± 6¢
42
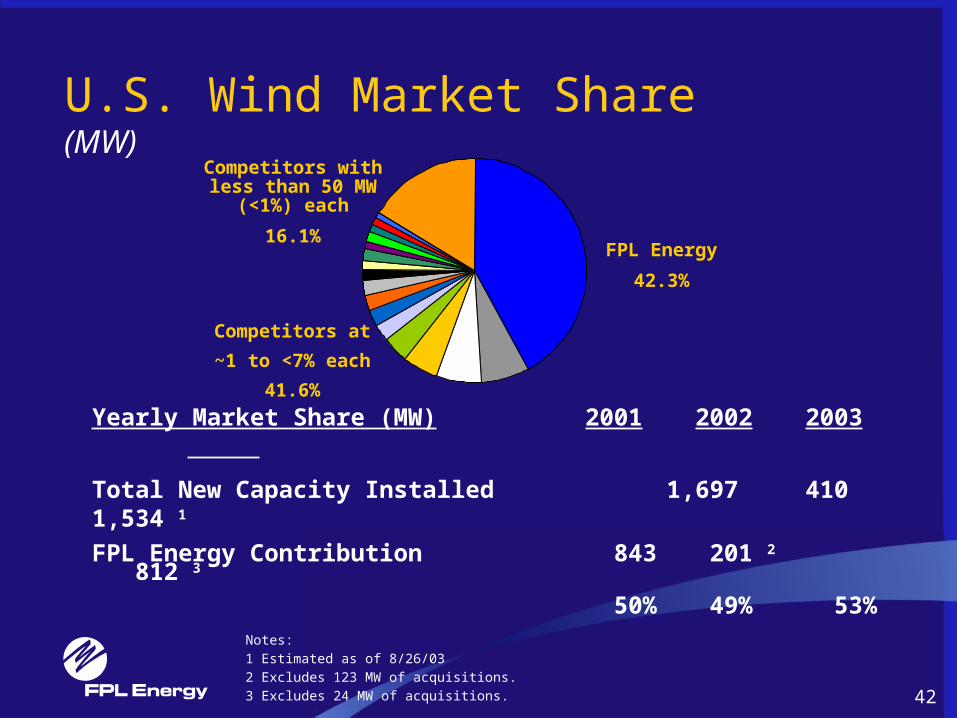
U.S. Wind Market Share (MW)
Yearly Market Share (MW) 2001 2002 2003
Total New Capacity Installed 1,697 410 1,534 1 FPL Energy Contribution 843 201 2 812 3
50% 49% 53%
FPL Energy
42.3%
Competitors with less than 50 MW
(<1%) each
16.1%
Competitors at
~1 to <7% each
41.6%
Notes:
1 Estimated as of 8/26/03
2 Excludes 123 MW of acquisitions.
3 Excludes 24 MW of acquisitions.
43
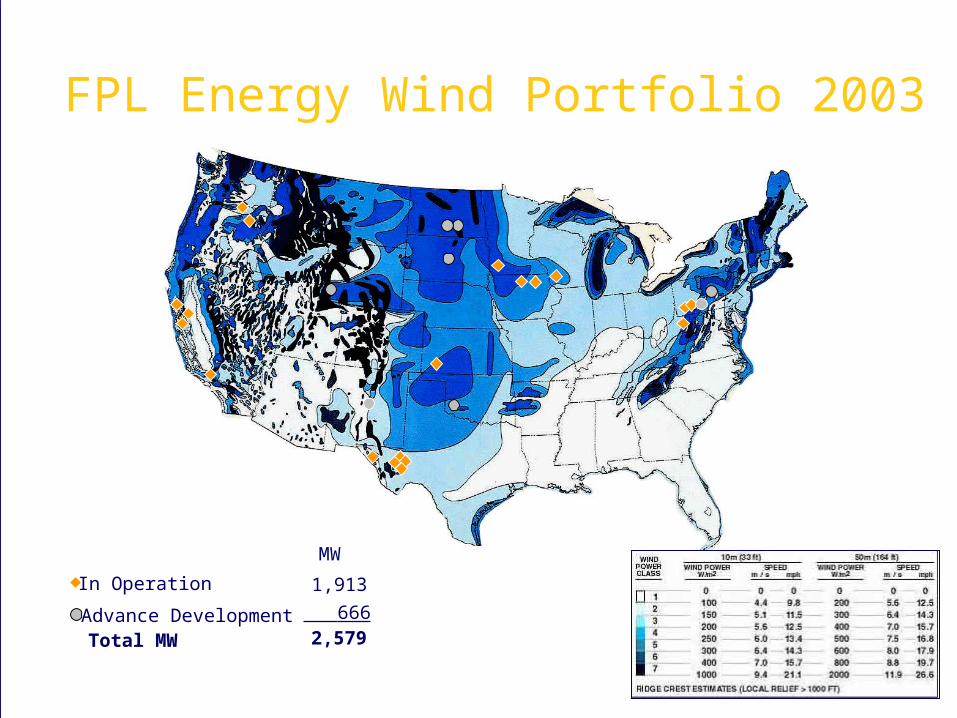
In Operation
Advance Development
FPL Energy Wind Portfolio 2003
1,913
666
Total MW 2,579
MW
Note:1 As of 9/1/03.
44
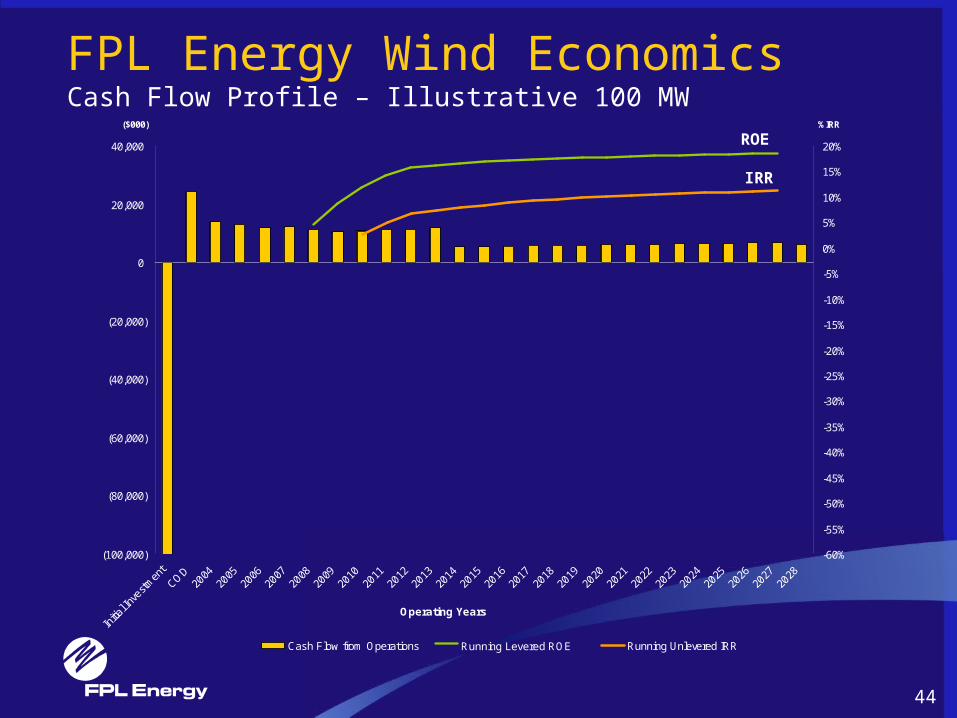
Running Levered ROE
(100,000)
(80,000)
(60,000)
(40,000)
(20,000)
0
20,000
40,000
Initia
l Inve
stmen
t
COD
2004
2005
2006
2007
2008
2009
2010
2011
2012
2013
2014
2015
2016
2017
2018
2019
2020
2021
2022
2023
2024
2025
2026
2027
2028
Operating Years
($000)
-60%
-55%
-50%
-45%
-40%
-35%
-30%
-25%
-20%
-15%
-10%
-5%
0%
5%
10%
15%
20%
%IRR
Cash Flow from Operations Running Unlevered IRR
FPL Energy Wind EconomicsCash Flow Profile – Illustrative 100 MW
ROE
IRR
45
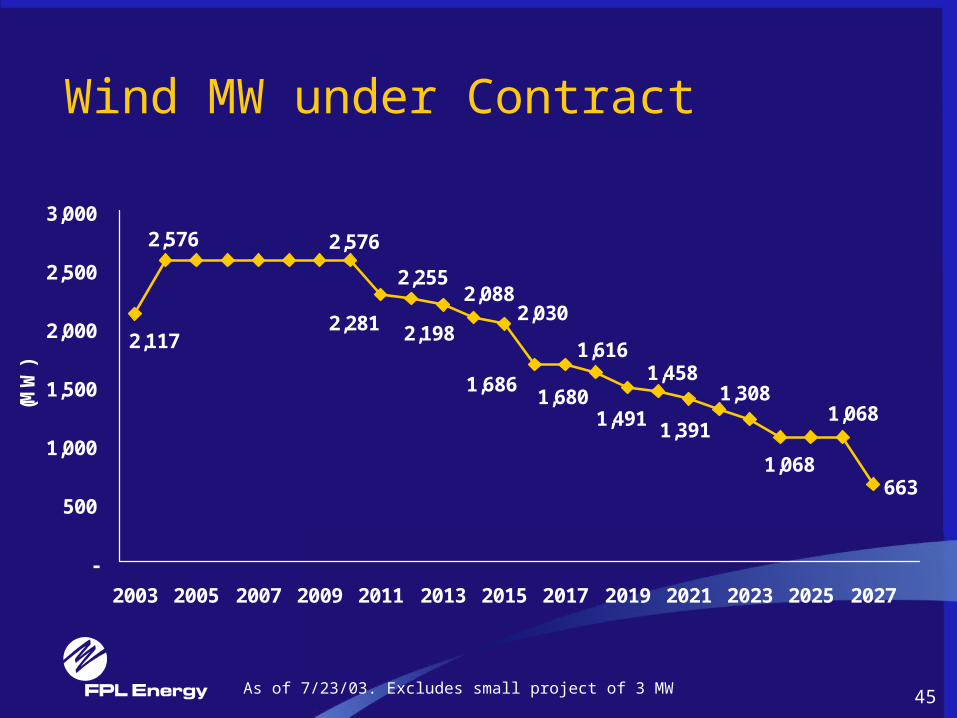
Wind MW under Contract
663
2,576 2,576
1,686
2,0302,088
2,255
2,281 2,198
1,491
1,616
1,6801,458
1,391
2,117
1,308
1,068
1,068
-
500
1,000
1,500
2,000
2,500
3,000
2003 2005 2007 2009 2011 2013 2015 2017 2019 2021 2023 2025 2027
(MW
)
As of 7/23/03. Excludes small project of 3 MW
46
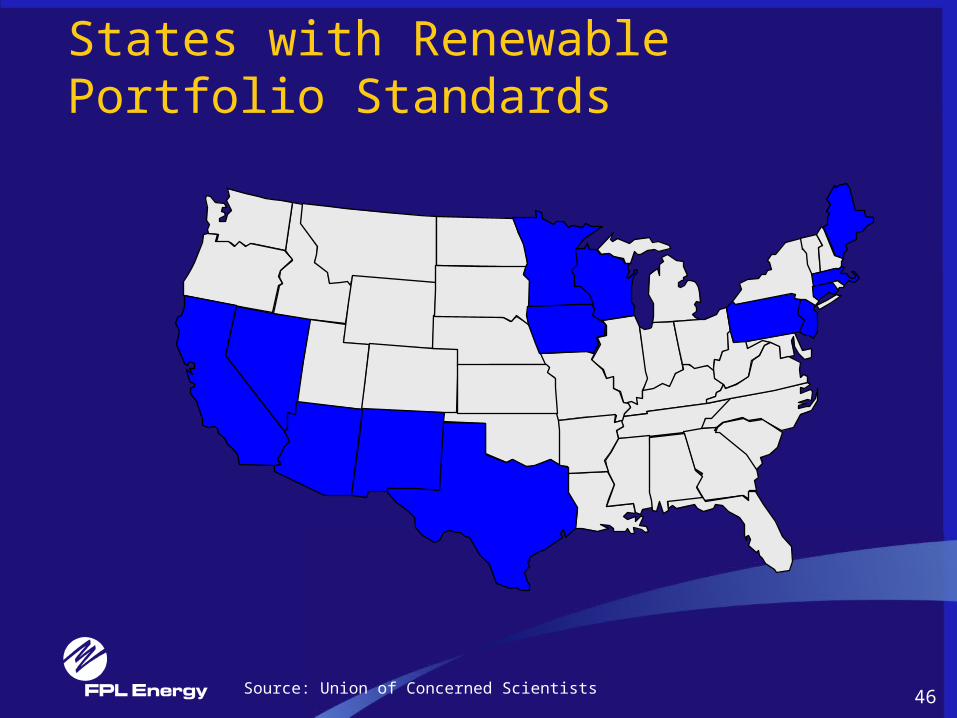
States with Renewable Portfolio Standards
Source: Union of Concerned Scientists
47
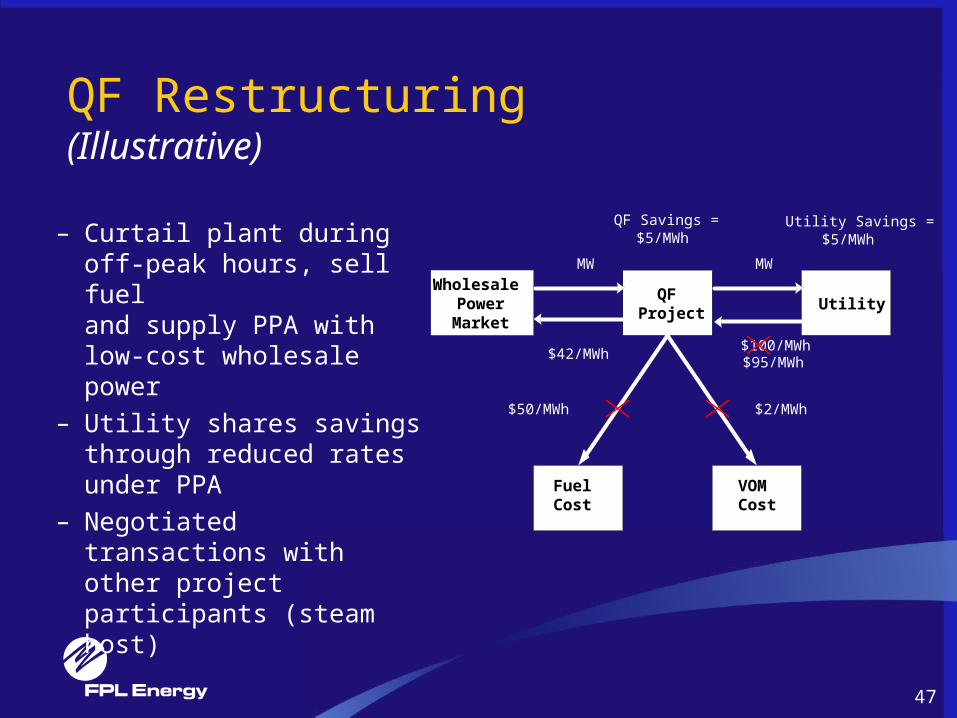
QF Restructuring (Illustrative)
– Curtail plant during off-peak hours, sell fuel and supply PPA with low-cost wholesale power
– Utility shares savings through reduced rates under PPA
– Negotiated transactions with other project participants (steam host)
QF Project
Wholesale PowerMarket
Utility
$100/MWh$95/MWh
MWMW
$42/MWh
Utility Savings = $5/MWh
Fuel Cost
$50/MWh
VOM Cost
$2/MWh
QF Savings = $5/MWh