Embed Size (px)
Citation preview

Highlight in tables
H2: 221 235 247
H2-3: 102 153 204
For client
A1: 233 28 34
For CS
A3: 145 134 126
L: 114 185 19
Excel color scheme
H: 242 62 42
A3: 145 134 126
A4: 214 35 42
A5: 112 48 160
A6: 0 138 162
A2: 0 159 224
A1: 0 83 159
Page title
Heading
Font color – 0 0 0
A1: 0 0 0
Page subtitle
A2: 145 134 126
A1: 0 0 0
The Leader in Food, Health and Wellness
Analyst Day Presentation May 15, 2018

Highlight in tables
H2: 221 235 247
H2-3: 102 153 204
For client
A1: 233 28 34
For CS
A3: 145 134 126
L: 114 185 19
Excel color scheme
H: 242 62 42
A3: 145 134 126
A4: 214 35 42
A5: 112 48 160
A6: 0 138 162
A2: 0 159 224
A1: 0 83 159
Page title
Heading
Font color – 0 0 0
A1: 0 0 0
Page subtitle
A2: 145 134 126
A1: 0 0 0
FORWARD LOOKING STATEMENTS
2
Important Notice Regarding Forward-Looking Statements
This communication contains certain “forward-looking statements” within the meaning of the Securities Act of 1933 and the Securities Exchange Act of 1934, both as amended by the Private Securities Litigation Reform Act of 1995. Statements that are not historical facts, including statements about the pending merger between Rite Aid Corporation (“Rite Aid”) and Albertsons Companies, Inc. (“Albertsons”) and the transactions contemplated thereby, and the parties perspectives and expectations, are forward looking statements. Such statements include, but are not limited to, statements regarding the benefits of the proposed merger, integration plans, guidance, expected synergies and revenue opportunities, anticipated future financial and operating performance and results, including estimates for growth and deleveraging goals, the expected management and governance of the combined company, and the expected timing of the transactions contemplated by the merger agreement. The words “expect,” “believe,” “estimate,” “intend,” “plan,” “goal,” “project,” “target” and similar expressions indicate forward-looking statements. These forward-looking statements are not guarantees of future performance and are subject to various risks and uncertainties, assumptions (including assumptions about general economic, market, industry and operational factors), known or unknown, which could cause the actual results to vary materially from those indicated or anticipated. Such risks and uncertainties include, but are not limited to, risks related to the expected timing and likelihood of completion of the pending merger, including the risk that the transaction may not close due to one or more closing conditions to the transaction not being satisfied or waived, such as regulatory approvals not being obtained, on a timely basis or otherwise, or that a governmental entity prohibited, delayed or refused to grant approval for the consummation of the transaction or required certain conditions, limitations or restrictions in connection with such approvals, or that the required approval of the merger agreement by the stockholders of Rite Aid was not obtained; risks related to the ability of Albertsons and Rite Aid to successfully integrate the businesses; the occurrence of any event, change or other circumstances that could give rise to the termination of the merger agreement (including circumstances requiring Rite Aid to pay Albertsons a termination fee pursuant to the merger agreement); the risk that there may be a material adverse change of Rite Aid or Albertsons; risks related to disruption of management time from ongoing business operations due to the proposed transaction; the risk that any announcements relating to the proposed transaction could have adverse effects on the market price of Rite Aid’s common stock, and the risk that the proposed transaction and its announcement could have an adverse effect on the ability of Rite Aid to retain customers and retain and hire key personnel and maintain relationships with their suppliers and customers and on their operating results and businesses generally; risks related to successfully integrating the businesses of the companies, which may result in the combined company not operating as effectively and efficiently as expected; the risk that the combined company may be unable to achieve cost-cutting synergies or it may take longer than expected to achieve those synergies; and risks associated with the financing of the proposed transaction. A further list and description of risks and uncertainties can be found in Rite Aid’s Annual Report on Form 10-K for the fiscal year ended March 3, 2018 filed with the Securities and Exchange Commission (“SEC”) and in the registration statement on Form S-4, that was filed with the SEC by Albertsons on April 6, 2018, as amended by Amendment No. 1 to the registration statement on Form S-4 filed with the SEC on May 15, 2018, as it may be further amended, in connection with the proposed merger, and other documents that the parties may file or furnish with the SEC, which you are encouraged to read. Should one or more of these risks or uncertainties materialize, or should underlying assumptions prove incorrect, actual results may vary materially from those indicated or anticipated by such forward-looking statements. Accordingly, you are cautioned not to place undue reliance on these forward-looking statements. Forward-looking statements relate only to the date they were made, and Rite Aid undertakes no obligation to update forward-looking statements to reflect events or circumstances after the date they were made except as required by law or applicable regulation. All information regarding Rite Aid assumes completion of Rite Aid’s previously announced transaction with Walgreens Boots Alliance, Inc. There can be no assurance that the consummation of such transaction will be completed on a timely basis, if at all. For further information on such transaction, see Rite Aid’s Form 8-K filed with the SEC on March 28, 2018.

Highlight in tables
H2: 221 235 247
H2-3: 102 153 204
For client
A1: 233 28 34
For CS
A3: 145 134 126
L: 114 185 19
Excel color scheme
H: 242 62 42
A3: 145 134 126
A4: 214 35 42
A5: 112 48 160
A6: 0 138 162
A2: 0 159 224
A1: 0 83 159
Page title
Heading
Font color – 0 0 0
A1: 0 0 0
Page subtitle
A2: 145 134 126
A1: 0 0 0
FORWARD LOOKING STATEMENTS (CONT’D)
3
Additional Information and Where to Find It
In connection with the proposed merger involving Rite Aid and Albertsons, Rite Aid and Albertsons have prepared and Albertsons has filed with the SEC on April 6, 2018 a registration statement on Form S-4, as amended by Amendment No.1 to the registration statement on Form S-4 filed with the SEC on May 15, 2018, as it may be further amended, that includes a proxy statement of Rite Aid that also constitutes a prospectus of Albertsons. The registration statement is not yet final and will be amended. Rite Aid will mail the proxy statement/prospectus and a proxy card to each stockholder entitled to vote at the special meeting relating to the proposed merger. Rite Aid and Albertsons also plan to file other relevant documents with the SEC regarding the proposed merger. INVESTORS ARE URGED TO READ THE DEFINITIVE PROXY STATEMENT/PROSPECTUS WHEN IT BECOMES AVAILABLE, AS WELL AS OTHER DOCUMENTS FILED WITH THE SEC, BECAUSE THEY WILL CONTAIN IMPORTANT INFORMATION. RITE AID’S EXISTING PUBLIC FILINGS WITH THE SEC SHOULD ALSO BE READ, INCLUDING THE RISK FACTORS CONTAINED THEREIN.
Investors and security holders may obtain copies of the Form S-4, including the proxy statement/prospectus, as well as other filings containing information about Rite Aid, free of charge, from the SEC’s Web site (www.sec.gov). Investors and security holders may also obtain Rite Aid’s SEC filings in connection with the transaction, free of charge, from Rite Aid’s Web site (www.RiteAid.com) under the link “Investor Relations” and then under the tab “SEC Filings,” or by directing a request to Rite Aid, Byron Purcell, Attention: Senior Director, Treasury Services & Investor Relations. Copies of documents filed with the SEC by Albertsons will be made available, free of charge, on Albertsons’ website at www.albertsonscompanies.com.
Participants in Solicitation
Rite Aid, Albertsons and their respective directors, executive officers and employees and other persons may be deemed to be participants in the solicitation of proxies from the holders of Rite Aid common stock in respect of the proposed transaction. Information regarding Rite Aid’s directors and executive officers is available in its definitive proxy statement for Rite Aid’s 2017 annual meeting of stockholders filed with the SEC on June 7, 2017, as modified or supplemented by any Form 3 or Form 4 filed with the SEC since the date of such definitive proxy statement. Information about the directors and executive officers of Albertsons is set forth in the registration statement on Form S-4, including the proxy statement/prospectus, that has been filed with the SEC on April 6, 2018, as amended by Amendment No.1 to the registration statement on Form S-4 filed with the SEC on May 15, 2018, as it may be further amended. Other information regarding the interests of the participants in the proxy solicitation may be included in the definitive proxy statement/prospectus when it becomes available. These documents can be obtained free of charge from the sources indicated above.
Non-Solicitation
This communication shall not constitute an offer to sell or the solicitation of an offer to sell or the solicitation of an offer to buy any securities, nor shall there be any sale of securities in any jurisdiction in which such offer, solicitation or sale would be unlawful prior to registration or qualification under the securities laws of any such jurisdiction. No offer of securities shall be made except by means of a prospectus meeting the requirements of Section 10 of the Securities Act of 1933, as amended.
Non-GAAP measures
This presentation includes certain non-GAAP measures, including EBITDA (Earnings before interest, tax, depreciation, and amortization), Adjusted EBITDA, pro forma Adjusted EBITDA, Adjusted EBITDA margin, free cash flow, free cash flow conversion ratio and net debt (collectively, the "Non-GAAP Measures"). These Non-GAAP Measures are performance measures that provide supplemental information that Albertsons and Rite Aid believe are useful to analysts and investors to evaluate ongoing results of operations, when considered alongside other GAAP measures such as net income, operating income and gross profit. These Non-GAAP Measures exclude the financial impact of items management does not consider in assessing the ongoing operating performance of Albertsons, Rite Aid or the combined company, and thereby facilitate review of its operating performance on a period-to-period basis. Other companies may have different capital structures or different lease terms, and comparability to the results of operations of Albertsons, Rite Aid or the combined company may be impacted by the effects of acquisition accounting on its depreciation and amortization. As a result of the effects of these factors and factors specific to other companies, Albertsons and Rite Aid believe these Non-GAAP measures provide helpful information to analysts and investors to facilitate a comparison of their operating performance to that of other companies. The appendix to this presentation includes a reconciliation of Adjusted EBITDA and pro forma Adjusted EBITDA to net income, which is the most directly comparable GAAP financial measures. The appearance of Non-GAAP Measures in this presentation should not be construed as an inference that its future results will be unaffected by unusual or non-recurring items. Except as otherwise noted herein, a reconciliation of Non-GAAP Measures has not been provided because such reconciliation could not be produced without unreasonable effort.

Highlight in tables
H2: 221 235 247
H2-3: 102 153 204
For client
A1: 233 28 34
For CS
A3: 145 134 126
L: 114 185 19
Excel color scheme
H: 242 62 42
A3: 145 134 126
A4: 214 35 42
A5: 112 48 160
A6: 0 138 162
A2: 0 159 224
A1: 0 83 159
Page title
Heading
Font color – 0 0 0
A1: 0 0 0
Page subtitle
A2: 145 134 126
A1: 0 0 0
TODAY’S PRESENTERS
4
Speaker: John Standley
Video: ABS-Rite Aid Timeline
John StandleyCEO
Jim DonaldPresident & COO, Albertsons
Kermit CrawfordPresident & COO, Rite Aid
Susan MorrisEVP & COO, Albertsons
Bryan EverettSEVP, COO Rite Aid Stores
Shane SampsonEVP & CMMO, Albertsons
Bob DimondEVP & CFO, Albertsons
Jocelyn KonradEVP Rite Aid Pharmacies
Darren KarstSEVP, CFO & CAO, Rite Aid

Highlight in tables
H2: 221 235 247
H2-3: 102 153 204
For client
A1: 233 28 34
For CS
A3: 145 134 126
L: 114 185 19
Excel color scheme
H: 242 62 42
A3: 145 134 126
A4: 214 35 42
A5: 112 48 160
A6: 0 138 162
A2: 0 159 224
A1: 0 83 159
Page title
Heading
Font color – 0 0 0
A1: 0 0 0
Page subtitle
A2: 145 134 126
A1: 0 0 0
AGENDA
5
I. Combination Rationale
II. Our Companies
i. Albertsons Overview
ii. Rite Aid Overview
III. Synergies
IV. Omni-channel Approach
V. Financials
VI. Bringing it All Together

Highlight in tables
H2: 221 235 247
H2-3: 102 153 204
For client
A1: 233 28 34
For CS
A3: 145 134 126
L: 114 185 19
Excel color scheme
H: 242 62 42
A3: 145 134 126
A4: 214 35 42
A5: 112 48 160
A6: 0 138 162
A2: 0 159 224
A1: 0 83 159
Page title
Heading
Font color – 0 0 0
A1: 0 0 0
Page subtitle
A2: 145 134 126
A1: 0 0 0
6
I. Combination Rationale
II. Our Companies
i. Albertsons Overview
ii. Rite Aid Overview
III. Synergies
IV. Omni-channel Approach
V. Financials
VI. Bringing it All Together

Highlight in tables
H2: 221 235 247
H2-3: 102 153 204
For client
A1: 233 28 34
For CS
A3: 145 134 126
L: 114 185 19
Excel color scheme
H: 242 62 42
A3: 145 134 126
A4: 214 35 42
A5: 112 48 160
A6: 0 138 162
A2: 0 159 224
A1: 0 83 159
Page title
Heading
Font color – 0 0 0
A1: 0 0 0
Page subtitle
A2: 145 134 126
A1: 0 0 0
7
DIFFERENTIATED LEADER IN FOOD, HEALTH AND WELLNESS
Note: Financial figures add together LTM statistics for Rite Aid and Albertsons Companies per respective latest Q4, other than share in MSA which is an Albertsons figure, and lives under management (Includes Envision Rx Options)
(1) Revenue and Adjusted EBITDA is based on FY’18 guidance for both Rite Aid and Albertsons. Adj. EBITDA includes ~$80m in year one expected cost synergies.
4,868 Stores
4,327 Pharmacies
$83bn Revenue(1)
$3.4bn Adj. EBITDA(1)
$12bn Own Brands
336,000 Associates
40+ million Customers per week
#1 or #2 Share in ~66% of MSAs
Integrated PBM Platform
Over 4 million lives under management
Highly recognizable banners
Speaker: John Standley

Highlight in tables
H2: 221 235 247
H2-3: 102 153 204
For client
A1: 233 28 34
For CS
A3: 145 134 126
L: 114 185 19
Excel color scheme
H: 242 62 42
A3: 145 134 126
A4: 214 35 42
A5: 112 48 160
A6: 0 138 162
A2: 0 159 224
A1: 0 83 159
Page title
Heading
Font color – 0 0 0
A1: 0 0 0
Page subtitle
A2: 145 134 126
A1: 0 0 0
Strong position and local scale in highly attractive markets
Unique opportunity to build narrow networks and drive significant loyalty among pharmacy and grocery customers
Growing our eCommerce capabilities is critical to meeting our customers needs, where, when and how they want to shop
Leveraging our strong loyalty program and business data to further strengthen our relationship with our customers, while the use of technology will enhance our competitive
strengths
Significant expected revenue opportunities and cost synergies results in compelling financial profile
One of the largest food and drug retailers with strong recognizable brands
8
COMBINATION HIGHLIGHTS
Strengthened Scale & Recognizable Brand Portfolio
1
Strong Market Share & Local Presence
Unique Pharmacy + Grocery
Combination
Enhancing Omni-Channel
Approach
Leveraging Technology Capabilities
Compelling Financial Profile
2
4
5
6
3
Speaker: John Standley

Highlight in tables
H2: 221 235 247
H2-3: 102 153 204
For client
A1: 233 28 34
For CS
A3: 145 134 126
L: 114 185 19
Excel color scheme
H: 242 62 42
A3: 145 134 126
A4: 214 35 42
A5: 112 48 160
A6: 0 138 162
A2: 0 159 224
A1: 0 83 159
Page title
Heading
Font color – 0 0 0
A1: 0 0 0
Page subtitle
A2: 145 134 126
A1: 0 0 0
INCUMBENTS ARE EXPLORING NEW BUSINESS MODELS IN AN EVOLVING HEALTHCARE LANDSCAPE
Ability to engage with patients in low cost
settings
Pharmacy as key point to the healthcare
ecosystem
Horizontal acquisitions to leverage scale
Convergence with retail
Drive customers to stores, focusing on overlapping populations and develop value
added services in convenient formats
Expand clinics and other value added services in Albertsons stores
Use retail pharmacy to reduce healthcare costs
Build density and scale to increase access, attract narrow networks and
reduce operating costs
Vertical integration to reduce cost
Use PBM to improve clinical outcomes and reduce healthcare costs
Key Trends Strategic Partnerships or Acquisitions Albertsons Rite Aid Combination Opportunities
Co-Branded Rx Plan (PDP)
The Albertsons / Rite Aid combination addresses key industry trends, combining differentiated health and wellness positioning with a unique set of consumer touchpoints
9
(1) Stores only, excluding the PBM.
(1)
Speaker: John Standley

Highlight in tables
H2: 221 235 247
H2-3: 102 153 204
For client
A1: 233 28 34
For CS
A3: 145 134 126
L: 114 185 19
Excel color scheme
H: 242 62 42
A3: 145 134 126
A4: 214 35 42
A5: 112 48 160
A6: 0 138 162
A2: 0 159 224
A1: 0 83 159
Page title
Heading
Font color – 0 0 0
A1: 0 0 0
Page subtitle
A2: 145 134 126
A1: 0 0 0
$318
$186
$123 $112
$82 $72 $60
$22
Source: Company filings and Wall Street Equity research estimates. (1) Approximate data as of May 5, 2018, rounded to nearest 10. (2) Includes 1,695 pharmacies within Target stores. (3) Includes 1,932 pharmacies acquired from Rite Aid and pro forma for announced 600 store closures. (4) Target pharmacies are operated by CVS and are also captured in CVS store count. 10
LTM U.S. Revenue ($ billions)
Significantly improves scale and competitive position
US Pharmacy Counters(1)
Top Food & Drug Retailers
4,640 9,760(2) 9,430(3) 2,270 4,330 --(4) 2,550
TRANSACTION CATAPULTS US TO BE ONE OF THE LARGEST FOOD AND PHARMACY PROVIDERS IN THE COUNTRY
1,780
Speaker: John Standley
$132
Pharmacy Services

Highlight in tables
H2: 221 235 247
H2-3: 102 153 204
For client
A1: 233 28 34
For CS
A3: 145 134 126
L: 114 185 19
Excel color scheme
H: 242 62 42
A3: 145 134 126
A4: 214 35 42
A5: 112 48 160
A6: 0 138 162
A2: 0 159 224
A1: 0 83 159
Page title
Heading
Font color – 0 0 0
A1: 0 0 0
Page subtitle
A2: 145 134 126
A1: 0 0 0
#1 integrated food and drug retailer on the West Coast(1)
Strong position in the Northeast
Note: Rite Aid information is pro forma for its store divestitures to WBA. The sale of all stores under the asset purchase agreement with WBA was completed in March 2018; the transfer of three remaining distribution centers and related inventory is expected to begin after September 1, 2018. For Albertsons, state of Alaska is part of Seattle operating division and state of Hawaii is part of the Nor Cal operating division.
(1) Ranked by store count. (2) Pharmacy share (green circle) based on number of stores vs. other pharmacy stores in a given state. (3) Grocery regional ranks (blue circle) based on Nielsen Food Channel analysis data (excluding mass) for calendar Q3’17 across Albertsons’ operating divisions. 11
OUR LOCAL PRESENCE IN ATTRACTIVE MARKETS IS KEY TO SERVING OUR CUSTOMERS
#2
Eastern
#1
#3
#3
#2
#2
#1
#3
#1
#3
#2
#2
#1
#3
Southern
#2
Denver
#2
#1
Intermountain
#1
#1
#1
Seattle
#1
Portland
#1
Nor Cal
#1
So Cal
#2
Southwest
#1
#3
#2
# # Total pharmacy count(2) Grocery regional rank(3) Rite Aid location Albertsons location
#1
Jewel Osco
Acme
Shaw’s
United
Speaker: John Standley

Highlight in tables
H2: 221 235 247
H2-3: 102 153 204
For client
A1: 233 28 34
For CS
A3: 145 134 126
L: 114 185 19
Excel color scheme
H: 242 62 42
A3: 145 134 126
A4: 214 35 42
A5: 112 48 160
A6: 0 138 162
A2: 0 159 224
A1: 0 83 159
Page title
Heading
Font color – 0 0 0
A1: 0 0 0
Page subtitle
A2: 145 134 126
A1: 0 0 0
WITH HIGHLY RECOGNIZABLE BANNERS
12
We Have a National Footprint and Density in Attractive Markets
Note: Rite Aid information is pro forma for its store divestitures to WBA. The sale of all stores under the asset purchase agreement with WBA was completed in March 2018; the transfer of three remaining distribution centers and related inventory is expected to begin after September 1, 2018.
Speaker: John Standley

Highlight in tables
H2: 221 235 247
H2-3: 102 153 204
For client
A1: 233 28 34
For CS
A3: 145 134 126
L: 114 185 19
Excel color scheme
H: 242 62 42
A3: 145 134 126
A4: 214 35 42
A5: 112 48 160
A6: 0 138 162
A2: 0 159 224
A1: 0 83 159
Page title
Heading
Font color – 0 0 0
A1: 0 0 0
Page subtitle
A2: 145 134 126
A1: 0 0 0
COMBINATION STRENGTHENS OUR PHARMACY PRESENCE IN IMPORTANT STATES
13
(1) Share based on number of pharmacy counters in a given state. (2) Includes all Philadelphia area CBSAs.
State Pharmacy counters
Counter
Share(1)
Total
Pharmacy Counters
Counter
Share(1) Rank
CA 569 10.4% 945 17.3% #2
PA(2) 614 19.6% 676 21.6% #1
WA 138 13.3% 329 31.7% #1
OR 73 12.9% 182 32.0% #1
Speaker: John Standley

Highlight in tables
H2: 221 235 247
H2-3: 102 153 204
For client
A1: 233 28 34
For CS
A3: 145 134 126
L: 114 185 19
Excel color scheme
H: 242 62 42
A3: 145 134 126
A4: 214 35 42
A5: 112 48 160
A6: 0 138 162
A2: 0 159 224
A1: 0 83 159
Page title
Heading
Font color – 0 0 0
A1: 0 0 0
Page subtitle
A2: 145 134 126
A1: 0 0 0
WE ARE EXPANDING OUR CONVENIENCE IN OUR MOST ATTRACTIVE MARKETS
14
Speaker: John Standley

Highlight in tables
H2: 221 235 247
H2-3: 102 153 204
For client
A1: 233 28 34
For CS
A3: 145 134 126
L: 114 185 19
Excel color scheme
H: 242 62 42
A3: 145 134 126
A4: 214 35 42
A5: 112 48 160
A6: 0 138 162
A2: 0 159 224
A1: 0 83 159
Page title
Heading
Font color – 0 0 0
A1: 0 0 0
Page subtitle
A2: 145 134 126
A1: 0 0 0
UNIQUE COMBINATION OF PHARMACY & GROCERY PROVIDES A COMPETITIVE ADVANTAGE
15
Standalone Pharmacies
Fresh(1)
PBM
Drive Up & Go & Grocery Delivery
Meal Kits in-store and online
subscription
Loyalty Program
(1) Includes produce, meat, seafood, deli and bakery.
Speaker: John Standley

Highlight in tables
H2: 221 235 247
H2-3: 102 153 204
For client
A1: 233 28 34
For CS
A3: 145 134 126
L: 114 185 19
Excel color scheme
H: 242 62 42
A3: 145 134 126
A4: 214 35 42
A5: 112 48 160
A6: 0 138 162
A2: 0 159 224
A1: 0 83 159
Page title
Heading
Font color – 0 0 0
A1: 0 0 0
Page subtitle
A2: 145 134 126
A1: 0 0 0
~$24
~$66
~$92
Grocery customer Rx customerGrocery spend Rx spend
FOCUSING ON OUR RELATIONSHIP WITH OUR MOST VALUABLE CUSTOMERS
16
Spend per transaction
>3.5x Higher total spend per
week
>2.5x Higher grocery
spend per week
(1) Based on Albertsons customer data for FY’17 Q3. (2) Does not include Front End or EnvisionRx sales.
Albertsons Rx Customers Spend Significantly More Than Non-Rx Customers(1)
Our nationally recognized pharmacy brand will appeal to preferred networks and drive valuable incremental pharmacy customers
~$26
Speaker: John Standley
4,327 Pharmacies
$15bn Annual Combined Pharmacy Sales(2)
317m Annual Combined Script Count
Rx customers visit 2.3x per week vs. 0.8x for non-Rx
~325 Health Clinics
National Pharmacy Brand With More Options And Convenience For Customers

Highlight in tables
H2: 221 235 247
H2-3: 102 153 204
For client
A1: 233 28 34
For CS
A3: 145 134 126
L: 114 185 19
Excel color scheme
H: 242 62 42
A3: 145 134 126
A4: 214 35 42
A5: 112 48 160
A6: 0 138 162
A2: 0 159 224
A1: 0 83 159
Page title
Heading
Font color – 0 0 0
A1: 0 0 0
Page subtitle
A2: 145 134 126
A1: 0 0 0
UNMATCHED MANUFACTURING AND DISTRIBUTION NETWORK WITH COMPREHENSIVE OWN BRANDS INNOVATION
17
Rite Aid Distribution Centers
Albertsons Distribution Centers
Albertsons Manufacturing facilities
National Vertically Integrated Network
Note: Financial figures reflect FY’17 statistics.
We manufacture $1.3bn in our facilities, of which $930m is our Own Brands
Growing Own Brands: $12bn+ combined business
driving customer loyalty
Distinguished Own Brands Portfolio
Four $1bn+ brands: O Organics, Lucerne,
Signature Select and Signature Cafe
Speaker: John Standley

Highlight in tables
H2: 221 235 247
H2-3: 102 153 204
For client
A1: 233 28 34
For CS
A3: 145 134 126
L: 114 185 19
Excel color scheme
H: 242 62 42
A3: 145 134 126
A4: 214 35 42
A5: 112 48 160
A6: 0 138 162
A2: 0 159 224
A1: 0 83 159
Page title
Heading
Font color – 0 0 0
A1: 0 0 0
Page subtitle
A2: 145 134 126
A1: 0 0 0
19%
23%
30%
Rite Aid Albertsons Goal
OWN BRANDS CATEGORY EXPERTISE ACROSS FORMATS WILL DRIVE COMBINED PENETRATION
18
Driving Combined Penetration(1)
Use Albertsons Own Brands in food and consumables to transform the Rite Aid Front End
Use Rite Aid Own Brands and expertise to grow Albertsons GM/HBC(2)
Own Brands Strategy
(Own Brands % revenue mix)
(1) Represents year end combined penetration for Rite Aid and Albertsons. (2) Represents General Merchandise / Health & Beauty Care products.
Quarterly Trips
Quarterly Spend
10
$324 $415
13
ABS Heavy Own Brands Buyer ABS Total Store Shopper
Private Label velocity is 2x that of branded equivalents
Speaker: John Standley

Highlight in tables
H2: 221 235 247
H2-3: 102 153 204
For client
A1: 233 28 34
For CS
A3: 145 134 126
L: 114 185 19
Excel color scheme
H: 242 62 42
A3: 145 134 126
A4: 214 35 42
A5: 112 48 160
A6: 0 138 162
A2: 0 159 224
A1: 0 83 159
Page title
Heading
Font color – 0 0 0
A1: 0 0 0
Page subtitle
A2: 145 134 126
A1: 0 0 0
BUILDING STRONG RELATIONSHIPS WITH OUR CUSTOMERS THROUGH OMNI-CHANNEL OFFERING
19
Fulfillment
People
Digital
PBM
Retail
Fulfillment
Retail
Marketplace
Digital
PBM
Brands/Offerings
Seamlessly providing what the customers want, where, when and how they want it
Speaker: John Standley

Highlight in tables
H2: 221 235 247
H2-3: 102 153 204
For client
A1: 233 28 34
For CS
A3: 145 134 126
L: 114 185 19
Excel color scheme
H: 242 62 42
A3: 145 134 126
A4: 214 35 42
A5: 112 48 160
A6: 0 138 162
A2: 0 159 224
A1: 0 83 159
Page title
Heading
Font color – 0 0 0
A1: 0 0 0
Page subtitle
A2: 145 134 126
A1: 0 0 0
GROWING OUR ECOMMERCE CAPABILITIES IS CRITICAL TO OUR OVERALL STRATEGY
20
In-store offering will be in 650+ premium stores by end of FY’18
Seamlessly providing what the customers want, where, when and how they want it
Commitment to same-day convenience across Food, Health and Wellness
Anticipate doubling Plated subscriber base and revenue in FY’18 Intent to further partner with Rite Aid to offer same day front end and pharmacy services
Goal is to double Plated revenue this year, and we are currently on track
Ramping up aggressively, and targeting to be over $400m run-rate by end of FY’18
Rush delivery covering over 1,700 Albertsons stores, ramping up to 2,000+ by
middle of FY’18
~50% of stores provide Rx delivery service
1,350+ stores currently offer Drive-Thru capabilities
Grocery delivery business with loyal customer base and double digit YoY order growth (1,000 trucks, 2,500 employees)
On track for 500 Drive Up & Go pick up points by
end of FY’18
Albertsons’ home grown eCommerce offerings
Rite Aid Drive Thru pharmacies and home delivery
Speaker: John Standley

Highlight in tables
H2: 221 235 247
H2-3: 102 153 204
For client
A1: 233 28 34
For CS
A3: 145 134 126
L: 114 185 19
Excel color scheme
H: 242 62 42
A3: 145 134 126
A4: 214 35 42
A5: 112 48 160
A6: 0 138 162
A2: 0 159 224
A1: 0 83 159
Page title
Heading
Font color – 0 0 0
A1: 0 0 0
Page subtitle
A2: 145 134 126
A1: 0 0 0
PROPRIETARY TECHNOLOGY AS A COMPETITIVE STRENGTH AND A POWERFUL ENABLER
21
Digital Platform eCommerce Loyalty & Reward Customer Data
Data Science DC Automation Pricing & Promotions In-store Technology
Building a state-of-the-art digital platform
Robust mobile app functionality with script refills
Identified and driving eight high impact projects to unlock value in utilizing business analytics and data science
Growth strategy: Home Delivery, Drive Up & Go, Instacart, plans to roll-out Marketplace
Committed to automating DCs to improve labor productivity, increase storage capacity and improve inventory management
Increased registrations, new programs, and digital vendor partnerships
Hyper-personalization
Modernized and integrated promotion planning systems to remove friction points to increase efficiency and effectiveness
Leveraging customer data for assortment and merchandising through Shopper 360 platform
Automated personalization platform
Daily social media monitoring
Modernize technology in stores to expedite check-out and allow customer connectivity
Improve inventory ordering and production accuracy
Beacons / GPS with push notifications in every Rite Aid
Face First technology in select stores
Speaker: Kevin Turner

Highlight in tables
H2: 221 235 247
H2-3: 102 153 204
For client
A1: 233 28 34
For CS
A3: 145 134 126
L: 114 185 19
Excel color scheme
H: 242 62 42
A3: 145 134 126
A4: 214 35 42
A5: 112 48 160
A6: 0 138 162
A2: 0 159 224
A1: 0 83 159
Page title
Heading
Font color – 0 0 0
A1: 0 0 0
Page subtitle
A2: 145 134 126
A1: 0 0 0
SUBSTANTIAL SYNERGY OPPORTUNITIES
22
$375m Run-Rate Cost Synergies Expected to fully realize within 36 months
$3.6bn Incremental Revenue Opportunities Driving traffic and growth
COGS 75%
SG&A 25%
Partner with EnvisionRxOptions, other PBMs and local payors to form preferred pharmacy networks
Rebrand certain existing Albertsons pharmacies as Rite Aid and integrate loyalty programs to drive traffic
Leverage Front End capabilities and pharmacy expertise to enhance customer offering
Broaden health and wellness value proposition and create a best-in-class omni-channel retail experience
Run-rate cost synergies and incremental revenue opportunities expected to be realized by the end of February 2022, with associated one-time cost of $400m and $300m, respectively
Speaker: John Standley

Highlight in tables
H2: 221 235 247
H2-3: 102 153 204
For client
A1: 233 28 34
For CS
A3: 145 134 126
L: 114 185 19
Excel color scheme
H: 242 62 42
A3: 145 134 126
A4: 214 35 42
A5: 112 48 160
A6: 0 138 162
A2: 0 159 224
A1: 0 83 159
Page title
Heading
Font color – 0 0 0
A1: 0 0 0
Page subtitle
A2: 145 134 126
A1: 0 0 0
STRENGTHENED FINANCIAL PROFILE
23
$ billions
+ Expected Synergies
Store count 2,550 2,318 4,868
Revenues(1) $ 22.0 $ 61.0 $ 83.0 +$3.6bn Revenue
opportunities
Adj. EBITDA(1)
% margin $ 0.6(2)
3.0% $ 2.7
4.4% $ 3.4 4.1%
$ 3.7(3)
4.5%
Net Debt / Adj. EBITDA(4)
4.2x
4.3x
4.2x(5)
3.9x(5)
Note: Store counts are as of Q4 ending February 2018 for Albertsons and March 3rd, 2018 for Rite Aid. (1) Figures presented are estimates for FY’18E ending February 2019. Rite Aid projected EBITDA at the midpoint of guidance ( ~$645m) and Albertsons projected EBITDA ~$2,700m. Rite Aid and Albertsons combined
projected EBITDA includes ~$80m in year one expected cost synergies. (2) On February 20, Rite Aid provided adjusted EBITDA and net income guidance for its 2019 fiscal year. Rite Aid expects adjusted EBITDA to be in the range of $615 million to $675 million, and net income (loss) to be in the
range of ($95 million) to ($40 million). For further information about this guidance, including a reconciliation of the adjusted EBITDA range to the net income (loss) range (the most comparable GAAP number), see Rite Aid's Form 8-K dated February 20, 2018.
(3) Includes expected full run-rate cost synergies of $375m that Rite Aid and Albertsons believe can be realized by the end of February 2022, with an associated one-time cost of $400 million. (4) Rite Aid net debt of $2.7bn (inclusive of proceeds from sale of distribution centers) and Albertsons net debt of $11.2bn as of Q4 FY’18 for Rite Aid and Q4 FY’17 for Albertsons. (5) Pro forma net debt as of 2/24/2018 of $14.5bn includes expected proceeds from WBA transaction, refinancing, transaction costs and $200m potential cash consideration from cash election.
Target <2.75x within
36 months
Speaker: John Standley

Highlight in tables
H2: 221 235 247
H2-3: 102 153 204
For client
A1: 233 28 34
For CS
A3: 145 134 126
L: 114 185 19
Excel color scheme
H: 242 62 42
A3: 145 134 126
A4: 214 35 42
A5: 112 48 160
A6: 0 138 162
A2: 0 159 224
A1: 0 83 159
Page title
Heading
Font color – 0 0 0
A1: 0 0 0
Page subtitle
A2: 145 134 126
A1: 0 0 0
Valuable Real Estate Portfolio
SUPPORTED BY LARGE, DIVERSIFIED FREE CASH FLOW AND A VALUABLE REAL ESTATE PORTFOLIO
24
Highly valuable “first and main” locations
High proportion of owned and ground-leased supermarket properties
Significant number of “trophy” locations with opportunities for development
Approximately 590 Albertsons stores remodeled over the last three years(1) and 1,649 Rite Aid remodels since FY’12
(1) Defined as Adjusted EBITDA – Capex (excluding synergies). Based on FY’18E ending February 2019. (2) Appraisals of Albertsons’ real estate portfolio conducted by Cushman & Wakefield in 2016. The $11.2bn excludes $870M in appraised value associated with the
FY’17 Sale-Leaseback transactions. (3) S&LB represents Sale and Leaseback transaction.
Strong and Diversified Cash Flow
$11bn Value of total appraised
real estate portfolio(2)
+13% Avg. value upside vs. appraised value realized in FY’17 S&LB(3)
$1.5
$0.4 $1.9
Albertsons Rite Aid Combined
Grocery 72% Pharmacy
13%
Front End 8%
PBM 7%
FY’17 Combined Revenue Split
FY’18E Combined Free Cash Flow(1)
($ in billions)
Speaker: John Standley

Highlight in tables
H2: 221 235 247
H2-3: 102 153 204
For client
A1: 233 28 34
For CS
A3: 145 134 126
L: 114 185 19
Excel color scheme
H: 242 62 42
A3: 145 134 126
A4: 214 35 42
A5: 112 48 160
A6: 0 138 162
A2: 0 159 224
A1: 0 83 159
Page title
Heading
Font color – 0 0 0
A1: 0 0 0
Page subtitle
A2: 145 134 126
A1: 0 0 0
OUR PLAN DELIVERS ACCELERATED GROWTH IN REVENUE & PROFITABILITY
25
1.5% 2.0%
1.0%
1.0%
1.0%
1.5%
Low High
4.0% 5.0%
2.0%
3.0% 0.0%
0.5% 5.0%
6.5%
Low High
Revenue Adj. EBITDA Adj. EPS
Core Retail Business
PBM Synergies
Expected revenue growth
3.5% – 4.5%
Growth Outlook – 3 year CAGR
Safeway Synergies / Shrink / Other
Baseline growth assumptions
are in line with the industry
One-time beneficial items,
including shrink reduction and
incremental Safeway
synergies, accelerate our
short-term growth
Our growth will be further
accelerated by the compelling
revenue opportunities & cost
synergies
Investment in our PBM asset,
EnvisionRx, will further
increase sales, customer count
and lives under coverage
Expected Adj. EBITDA growth
11% – 15%
Speaker: John Standley

Highlight in tables
H2: 221 235 247
H2-3: 102 153 204
For client
A1: 233 28 34
For CS
A3: 145 134 126
L: 114 185 19
Excel color scheme
H: 242 62 42
A3: 145 134 126
A4: 214 35 42
A5: 112 48 160
A6: 0 138 162
A2: 0 159 224
A1: 0 83 159
Page title
Heading
Font color – 0 0 0
A1: 0 0 0
Page subtitle
A2: 145 134 126
A1: 0 0 0
26
I. Combination Rationale
II. Our Companies
i. Albertsons Overview
ii. Rite Aid Overview
III. Synergies
IV. Omni-channel Approach
V. Financials
VI. Bringing it All Together

Highlight in tables
H2: 221 235 247
H2-3: 102 153 204
For client
A1: 233 28 34
For CS
A3: 145 134 126
L: 114 185 19
Excel color scheme
H: 242 62 42
A3: 145 134 126
A4: 214 35 42
A5: 112 48 160
A6: 0 138 162
A2: 0 159 224
A1: 0 83 159
Page title
Heading
Font color – 0 0 0
A1: 0 0 0
Page subtitle
A2: 145 134 126
A1: 0 0 0
OUR PHILOSOPHY AND CULTURE
27
“Our Customers’ Favorite Local Supermarket” At Albertsons Companies, our purpose is to be the best local supermarket for
our customers, employees, partners and communities across the U.S.
We’re about Our Communities
We’re about Our People
Supporting causes that impact our customers l ives
$300m Donated 2.8m
Individuals Reached
2,000 Organizations
Affected
We’re about Our Communities
We’re about Our Communities
Speaker: Jim Donald
We’re about Our Communities
We focus on Store Operations
Full, Fresh, Friendly, Fast, Clean

Highlight in tables
H2: 221 235 247
H2-3: 102 153 204
For client
A1: 233 28 34
For CS
A3: 145 134 126
L: 114 185 19
Excel color scheme
H: 242 62 42
A3: 145 134 126
A4: 214 35 42
A5: 112 48 160
A6: 0 138 162
A2: 0 159 224
A1: 0 83 159
Page title
Heading
Font color – 0 0 0
A1: 0 0 0
Page subtitle
A2: 145 134 126
A1: 0 0 0
ALBERTSONS AT A GLANCE
28
2,318 stores in 35 states and the District of Columbia
102 million scripts(1) per year (1,777 in-store pharmacies)
Ranked #1 or #2 in 66% of 122 MSAs
$60bn in sales
$11.5bn in Own Brands sales
Manufactures $1.2bn in our facilities, of which ~$870m is our Own Brands
34 million customers per week
Business Overview
Operate Great Stores Key Differentiators
Premium Fresh
Best-in-Class Manufacturing Capabilities
Innovation, Customization, Personalization
NOSHE and Own Brands Local Assortment
Prepared Foods
Note: Financial figures and statistics reflect Fiscal Year 2017 ended February 24, 2018. (1) Based on 30-day equivalent.
Diverse Set of Brands
Speaker: Jim Donald

Highlight in tables
H2: 221 235 247
H2-3: 102 153 204
For client
A1: 233 28 34
For CS
A3: 145 134 126
L: 114 185 19
Excel color scheme
H: 242 62 42
A3: 145 134 126
A4: 214 35 42
A5: 112 48 160
A6: 0 138 162
A2: 0 159 224
A1: 0 83 159
Page title
Heading
Font color – 0 0 0
A1: 0 0 0
Page subtitle
A2: 145 134 126
A1: 0 0 0
OUR CORE STRATEGY AND DIVERSE SET OF CAPABILITIES
29
Well Positioned for Growth in 2018
Operate Stores at GOLD+ Standards: Full, Fresh, Friendly, Fast & Clean
Deliver Superior Customer Service
Provide a Compelling Product Offering
Expand Natural and Organic Offering
Further Strengthen Own Brand Portfolio
Differentiated Store Formats / Re-Merchandise & Refresh Stores
Significant Supply Chain & Self Manufacturing Capabilities
Accelerate E-Commerce Roll-Out and Capabilities
Explore and Expand into New Channels
Grow Loyalty Program Engagement
Deep Integration & System Conversion Expertise
Speaker: Shane Sampson

Highlight in tables
H2: 221 235 247
H2-3: 102 153 204
For client
A1: 233 28 34
For CS
A3: 145 134 126
L: 114 185 19
Excel color scheme
H: 242 62 42
A3: 145 134 126
A4: 214 35 42
A5: 112 48 160
A6: 0 138 162
A2: 0 159 224
A1: 0 83 159
Page title
Heading
Font color – 0 0 0
A1: 0 0 0
Page subtitle
A2: 145 134 126
A1: 0 0 0
OPERATE OUR STORES TO THE HIGHEST STANDARDS
30
Run Really Great Stores: 4 F’s and 1 C
Well merchandised stores with no out of stocks
Great events and promotions
Locally relevant products throughout the store
Emphasis on Natural, Organic, Specialty, Health and Ethnic (NOSHE)
Full Fresh
Superior quality in fresh departments
First to market with seasonal products
Expanded variety to meet consumers needs in each market
Buy local
Source for quality and sizing
USDA Choice beef or better
Friendly
Engaged employees in each department
Make eye contact and greet every customer
Take customers to find the items they need
Offer suggestions and tips for preparation
Fast
Quick, friendly service throughout the store
Effortless checkout experience
Proactive approach to lines
Well trained, knowledgeable employees
Clean
Food safety
Hospital clean food prep areas
Restrooms and floors shiny and clean
Parking lot to back door
Speaker: Jim Donald

Highlight in tables
H2: 221 235 247
H2-3: 102 153 204
For client
A1: 233 28 34
For CS
A3: 145 134 126
L: 114 185 19
Excel color scheme
H: 242 62 42
A3: 145 134 126
A4: 214 35 42
A5: 112 48 160
A6: 0 138 162
A2: 0 159 224
A1: 0 83 159
Page title
Heading
Font color – 0 0 0
A1: 0 0 0
Page subtitle
A2: 145 134 126
A1: 0 0 0
PROVIDE A COMPELLING PRODUCT OFFERING
31
Heavy focus on organic offerings driven by produce department
Vast assortment of O Organics and Open Nature offerings from our Own Brands portfolio
Butcher blocks stocked with best-in-class variety for meat and seafood
We only offer USDA choice beef or higher grade in all stores
Organic Produce
Butcher Block Meat & Seafood
Organic & Natural Own Brands
We continue to take share in fresh categories,
with fresh sales outpacing center store by over 119bps in fiscal year ended February 24, 2018
Source: Nielsen Scan, Nielsen Perishable Group.
Speaker: Shane Sampson

Highlight in tables
H2: 221 235 247
H2-3: 102 153 204
For client
A1: 233 28 34
For CS
A3: 145 134 126
L: 114 185 19
Excel color scheme
H: 242 62 42
A3: 145 134 126
A4: 214 35 42
A5: 112 48 160
A6: 0 138 162
A2: 0 159 224
A1: 0 83 159
Page title
Heading
Font color – 0 0 0
A1: 0 0 0
Page subtitle
A2: 145 134 126
A1: 0 0 0
PROVIDE A COMPELLING PRODUCT OFFERING
32
Broad assortment with exclusive offerings both locally and world wide
Offer over a thousand high quality cheeses that can be cut and hand wrapped
Fruits and vegetables cut fresh daily in store
We offer unmatched quality fresh, hand breaded fried chicken
Cakes designed to order by our five star trained decorators
Artisan Cheese Shop
Fresh Cut Fruit & Vegetables
Best-in-Class Wine Assortment
We take pride in our unique specialty items and departments
Source: Nielsen Scan, Nielsen Perishable Group.
Always Fresh Fried Chicken
Hand Crafted & Designed Cakes
Speaker: Shane Sampson

Highlight in tables
H2: 221 235 247
H2-3: 102 153 204
For client
A1: 233 28 34
For CS
A3: 145 134 126
L: 114 185 19
Excel color scheme
H: 242 62 42
A3: 145 134 126
A4: 214 35 42
A5: 112 48 160
A6: 0 138 162
A2: 0 159 224
A1: 0 83 159
Page title
Heading
Font color – 0 0 0
A1: 0 0 0
Page subtitle
A2: 145 134 126
A1: 0 0 0
Premium store resets adding 2,500+ specialty items per store
Launched premium specialty brand in Signature Reserve to significantly exceed national brand quality
El Rancho partnership utilizing the BakeMex facility launching Mexican products in Albertsons stores
Probiotic destination sets added to all premium remodels
GROW NATURAL / ORGANIC & FRESH CATEGORIES
33
21.8%
7.8% 12.3%
93 bps
Growth Rate Sales Penetration In Total Store
Own Brand penetration in Natural / Organics
Sales Penetration Increase YOY
400+ Items
1000+ Items
O Organics is the largest USDA certified Organic brand in the nation
Became a $1bn brand in November 2017
On course for 1,400 items in 192 categories by YE 2018
Projected to be the next $1bn brand by 2022
Launching 100+ clean ingredient products in non-food categories under Open Nature
On course for 700 items in 108 categories by YE 2018
Natural & Organic Own Brands Driving Natural & Organic Results
Specialty, Health & Ethnic
Source: UPC’d ONLY * SPINScan 52 weeks ending 2/25/18.
Our Natural & Organic category has grown at 19% for the past three years and we continue to innovate and enhance our offerings
Speaker: Shane Sampson

Highlight in tables
H2: 221 235 247
H2-3: 102 153 204
For client
A1: 233 28 34
For CS
A3: 145 134 126
L: 114 185 19
Excel color scheme
H: 242 62 42
A3: 145 134 126
A4: 214 35 42
A5: 112 48 160
A6: 0 138 162
A2: 0 159 224
A1: 0 83 159
Page title
Heading
Font color – 0 0 0
A1: 0 0 0
Page subtitle
A2: 145 134 126
A1: 0 0 0
DISTINGUISHED OWN BRANDS PORTFOLIO & ASSORTMENT
34
Note: Financial figures reflect LTM Q4’17 and statistics are as of end of Q4’17. (1) Measured by units sold / week / store.
Four $1.0bn brands at Albertsons
$11.5bn business Over 6x the size of the next largest CPG
Distinguished Own Brands Portfolio Own Brands Excellence
Portfolio includes 11k+ SKUs
Items in over 500 categories (67%)
145 categories with 30%+ penetration
75 categories with 50%+ penetration
FY’16 FY’17
Penetration 22.4% 23.0%
Velocity Multiple of National Brands (1) 1.9x 2.0x
Accelerate speed to market, launching new items in 20 vs 40+ weeks
Speaker: Shane Sampson

Highlight in tables
H2: 221 235 247
H2-3: 102 153 204
For client
A1: 233 28 34
For CS
A3: 145 134 126
L: 114 185 19
Excel color scheme
H: 242 62 42
A3: 145 134 126
A4: 214 35 42
A5: 112 48 160
A6: 0 138 162
A2: 0 159 224
A1: 0 83 159
Page title
Heading
Font color – 0 0 0
A1: 0 0 0
Page subtitle
A2: 145 134 126
A1: 0 0 0
ALBERTSONS HAS 7 OF TOP 10 PRIVATE LABEL BRANDS
35
95
92
89
87
84
84
85
84
84
82
80
81
81
79
79
81
76
81
80
73
94
90
89
78
83
84
81
81
81
80
80
76
79
82
76
76
81
76
72
81
70
65
62
55
50
48
49
47
46
47
47
50
46
44
48
45
44
44
47
45
Willingness to Recommend Satisfaction Willingness to Repurchase
Speaker: Shane Sampson
Source: Ipsos Brand Equity Tracker, CSI Custom Study, July 2017 Note: Includes only consumer participants residing within Albertsons’ trading area. Top 2 Box scores shown among Rep. Q6. Please indicate which statement below best describes how likely you would be to buy each of the following brands in the next 3 months. (Asked on a 5 point scale). Q7. How satisfied are you with each of the following brands? (Asked on a 5 point scale). Q8. How likely is it that you would recommend each of the following brands to a friend, relative or colleague? (Asked on a 10 point scale); Among ever purchased brand.
Highlight in tables
H2: 221 235 247
H2-3: 102 153 204
For client
A1: 233 28 34
For CS
A3: 145 134 126
L: 114 185 19
Excel color scheme
H: 242 62 42
A3: 145 134 126
A4: 214 35 42
A5: 112 48 160
A6: 0 138 162
A2: 0 159 224
A1: 0 83 159
Page title
Heading
Font color – 0 0 0
A1: 0 0 0
Page subtitle
A2: 145 134 126
A1: 0 0 0
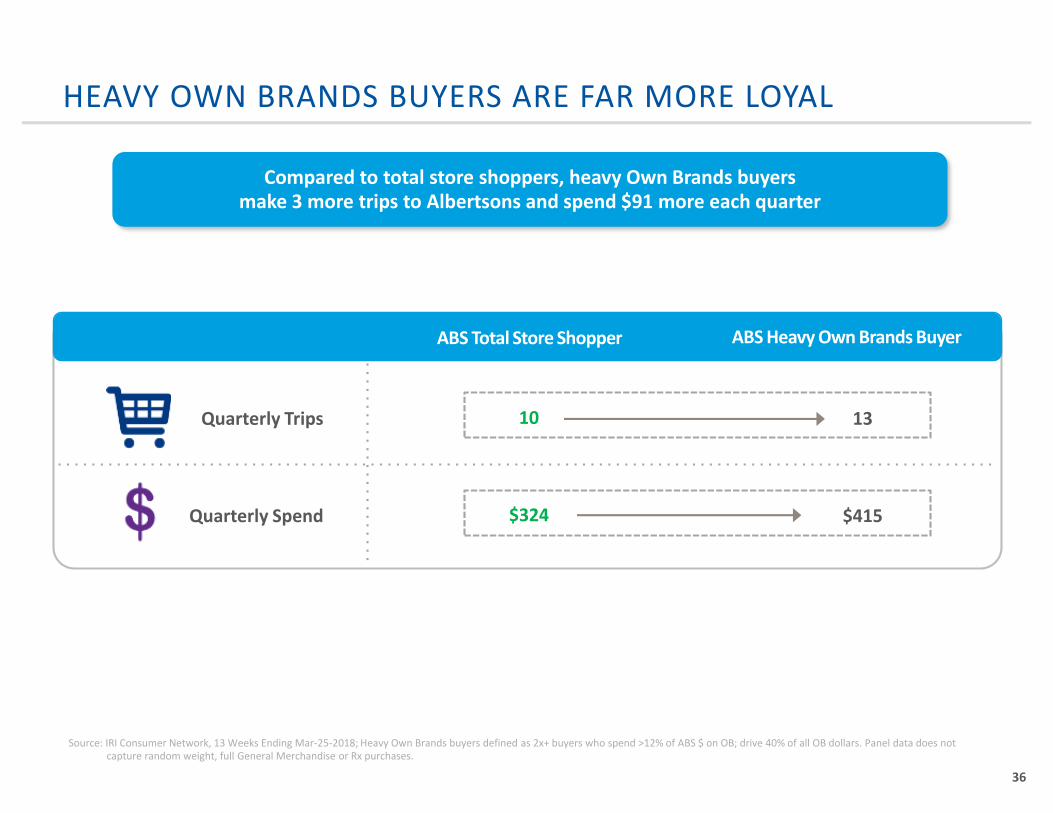
HEAVY OWN BRANDS BUYERS ARE FAR MORE LOYAL
36
Compared to total store shoppers, heavy Own Brands buyers make 3 more trips to Albertsons and spend $91 more each quarter
Quarterly Trips
Quarterly Spend
10
$324 $415
13
ABS Heavy Own Brands Buyer ABS Total Store Shopper
Source: IRI Consumer Network, 13 Weeks Ending Mar-25-2018; Heavy Own Brands buyers defined as 2x+ buyers who spend >12% of ABS $ on OB; drive 40% of all OB dollars. Panel data does not capture random weight, full General Merchandise or Rx purchases.
Speaker: Shane Sampson

Highlight in tables
H2: 221 235 247
H2-3: 102 153 204
For client
A1: 233 28 34
For CS
A3: 145 134 126
L: 114 185 19
Excel color scheme
H: 242 62 42
A3: 145 134 126
A4: 214 35 42
A5: 112 48 160
A6: 0 138 162
A2: 0 159 224
A1: 0 83 159
Page title
Heading
Font color – 0 0 0
A1: 0 0 0
Page subtitle
A2: 145 134 126
A1: 0 0 0
Well-located settings in affluent communities
Best quality, beautifully displayed fresh products, including abundant NOSHE selection
Differentiated selection, restaurant quality prepared foods
Personal Concierge Services
100 to 150 stores
Ultra-premium banners
Inspires me to discover something new
Consistent wide selection of food/non-food essentials plus assortment of local, NOSHE sustainable options
Better quality fresh groceries & prepared foods
Competitive prices, specials and loyalty programs
Mainstream:
Premium:
Trusted source for everything to nurture my family
Clean, family friendly stores
Noticeably lower prices, complemented with special buys and traffic driving sales
Assortment has all essentials, and items reflecting local ethnicity
150 to 200 stores
Value banners
Knowing I am getting the most for my money
DIVERSE STORE FORMAT APPEALS TO MULTIPLE DEMOGRAPHICS
37
600 to 650 stores
1,300 to 1,500 stores
Our shoppers are getting increasingly diverse and our in-store experience has to meet their needs
Speaker: Susan Morris

Highlight in tables
H2: 221 235 247
H2-3: 102 153 204
For client
A1: 233 28 34
For CS
A3: 145 134 126
L: 114 185 19
Excel color scheme
H: 242 62 42
A3: 145 134 126
A4: 214 35 42
A5: 112 48 160
A6: 0 138 162
A2: 0 159 224
A1: 0 83 159
Page title
Heading
Font color – 0 0 0
A1: 0 0 0
Page subtitle
A2: 145 134 126
A1: 0 0 0
~$2,000
~$435 ~$515
~$650 ~$400
~$4,000
New stores, remodels, upgrades,merchandising and maintenance
innitiatives
Distribution Centers &Manufacturing Facilities
Technology Integration Capex Other Total Capex investment in thepast 3 years
WELL INVESTED STORE PORTFOLIO
38
Significant Investments Have Been Made
Completed ~590 remodels, along with over 4,000 individual merchandising initiatives, touching a combined 1,800 stores
Merchandising initiatives include lighting upgrade, fresh cut program, butcher block and deli / prepared food upgrade
Abilene, TX Capex : $4.7M
Sales ID : (1.7%) to 132.1% Payback: 1.0 year
Market St. Remodel Premium Remodel Traditional Remodel
Pasadena, CA Capex : $3.5M
Sales ID : (4.7%) to 35.8% Payback : 1.7 years
Peabody, MA Capex : $1.6M
Sales ID : 6.6% to 17.4% Payback: 3.0 years
($ millions)
(1)
(1) Includes Rx scripts acquisition, energy efficiencies, lease termination and other.
Speaker: Susan Morris

Highlight in tables
H2: 221 235 247
H2-3: 102 153 204
For client
A1: 233 28 34
For CS
A3: 145 134 126
L: 114 185 19
Excel color scheme
H: 242 62 42
A3: 145 134 126
A4: 214 35 42
A5: 112 48 160
A6: 0 138 162
A2: 0 159 224
A1: 0 83 159
Page title
Heading
Font color – 0 0 0
A1: 0 0 0
Page subtitle
A2: 145 134 126
A1: 0 0 0 23 strategically located distribution
centers and 5 fulfillment centers
− 83% owned (by square footage)
− ~18m square feet
Distribution center consolidation completed
1.3bn cases shipped annually
1,425 tractors; 5,700 trailers
Plated meal kit fulfillment facilities located in Dallas, Carol Stream, Miami Lakes, Union City and Bronx, NY
Ponca City and Meridian are stand-alone GM / HBC facilities
Brea, Tracy and Lancaster (all full-line DCs) are automated and have the full GM/HBC assortment
− Several other full-line DCs carry a limited line of GM/HBC fast moving items
All GM/HBC facilities select in each, inner-pack or full case
Tolleson DC is currently running with new automatization technology
OUR UNIQUE & STRATEGICALLY LOCATED SUPPLY CHAIN CAPABILITIES
39
Albertsons distribution centers are strategically located
The completion of the Safeway acquisition led to a comprehensive review of the supply chain, leading to distribution center consolidation and supply chain optimization that is now complete
Five distribution centers were closed and consolidated, significantly reducing fixed operating costs and overhead
− Outperformed the budgeted Safeway supply chain synergies
Constant improvement of DC efficiencies provides Albertsons opportunities to enhance profit margins and reduce fixed operating costs
The company is committed to automate Distribution Centers over the next few years
Distribution / Fulfillment Highlights
Our distribution center network is well positioned for the next five years of growth
Distribution Center
Plated Fulfilment Center
Bellevue, WA
Kent, WA Auburn, WA Spokane, WA
Portland, OR
Meridian, ID
North Salt Lake, UT Tracy, CA
Merced, CA (2) Union City, CA
Las Vegas, CA
Brea, CA
Irvine, CA Norwalk, CA
Tolleson, AZ
Denver, CO
Ponce City, OK
Lubbock, TX (2) Roanoke, TX (2)
Melrose Park, IL
Upper Marlboro, MD
Denver, PA
Wells, ME
Methuen, MA
Anchorage, AK Honolulu, HI Miami Lakes, FL
Bronx, NY Carol Stream, IL
Dallas, TX
Warehouses
Speaker: Susan Morris

Highlight in tables
H2: 221 235 247
H2-3: 102 153 204
For client
A1: 233 28 34
For CS
A3: 145 134 126
L: 114 185 19
Excel color scheme
H: 242 62 42
A3: 145 134 126
A4: 214 35 42
A5: 112 48 160
A6: 0 138 162
A2: 0 159 224
A1: 0 83 159
Page title
Heading
Font color – 0 0 0
A1: 0 0 0
Page subtitle
A2: 145 134 126
A1: 0 0 0
VERTICALLY INTEGRATED TO MANUFACTURE MANY OF OUR OWN BRAND PRODUCTS
40
We operate 20 manufacturing facilities, and constantly monitor “make vs. buy" decisions
Significant opportunity to leverage fixed costs and drive proprietary innovation
Enables significant growth in our Own Brands portfolio
Provides negotiating leverage with CPG companies
Manufacturing Plant
Richmond, CA
Lubbock, TX
Hartfield Township, PA
Denver, CO
Tempe, AZ
Phoenix, AZ Riverside, CA
Norwalk, CA Commerce, CA
San Leandro, CA
Merced, CA
Clackamas, OR
Bellevue, WA
Los Angeles, CA
San Leandro, CA
Tempe, AZ
Denver, CO
Clackamas, OR
Bellevue, WA
Hatfield, PA (New in 2017)
Fluid Milk Facilities
Bellevue, WA
Phoenix, AZ
Lubbock, TX (ice)
Ice Cream Facilities
Clackamas, OR
Richmond, CA
Los Angeles, CA
Bakery Facilities
Denver, CO
Bellevue, WA
Norwalk, CA
Richmond, CA
Beverage Facilities
Merced, CA
Lubbock, CA
Riverside, CA (New in 2018)
Grocery Facilities
Speaker: Susan Morris

Highlight in tables
H2: 221 235 247
H2-3: 102 153 204
For client
A1: 233 28 34
For CS
A3: 145 134 126
L: 114 185 19
Excel color scheme
H: 242 62 42
A3: 145 134 126
A4: 214 35 42
A5: 112 48 160
A6: 0 138 162
A2: 0 159 224
A1: 0 83 159
Page title
Heading
Font color – 0 0 0
A1: 0 0 0
Page subtitle
A2: 145 134 126
A1: 0 0 0
INNOVATIVE NEW ITEMS BEING INTRODUCED FROM OUR SELF MANUFACTURING CAPABILITIES
41
Speaker: Susan Morris
Video: Sleek Can Video

Highlight in tables
H2: 221 235 247
H2-3: 102 153 204
For client
A1: 233 28 34
For CS
A3: 145 134 126
L: 114 185 19
Excel color scheme
H: 242 62 42
A3: 145 134 126
A4: 214 35 42
A5: 112 48 160
A6: 0 138 162
A2: 0 159 224
A1: 0 83 159
Page title
Heading
Font color – 0 0 0
A1: 0 0 0
Page subtitle
A2: 145 134 126
A1: 0 0 0
$1BN ECOMMERCE TARGET FOR FY’18
42
2007 2015 2016 2017 2018E 2020E
$1bn
$244m $222m $154m $345m(1)
Building Breadth of Services
Rolled out Home Delivery & Rush Delivery Nationwide
Built our own fleet to 1,000 trucks and 1,200+ drivers
Expand Drive Up & Go to 500 stores in FY’18
Focus on growth in Business-to-Business delivery
Key
Cap
abili
tie
s
Growing Partnerships
Instacart expansion
Specialty Offerings: Rx, FTD, wine, pet, baby, and more
Grubhub (pilot underway)
Infinite aisle marketplace providing unique assortment not available in stores
Growing Acquired Revenues
Plated meal kit subscription service
Offer Plated in 650+ stores in FY’18 available through Home Delivery
Building Depth of Customer Choices Enhance Future Capabilities
Building Virtual Store Fronts to provide targeted offerings in Fresh & Organic foods
Enhanced platform provides frictionless integrated shopper experience
Aggressively grow Home Delivery with marketing investment
Investing in operations, automation and data driven management
Broaden and deepen our partnerships with 3rd party services
(1) Includes partial year sales from Plated and Instacart partnership.
Speaker: Shane Sampson

Highlight in tables
H2: 221 235 247
H2-3: 102 153 204
For client
A1: 233 28 34
For CS
A3: 145 134 126
L: 114 185 19
Excel color scheme
H: 242 62 42
A3: 145 134 126
A4: 214 35 42
A5: 112 48 160
A6: 0 138 162
A2: 0 159 224
A1: 0 83 159
Page title
Heading
Font color – 0 0 0
A1: 0 0 0
Page subtitle
A2: 145 134 126
A1: 0 0 0
MULTI-FUNCTIONAL ECOMMERCE SOLUTIONS
43
Home delivery
New eCommerce website & App rolled out to all divisions
14% increase in web conversion and 65% increase in mobile conversion
Pushing operational improvements through new detailed operations playbook
Goals & metrics to track progress, algorithm-driven guidelines for labor scheduling
Piloting pricing model to improve pricing perception for online sensitive items
Big push on marketing: in-store tactics, better leveraging digital marketing, CPG funded vendor offers and direct calls and reach-out for our B2B customers
Drive Up & go
Rush delivery
Goal of 500 locations in FY’18, currently operating 100 stores
Technology change giving visibility of all Drive Up & Go locations within 50-mile radius
2 hour window between order and pick-up
Additional density in market and advertising to significantly drive revenue
Delivered within 1-2 hours from ordering
Successfully rolled out to over 1,700 stores
Positive customer response and steadily climbing revenues
Launching virtual stores on Instacart Marketplace to compete directly with all natural & organic retailers
Expanding coverage to our full footprint, including smaller markets and markets where Instacart does not have a presence by end of Q3
Speaker: Shane Sampson

Highlight in tables
H2: 221 235 247
H2-3: 102 153 204
For client
A1: 233 28 34
For CS
A3: 145 134 126
L: 114 185 19
Excel color scheme
H: 242 62 42
A3: 145 134 126
A4: 214 35 42
A5: 112 48 160
A6: 0 138 162
A2: 0 159 224
A1: 0 83 159
Page title
Heading
Font color – 0 0 0
A1: 0 0 0
Page subtitle
A2: 145 134 126
A1: 0 0 0
CONTINUOUSLY EVOLVING ECOMMERCE CAPABILITIES
44
Plated
First omni-channel meal kit offering with national scale
Time-saving solution, additional convenience
Address new channels with focus on families (larger portions, higher profits)
Roll out in-store product to 650+ premium stores in all divisions
Business to Business
Build our brands and offerings
Ready-to-Eat Food
Infinite Aisle
Plan to aggressively grow B2B customers
Tend to be high repeat customers, and order in bulk
B2B business accounts for 14% of eCommerce sales
Pharmacy, Health and Wellness, wine, floral, baby and pet are all a part of meeting the customers’ needs
Reach new consumers we are not servicing and reach markets we are not in today
Time starved consumers enjoy convenience of on-line shopping
Launched pilot with Grubhub in our stores
Gauge performance in “ready-to-eat foods”, when listed alongside restaurants
Based on learnings, explore enlisting similar delivery services such as Uber Eats and others
Marketplace: “Infinite Aisle” of products, to invite additional vendors to enlist on the marketplace
Huge value add to customers: Access to large number of innovative items from small brands not available in stores
Gives us proprietary market data on emerging food
Expect to launch over 100k SKUs and continue to build on this base
Speaker: Shane Sampson

Highlight in tables
H2: 221 235 247
H2-3: 102 153 204
For client
A1: 233 28 34
For CS
A3: 145 134 126
L: 114 185 19
Excel color scheme
H: 242 62 42
A3: 145 134 126
A4: 214 35 42
A5: 112 48 160
A6: 0 138 162
A2: 0 159 224
A1: 0 83 159
Page title
Heading
Font color – 0 0 0
A1: 0 0 0
Page subtitle
A2: 145 134 126
A1: 0 0 0
AGGRESSIVELY GROWING DIGITAL, LOYALTY & REWARDS
45
Personalized Deals
Saves customers money with personalized deals, coupons, free items and rewards
Using data to generate 400m personalized deals per week
Increases basket size and drives trips for our 13m registered households
Changing customer shopping patterns by encouraging customer to buy in categories they are not currently
Gas Rewards
Expanded Rewards
Albertsons Performance
Media
Rewarding our most loyal customer
Redeemers’ baskets are 2.5x larger than non-redeemers
Customers can receive up to a dollar off per gallon
Redeemable at 5,000 partner stations or our 390+ fuel stations
Creates a return trip to the store
Provides flexibility on how customer spend their points
Appeals to customers not participating in fuel rewards
Early data: Sales to cost ratio is more favorable than fuel only
Drives sales and brand awareness with effective personalized offers and content
Enable us to sell media services to CPGs to increase marketing
Track and measure reach with closed loop purchase conversion
Target our customers and amplify merchandising programs
CPGs have increased digital investment to drive targeted sales with us
Speaker: Shane Sampson
Video: Just 4 U

Highlight in tables
H2: 221 235 247
H2-3: 102 153 204
For client
A1: 233 28 34
For CS
A3: 145 134 126
L: 114 185 19
Excel color scheme
H: 242 62 42
A3: 145 134 126
A4: 214 35 42
A5: 112 48 160
A6: 0 138 162
A2: 0 159 224
A1: 0 83 159
Page title
Heading
Font color – 0 0 0
A1: 0 0 0
Page subtitle
A2: 145 134 126
A1: 0 0 0
ALBERTSONS & SAFEWAY INTEGRATION EXPERTISE
46
Safeway Integration Expected to be Completed by Sept 2018
Significant in-house integration expertise and capabilities and a dedicated integration team with a
proven track record of delivering synergy targets
COMPLETED NO CONVERSION TO BE CONVERTED
615 of 968 Stores
Converted FACTS TO DATE:
~19 million shelf tags and signs hung in stores
~70,000 store employees trained
~566,000 live training hours delivered
783 trainers actively deployed
Clear Path to Full Synergy Realization
Clear path and robust plan to full synergy realization of $823m (3 years from closing)
Seattle (44)
Intermountain (73)
Denver (25)
Southwest (82)
So Cal (132)
Southern (49)
Houston (19)
Jewel-Osco (187)
Acme (172)
Shaw’s (153)
(1) Estimated four year time frame to achieve $800m in synergies provided in Albertsons Companies, Inc. S-1 registration statement filed with the SEC on July 7, 2015, as amended. Completion of Safeway transaction occurred on January 30, 2015. We currently expect to achieve approximately $823m of annual synergies related to the Safeway acquisition on a run-rate basis by the end of fiscal 2018, with remaining associated one-time costs of approximately $200m, including approximately $65m of Safeway integration-related capital expenditures.
(2) FY’18 ends February 2019.
$800 $823
Planned at Announcement FY'18 Run-Rate(1) (2)
Speaker: Susan Morris
Portland (32)