Embed Size (px)
Citation preview

Analyst Day December 10, 2015

2 2
This presentation contains statements relating to future results of the company (including certain projections and business trends) that are “forward-looking statements” as defined in the Private Securities Litigation Reform Act of 1995. Forward-looking statements are typically identified by words or phrases such as “believe,” “expect,” “anticipate,” “estimate,” “should,” “are likely to be,” “will” and similar expressions. Actual results may differ materially from those projected as a result of certain risks and uncertainties, including but not limited to reliance on major original equipment manufacturer (“OEM”) customers and possible negative outcomes from contract negotiations with our major customers, including failure to negotiate acceptable terms in contract renewal negotiations and our ability to obtain new customers; the outcome of actual and potential product liability, warranty and recall claims; our ability to successfully manage rapidly changing volumes in the commercial truck markets and work with our customers to manage demand expectations in view of rapid changes in production levels; global economic and market cycles and conditions; availability and sharply rising costs of raw materials, including steel, and our ability to manage or recover such costs; our ability to manage possible adverse effects on our European operations, or financing arrangements related thereto, in the event one or more countries exit the European monetary union; risks inherent in operating abroad (including foreign currency exchange rates, implications of foreign regulations relating to pensions and potential disruption of production and supply due to terrorist attacks or acts of aggression); rising costs of pension and other postemployment benefits; the ability to achieve the expected benefits of restructuring actions; the demand for commercial and specialty vehicles for which we supply products; whether our liquidity will be affected by declining vehicle productions in the future; OEM program delays; demand for and market acceptance of new and existing products; successful development of new products; labor relations of our company, our suppliers and customers, including potential disruptions in supply of parts to our facilities or demand for our products due to work stoppages; the financial condition of our suppliers and customers, including potential bankruptcies; possible adverse effects of any future suspension of normal trade credit terms by our suppliers; potential difficulties competing with companies that have avoided their existing contracts in bankruptcy and reorganization proceedings; potential impairment of long-lived assets, including goodwill; potential adjustment of the value of deferred tax assets; competitive product and pricing pressures; the amount of our debt; our ability to continue to comply with covenants in our financing agreements; our ability to access capital markets; credit ratings of our debt; the outcome of existing and any future legal proceedings, including any litigation with respect to environmental or asbestos-related matters; possible changes in accounting rules; and other substantial costs, risks and uncertainties, including but not limited to those detailed herein and from time to time in other filings of the company with the SEC. These forward-looking statements are made only as of the date hereof, and the company undertakes no obligation to update or revise the forward-looking statements, whether as a result of new information, future events or otherwise, except as otherwise required by law.
All earnings per share amounts are on a diluted basis. The company's fiscal year ends on the Sunday nearest Sept. 30, and its fiscal quarters end on the Sundays nearest Dec. 31, March 31 and June 30. All year and quarter references relate to the company's fiscal year and fiscal quarters, unless otherwise stated.
Forward-Looking Statements

3 3
Agenda
Business Overview
Financial Review
Jay Craig CEO and President
Chris Villavarayan President, Americas
Joe Plomin President, International
Rob Speed President, Aftermarket & Trailer and Chief Procurement Officer
Kevin Nowlan Senior Vice President and Chief Financial Officer
M2019 Strategy

Jay Craig CEO & President
5 5
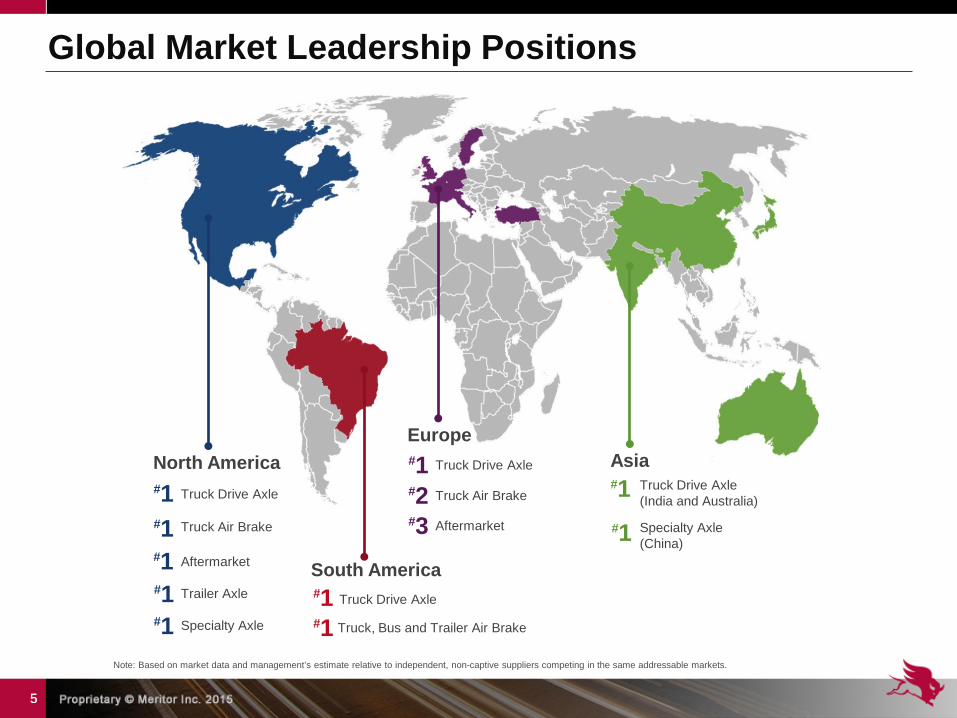
Global Market Leadership Positions
Note: Based on market data and management’s estimate relative to independent, non-captive suppliers competing in the same addressable markets.
#1 North America Europe
Truck Drive Axle
#2 Truck Air Brake
#3 Aftermarket Specialty Axle (China)
Truck Drive Axle (India and Australia)
Asia
#1 South America
Truck Drive Axle
#1
Truck Drive Axle
Truck Air Brake
Aftermarket
Trailer Axle
#1 Specialty Axle Truck, Bus and Trailer Air Brake
#1 #1 #1
#1 #1 #1

6 6
Business Segments
Commercial Truck and Industrial FY15 Sales $2.7B
• Drivetrain systems and components, including axles, drivelines, braking and suspension systems for truck, defense and specialty markets
• Medium- and heavy-duty truck markets in North America, South America, Europe and Asia Pacific
Aftermarket and Trailer FY15 Sales $0.8B
• Axles, brakes, drivelines, suspensions and other replacement and remanufactured parts
• Wide variety of undercarriage products and systems for trailer applications
North America 59%
South America
7%
Europe 22%
Asia Pacific
12%
North America 86%
Europe 14%
7 7
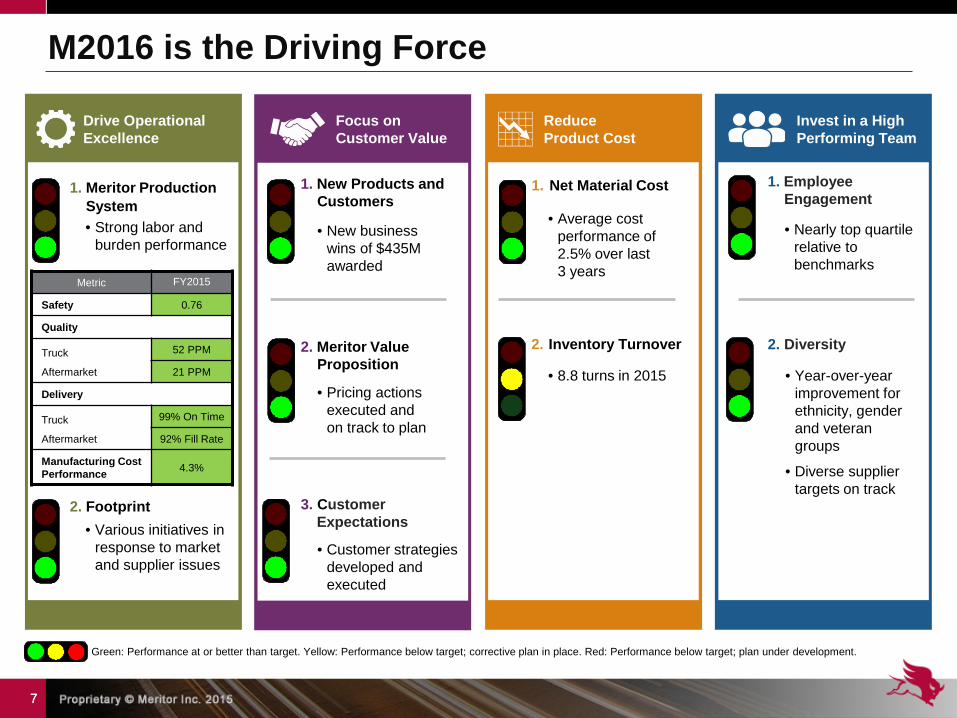
Drive Operational Excellence
Reduce Product Cost
Invest in a High Performing Team
Focus on Customer Value
1. Meritor Production System
2. Footprint
1. New Products and Customers
1. Net Material Cost 1. Employee Engagement
2. Diversity 2. Inventory Turnover 2. Meritor Value Proposition
3. Customer Expectations
• Average cost performance of 2.5% over last 3 years
• Nearly top quartile relative to benchmarks
• Year-over-year improvement for ethnicity, gender and veteran groups
• Diverse supplier targets on track
• Strong labor and burden performance
• Pricing actions executed and on track to plan
Metric FY2015
Safety 0.76
Quality
Truck
Aftermarket
52 PPM
21 PPM
Delivery
Truck
Aftermarket
99% On Time
92% Fill Rate
Manufacturing Cost Performance 4.3%
• New business wins of $435M awarded
• 8.8 turns in 2015
Green: Performance at or better than target. Yellow: Performance below target; corrective plan in place. Red: Performance below target; plan under development.
• Customer strategies developed and executed
• Various initiatives in response to market and supplier issues
M2016 is the Driving Force

8 8
Strong employee alignment with M2016 strategy
Invest in a High Performing Team
2013 2015
Average: 30th Percentile Average: 74th Percentile
(1) Denison is an outside consulting firm which uses an employee diagnostic survey made up of 12 characteristics to help organizations evaluate and align culture, leadership and business performance.
Measure of Employee Engagement (1)

9 9
Incremental Booked Revenue of $500M (Annual Run Rate)
$385 $435
$500
Achieved 45% of ~$1B revenue pipeline opportunities
Achieve 10% Adjusted EBITDA Margin
7.2%
8.3%
9.5% 10.0%
Reduce Net Debt to <$1.5B
$1,915
$1,419 < $1,500
On track to achieve M2016 strategic goals and deliver on commitments (1) See Appendix – “Non-GAAP Financial Information.” (2) Debt plus retirement benefit liabilities, less cash and cash equivalents, expected to decrease by $400 million (compared to fiscal 2012 ending balance) to less than $1.5 billion by the end of FY16. (3) Expected incremental business secured between the beginning of FY13 and the end of FY16 from new products, new customers, or significant increases in customer penetration. Although the $500 million in new business is expected to be secured
prior to the end of FY16, roughly half of this business is not expected to materialize into revenue until after FY16. This measure of incremental revenue is ‘gross’, before consideration of any business existing at the beginning of FY13 that may subsequently be lost and which could offset the benefit of this expected new business.
FY15 Actual
FY14 Actual
FY13 Actual
FY16 Target
FY15 Actual FY12 Actual (as reported)
FY16 Target FY15 Actual
As of Dec 10, 2015
FY16 Target
M2016 Strategy Performance

10 10
M2016 Key Drivers of Success
Competencies Demonstrated Positioned for Growth
Driving Cost Reductions • Material, labor and burden performance • SG&A cost discipline
Supply Chain Management • Converted on North America upturn • Converted on 2013 European pre-buy
Focused Product Development • Ongoing review of top product programs • Collaborative approach with customers
Winning New Business • Conquest business wins • Strengthened strategic customer relationships
Improved Financial Position • EBITDA margin and EPS expansion • Stronger balance sheet
Manufacturing and Engineering Excellence • World-class safety, quality and delivery performance • Global capabilities
Commercial Truck and Industrial Focused • 100% dedicated to truck and industrial sector • Alignment with customers
Employee Talent • Recognized industry expertise • DriveForce sales expertise
M2016 created growth platform for the future

11 11
(1) Meritor share price performance versus a peer group average and the S&P 500 over the period from 4/30/13 to 11/30/15. (2) Peer group includes American Axle & Manufacturing Holdings, Inc., BorgWarner Inc., Dana Holding Corp., Federal-Mogul Corporation, Hyster-Yale Materials Handling, Inc., ITT Corporation, Kennametal Inc., Modine
Manufacturing Company, Oshkosh Corp., SPX Corporation, Tenneco Inc., The Manitowoc Company, Inc., The Greenbrier Companies, Inc., The Timken Company, Tower International, Trinity Industries Inc., Visteon Corporation, WABCO Holdings, Wabash National Corp., Westinghouse Air Brake Technologies Corporation.
(3) See Appendix – “Non-GAAP Financial Information.”
~$450M of shareholder value created
Meritor Share Price Performance vs. Peer Group Average and S&P 500(1)(2)
Adj. EBITDA: $334M Adj. EBITDA Margin: 9.5% Adj. Diluted EPS: $1.59
Adj. EBITDA: $314M Adj. EBITDA Margin: 8.3% Adj. Diluted EPS: $1.06
Adj. EBITDA: $264M Adj. EBITDA Margin: 7.2% Adj. Diluted EPS: $0.46
FY13
FY14 FY15
Creating Shareholder Value

12 12
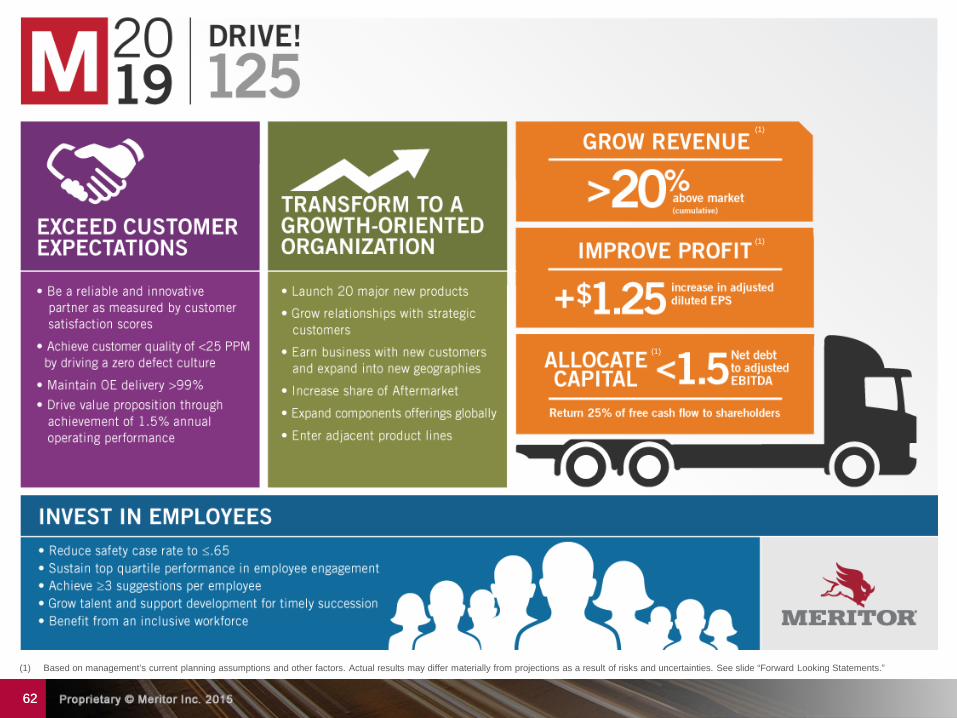
Shareholder-Value Driven Strategy
Allocate Capital
Grow Revenue
Improve Profit

13 13
(1) Based on management’s current planning assumptions and other factors. Actual results may differ materially from projections as a result of risks and uncertainties. See slide “Forward Looking Statements.”
(1)
(1)
(1)

14 14
Revenue Growth Driven by: • New product launches
• Broadening relationships with strategic customers
• Aftermarket share increases
• Expansion of components business
• Adjacent markets
• New customer wins and expansion into new geographies
$3.5B $4.1B
$3.3B (market)
FY15 Actual Revenue FY19 Forecasted Revenue
Revenue Growth
M2019
$900M in revenue opportunities Risk adjusted in M2019 plan by ~$450M
~$400M
M2016 Carryover
Americas International Aftermarket & Trailer
$350M $250M $300M

15 15
5 Rear Axles
3 Front Axles
3 Brakes
3 Trailer Products
4 Off-Highway Products
2 Specialty & Defense Products
New Products
20 Planned Major New Global Products
~7 ~6
3
FY11- FY13 FY14 - FY16 FY17 - FY19
Major Product Launches (Annual Averages)
16 16
FY17
Rev
enue
FY16 FY18 FY19
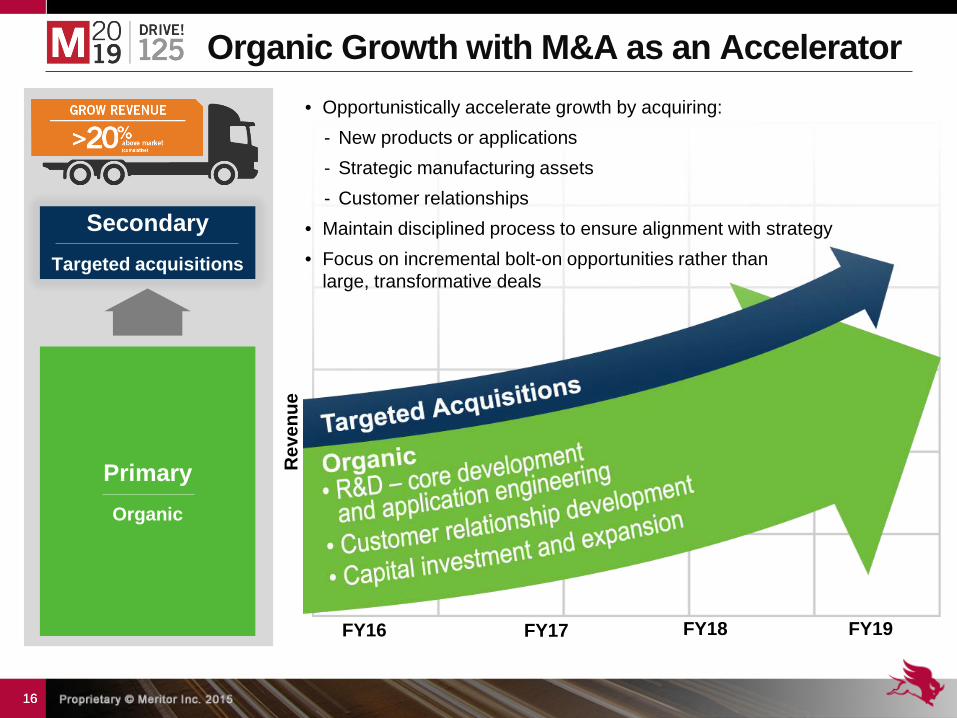
Organic Growth with M&A as an Accelerator
Secondary Targeted acquisitions
Primary Organic
• Opportunistically accelerate growth by acquiring: - New products or applications - Strategic manufacturing assets - Customer relationships
• Maintain disciplined process to ensure alignment with strategy • Focus on incremental bolt-on opportunities rather than
large, transformative deals
17 17
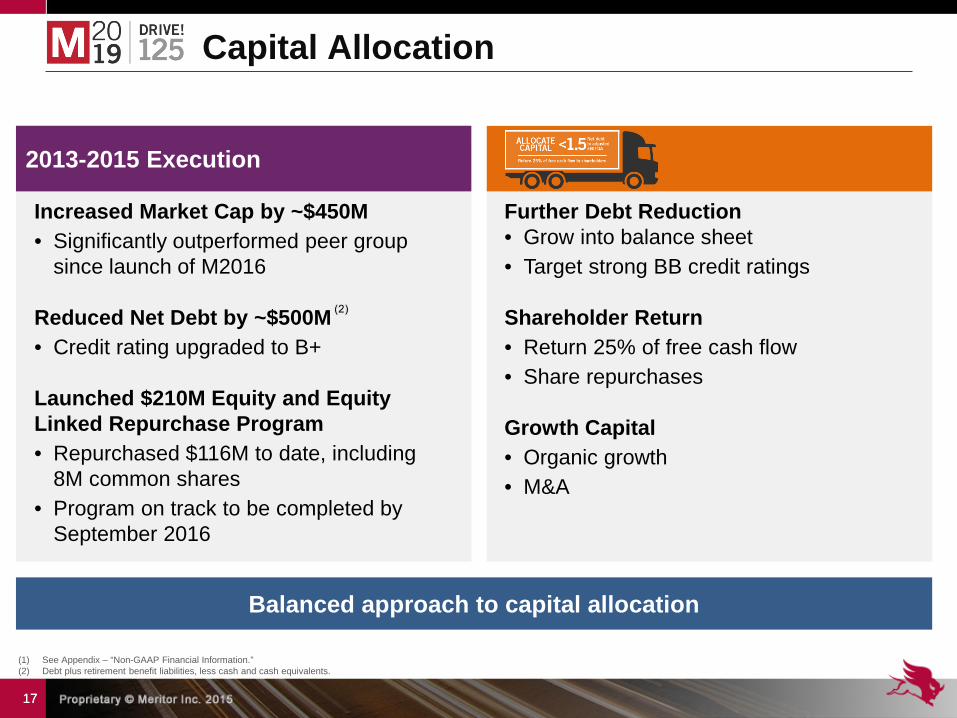
Capital Allocation
Repurchased: ~ $25M
~ 1.9M Common
Shares
Balanced approach to capital allocation
2013-2015 Execution
(1) See Appendix – “Non-GAAP Financial Information.” (2) Debt plus retirement benefit liabilities, less cash and cash equivalents.
Further Debt Reduction • Grow into balance sheet • Target strong BB credit ratings
Shareholder Return • Return 25% of free cash flow • Share repurchases
Growth Capital • Organic growth • M&A
Increased Market Cap by ~$450M • Significantly outperformed peer group
since launch of M2016 Reduced Net Debt by ~$500M • Credit rating upgraded to B+ Launched $210M Equity and Equity Linked Repurchase Program • Repurchased $116M to date, including
8M common shares • Program on track to be completed by
September 2016
18 18
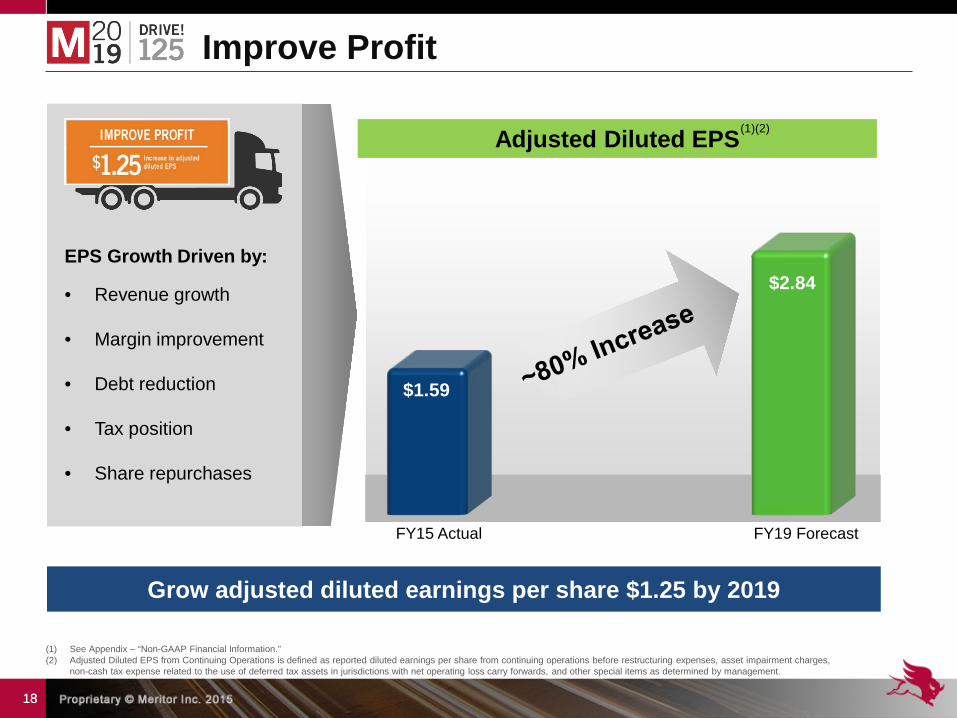
Improve Profit
Grow adjusted diluted earnings per share $1.25 by 2019
Adjusted Diluted EPS
$1.59
$2.84 EPS Growth Driven by:
• Revenue growth
• Margin improvement
• Debt reduction
• Tax position • Share repurchases
FY15 Actual FY19 Forecast
(1)(2)
(1) See Appendix – “Non-GAAP Financial Information.” (2) Adjusted Diluted EPS from Continuing Operations is defined as reported diluted earnings per share from continuing operations before restructuring expenses, asset impairment charges,
non-cash tax expense related to the use of deferred tax assets in jurisdictions with net operating loss carry forwards, and other special items as determined by management.

Americas Business Overview Chris Villavarayan President, Americas

20 20
Select Customers
Employees Manufacturing Facilities
Americas Overview
FY15 Revenue
~$1.6B
FY15 Revenue
~$200M Customer Facing
160
4,400 Total Employees
USA (8)
Brazil (3)
Mexico (2)
(1) FY15 revenue excludes revenue from Aftermarket & Trailer business segment. (2) Employee headcounts are approximate numbers. (3) Customer facing is defined as sales and marketing employees.
(1)
(1) (3)
(2)
Engineering and Quality
340

21 21
North America
Production FY15
Actual FY16
Outlook FY19
Outlook Heavy Duty (Class 8) 328 275-290 250-270
Medium Duty (Class 5-7) 234 210-220 205-225
South America
Production FY15
Actual FY16
Outlook FY19
Outlook
Medium and Heavy Duty 89 70-80 150-170
Americas Market Perspective (units in 000s)
(1) Source: FY15 Actuals based on ACT, LMC Automotive and Anfavea. (2) FY16 and FY19 outlook is based on Meritor estimates. ACT CY19 North America Class 8 truck forecast (published Nov. 2015) is 293 units. FTR CY19 North America Class 8 truck forecast (published Dec. 2015)
is 259 units. ACT CY19 North America Class 5-7 truck forecast (published Nov. 2015) is 258 units. FTR CY19 North America Class 4-7 truck forecast (published Dec. 2015) is 208 units. LMC CY19 South America (Brazil only) total truck forecast (published Sept. 2015) is 189 units. Actual results may differ materially from projections as a result of risk and uncertainties. See “Forward Looking Statements.”
2016 Forecast • Net order intake continues to soften • Fleet profitability remains strong
2019 Forecast • Class 8 market expected to be stable
2016 Forecast • Weak economic conditions persist • Market sentiment remains pessimistic
2019 Forecast • Market conditions expected to improve • Outlook remains below average production levels
from FY10 through FY13
(1) (2)

22 22
• Capacity and flexibility
• Footprint optimization
• Supply chain toolbox
• Meritor Production System
Productivity
More than $40M invested in 2015
• Insourcing machining
- Carrier mounting - Differential cases - Brake spiders
• Advanced manufacturing - Differential gear - Precision forging
Components • New axle, disc brake and
driveline products
• Laser welding technology
Product & Technology
Americas Investment Focus in 2015

23 23
Americas Market Opportunities
Core Products Components Off-Highway
Meritor Targeted
Opportunity
$800M Market $4.2B Market
Addressable Market
$2.5B Market
Meritor’s Share: ~30%
Meritor’s Share: <1%
Meritor’s Share: <1%
$300M (Risk adjusted target
of $150M)
(1)
(1) Based on management estimates and 3rd party market analysis for non-captive North America and South America markets.

24 24
• EX+ offers improved reliability and uptime versus competition, in addition to improved braking performance
• Steady growth in North America over past five years
• Growing trend of replacing Class 6-7 vehicles with new trucks that offer lower maintenance and higher fuel economy
• 13X axle approximately 59 lbs. lighter than 14X carrier
Air Disc Brake Offering to Meet Demand Axle Optimized for Medium-Duty Market
Americas Core Product Growth
Addressable Market: Current Share:
Addressable Market: Current Share:
(1) Based on management estimates and 3rd party market analysis for non-captive North and South America medium-duty market. (2) Based on management estimates and 3rd party market analysis for non-captive North and South America air disc brake markets.
(1) (1)
(2) (2)

25 25
• Downspeeding trend expected to grow over next five years
• Demand increasing as payback and performance shifts market
• RPL35 family meets high torque requirements, reduces operating costs, outlives warranty
Driveline Capable of Handling Increased Torque
Growing Market for Integrated Axle and Brake Offering
Americas Core Product Growth
Addressable Market: Current Share:
Integrated Front Axle 2016-17
Cost Optimization 2019-20
Integrated Front Axle+ 2019-20 • 15% lighter • Additional wheel end options
• Next evolution at prices more competitive with drum brakes
• Integrated front axle and air disc brake
• 120 lbs. weight savings
Addressable Market: Current Share:
(1) Based on management estimates and 3rd party market analysis for non-captive North and South America driveline markets. (2) Based on management estimates and 3rd party market analysis for non-captive North and South America front axle and brake markets.
(1) (1)
(2) (2)
LWLH Beam
410mm ADB
Integrated offering

26 26
Americas Components Growth
Current Share:
• Vertically integrated in precision forging, machining and heat treat
• Cost leader in precision forgings
• Reliable manufacturing and supply chain footprint
• Full suite of design and simulation software
• Highly fragmented gear market in North America
• Localized specialized suppliers • Traditional axle suppliers
MA
RK
ET
MER
ITO
R
Addressable Market
Competitive Landscape
Advantages
Strategy
(1) Based on management estimates and 3rd party market analysis for non-captive North and South America components markets.
(1)
(1)
• Install dedicated components organization
• Leverage scale to become a superior components supplier
• Leverage any excess on-highway capacity
• Invest in capacity to support growth

27 27
MA
RK
ET
Americas Off-Highway Growth Addressable Market
Competitive Landscape
Advantages
Strategy
Current Share:
• Competitive dynamic varies within specific off-highway segments
• European-based suppliers
• Specialized suppliers present in niche segments
• Grow components business with captive market - Leverage and expand current business - Extend into geared assemblies (carriers)
• Leverage global product development - Grow in Americas by leveraging China products:
carriers, wheel ends, brakes
• Expand regional customer relationships to new markets - China-based OEMs targeting South America - Leverage footprint to manufacture components and
assemblies locally
• World-class gear manufacturing capacity
• Global excellence in heavy-duty, highly proliferated axle manufacturing
• Supply chain expertise
MER
ITO
R
(1) Based on management estimates and 3rd party market analysis for non-captive North and South America off-highway markets.
(1)
(1)

28 28
Americas Highlights
Technical capabilities and manufacturing expertise expected to enable:
Existing product leadership and market positions expected to enable: CONTINUED GROWTH with strategic customers
FURTHER EXPANSION of core product portfolio, components and off-highway
ADVANCED PRODUCT DEVELOPMENT programs and successful launches
COMPONENT SALES of forgings and gearing into various markets to offset market cyclicality
EXPANSION into off-highway market utilizing manufacturing footprint and strong support and service network
GROWTH in medium-duty axle, driveline and brake business

International Business Overview Joe Plomin President, International

30 30
Europe Overview
FY15 Revenue
Select Customers
Employees Manufacturing Facilities
Customer Facing
50
2,070 Total Employees
France
Italy
Sweden
Turkey
United Kingdom
~$570M (1)
(1) FY15 revenue excludes revenue from Aftermarket & Trailer business segment. (2) Employee headcounts are approximate numbers. (3) Customer facing is defined as sales and marketing employees.
(3)
(2)
Engineering and Quality
85

31 31
Asia Pacific Overview
FY14 Revenue
$380M
Select Customers
Employees Manufacturing Facilities
Customer Facing
60
1,020 Total Employees
FY15 Revenue
~$320M Australia
China (2)
India (4)
Singapore
(1)
(1) FY15 revenue excludes revenue from Aftermarket & Trailer business segment. (2) Employee headcounts are approximate numbers. (3) Customer facing is defined as sales and marketing employees.
(3)
(2)
Engineering and Quality
120

32 32
China Western Europe
Production FY15
Actual FY16
Outlook FY19
Outlook
Medium and Heavy Duty 398 410-420 410-430
FY15 Actual
FY16 Outlook
FY19 Outlook
Revenue (Incl. exports)
~$100M ~$100M Market +5% annually
Production FY15
Actual FY16
Outlook FY19
Outlook
Medium and Heavy Duty 270 290-300 350-370
2016 EU Forecast
• Economic indicators trending positive
• Truck registrations increasing
• Freight fundamentals improving
2019 EU Forecast • Market expected to increase slightly
China Forecast • 2016 market to remain flat due to challenged
construction and mining markets • 2019 market expected to increase driven by
GDP growth
India Forecast
• 2016 market to expand driven by GDP growth • 2019 market expected to be strong due to
infrastructure requirements
International Market Perspective (units in 000s) (1) (2)
(1) Source: FY15 actuals based on ACT, LMC Automotive and Anfavea. (2) FY16 and FY19 outlook are based on Meritor estimates. LMC CY19 Western Europe heavy and medium truck forecast (published Sep. 2015) is 512 units. LMC CY19 India total truck forecast
(published Sept. 2015) is 359 units. Actual results may differ materially from projections as a result of risk and uncertainties. See “Forward Looking Statements.”
India

33 33
International Market Opportunities
Core Products Europe
Core Products Asia Pacific
Off-Highway
Meritor Opportunity
Size of Addressable Market
$2.7B Market $1.8B Market $2.1B Market
Meritor’s Share: ~30%
Meritor’s Share: 8%
Meritor’s Share: ~4%
$250M (Risk adjusted target
of $125M)
(1) Based on management estimates and 3rd party market analysis for non-captive Europe, China and India markets.
(1)
(1) (1) (1)

34 34
• Leverage global OEM relationships with common platform strategy
• Product portfolio fills gaps for vertically integrated OEMs 17X EVO - Low ratio increases efficiency for high torque bus and
truck applications 610/P600 Hub Reduction - Only global hub reduction offering in market
• BrakeThrough investments from prior three years have significantly improved capability of business
• Production capability in Europe, North America, Brazil, China, Turkey and India
• Scania new business in full production
Global Disc Brake Capability Broad Axle Portfolio
International Core Product Growth
Addressable Market: Current Share:
(1) Based on management estimates and 3rd party market analysis for Europe brake market. (2) Based on management estimates and 3rd party market analysis for drive axles in Europe.
(1) (1)
(2) (2) Addressable Market: Current Share:

35 35
China Core Growth Addressable Market
Competitive Landscape
Advantages
Strategy
Current Share:
• Intensive competitive pressures in mass market axle products
• Mid-tier market opportunity due to technology upgrade requirements
• Target key bus, coach and truck OEMs focused on premium/mid tier China sector and export markets
• Leverage customer wins to build scale of localized production and reducing product cost - New axle and brake business in Japan with major OEM - Significant localization of products completed in FY15
• Product designs that are lighter weight, more durable and more efficient than local Chinese products
• Ability to provide service components in China and export markets
MA
RK
ET
MER
ITO
R
Premium (1%)
Mass Market (76%)
-2%
Mid-tier (18%) 8%
1-2%
Low-tier (5%) -10%
CAGR
(1)
(1)
(1) Based on management estimates and 3rd party market analysis for non-captive China axle, driveline and brake markets. (2) Estimated 2009 to 2020 growth CAGR.
(2)

36 36
• Primarily global competitors and vertically integrated OEMs
India Core Growth
Addressable Market
Competitive Landscape
Advantages
Strategy
Current Share:
• Grow with non-vertically integrated OEMs
• Significant extension of product line for growing market segments – light commercial vehicle, military and vocational
• World-class manufacturing capabilities
• Established customer relationships
• Capability for local development, validation and production of India’s requirements
• Demonstrated track record of growing share with core business
MA
RK
ET
MER
ITO
R
(1)
(1)
(1) Based on management estimates and 3rd party market analysis for non-captive India axle, driveline and brake market.

37 37
Off-Highway Growth Addressable Market
Competitive Landscape
Advantages
Strategy
Current Share:
Europe • Several well-established players with scale
• A few specialized suppliers play in each sub-segment
India • Current supplier technology is dated
• Opportunity for premium manufacturer
China • Handful of large OEMs control market
• Very few specialized suppliers in each sub-segment
• Local technology does not meet needs of export markets
• Expand globally with existing off-highway customers
• As sophistication of OEMs’ products advance, competitive landscape provides a gap for high-quality axle suppliers
• Develop new products leveraging cutting edge technology - China JV (XMAL) products and components provide product
base for export into NA and EU - Expand into agricultural and lift truck applications using
existing carriers, wheel ends and brakes
• World-class truck carriers and gears are transferrable to off-highway applications
• Global excellence in heavy-duty, highly proliferated axle manufacturing
MA
RK
ET
MER
ITO
R
(1)
(1)
(1) Based on management estimates and 3rd party market analysis for non-captive Europe, China and India off-highway axle and brake market.

38 38
International Highlights
Technical capabilities and manufacturing expertise expected to enable:
Existing product leadership and market positions expected to enable:
LOCALIZATION of global hub reduction axle to provide entry into growing vocational truck sector in India
ACCESS to light commercial vehicle applications with 10X, 12X and 13X axles
EXPANSION of disc brake position
GROWTH in China and India through export opportunities
GROWTH in specialty segments including bus, coach and heavy vocational applications
INCREASED SALES of 17X EVO – the most fuel efficient axle in the market
EXPANSION into off-highway market utilizing China product portfolio and global capabilities

Aftermarket & Trailer Business Overview Rob Speed President – Aftermarket & Trailer

40 40
Select Customers
Employees Facilities Belgium
Canada (2)
Czech Republic
Mexico (2)
Switzerland
United Kingdom
USA (4)
125
860 Total Employees
Customer Facing
Aftermarket & Trailer Overview
FY15 Revenue
~$860M
(1) Employee headcounts are approximate numbers. (2) Customer facing is defined as sales and marketing employees.
(2)
(1)

41 41
Trailer Axles MTA Suspensions RFS Beams Bushings Meritor Tire Inflation Systems (MTIS)
Shock Absorbers Air Springs Equalizers Torque Arms Hanger Brackets
Brake & Wheel End
Brake Shoes/Kits Hubs/Drums Wheel Seals Bearings Camshafts
Automatic + Manual Slack Adjusters Wheel Attaching Components
Trailer Axle and Suspension
Wheel End
Calipers Rotors Wheel Cylinders
Brake Hardware Disc Pads
Disc Brakes (Hydraulic and Air)
Compressors Cartridges Air Dryers/ECU’s Sensors Valves
Air Systems
Universal Joints Center Bearings Tubing Yokes
Flanges Spline Plugs Bearing Stub Shafts Yoke Shafts
Driveline
14" Assemblies 15.5" Assemblies Clutch Brakes
Install Kits/Other Accessories
Clutch
Axles Differentials Gear Sets Gearing
Seals and Bearings Overhaul Kits Axle Shafts
Drive Axle
Transmissions Gearing Seal and Bearing Kits
Overhaul Kits Input Shafts
Transmissions
Aftermarket Product Portfolio
Steering & Suspension
Tie Rod Ends King Pin Kits Drag Links
Cross Tubes Steering Arms
Steering
Drivetrain

42 42
Aftermarket & Trailer Financial Performance
10.0%
11.5%
13.9% Impact on EBITDA
• Material Cost Reductions
• Labor & Burden Performance
• Structural Cost Reductions
• Pricing for Value
FY13 FY14 FY15
M2016 driving strong EBITDA margin performance
(1) See Appendix – “Non-GAAP Financial Information.”
(1)
390 Basis Point Expansion
43 43
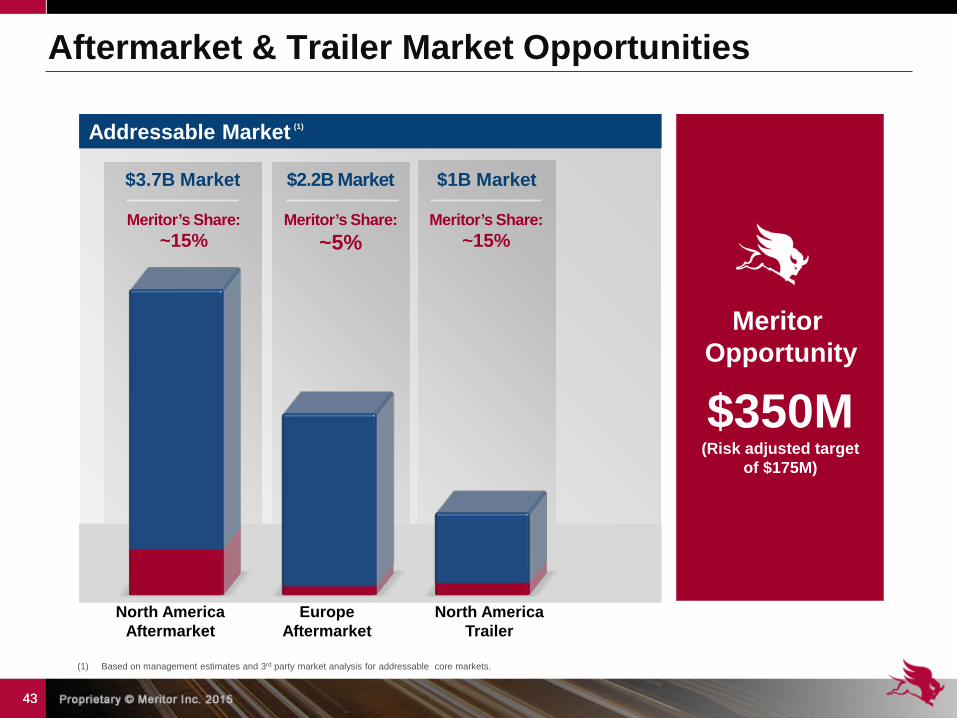
Aftermarket & Trailer Market Opportunities
Meritor Opportunity
$350M (Risk adjusted target
of $175M)
North America Aftermarket
Europe Aftermarket
$2.2B Market $3.7B Market
Addressable Market
$1B Market
Meritor’s Share: ~15%
Meritor’s Share: ~5%
Meritor’s Share: ~15%
(1)
North America Trailer
(1) Based on management estimates and 3rd party market analysis for addressable core markets.

44 44
Core Share Growth
Product Expansion
Channel and Geographic Expansion
Excellence in Execution
Customer Intimacy
Growth Focused
Organization
• Speed-to-market • Supplier development
• Customer segmentation • Increase share of wallet
• Customer wants and needs • Push vs. pull
• Identify opportunities • Enhanced relationships
• Increased fill rates • Rigorous opportunity tracking
• Grow in emerging markets • Improved cost position
• Higher service levels • Optimized cost structure
• Refreshed product portfolio
• New opportunities
• Not market dependent • Leverage tax position
GROWTH CATEGORIES EN
ABLE
RS
Catalysts for Growth

45 45
North American Aftermarket Core Growth
Current Share:
• Leverage OEM installed base with focus on increasing production share at PACCAR
• Expand core all-makes and reman product portfolios to better access non-genuine market segments
• Leverage world-class remanufacturing footprint and operations to grow reman market share
• Expand presence in Mexico
• Focus on customer service levels as source of competitive differentiation
• Well-recognized genuine, all-makes and reman product offerings
• Strong market share position in OEM and independent aftermarket channel
• Competitive cost position and distribution capability
• Complex value chain with numerous parts suppliers and channels
• Increasing competition at lower product price tiers
• Increasing presence of competitive brands
MA
RK
ET
MER
ITO
R
Addressable Market
Competitive Landscape
Advantages
Strategy
(1) Based on management estimates and 3rd party market analysis for addressable North America and Europe aftermarket markets.
(1)
(1)

46 46
European Aftermarket Core Growth
Current Share:
• Offer product bundles across wheel-end components (pads, disc and caliper)
• Partner with OEMs to remanufacture private label differentials
• Expand all-makes gearing portfolio with distribution in Eastern and Southern Europe regions
• Increase availability of friction pads and discs by offering direct shipment to larger OEs and distributors
• Focused sales approach to increase fleet pull-through
• Geographic expansion into Middle East and Africa
MA
RK
ET
MER
ITO
R
Addressable Market
Competitive Landscape
Advantages
Strategy
• Strong expertise in remanufacturing
• Only OE supplier that serves entire price and product range in friction segment
• Talent base is diversified in nationality, language and geography
• Market is transactional, fragmented and differs across countries
• Braking landscape is highly competitive with numerous local remanufacturers and will-fit suppliers
• OEs have stronger position in Europe than in North America
• Western Europe mostly a replacement market with Eastern Europe a repair market
(1) Based on management estimates and 3rd party market analysis for addressable North America and Europe aftermarket markets.
(1)
(1)

47 47
Trailer Growth
Strategy
MA
RK
ET
MER
ITO
R
Addressable Market
Current Share:
Advantages
• Expand axle and air suspension product portfolio
• Capitalize on strong automatic tire inflation share and GHG regulations
(1)
• Vertically integrated for optimized cost and capacity
• Strong brand recognition with the most comprehensive fleet support across trailer, tractor and aftermarket
• Leading position in loose axles and automatic tire inflation
Competitive Landscape
• Air ride comprises ~65% of the trailer market
• Few significant competitors with one dominant player having majority share of the market
• GHG regulations expected to drive automatic tire inflation adoption from 40% to 70%
• OEMs not vertically integrated on suspension and axles and would benefit from a few large suppliers
(1) Based on management estimates and 3rd party market analysis for addressable trailer market.
(1)

48 48
Aftermarket & Trailer Highlights
Supply chain and sales and marketing excellence will enable:
IMPROVED fill rates
INCREASED channel penetration
FLEET pull-through in Europe
SPEED TO MARKET through an all-makes global center of excellence
GEOGRAPHIC EXPANSION into the Middle East and Mexico
Leading market position and customer relationships will allow for: INCREASED MARKET SHARE through expanded trailer product portfolio
Revenue-focused organization will drive:

Financial Review Kevin Nowlan Senior Vice President and CFO

50 50
Revenue Growth
Profit Improvement
Capital Allocation
Grow Revenue Faster than Market (measured from FYE15 – FYE19)
Grow Adjusted Diluted EPS (measured from FYE15 – FYE19)
Reduce Net Leverage Ratio (measured at end of FY19)
Return FCF to Common Shareholders
(measured from FYE15 – FYE19)
>20% above market
(cumulative)
+$1.25 increase in
Adj. Diluted EPS
<1.5x (from 2.6x at FYE15)
25% of FCF
(1) Based on management’s current planning assumptions and other factors. Actual results may differ materially from projections as a result of risks and uncertainties. See slide “Forward Looking Statements.” (2) See Appendix – “Non-GAAP Financial Information.” (3) Net Leverage Ratio: (Total debt – Cash and cash equivalents) / Adjusted EBITDA. See Appendix – “Non-GAAP Financial Information.”
(3)
(2)
(2)
Performance Metrics

51 51
Focus Areas Strategy
Maintain Strong Liquidity Maintain liquidity ~20% of annualized revenue
Maintain extended debt maturity profile
Achieve Target Leverage Achieve strong BB credit metrics by driving net leverage ratio <1.5
De-Risk Pension Obligations Continue executing strategies that permanently de-risk pension benefit obligations
Return Value to Shareholders Return 25% of free cash flow to shareholders
Support Strategic Growth Increase internal capital expenditure commitment to 2.5% of sales
Build equity capital to support inorganic growth opportunities
(2)
(1)
(1) See Appendix – “Non-GAAP Financial Information.” (2) Net Leverage Ratio: (Total debt – Cash and cash equivalents) / Adjusted EBITDA. See Appendix – “Non-GAAP Financial Information.”
Capital Allocation Priorities
52 52
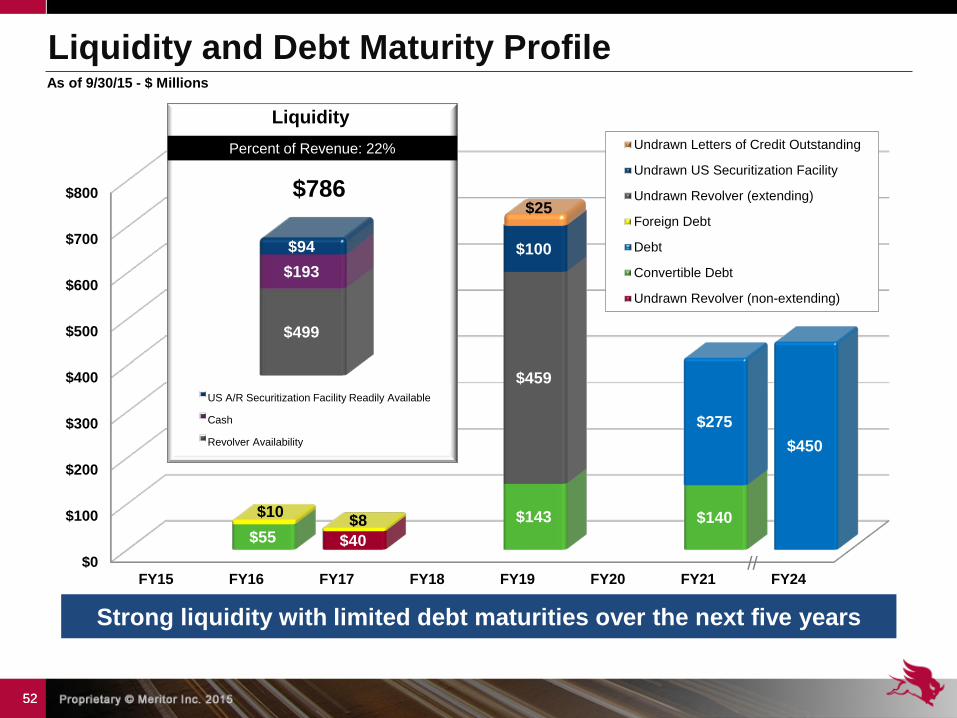
Strong liquidity with limited debt maturities over the next five years
$0
$100
$200
$300
$400
$500
$600
$700
$800
FY15 FY16 FY17 FY18 FY19 FY20 FY21 FY24
$40 $55 $143 $140
$275 $450
$10 $8
$459
$100
$25
Undrawn Letters of Credit Outstanding
Undrawn US Securitization Facility
Undrawn Revolver (extending)
Foreign Debt
Debt
Convertible Debt
Undrawn Revolver (non-extending)
Liquidity and Debt Maturity Profile As of 9/30/15 - $ Millions
$499
$193 $94
Liquidity
US A/R Securitization Facility Readily Available
Cash
Revolver Availability
Percent of Revenue: 22%
$786
//

53 53
(1) Net Leverage Ratio: (Total debt – Cash and cash equivalents) / Adjusted EBITDA. See Appendix – “Non-GAAP Financial Information.” (2) See Appendix – “Non-GAAP Financial Information.”
3.0x 2.6x
1.5x
(1)(2)
Reduce net leverage ratio by more than 1x through 2019
FY13 Actual FY15 Actual FY19 Target
Net Leverage Ratio Reduction Achieved by
• Increase in adjusted EBITDA • Debt repayment • Free cash flow generation
Company Name S&P Rating
Cummins A+
Dana BB+
Oshkosh BB+
Tenneco BB+
Meritor Target BB / BB+
Allison Transmission BB
Stoneridge BB
American Axle BB-
Meritor (current) B+
Commercial Vehicle Group B
Accuride B-
Net Leverage Ratio Target

54 54
Leverage Impact on Equity Valuation
Source: Company filings, Standard & Poor’s, FactSet, Bloomberg, J.P. Morgan. (1) S&P 400 NTM Price/Earnings to Growth Ratio data as of 9/30/15. Filings data as of most recent available. Median value of S&P 400 firms excluding firms with negative net income.
Deleveraging strategies are expected to influence valuation multiples
FV / EBITDA multiples
PEG Ratio by Credit Rating
2.8x
2.0x
1.5x
0.9x 0.8x
NTM PEG Ratio
Credit Rating
MTOR
A BBB BB B+ B
(1)

55 55
De-Risk Pension Obligations Mandatory Pension Contributions1 $ Millions
Pension status has improved significantly, but opportunities to further de-risk plans will remain an area of focus
FY16 FY17 FY18 FY19
$18 $9
$8
$6
$6 $6
$6
$6
UK US Qualified Other
US Qualified UK Other
$972
$599
$85
$830
$707
$10
Liabilities Assets
Pension Profile As of 9/30/15 - $ Millions
85% Funded
118% Funded
12% Funded
Total Assets: $1,547 Total Liabilities: $1,656 Unfunded: $(109) Total Funded Status: 93%
(1) Based on assumptions as of December 2015
Potential Actions to De-Risk Pension
• Annuity purchases • Buy-ins • Lump-sum buyouts • Liability Driven Investing (“LDI”) asset
allocation strategies
$32
$21

56 56
Committed to returning capital to shareholders
Return Value to Shareholders
Return of Value • Complete $210M equity and
equity-linked repurchase program in FY2016
• Target of 25% of free cash flow utilized through FY2019 - Top quartile for S&P 600
‘B’ rated companies - 2nd quartile for S&P 600
‘BB’ rated companies 0%
4%
22%
11%
35%
69%
MTOR 25% of FCF
MTOR 25% of
FCF
1st (Lowest Quartile)
2nd
3rd
4th (Highest Quartile)
1st (Lowest Quartile)
2nd
3rd
4th (Highest Quartile)
S&P 600 Total Payout1 (as % of FCF)
Source: Company filings, Standard & Poor’s, FactSet, J.P. Morgan, Bloomberg. (1) Total payout defined as LTM dividends + average of annual repurchases of last 12 fiscal quarters. (2) See Appendix – “Non-GAAP Financial Information.”
Credit Rating
Payout % Payout %
BB B
(2)

57 57
Value of Meritor’s Deferred Tax Assets
Adjusted diluted EPS incorporating DTA usage more properly reflects true benefit to shareholders
Recognition of Deferred Tax Asset Value • DTAs offset a portion of
Meritor’s cash tax but not necessarily book tax expense
• Adjusted Diluted EPS excludes non-cash tax expense associated with the use of deferred tax assets in jurisdictions with NOLs
2014 2015 2016 Outlook
Adjusted Diluted EPS as previously reported $1.02 $1.55 $1.60 - $1.70
Non-cash tax adj. $0.04 $0.04 $0.10
Adjusted Diluted EPS(1)(4) $1.06 $1.59 $1.70 - $1.80
Gross DTA balance at 9/30/15(2) $593
Potential PV of DTAs(3) $0 - $190 (up to $1.90 per share)
$ in millions, except per share amounts
(1) See Appendix – “Non-GAAP Financial Information.” (2) Includes NOLs and Pension/OPEB DTAs in the United States and NOLs in Brazil, Italy, Mexico, and Sweden. (3) Per share impact assumes 100.1 million diluted average common shares outstanding as of FYE15. Present value of differed tax assets discounted at 12 percent. (4) Based on management’s current planning assumptions and other factors. Actual results may differ materially from projections as a result of risks and uncertainties. See slide “Forward Looking Statements.”

58 58
Revenue Outlook
$3.7 $3.8 $3.5
$4.1
New programs expected to drive revenue increase of 20% above market
$ billions
• Markets • FX • Other
Risk-adjusted new revenue programs
FY13 FY14 FY19 Target FY15
7.2%
8.3%
9.5%
~11.5%
Revenue Adjusted EBITDA Margin

59 59
$0.46
$1.06
$1.59
$2.84 Risk-adjusted new revenue programs
Share buyback
M2019 plan drives shareholder value through adjusted diluted EPS growth
16% CAGR
FY13 FY14 FY19 Target FY15
Operating Performance
Revenue Adjusted EBITDA (~11.5%)
Interest Expense Depreciation & Amortization Tax Expense (15%)
Adj. Net Income Adj. Diluted EPS (95M shares)
$ 4,100 470 (80) (70) (50)
$ 270 $ 2.84
(1) See Appendix – “Non-GAAP Financial Information.” (2) Based on management’s current planning assumptions and other factors. Actual results may differ materially from projections as a result of risks and uncertainties. Please see slide “Forward Looking Statements.”
Walk to FY19 EPS (1)(2)
Walk to FY19 Adj. diluted EPS Target
$ in millions, except per share amounts

Closing Remarks and Q&A Jay Craig CEO & President

61 61
MTOR Investment Thesis
$1.59
$2.84
FY15 FY19 Target
Adjusted Diluted EPS Growth Driven By
Strategy designed to increase shareholder value
• Clear strategic priorities
• Proven ability to execute
• Growing customer relationships
• Competitive product line
• Advanced technical capabilities
• Strong brand reputation
• Manufacturing/distribution expertise
(1) See Appendix – “Non-GAAP Financial Information.”
(1)
62 62
(1) Based on management’s current planning assumptions and other factors. Actual results may differ materially from projections as a result of risks and uncertainties. See slide “Forward Looking Statements.”
(1)
(1)
(1)

63 63 63 63 63
64
Appendix Appendix

65 65
In addition to the results reported in accordance with accounting principles generally accepted in the United States (“GAAP”) included throughout this presentation, the company has provided information regarding Adjusted income (loss) from continuing operations, Adjusted diluted earnings per share from continuing operations, Adjusted EBITDA, Adjusted EBITDA margin, Free cash flow, Net debt including retirement liabilities, and Net leverage ratio which are non-GAAP financial measures.
Adjusted income (loss) from continuing operations and Adjusted diluted earnings (loss) per share from continuing operations are defined as reported income or loss from continuing operations and reported diluted earnings (loss) per share from continuing operations before restructuring expenses, asset impairment charges, non-cash tax expense related to the use of deferred tax assets in jurisdictions with net operating loss carry forwards, and other special items as determined by management. Adjusted EBITDA is defined as income (loss) from continuing operations before interest, income taxes, depreciation and amortization, non-controlling interests in consolidated joint ventures, loss on sale of receivables, restructuring expenses, asset impairment charges and other special items as determined by management. Adjusted EBITDA margin is defined as Adjusted EBITDA divided by consolidated sales from continuing operations. Free cash flow is defined as cash flows provided by (used for) operating activities less capital expenditures. Net debt including retirement liabilities is defined as total debt plus pension assets, pension liability, retiree medical liability and other retirement benefits less cash and cash equivalents. Net leverage ratio is defined as the ratio of total debt less cash and cash equivalents to Adjusted EBITDA.
Management believes that the non-GAAP financial measures used in this presentation are useful to both management and investors in their analysis of the company's financial position and results of operations. In particular, management believes that Adjusted EBITDA, Adjusted EBITDA margin and Adjusted diluted earnings (loss) per share from continuing operations are meaningful measures of performance as they are commonly utilized by management and the investment community to analyze operating performance in our industry. Further, management uses Adjusted EBITDA for planning and forecasting future periods. Management believes that Free cash flow is useful in analyzing our ability to service and repay debt. Net debt including retirement liabilities is a specific financial measure which is part of our three-year plan, M2016, to reduce debt and other balance sheet liabilities. Net leverage ratio is a specific financial measure which is part of our three-year plan, M2019, to reduce net debt as a proportion of Adjusted EBITDA.
Adjusted income (loss) from continuing operations, Adjusted diluted earnings (loss) per share from continuing operations and Adjusted EBITDA should not be considered a substitute for the reported results prepared in accordance with GAAP and should not be considered as an alternative to net income as an indicator of our operating performance or to cash flows as a measure of liquidity. Free cash flow should not be considered a substitute for cash provided by (used for) operating activities, or other cash flow statement data prepared in accordance with GAAP, or as a measure of financial position or liquidity. In addition, these non-GAAP cash flow measures do not reflect cash used to repay debt or cash received from the divestitures of businesses or sales of other assets and thus do not reflect funds available for investment or other discretionary uses. These non-GAAP financial measures, as determined and presented by the company, may not be comparable to related or similarly titled measures reported by other companies.
Set forth on the following pages are reconciliations of these non-GAAP financial measures to the most directly comparable financial measures calculated and presented in accordance with GAAP.
Non-GAAP Financial Information

66 66
Non-GAAP Financial Information Income from Continuing Operations Reconciliation
(in millions, except per share amounts)
Twelve Months Ended Sept. 30, 2015 Sept. 30, 2014 Sept. 30, 2013
INCOME FROM CONTINUING OPERATIONS ATTRIBUTABLE TO MERITOR, INC. $ 65 $ 279 $ (15)
Adjustments: Pension Settlement, net of tax 55 - 100 Loss on Debt Extinguishment 24 31 19 Restructuring Costs, net of tax 14 7 22 Goodwill and Asset Impairment, net of tax 13 - - Warranty Contingency - (8) 7 Income Tax Benefit (valuation allowance reversal) (16) - - Eaton Settlement, net of tax - (208) - Gain on Sale of Investment - - (92) Non-cash Tax adjustment 4 4 4
Adjusted Income From Continuing Operations $ 159 $ 105 $ 45 Adjusted Diluted Earnings Per Share From Continuing Operations $ 1.59 $ 1.06 $ 0.46
Diluted Shares Outstanding 100.1 99.2 97.1 (1) Amounts have been adjusted in prior years to exclude non-cash tax expense associated with the use of deferred tax assets in jurisdictions with net operating losses.
(1)
(1)

67 67
Non-GAAP Financial Information (in millions)
Twelve Months Ended Sept. 30, 2015 Sept. 30, 2014 Sept. 30, 2013
Adjusted EBITDA $ 334 $ 314 $264 Eaton Settlement, net of tax - 208 - Interest Expense, Net (105) (130) (126) Provision for Income Taxes (1) (31) (64) Depreciation and Amortization (65) (67) (67) Loss on Sale of Receivables (5) (8) (6) Restructuring Costs (16) (10) (23) Specific Warranty Contingency - 8 (7) Pension Settlement Loss, Gross (59) - (109) Goodwill and Asset Impairment (17) - - Gain on Sale of Investment - - 125 Noncontrolling Interests (1) (5) (2)
Income From Continuing Operations Attributable to Meritor, Inc. $ 65 $ 279 ($15)
Loss from Discontinued Operations Attributable to Meritor, Inc. (1) (30) (7)
Net Income attributable to Meritor, Inc. $ 64 $ 249 ($22)

68 68
Non-GAAP Financial Information Net Leverage Ratio (in millions)
September 30, 2015 2014 2013
Short-term debt $ 15 $ 7 $ 13 Long-term debt 1,036 948 1,104
Total debt 1,051 955 1,117 Less: Cash and cash equivalents (193) (247) (318)
Net debt $ 858 $ 708 $ 799
(1) Net Leverage Ratio: (Total debt – Cash and cash equivalents) / Adjusted EBITDA. (2) 2013 amounts have been recast to reflect the early adoption of ASU 2015-03, Interest — Imputation of Interest (Subtopic 835-30): Simplifying the Presentation of Debt Issuance Costs.
(1)
Twelve Months Ended Sept. 30, 2015 Sept. 30, 2014 Sept. 30, 2013
Adjusted EBITDA $ 334 $ 314 $ 264 Net leverage ratio 2.6 2.3 3.0
(2)

69 69
Non-GAAP Financial Information Net debt, including retirement liabilities (in millions)
September 30, 2015 2014 2013 2012
Total debt $ 1,051 $ 955 $ 1,117 $1,060 Retirement liabilities 561 714 879 1,112 Less: Cash and cash equivalents (193) (247) (318) (257)
Net debt, including retirement liabilities $ 1,419 $ 1,422 $ 1,678 $ 1,915
(1) (2)
(1) 2013 amounts have been recast to reflect the early adoption of ASU 2015-03, Interest — Imputation of Interest (Subtopic 835-30): Simplifying the Presentation of Debt Issuance Costs. (2) As reported in fiscal year 2012 Annual Report Form 10-K.