Embed Size (px)
Citation preview

ANALYST DAY

Q&A
Sustainability
Opportunities
Strategic Priorities and Outlook
Macroeconomic Environment
Company Overview
Retail Market
Financial Information

Q&A
Sustainability
Opportunities
Strategic Priorities and Outlook
Macroeconomic Environment
Company Overview
Retail Market
Financial Information

4
RECENT HISTORY/ MAIN EVENTS
1964 1974 1979 1982 1987 19931994 1997 1998 2009
Military Government Redemocratization President FHC President Lula
-5%
0%
5%
10%
15%
Global Events
Domestic Events
1st Oil Shock
2nd Oil Shock
External
Debt Default
Black
Monday
“Plano Real”
Mexican
Crisis
Asian
Crisis
Russian/
LTCM crisis
Global
Financial
Crisis
GPD Growth

RESILIENCE AGAINST CREDIT CRISISTHE “LIFO” EFFECT
GDP growing above 4% from 2010 onwards
Inflation rate below 5% (2010-2012)
Interest rate slowly increasing, reaching 10.5% by 2012
Exchange rate below R$ 2/US$ during the period (2010-2012)
GDP Growth – QoQ Annualized
Global Financial
Crisis-10,0%
-5,0%
0,0%
5,0%
10,0%
Source: IBGE and Itau Unibanco estimates
-15,0%
1Q08 2Q08 3Q08 2Q09 3Q09 4Q09 e 1Q10 e 2Q10 e 3Q10 e 4Q10 e
-12.9%
-3.9%
7.8%6.1% 5.3%
7.8% 7.8%6.1%
4.9% 4.9% 4.9% 4.9%
4Q08 1Q09
5

BRAZILIAN POPULATIONIn 2008
98,6% of the houses has Eletrictricity
6
Poverty1991 – 35%
2008 – 15,5%
Illiteracy1991 – 16,4%
2008 – 9,1%
84% of the houses has Running Water
78,1% of the population has Mobile Phones (168 million phones)

CONSUMER TRENDS
A (US $70,000)
B (US $22,275)
C (US $8,515)
D (US $4,390)
E (US $2,470)
48.5%
74.2%
Growth of Middle Income Classes
Source: Study “Brazil in focus IPC Target 2008” (Target Marketing) and IBGE 2001
Expansion of the Middle Income Class
2001 2008
13.2%
33.8%
30.9%
17.6%
4.5%
19.5%
45.8%
28.4%
4.6%
1.8%
Income per Year
7

8
Middle Income
Class
Over the last 2 years, 22,5 million people were added to this segment
The Middle Income Class pepople took advantage of this ascension to enjoy for the first time categoriesto witch they had no previous access
1,5 million formal jobs were created in 2008,
1 million in 2009 and more than 2 million are expected for 2010
Social programs have enhanced the living standards of poor families: Since 2003 the minimum wage has risen
46% over inflation
Program “minha casa, minha vida” for people to acquire their first residence

GPA’S SHARES OUTPERFORM THE IBOVESPA, REFLECTING MARKET
APPROVAL OF THE COMPANY´S INITIATIVES
Jan 2008
PCARIbovespa
Stock Evolution
Updated until November, 11th
9
Jan 2009
200%
60%
40%
Dec 2009
180%
160%
80%
PCAR -9,1% e
Ibovespa -41,2%
PCAR +84,8% e
Ibovespa +7,2%
PCAR +103,4% e
Ibovespa +82,4%
140%
120%
100%
PCAR R$34,08 e Ibovespa 63.886 points
PCAR R$30,97 e Ibovespa 37.550 points
PCAR R$63,00 e Ibovespa 68.512 points
CBD (ADR)+100,4%
Dow Jones -21,7%%
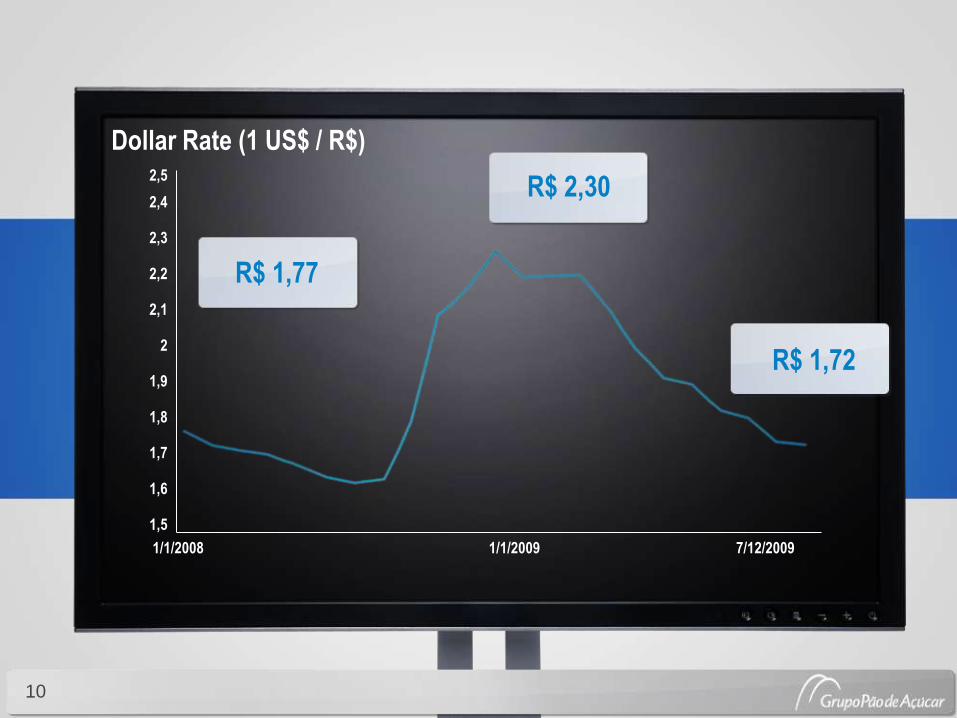
2,4
1/1/2008
10
1/1/2009 7/12/2009
2,3
2,2
1,8
1,7
1,6
1,5
2,1
2
1,9
2,5
R$ 1,77
R$ 2,30
R$ 1,72
Dollar Rate (1 US$ / R$)

Q&A
Sustainability
Opportunities
Strategic Priorities and Outlook
Macroeconomic Environment
Company Overview
Retail Market
Financial Information
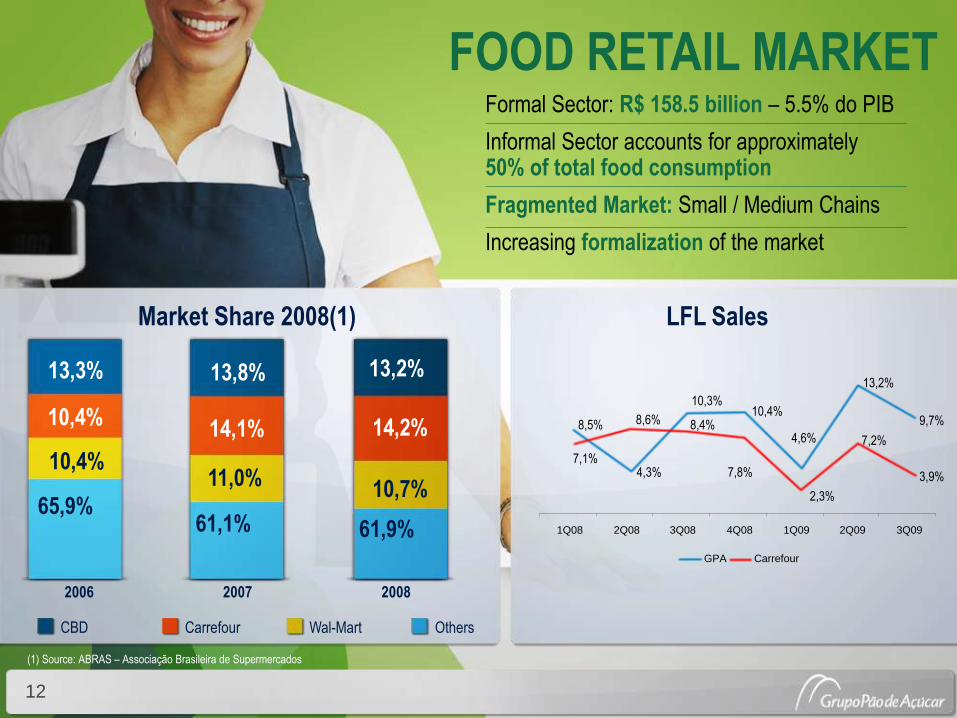
LFL SalesMarket Share 2008(1)
12
FOOD RETAIL MARKET
CBD
(1) Source: ABRAS – Associação Brasileira de Supermercados
Carrefour Wal-Mart Others
Formal Sector: R$ 158.5 billion – 5.5% do PIB
Informal Sector accounts for approximately50% of total food consumption
Fragmented Market: Small / Medium Chains
Increasing formalization of the market
2006 2007 2008
13,3%
10,4%
10,4%
13,8%
14,1%
11,0%
13,2%
14,2%
10,7%4,3%
10,4%9,7%
2,3%
3,9%
13,2%
4,6%8,5%
10,3%
7,2%
7,8%7,1%
8,6% 8,4%
1Q08 2Q08 3Q08 4Q08 1Q09 2Q09 3Q09
GPA Carrefour
65,9%61,1% 61,9%

13
ELECTRO & ELETRONIC
STORES
POTENCIAL AND MARKET SIZE(R$ BILLION)
Source: Accenture
2002 2003 2004 2005 2006 2007 2008 2013E
AVERAGE GROWTH
2002a – 2007a - 15,0% 2008e – 2013e - 14,6%
3034 40 45 50 59
68
134
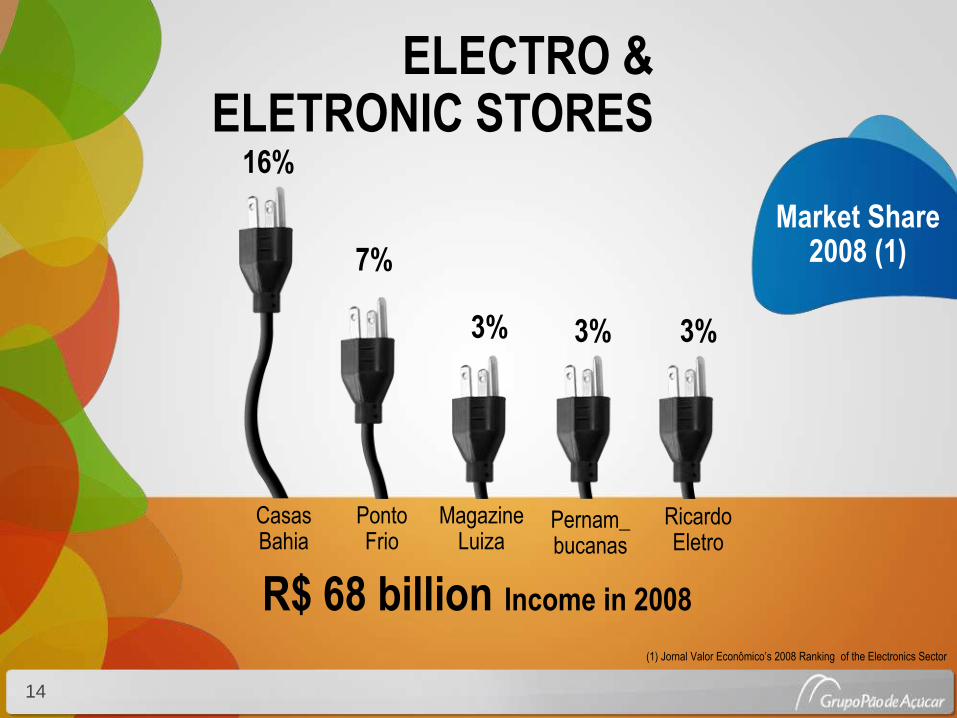
Casas Bahia
Ponto Frio
Magazine Luiza
Pernam_bucanas
Ricardo Eletro
14
16%
7%
3% 3% 3%
ELECTRO & ELETRONIC STORES
Market Share 2008 (1)
R$ 68 billion Income in 2008
(1) Jornal Valor Econômico’s 2008 Ranking of the Electronics Sector

NON-FOOD EXPANSION STRATEGY
15
Key dedicated players’ market share and positioning
RankingPositioning by social class
1. Bahia
2. Ponto Frio
3. Magazine Luiza
4. Pernambucanas
5. Ricardo Eletro
6. Insinuante
A B C D E
Strategic decision made in 2007 to expand non-food operations and reinforce/protect core business of GPA
First major strategic move made in June when GPA announced the acquisition of Ponto Frio
Casa Bahia: Complementary market positioning in the durable goods segment:
• Ponto Frio: focus on classes A, B and C• Casa Bahia: focus on classes C and D

PONTO FRIOA successful turnaround
REVERSAL OF THE SALES DOWNTREND
POSITIVE EBITDA
MOTIVATED TEAM
INTEGRATION WITH GPA
16
SYNERGIES Logistics & ITCommercialHead Office Redundancy

INTEGRATION CASAS BAHIA
Extra.com
Ponto Frio.com
PF Wholesale
CB.com
INTERNET INCLUDES:
GPA - 83%¹ CB - 17%
Nova.com - 100%
CB.com
Extra Eletro
Ponto Frio
Casa Bahia
STORE OPERATIONS
INCLUDE:
GPA - 51%² CB - 49%²
Globex- 100%
NCB
1) Does not consider Management stock option
2) Considers total adhesion of Globex to PTO
17

DEALR$ MILLION
18
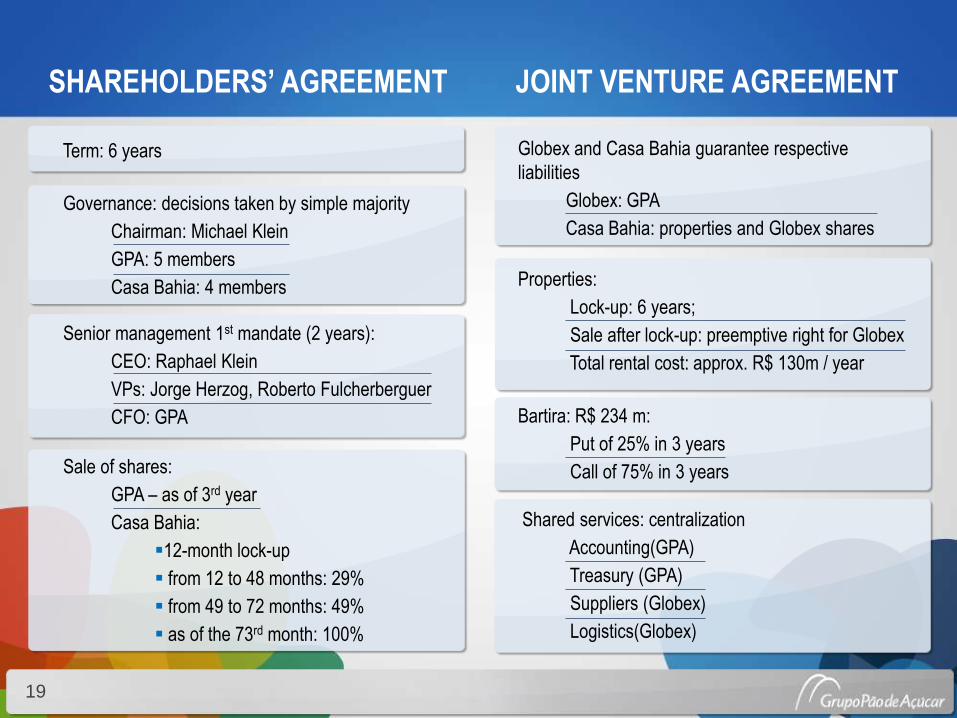
SHAREHOLDERS’ AGREEMENT
Term: 6 years
JOINT VENTURE AGREEMENT
Shared services: centralization
Accounting(GPA)
Treasury (GPA)
Suppliers (Globex)
Logistics(Globex)
Sale of shares:
GPA – as of 3rd year
Casa Bahia:
12-month lock-up
from 12 to 48 months: 29%
from 49 to 72 months: 49%
as of the 73rd month: 100%
Governance: decisions taken by simple majority
Chairman: Michael Klein
GPA: 5 members
Casa Bahia: 4 members
Senior management 1st mandate (2 years):
CEO: Raphael Klein
VPs: Jorge Herzog, Roberto Fulcherberguer
CFO: GPA
Globex and Casa Bahia guarantee respective
liabilities
Globex: GPA
Casa Bahia: properties and Globex shares
Properties:
Lock-up: 6 years;
Sale after lock-up: preemptive right for Globex
Total rental cost: approx. R$ 130m / year
Bartira: R$ 234 m:
Put of 25% in 3 years
Call of 75% in 3 years
19

CB brings operational assets to NCB;
CB brings assets and the CB.com brand to the subsidiary;
CB
Stores + DCs (~1.4 million m2)
75% stake of Bartira (furniture factory)
Receivables ~ R$ 1 billion
Other non-operational assets
NCB
Operational assets / liabilities
Approximately R$ 950 million Net Debt
Lease Agreement 10 years + 10
Approximately R$ 130 million/year;
25% furniture factory
Furniture supply agreement for 3 years
Cost price;
Fixed fee: R$ 18 million/year
SETTING-UP OF NEW CASA BAHIA (NCB)
20

SETTING-UPOF GLOBEX
GPA brings Extra Eletro operations to Globex;
Globex split up: PF.com + wholesale/ Ponto Frio + Extra Eletro;
GPA brings Extra.com to PF.com;
PF.com includes• Extra.com• Wholesale
Globex includes• Ponto Frio• Extra Eletro
1 Considers total adhesion of Globex to PTO and
does not consider management stock option
2 Considers total adhesion
of Globex to PTO
21

Market leader in durable goods segment
513 stores (3Q09);
Approximately 57,000 employees;
Strong brand, largest advertiser in
Brazil
Strong partnership with suppliers
Well structured business
(commercial, operations, logistics, IT,
contact center, furniture factory)
Focus on low-income
segments (C / D classes)
Largest Consumer Finance operation
in retail: database of 30 million clients
30%
24%
46%3%
9%
9% 32%
28%19%
Casa
Bahia
Gross Rev. (R$ Bn - exc
interest)13.9
Merchandise 12.7
Services 1.2
Stores 548
Sales Area (thousand m²) 1,005
Gross Revenue (R$ mm) /
Stores25.2
Gross Revenue (R$) / m² 13,766
Sales Area m²/Stores 1,834
PF + EE
4.2
4.1
0.1
505
365
8.3
11,525
723
CASAS BAHIA RATIOS (2008)
SALES MIX (2008)
White goods Furniture Electronics
Hard & Software Telecom Others
Household appliances & furniture
Electronics
Photo, video, telecom, software
22

Main Synergies
Centralized purchases
Integration of headquarters,
logistics and IT
E-commerce platform integration
Partnerships with suppliers
Scale gains on advertising in
CBD as a whole
Improved financial services
Rationalization of logistics
New Company’s
magnitude
R$ 18.1 Bn
Gross Revenue
5% normalized¹
EBITDA Margin
Estimated Net
Present Value of
Synergies:R$ 2 Bn
Subject to the approval of Brazilian antitrust authorities
1) % of net sales
The New Company
23

SCHEDULE
December 4, 2009:Signing Day
Disclosure to Market
D + 20: January 11, 2010 CBD Extraordinary Shareholders’ Meeting
Before Closing:
Creation of NCB
Separation of dot.com assets
Contribution of Extra Eletro to Ponto Frio
up to D + 120 : Closing (merger date)
NEXT STEPS
24

Subject to the approval of
Brazilian antitrust authorities
Leadership in the retail durable goods segment with approximately R$ 18,1 billion revenue (including e-commerce)
1.015 stores (3Q09)
28 Distribution Centers
Approximately 68.000 employees
E-commerce Income 2010
R$ 2 bi (including wholesale)
THE NEW COMPANYHighlights
25

26

Casas Bahia
Ponto Frio
Magazine Luiza
Pernam_bucanas
Ricardo Eletro
27
GPA(with Casa
Bahia and PF)
16%
7%
3% 3% 3%
26%ELECTRO & ELETRONIC MARKET
Market Share 2008 (1)
R$ 68 billion Income in 2008 (1) Jornal Valor Econômico’s 2008 Ranking of the
Electronics Sector

RANKING GLOBAL
Rank Company Headquarter Sales 2008
(US Bi) Stores
1
2
3
4
5
6
7
8
9
10
11
Best Buy
Media-staturn
Expert
DSG International
Euronics
Yamada Denki
Gome
Suning
Kesa Electricals
Nova Globex
Edion
USA
Germany
Switzerland
UK
Netherlands
Japan
China
China
UK
Brazil
Japan
45.1
33.0
21.7
20.3
19.1
16.6
15.7
15.5
11.4
10.3
7.8
4,096
768
6,902
1,638
11,824
1,360
1,263
820
713
1,015
1,178
Nova Globex 18.5 1.8
R$ Bi 1 US$/ R$
28
Source: Accenture

Q&A
Sustainability
Opportunities
Strategic Priorities and Outlook
Macroeconomic Environment
Company Overview
Retail Market
Financial Information

GPA
Gross Sales(annualized based in 2008):
R$ 26 billion
1.069 stores, located in 18 States and the Federal District:
Current Profile
More than 80.000 employees
520 million tickets per year
1,7 million sqm of sales areas
30
With Ponto Frio and Without Casas Bahia
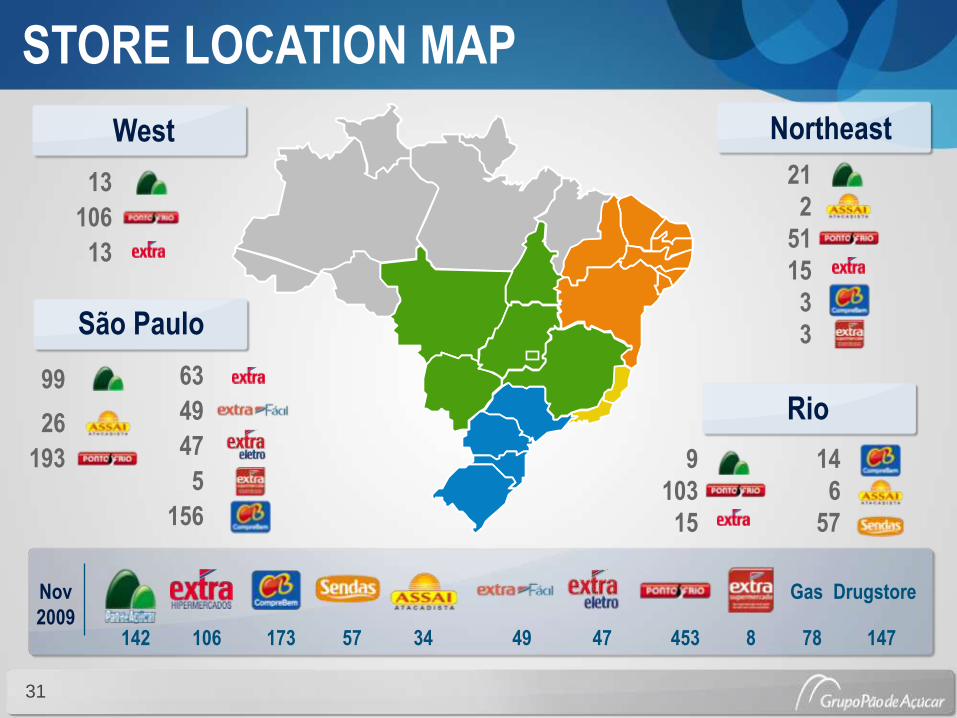
STORE LOCATION MAP
31
13
106
13
78 147
Nov
2009142 106 173 4757 4934 453
Gas Drugstore
West Northeast
Rio
São Paulo
99
26
193
63
49
47
5
156
21
2
51
15
3
3
9
103
15
14
6
57
8
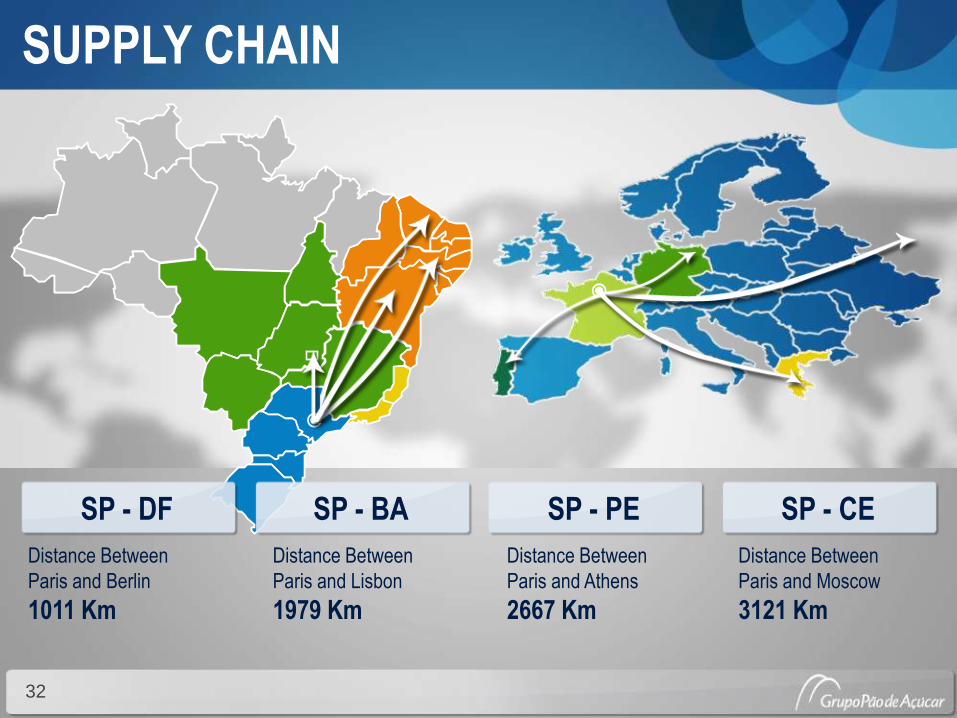
SUPPLY CHAIN
SP - DF
Distance Between
Paris and Berlin
1011 Km
SP - BA SP - PE SP - CE
Distance Between
Paris and Lisbon
1979 Km
Distance Between
Paris and Athens
2667 Km
Distance Between
Paris and Moscow
3121 Km
32
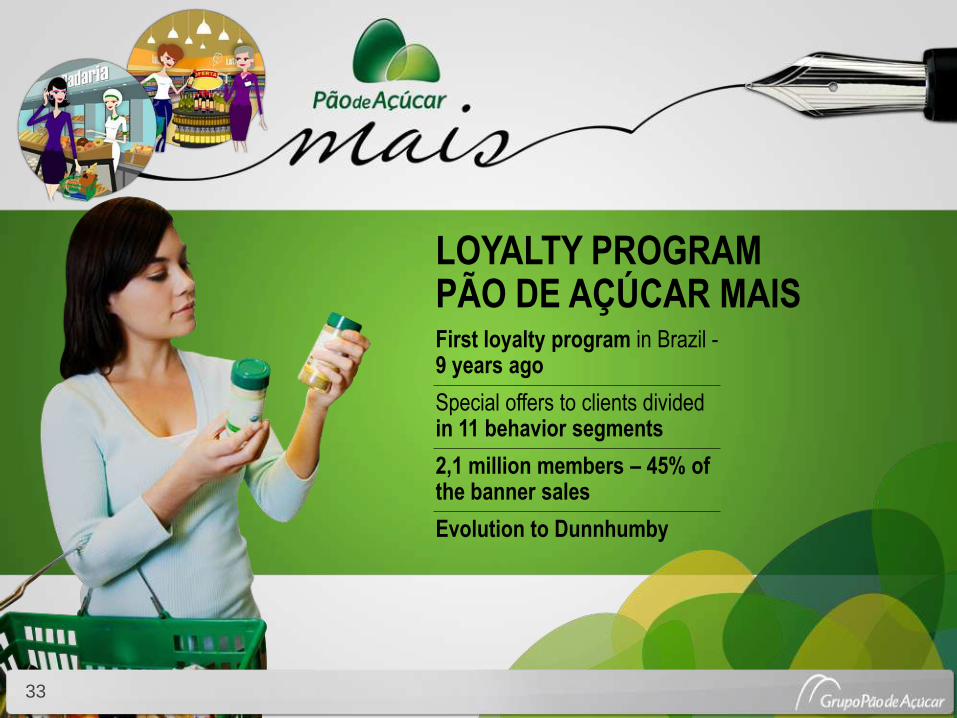
LOYALTY PROGRAMPÃO DE AÇÚCAR MAIS
33
First loyalty program in Brazil -9 years ago
Special offers to clients divided in 11 behavior segments
2,1 million members – 45% of the banner sales
Evolution to Dunnhumby

STRENGHTENING OF EXCLUSIVE BRANDS
Taeq is Leader or second brand in 52% of subcategories
Qualitá is Leader or second brand in 49% of subcategories
Participation in GPA’s total income: 5%
5.000 SKU´s
222 SKU´s Casino
34

Q&A
Sustainability
Opportunities
Strategic Priorities and Outlook
Macroeconomic Environment
Company Overview
Retail Market
Financial Information
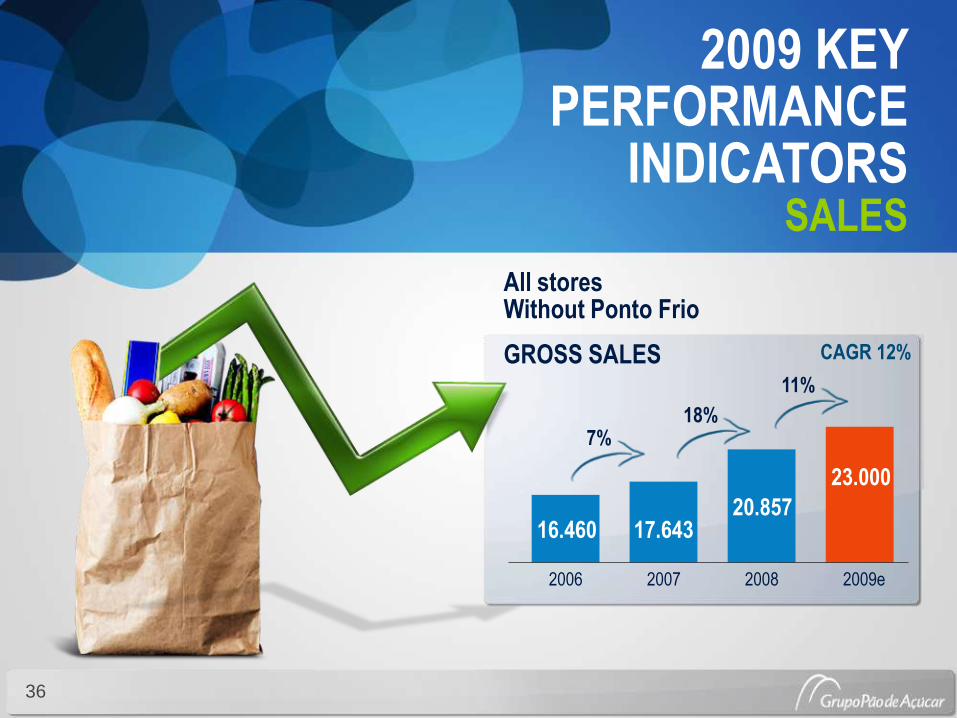
2009 KEY PERFORMANCE
INDICATORS SALES
16.460 17.64320.857
23.000
2006 2007 2008 2009e
7%18%
11%
All storesWithout Ponto Frio
GROSS SALES CAGR 12%
36

Obs: Like for Like Sales include only the stores with 12 months or more in operation
*2009 – Acumulado até Setembro
FOOD AND NON-FOOD SALES PERFORMANCE(Like for Like Sales in Nominal Terms)
1,1%
9,0%12,8%
3,1%
10,1%8,5%
2,4%
3,3%
3,9%4,5%7,6%
9,7%
16,1%
11,9%11,0%
-2,4%
3,7%5,9%
0,6%
11,4%
10,4%
14,3%
1T07 2T07 3T07 4T07 1T08 2T08 3T08 4T08 1T09 2T09 3T09Non-Food
Food
37

2009 KEY PERFORMANCE
INDICATORS P&L
GPA Consolidated without Ponto Frio – Historical evolution
38

EBITDA
Margins Sales
SG&A Expenses
THE CHALLENGE IS FINDING THE RIGHT EQUATION
BETWEEN MARGINS AND SALES GROWTH
39

2009 KEY PERFORMANCE
INDICATORS P&L
GPA Consolidated without Ponto Frio – Historical evolution
40
2009 KEY PERFORMANCE
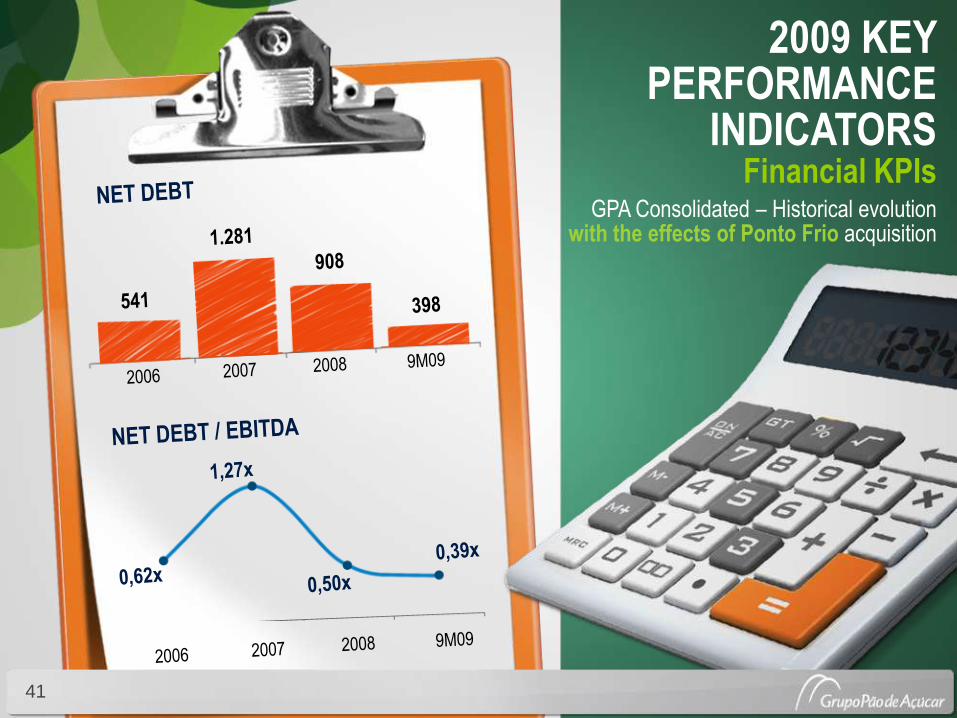
INDICATORS Financial KPIs
GPA Consolidated – Historical evolution with the effects of Ponto Frio acquisition
41

2009 KEY PERFORMANCE
INDICATORS Financial KPIs
GPA Consolidated – Historical evolution with the effects of Ponto Frio acquisition
42
Q&A
Sustainability
Opportunities
Strategic Priorities and Outlook
Macroeconomic Environment
Company Overview
Retail Market
Financial Information

“Back to Basics”Strategy
Sales are a consequence of successful work on these pillars
Focus on Sales Pillars
Assortment Pricing CommunicationCustomerService
44

RE-ENFORCE ITS FOUNDATIONS TO SUSTAIN GROWTH WITH PROFITABILITYNew Management ModelSimplicity, focus, agility, integration and empowerment
Multi-disciplinary groupsPursuit of efficiency
Strengthening regional commercial officesClusterization
Aggressive variable compensationEBITDA based bonus driven by collective and individual goals
Solid structureStrengthening cash position before the crisis and strong investments in IT & LogisticsConservative Financial Policy
45

2008 2009e
New Stores 156 280
Sites 95 154
Renovations 143 154
Infra-structure 109 167
GPA 503 755
CAPEX (R$ million)
46

MEDIUM TERM OUTLOOKS
• Maintain Financial and economic health
• Scale gains increasing productivity of existing stores
• Market Share Growth
• Expansion in consolidated formats
47

Q&A
Sustainability
Opportunities
Strategic Priorities and Outlook
Macroeconomic Environment
Company Overview
Retail Market
Financial Information

2008 164% of sales growthThe biggest among the players
2005 2012 E2009 E
1.0%
6.2%
9.3%
Market Share
E-COMMERCER$ 2 billion sales in 2010
Consolidated position as Brazil’s
second larger e-Commerce player
High growth potential
Extra.com
Ponto Frio.com
Ponto Frio wholesale
CasasBahia.com
49

FIC
+R$ 10 billion credit approved for customers
8 million cardholders
12% participation of total sales
R$ 2,8 billion receivables
Itaú had 24 million clients by the end of 2008
R$ 600 millionto GPA from the new agreement
Itaú + GPA believe this could be one of the
largest financing companies in Brazil
INVESTCRED +
50

REAL ESTATE
51
TargetTo make the maximum use of our
real estate assets linked with our
retail projects in Grupo Pão de
Açúcar expansion plan
Businesses19 businesses opportunities
identified, 3 of which are being
studied in further detail
“Sweat the asset” Program
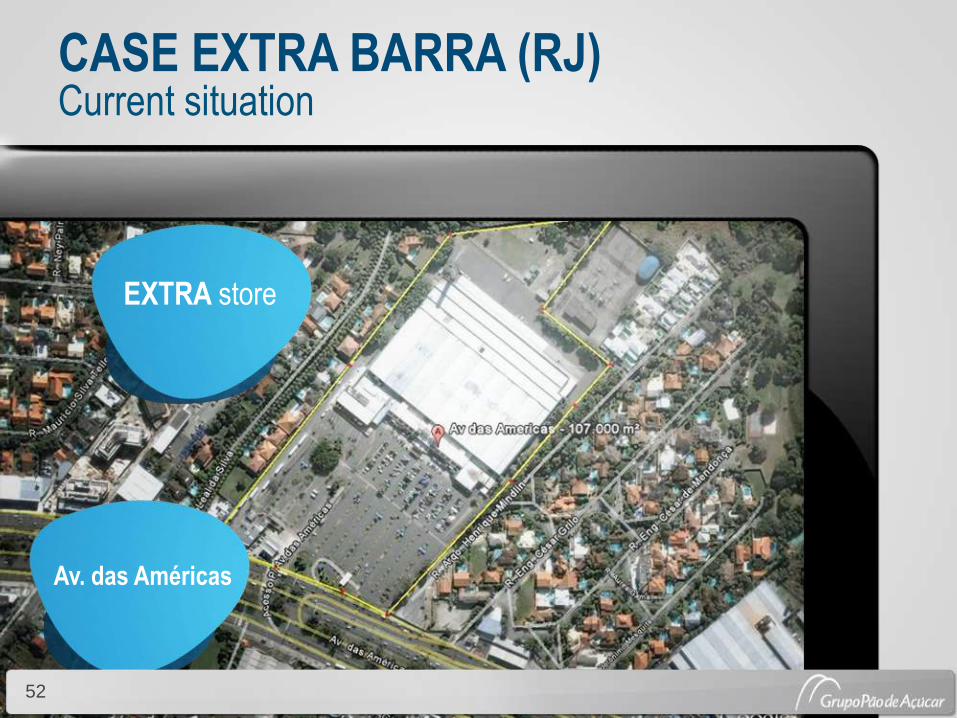
CASE EXTRA BARRA (RJ)Current situation
EXTRA store
Av. das Américas
52
53
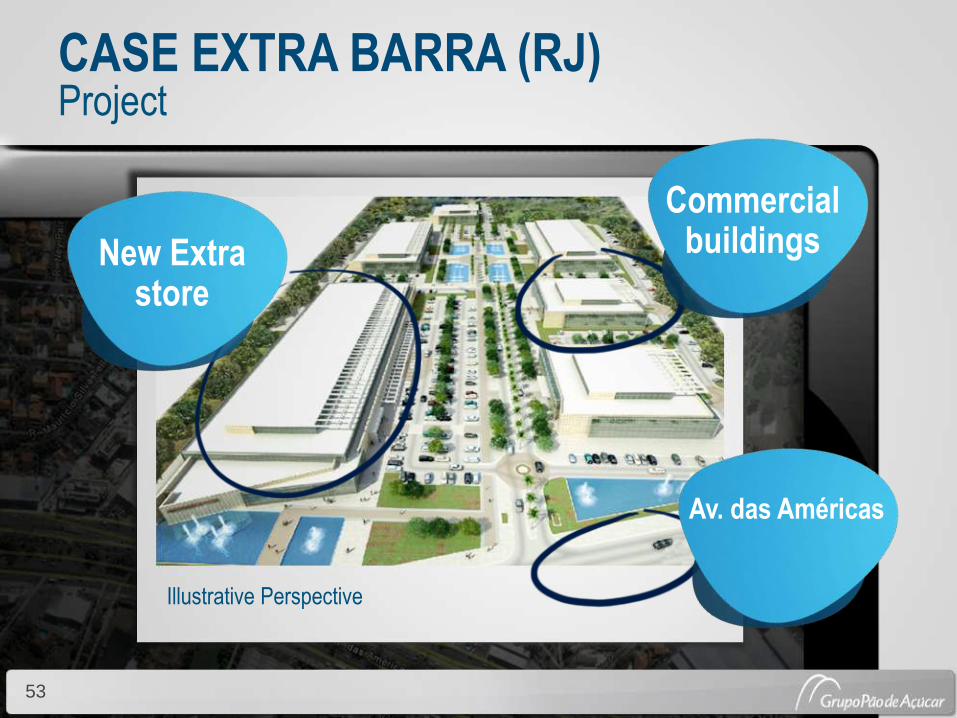
New Extrastore
Commercialbuildings
Av. das Américas
CASE EXTRA BARRA (RJ)Project
53
Illustrative Perspective

Q&A
Sustainability
Opportunities
Strategic Priorities and Outlook
Macroeconomic Environment
Company Overview
Retail Market
Financial Information

55
SUSTAINABILITY
Adding Quality of Life
Marathon Relay
Pão de Açúcar Kids
Race
Alimenta Bem Program
Sponsoring athletes
Share with the community
Collecting Donations
NATA
Orchestra
Educational Programs
Multiply consciousness in consumption
Reusable bags
Green Box
Caras do Brasil
Recycling Station
Carbon emission

Q & A
56

ANALYST DAY