Embed Size (px)
Citation preview

University of Padova
Department of Information Engineering
Ph.D. School in Information Engineering
Information Science and Technology
XXVI series
Ph.D. Thesis
Analysis and applicationof nonlinear amplication eectsin single-mode optical bers
Fabrizio Chiarello
School DirectorChiar.mo Prof. Matteo Bertocco
Course CoordinatorProf. Carlo Ferrari
SupervisorDott. Luca Palmieri
January 2014


To anyone who can see the worldthrough the eyes of a child.
Toanyonewhotriestoseetheworldthroughtheeyesofachild.
through the eyes of a child.To anyone who would like to see the world


Acknowledgements
¿is thesis is the summary of three years of study, research and work spent toward thedegree of Philosophiæ Doctor.
It’s not an easy task to look backward over these three years to try to enumerate all thepeople that have contributed, directly or indirectly, to advance me toward the target. Evenmore dicult is to give them all an appropriate space on this page. I can only do the mybest.
First of all, I would like to thankmy supervisorDr. Luca Palmieri, to whom I am deeplygrateful for his invaluable support, guidance, and mentoring during these three years.He patiently lead me to think coherently and scientically, spurring me to improve myexperimental and theoretical skills. I thank Prof. Marco Santagiustina who also denitelydispensed me invaluable advice on topics unknown to me. I wish also to thank the other,current and past, members of the ‘‘Photonics and Electromagnetics Group’’, starting withthe head Prof. Andrea Galtarossa, for providing me the opportunity to join and to stayin the group. With equal weights and measures, and in all the permutations, I thank theset Dr. Luca Schenato, Dr. Leonora Ursini, Dr. Elena Autizi for the competence, discus-sions, suggestions, patience and friendship; and a special mention goes to Dr. SourabhRoy for helpful discussions.
I’m very grateful to Prof. Magnus Karlsson for hosting me for six beautiful monthsat the ‘‘Photonics Laboratory’’ of the Department of Microtecnology and Nanoscienceof the Chalmers University of Technology in Göteborg (Sweden). I would like to thankthe head of the group, Prof. Peter Andrekson, and all the members, in particular Dr. AlešKumpera, Clemens Krückel and Abel Lorences Riesgo.
I thank Davide Zordan, Marco Mezzavilla, Dr. Paolo Baracca, Daniele Munaretto andMatteo Canale for invaluable technical and playful discussions.
¿anks to Simone Piccirilli, Dr. Roberto Corvaja, Dr. Alberto Ferrario, Dr. DanieleFontanari and Dr. Silvia Mittenpergher for making my living in Padova more enjoyable.
I thank my parents for their support.Finally, I would like to dedicate this thesis to Valentina, for her ‘‘nonlinear and stochas-
tic’’ patience during these last months, and to Emma, Enea and Isaac for denitely seeingthe world through the eyes of a child.
Padova, Tuesday 28th January, 2014
Fabrizio
v


Abstract
¿is thesis focuses on all-optical signal generation and processing through nonlinearamplication phenomena in single-mode bers.
¿ree dierent nonlinear ber optical oscillators are investigated and experimentallydemonstrated. A continuous-wave pump for ber Raman ampliers, developed with thegoal of achieving high degree of polarization, tunability and suppression of stimulatedBrillouin scattering, is presented, discussed and used to achieve nonlinear polarizationattraction. A fast and widely tunable ber optical oscillator based on stimulated Ramanscattering and on broad- and narrow-band ber optical parametric amplication, andexploiting the time-dispersion-tuning technique, is demonstrated and characterized. Eachnonlinear eect dominates in a dierent spectral region, so that the ber optical oscillatorachieves a tuning range of 160 nm. ¿rough the same time-dispersion-tuning method, afast tunable optical frequency comb, based on cascaded four-wave mixing, is obtained byusing a single pump, avoiding the limitations in spectral purity and frequency and phasestability given by double pump systems.
Finally, the control of the state of polarization and of the degree of polarization throughnonlinear polarization attraction in counter-propagating ber Raman ampliers in stan-dard, randomly birefringent, single-mode bers is studied, analyzed and characterized.¿e analysis, including the eects of pump depletion, nonlinear polarization rotationand orthogonal Raman gain, shows that counter-propagating ber Raman ampliers areeective in attracting the signal toward a predetermined state of polarization settled bythe pump input state of polarization. Moreover, the importance of the role of pump deple-tion in achieving signal repolarization in bers with moderately-high polarization-modedispersion is discussed. ¿e performances and the limits of repolarization eciency aredetermined, leading to a quantitative relationship between the degree of polarization andthe gain of the ber Raman amplier, which is then conrmed to represent an upperbound on the maximum achievable degree of polarization.
vii


Sommario
Questa tesi è focalizzata sulla generazione e sull’elaborazione completamente ottiche disegnali attraverso fenomeni di amplicazione non lineare in bre ottiche a singolo modo.
Tre diversi oscillatori non lineari in bra ottica sono investigati e dimostrati speri-mentalmente. Una pompa ad onda continua per amplicatori Raman in bra, sviluppatacon l’obiettivo di ottenere un alto grado di polarizzazione, sintonizzabilità e soppressionedell’eetto Brillouin, è presentata, discussa e utilizzata al ne di ottenere attrazione dipolarizzazione non lineare. Un oscillatore in bra ottica con sintonia veloce su un’ampiabanda basato sugli eetti di amplicazione Raman e di amplicazione parametrica a bandastretta e a banda larga, che sfrutta la tecnica di sintonia mediante dispersione temporale(time-dispersion tuning), è dimostrato e caratterizzato. Ciascuno degli eetti non linearidomina in una diversa regione spettrale, cosicché l’oscillatore raggiunge un intervallo disintonia di 160 nm. Attraverso lo stesso metodo di sintonia mediante dispersione tempora-le, un comb ottico in bra con sintonia veloce, basato sull’eetto di miscelazione a quattroonde a cascata, è ottenuto usando una singola pompa, evitando così i limiti di purezzaspettrale e di stabilità di frequenza e di fase dei sistemi a doppia pompa.
Inne, il controllo dello stato e del grado di polarizzazione, attraverso l’attrazione dipolarizzazione non lineare in amplicatori Raman in bra ottica standard con birifran-genza aleatoria, è studiato, analizzato e caratterizzato. L’analisi, che include gli eetti disvuotamento della pompa, della rotazione non lineare di polarizzazione e di guadagnoRaman ortogonale, mostra che gli amplicatori Raman contro-propaganti sono ecacinell’attrarre il segnale verso uno stato di polarizzazione predeterminato e imposto dallostato di polarizzazione di ingresso della pompa. Viene inoltre discussa l’importanza delruolo dello svuotamento della pompa nell’ottenere la ripolarizzazione del segnale in brecon dispersione dei modi di polarizzazione moderatamente alta. Le prestazioni e i limitidell’ecienza di ripolarizzazione vengono determinati portando ad una relazione quanti-tativa tra il grado di polarizzazione e il guadagno dell’amplicatore Raman, relazione cherappresenta un limite superiore sul massimo grado di polarizzazione raggiungibile.
ix


Contents
Abstract vii
Sommario ix
Contents xi
List of Figures xiii
List of Acronyms xv
1 Introduction 1
1.1 Nonlinear ber optical oscillators . . . . . . . . . . . . . . . . . . . . . . . . 21.2 Nonlinear polarization attraction in ber Raman ampliers . . . . . . . . 21.3 Outline of the thesis . . . . . . . . . . . . . . . . . . . . . . . . . . . . . . . . 31.4 List of publications . . . . . . . . . . . . . . . . . . . . . . . . . . . . . . . . 41.5 Acknowledgements . . . . . . . . . . . . . . . . . . . . . . . . . . . . . . . . 5
2 Nonlinear amplication processes in optical bers 7
2.1 Origin of nonlinearities in optical bers . . . . . . . . . . . . . . . . . . . . 82.2 Stimulated Raman scattering . . . . . . . . . . . . . . . . . . . . . . . . . . 92.3 Parametric amplication in optical bers . . . . . . . . . . . . . . . . . . . 11
2.3.1 Broad-band ber optical parametric amplication . . . . . . . . . 132.3.2 Narrow-band ber optical parametric amplication . . . . . . . . 15
3 Nonlinear ber optical oscillators 17
3.1 Continuous wave pump for ber Raman ampliers . . . . . . . . . . . . . 173.1.1 Stimulated Brillouin scattering . . . . . . . . . . . . . . . . . . . . 183.1.2 Suppression of stimulated Brillouin scattering . . . . . . . . . . . 19
3.2 ¿e time-dispersion-tuning technique . . . . . . . . . . . . . . . . . . . . . 213.3 Widely tunable oscillator based on multiple processes . . . . . . . . . . . . 24
3.3.1 Experimental setup . . . . . . . . . . . . . . . . . . . . . . . . . . . 253.3.2 Amplication regions . . . . . . . . . . . . . . . . . . . . . . . . . . 253.3.3 Tuning and eciency . . . . . . . . . . . . . . . . . . . . . . . . . . 27
3.4 Generation of fast tunable optical frequency combs . . . . . . . . . . . . . 303.4.1 Optical frequency combs . . . . . . . . . . . . . . . . . . . . . . . . 303.4.2 Results . . . . . . . . . . . . . . . . . . . . . . . . . . . . . . . . . . . 32
xi

3.5 Conclusions . . . . . . . . . . . . . . . . . . . . . . . . . . . . . . . . . . . . 34
4 Nonlinear polarization attraction in ber Raman ampliers 35
4.1 Introduction . . . . . . . . . . . . . . . . . . . . . . . . . . . . . . . . . . . . 364.2 Vector model of stimulated Raman scattering . . . . . . . . . . . . . . . . . 374.3 Analysis and characterization . . . . . . . . . . . . . . . . . . . . . . . . . . 39
4.3.1 ¿e role of pump depletion . . . . . . . . . . . . . . . . . . . . . . . 404.3.2 Eects of polarization-mode dispersion . . . . . . . . . . . . . . . 454.3.3 Performance and limits . . . . . . . . . . . . . . . . . . . . . . . . . 47
4.4 Experimental characterization . . . . . . . . . . . . . . . . . . . . . . . . . . 514.4.1 Experimental setup . . . . . . . . . . . . . . . . . . . . . . . . . . . 514.4.2 Results . . . . . . . . . . . . . . . . . . . . . . . . . . . . . . . . . . . 52
4.5 Conclusions . . . . . . . . . . . . . . . . . . . . . . . . . . . . . . . . . . . . 55
5 Conclusions 57
5.1 Future research . . . . . . . . . . . . . . . . . . . . . . . . . . . . . . . . . . 58
Appendices 61
A ¿e Stokes representation of light 61
A.1 ¿e degree of polarization . . . . . . . . . . . . . . . . . . . . . . . . . . . . 63
B Measurement of the Stokes parameters 65
C Emulation of depolarized light 69
D Polarization-mode dispersion 75
D.1 ¿e random modulus model . . . . . . . . . . . . . . . . . . . . . . . . . . . 75
E Numerical integration of boundary value problems 79
E.1 ¿e Runge-Kutta method . . . . . . . . . . . . . . . . . . . . . . . . . . . . 79E.2 Solution of boundary value problems . . . . . . . . . . . . . . . . . . . . . 80
List of publications 83
Peer-reviewed international journals . . . . . . . . . . . . . . . . . . . . . . . . . 83Conference proceedings . . . . . . . . . . . . . . . . . . . . . . . . . . . . . . . . . 83
References 85
xii

List of Figures
2.1 Raman gain coecient of silica bers. . . . . . . . . . . . . . . . . . . . . . 10
2.2 Amplied spontaneous emission of a 500m long DSF for dierent pumppowers in the anomalous dispersion regime. . . . . . . . . . . . . . . . . . 14
2.3 Amplied spontaneous emission of a 500m long DSF for dierent pumpwavelengths in the anomalous dispersion regime. . . . . . . . . . . . . . . 15
2.4 Amplied spontaneous emission of a 500m long DSF for dierent pumppowers in the normal dispersion regime. . . . . . . . . . . . . . . . . . . . 16
2.5 Amplied spontaneous emission of a 500m long DSF for dierent pumpwavelengths in the normal dispersion regime. . . . . . . . . . . . . . . . . 16
3.1 Measured transmitted and backscattered powers as functions of the inputpower, for a 25 km long NZDSF. . . . . . . . . . . . . . . . . . . . . . . . . 19
3.2 Experimental setup of the continuous-wave (CW) ber ring laser. . . . . 20
3.3 Spectrum generated by the CW ber ring laser. . . . . . . . . . . . . . . . 21
3.4 Measured signal gain in a counter-propagating FRA. . . . . . . . . . . . . 22
3.5 Experimental setup of the widely tunable ber laser. . . . . . . . . . . . . . 24
3.6 Amplied spontaneous emission of a 500m long DSF obtained by pump-ing in the normal and in the anomalous dispersion regime. . . . . . . . . 26
3.7 Spectra of the widely tunable ber laser in the three dierent amplicationregimes. . . . . . . . . . . . . . . . . . . . . . . . . . . . . . . . . . . . . . . . 27
3.8 Tuning characteristic of the widely tunable ber laser as a function of theshi of the pump pulse repetition rate. . . . . . . . . . . . . . . . . . . . . . 28
3.9 Eciency of the widely tunable ber laser as a function of the outputwavelength. . . . . . . . . . . . . . . . . . . . . . . . . . . . . . . . . . . . . . 29
3.10 Spectra of the widely tunable ber laser. . . . . . . . . . . . . . . . . . . . . 30
3.11 Cascaded four-wave mixing for OFC generation. . . . . . . . . . . . . . . . 31
3.12 Cascaded four-wave mixing establishment obtained by pumping in theBBFOPA regime. . . . . . . . . . . . . . . . . . . . . . . . . . . . . . . . . . 32
3.13 Spectra of the tunable OFC for two dierent synchronously pumpedwavelengths. . . . . . . . . . . . . . . . . . . . . . . . . . . . . . . . . . . . . 33
4.1 Parallel and orthogonal Raman gain coecients of silica bers. . . . . . . 38
4.2 Poincaré spheres of the signal SOPs along one ber realization. . . . . . . 41
4.3 Evolution of the gain and of the DOP of the signal along the ber for onebirefringence realization. . . . . . . . . . . . . . . . . . . . . . . . . . . . . . 42
xiii

4.4 Mean signal output DOP as a function of the PMD coecient. . . . . . . 434.5 Mean signal output DOP and gain as a function of the ber length. . . . . 444.6 Mean signal gain as a function of the ber length. . . . . . . . . . . . . . . 464.7 Mean signal output DOP as a function of the PMD coecient for three
dierent pump input SOPs. . . . . . . . . . . . . . . . . . . . . . . . . . . . 474.8 Mean signal-pump angle as a function of the ber length. . . . . . . . . . 484.9 Mean signal degree of polarization (DOP) as a function of the gain. . . . 494.10 Coecient Γ as a function of the PMD coecient (PMDc). . . . . . . . . 504.11 Experimental setup for the analysis of nonlinear polarization attraction
in ber Raman ampliers. . . . . . . . . . . . . . . . . . . . . . . . . . . . . 514.12 Measured DOP as a function of the gain for dierent pump and signal
input powers, and for four dierent link lengths. . . . . . . . . . . . . . . . 534.13 Measured DOP as a function of the gain for dierent pump input powers
and link lengths, and for four dierent signal input powers. . . . . . . . . 54
B.1 Illustration of the rotating quarter-wave plate (QWP) polarimeter. . . . . 66
C.1 Illustration of the polarization scrambler. . . . . . . . . . . . . . . . . . . . 70C.2 Evolution of the scrambled state of polarization (SOP). . . . . . . . . . . . 71C.3 Measured DOPs for various observation times. . . . . . . . . . . . . . . . . 72C.4 Mean and variance of the scrambled SOP as a function of the observation
time. . . . . . . . . . . . . . . . . . . . . . . . . . . . . . . . . . . . . . . . . . 72
D.1 Illustration of the random modulus model (RMM). . . . . . . . . . . . . . 76
xiv

List of Acronyms
ASE amplied spontaneous emission.
BBFOPA broad-band ber optical parametric amplication.BPF band pass lter.BVP boundary value problem.
CFWM cascaded four-wave mixing.CW continuous-wave.
DCF dispersion-compensating ber.DGD dierential group delay.DOP degree of polarization.DSF dispersion-shi ed ber.DWDM dense wavelength-division-multiplexing.
ECL external cavity laser.EDF erbium-doped ber.EDFA erbium-doped ber amplier.EOM electro-optic modulator.EPG electrical pulse generator.
FOPA ber optical parametric amplication.FOPO ber optical parametric oscillator.FPC ber polarization controller.FRA ber Raman amplier.FSR free spectral range.FUT ber under test.FWM four-wave mixing.
GVD group velocity dispersion.
HNLF highly nonlinear ber.
IVP initial value problem.
xv

LP linear polarizer.
NBFOPA narrow-band ber optical parametric amplica-tion.
NPA nonlinear polarization attraction.NPR nonlinear polarization rotation.NZDSF non-zero dispersion-shi ed ber.
OCi optical circulator.OCo optical coupler.ODE ordinary dierential equation.OFC optical frequency comb.OFDM orthogonal frequency division multiplexing.OI optical isolator.OSA optical spectrum analyzer.
PDG polarization-dependent gain.PDL polarization-dependent loss.PMD polarization-mode dispersion.PMDc PMD coecient.PRBS pseudo-random binary sequence.PS-FOPA phase-sensitive ber optical parametric amplica-
tion.
QWP quarter-wave plate.
RIN relative intensity noise.RK Runge-Kutta.RK4 fourth-order Runge-Kutta.RMM random modulus model.RMS root mean square.RP Raman polarizer.
SBS stimulated Brillouin scattering.SMF single-mode ber.SOP state of polarization.SPM self-phase modulation.SRS stimulated Raman scattering.
TDF thulium-doped ber.TDT time-dispersion-tuning.
VOA variable optical attenuator.
WDM wavelength-division-multiplexing.
XPM cross-phase modulation.
xvi

ZDW zero-dispersion wavelength.
xvii


Chapter1Introduction
a2 + b2 = c2
Pythagoras
6th century BCE – 5th century BCE
Since their advent¹ in the 70s, optical bers have been progressively introduced inour daily life becoming one of the most signicant achievement of the modern era.Optical bers constitute the backbone of the world communication infrastructure,
and their ability to eciently guide light have spurred their use also in dierent elds suchas medical sciences, industry and structural health monitoring. Moreover, in recent yearsconsiderable research eorts have been focusing on the nonlinear interactions betweenoptical elds propagating in optical bers. Spawned by the third-order susceptibility,commonly known as the χ(3)-nonlinearity, the nonlinear eects give rise to elastic, such asfour-wave mixing (FWM) and ber optical parametric amplication (FOPA), and inelasticscattering phenomena, such as stimulated Brillouin scattering (SBS) and stimulated Ramanscattering (SRS). ¿e energy exchange between dierent signals mediated by the χ(3)-nonlinearity is apt to be used as a nonlinear amplication mechanism, and its time scaleon the order of the femtosecond enables the development of new classes of all-opticaldevices for virtually instantaneous signal generation and processing.
¿is thesis focuses on all-optical signal generation and processing through nonlinearamplication phenomena in single-mode bers (SMFs), and is divided into two majortopics. ¿e rst part of the thesis is devoted to nonlinear ber optical oscillators, and threedierent optical sources are discussed and experimentally demonstrated: a continuous-wave (CW), highly polarized, tunable pump for application in ber Raman ampliers(FRAs); a widely tunable ber optical oscillator based on SRS and FOPA; and a fasttunable optical frequency comb (OFC) realized exploiting cascaded four-wave mixing(CFWM). ¿e second part is dedicated to nonlinear polarization attraction (NPA) incounter-propagating FRAs for the control of the state of polarization (SOP) of signals:purely Raman-based nonlinear repolarization is studied and experimentally demonstrated,and the limits of repolarization eciency are determined.
¹¿e research in optical bers started in 1966 with the study of the loss mechanisms of glasses by Kaoand Hockham [1], and with the realization of low-loss optical bers in the following years [2], [3]. ¿e workof Charles K. Kao was worth of the Nobel Prize, awarded in 2009.
1

1. INTRODUCTION
1.1 Nonlinear ber optical oscillators
¿e rst part of the thesis is devoted to all-ber lasers, which, over the past two decades,have been the subject of a considerable amount of research owing to the several potentialadvantages they present with respect to bulk lasers, among which the following main onesare worth being mentioned:
• the lack of critical components such as mirrors, crystals or prisms, which makesthem very attractive due to the low complexity and high ruggedness;
• the ber-based gain media, which enable inherently single-mode operations, highcoupling eciency and superior beam quality especially for high average powers;
• the unavailability of good bulk crystals or glasses for unusual spectral regions,particularly the near infrared, where lasing can be eciently achieved with ber-based systems;
• the achievable high-speed and broad-range of tuning, permitted by the larger band-width of bers.
Fiber-lasers are conveniently used in industry and in medical sciences, where highpower and high beam quality is demanded, e.g. for micro-welding and micro-cutting.On the other hand, in applications like optical coherence tomography [4], spectroscopy,distributed remote sensing [5], and dense wavelength-division-multiplexing [6], charac-teristics as high-speed and wide-range wavelength tuning are mandatory requirements. Ifconventional lasers have fundamental limitations on the range and speed of tuning dueto the presence of mechanically controlled optical lters and gratings, all-ber lasers canovercome such limitations.
Furthermore, OFCs represent another key application in communication [7], signalprocessing [8], metrology [9], [10] and spectroscopy [10], [11] that has been gatheringconspicuous attentions. Some of the limits of conventional OFC generators, such asthe xed frequency spacing of monolithic cavities or the slowness in tuning realizedthrough thermal eects [12] or mechanical stages [13], can be overcome in optical bers,for instance through CFWM, achieving better and faster OFCs tunability. However, OFCsrealized in CFWM resonators are generally achieved via double pump systems [14], [15],with limitations in spectral purity and frequency and phase stability [16] that need to beaddressed.
1.2 Nonlinear polarization attraction in ber Raman ampli-
ers
¿e second part of the thesis investigates nonlinear polarization attraction (NPA) incounter-propagating FRAs for the control of the SOP.
Polarization is an important degree of freedom of light which is being increasinglyexploited in the elds of optical communications and sensing systems, among others. Overthe past few years, all-optical processing of polarization has been the subject of considerableresearch eorts, giving rise to new devices able, for example, to perform polarization
2

1.3. OUTLINE OF THE THESIS
modulation and regeneration, or to control the SOP and the degree of polarization (DOP).For instance, controlling the DOP permits to attain signal depolarization or repolarization.
Signal repolarization can be obtained by using classical bulk polarizers, which operateby projecting the SOPs over a predetermined direction. However, such projection processposes physical limitations on the achievable eciency. Over the past few years, NPAhas been proposed as an eective all-optical method to control the SOP. Fundamentally,NPA is a process in which the SOP is attracted, rather than projected, to a predetermineddirection, therefore increasing the limits on the eciency.
¿e rst all-optical repolarizer, demonstrated in 2000 by Heebner et al. [17] and whichwas based on the photo-refractive eect, had severe limitations due to the low responsetime of the mediating material. Only recently, nonlinear amplication processes in SMFshave been successfully exploited to obtain NPA[P.2], [18]–[45], [C.2], [P.3]. Such processeshave response time in the order of femtoseconds, enabling virtually instantaneous controlof the SOP.
Among the others, the nonlinear Raman amplication process has been very recentlydemonstrated as an eective method to obtain both amplication and NPA in standardtelecommunications SMFs [P.2], [18]–[30], [C.2], [P.3]. One of the main advantages of theSRS process is certainly its amplication band of more than 7 THz [25], together with thepossibility of shi ing such wide spectral region by only controlling the wavelength of thepump [46], enabling therefore the use of NPA in unconventional bands. Another majorbenet of SRS is the possibility of being used in existing links.
If on one hand, it has been very recently demonstrated the possibility to apply Raman-based NPA to realize signal repolarization in integrated silicon devices and in wavelength-division-multiplexing systems, or to enhance the performances of FRAs, on the other handthe performances and the limits of SRS-based NPA have not been yet fully acquainted andneed to be addressed.
1.3 Outline of the thesis
¿is thesis is structured as follows.
Chapter 2 provides a brief overview about the origin of nonlinear phenomena in opticalbers. ¿e focus is given to the amplication properties of FOPA and of SRS, whose scalartheories are concisely discussed.
Chapter 3 presents the topic of all-ber optical sources through nonlinear amplicationprocesses, and three dierent optical sources are demonstrated and discussed. ¿e rstsource is a highly polarized and tunable CW pump for application in FRAs, aimed atpreventing SBS depletion. ¿en, a widely tunable ber optical oscillator based on FOPAand stimulated Raman scattering is described and characterized. ¿e tuning, enabledthrough the time-dispersion-tuning (TDT) technique, spans a range of 160 nm and has anestimated sweep speed of 0.4 nm µs−1. Finally, through the same technique a fast tunableoptical frequency comb is realized exploiting cascaded four-wavemixing in the broad-bandber optical parametric amplication regime.
In Chapter 4 the topic of NPA in counter-propagating FRAs in standard, randomlybirefringent, SMFs is presented. A er a short review of a vector model for SRS, a full-scalenumerical analysis and statistical evaluations of NPA in counter-propagating FRAs inrandomly birefringent SMFs are presented. ¿e analysis includes the eects of pump
3

1. INTRODUCTION
depletion, nonlinear polarization rotation (NPR) and orthogonal Raman gain, and itshows that counter-propagating FRAs are eective in attracting the signal toward a prede-termined SOP settled by the pump input SOP, and that pump depletion plays an importantrole in achieving signal repolarization in bers with moderately-high polarization-modedispersion (PMD). Remarkably, it is predicted the existence of a quantitative relation-ship between the gain and the maximum DOP achieved by the signal in the amplier.Finally, such relationship, which approximates both the performances and the limitationsof the attraction eciency, is experimentally validated, conrming that it represents anupper-bound on the maximum achievable DOP.
Finally, the closing chapter, Chapter 5, recapitulates the main ndings of the thesis,and discusses potential applications and future research activities.
1.4 List of publications
¿e thesis is based on the following papers published in international peer-reviewedjournals and conference proceedings:
[P.1] F.Chiarello, L. Palmieri, A.Galtarossa, andM. Santagiustina, “Widely time-dispersion-tuned ber optical oscillator and frequency comb based on multiple nonlinear pro-cesses”, Optics Letters, vol. 38, no. 22, pp. 4621–4624, Nov. 2013. doi: 10.1364/OL.38.004621
[C.1] F. Chiarello, L. Palmieri, A. Galtarossa, and M. Santagiustina, “Nonlinear multi-process ber laser widely tunable through time-dispersion tuning (invited)”, inFotonica 2013, 15°ConvegnoNazionale delle Tecnologie Fotoniche, (May 21–23, 2013),Milano, Italy, 2013, p. C4.1
[P.2] F. Chiarello, L. Palmieri, M. Santagiustina, R. Gamatham, andA. Galtarossa, “Exper-imental characterization of the counter-propagating Raman polarization attraction”,Optics Express, vol. 20, no. 23, pp. 26 050–26 055, Nov. 2012. doi: 10.1364/OE.20.026050
[P.3] F. Chiarello, L. Ursini, L. Palmieri, and M. Santagiustina, “Polarization attractionin counterpropagating ber Raman ampliers”, Photonics Technology Letters, vol.23, no. 20, pp. 1457–1459, Oct. 15, 2011. doi: 10.1109/LPT.2011.2163061
[C.2] F.Chiarello, L. Ursini, L. Palmieri, M. Santagiustina, A.W. R. Leitch, andM.Gugliel-mucci, “Polarization attraction in counter-propagating ber Raman ampliers”, inFotonica 2011, 13° Convegno Nazionale delle Tecnologie Fotoniche, (May 9–11, 2011),Genova, Italy, 2011, p. C4.3
¿e following are other publications which are out of the scope of this thesis.
[C.3] M. Santagiustina, L. Ursini, A. Galtarossa, F. Chiarello, L. Palmieri, C. G. Someda,L.¿évenaz, and A. Leitch, “Microwave photonic notch lter based on dynamic Bril-louin gratings generated by PRBS signals”, in Fotonica 2012, 14°ConvegnoNazionaledelle Tecnologie Fotoniche, (May 15–17, 2012), Firenze, Italy, 2012, B3.4
4

1.5. ACKNOWLEDGEMENTS
[C.4] L. Schenato, G. Marcato, A. Pasuto, L. Palmieri, F. Chiarello, A. Galtarossa, G.Gruca, T. van de Watering, and D. Iannuzzi, “Experimental analysis of ber opticsensor for detection of precursory acoustic signals in rockfall events”, in Fotonica2012, 14° Convegno Nazionale delle Tecnologie Fotoniche, (May 15–17, 2012), Firenze,Italy, 2012, B6.5
[C.5] M. Santagiustina, L. Ursini, L. Palmieri, F. Chiarello, and M. Bosiljevac, “DynamicBrillouin gratings permanently induced by chaotic signals for sensing applications”,inFotonica 2011, 13°ConvegnoNazionale delle Tecnologie Fotoniche, (May 9–11, 2011),Genova, Italy, 2011, B6.6
[C.6] F. Chiarello, M. Santagiustina, and L. Ursini, “Securing free space optics communi-cations through optical chaos”, in Access Networks and In-house Communications,(Jun. 12–14, 2011), Toronto, Canada: OSA, 2011, ATuC5
[P.4] F. Chiarello, L. Ursini, and M. Santagiustina, “Securing wireless infrared communi-cations through optical chaos”, Photonics Technology Letters, vol. 23, no. 9, pp. 564–566, May 1, 2011. doi: 10.1109/LPT.2011.2114334
[C.7] L. Ursini, F. Chiarello, M. Santagiustina, and L. Schenato, “Comunicazioni sicurein spazio libero su portante ottica caotica”, in Fotonica 2010, 12°ConvegnoNazionaledelle Tecnologie Fotoniche, (May 25–27, 2010), Pisa, Italy, 2010, P1.5
1.5 Acknowledgements
¿e following authorities and projects are acknowledged for nancial support:
• the National Inter-University Consortium for Telecommunications (CNIT);
• theUniversity of Padova, project ‘‘Near InfraredNonlinear FiberOscillators’’ (NINFO);
• the ItalianMinistry of Instruction, University and Research (MIUR), project ‘‘Linearand nonlinear polarization sensitive eects in single mode birefringent opticalbers’’ (POLARIZON).
5


Chapter2Nonlinear amplification
processes in optical fibers
K0 − K1 =L
V 2
v2
2
Albert Einstein
1879 – 1955
Nonlinear optics phenomena arise from the saturation of the medium in responseto strong electromagnetic elds. Consequently, nonlinear eects on optical wavescan manifest in any type of media, provided that the energy is suciently high.
Even the vacuum is predicted to become nonlinear for electromagnetic elds with powerabove the Schwinger limit [47].
In optical bers, nonlinear eects are enhanced by the relatively small area in which theeld is conned. In telecommunication, nonlinearities are detrimental as they pose seriouslimits on the utilization of the optical ber to convey information. However, nonlinearitiescan be used to realize new classes of all-optical devices able to generate and manipulatelight.
Of the broad range of nonlinear eects in optical bers, this thesis focus on the am-plication properties of ber optical parametric amplication (FOPA) and of stimulatedRaman scattering (SRS). FOPA and SRS are used in Chapter 3 to realize all-ber oscilla-tors, whereas in Chapter 4 SRS is used to control the polarization of light. ¿is chapterprovides a brief overview of those two amplication processes. Section 2.1 provides ashort introduction on the origin of the nonlinear phenomena in optical bers. ¿e scalartheories of SRS and FOPA are briey reviewed in Section 2.2 and Section 2.3, respectively.
More in-depth and comprehensive treatises of optical elds in nonlinear media canbe found in book such as Sauter [48] or Boyd [49], whereas an exhaustive analysis anddiscussion of nonlinearities in optical bers can be found in Agrawal [50]. Regardingthe two specic processes used in this thesis, Marhic [51] deeply covers the theory andapplications of FOPAs, whereas Headley and Agrawal [52] provides a broad coverageof SRS.
7

2. NONLINEAR AMPLIFICATION PROCESSES IN OPTICAL FIBERS
2.1 Origin of nonlinearities in optical bers
¿e propagation of the electromagnetic eld inside a medium other than vacuum isdescribed by the Maxwell equations through the following constitutive relation betweenthe electric displacement D and the electric eld E [48]:
D = ε0E + P , (2.1)
where ε0 is the electric permittivity of the vacuum and P is the polarization vector. Ingeneral P is a nonlinear function of E and it can be expanded as [50]:
P(E) = ε0(χ(1)E + χ(2)E2+ χ(3)E3
+ . . .) , (2.2)
where χ(i) is the i-th order susceptibility which is in general a tensor of rank i+1. For silicaoptical bers χ(2) is zero because of the symmetry of the SiO2 molecule; it can howevermanifest in asymmetric crystals like lithium-niobate (LiNbO3). Silica optical bers presentthe third-order susceptibility χ(3), also commonly called the χ(3)-nonlinearity.
¿e χ(3)-nonlinearity gives rise to nonlinear phenomena such as the Kerr eect, stim-ulated Brillouin scattering (SBS) and SRS.
SBS and SRS involve scattering of photons with the molecular structure of the ber,resulting in loss of energy due to the creation of phonons (optical phonons¹ in the caseof SRS and acoustic phonons in the case of SBS). From a practical point of view, both SBSand SRS manifest as spontaneous processes in consequence of a pump wave with powerabove a certain threshold given by [53]:
Pth ≈ CkAe
дLe
, (2.3)
where д is the gain coecient of the process and where Ae and Le are, respectively,the eective area² and the eective length³. ¿e coecient C depends on the particularprocess and on the particular conguration: for SBS in silica bers C = 21 [53], whereas forSRS it can be C = 16 or C = 20 depending if the co-propagating or the counter-propagatingconguration is considered [53]. ¿e coecient k lays in the range 1 ≤ k ≤ 2 and accountsfor the polarization properties. Under proper conditions, SBS and SRS became stimulatedprocesses when another wave, called Stokes wave, is present. In such case energy istransferred from the pump to the Stokes wave, eventually resulting in its amplication.
¹¿e term ‘‘optical’’ refer to the frequency of the electromagnetic wave necessary to excite the vibrations.²¿e eective area is dened as [50]:
Aeff =
(∫∫∞−∞∣F(x , y)∣2 dx dy)2
∫∫+∞
−∞∣F(x , y)∣4 dx dy , (2.4)
where F is the modal distribution of the eld. If a Gaussian prole for the mode is assumed, then Aeff ≈ πw2
with w being the waist of the beam [50].³¿e eective length Leff is dened as [50]:
Leff =1
Pin0
∫L
0
P0(z)dz ≈ 1 − e−αpL
αp
, (2.5)
where P0 is the pump power and Pin0 is its value at the input of the ber. ¿e approximation holds for the
scalar case in the undepleted pump approximation.
8

2.2. STIMULATED RAMAN SCATTERING
Instead, processes like self-phase modulation (SPM), cross-phase modulation (XPM)or four-wave mixing (FWM) are loss-less and originate from the Kerr eect, i.e. from thedependence of the refractive index on the intensity of the electromagnetic eld:
n(ω, I) = n0(ω) + n2(ω)I . (2.6)
In Eq. (2.6), n0 is the linear refractive index which in general is frequency dependentgiving rise to chromatic dispersion. ¿e nonlinear refractive index n2 is related to thereal part of χ(3) and a commonly used value is 2.6 × 10⁻²⁰m2W−1 [50]. ¿e nonlinear partof Eq. (2.6) depends on the optical intensity I of the waves propagating in the ber, and itseects are better described by the nonlinear coecient γ [54]:
γ =2πn2
λAe
, (2.7)
where λ is the wavelength.For standard single-mode bers (SMFs) at λ = 1550nm, the nonlinear coecient
typically lays in the range from 1W−1 km−1 to 3W−1 km−1. In fact by using the commonvalue of Ae = 80µm2 Eq. (2.7) yields γ ≈ 1.3W−1 km−1.
Highly nonlinear bers (HNLFs), which have a reduced eective area Ae, have a largernonlinear coecient ranging from γ ≈ 10W−1 km−1 to γ ≈ 20W−1 km−1. HNLFs permit toenhance nonlinear eects enabling the use of shorter bers with respect to standard ones.Using shorter bers can have advantages such as a reduced impact of polarization-modedispersion (PMD).
2.2 Stimulated Raman scattering
Stimulated Raman scattering (SRS) is a nonlinear process in which a pump wave atfrequency ωp and with power Pp transfers energy to a Stokes wave with power Ps at thedownshi ed frequency ωs = ωp − ∆Ω, where ∆Ω is the Raman frequency shi . ¿edierence in energy between the pump and Stokes photons is dissipated by the molecularvibrations through optical phonons. Moreover, energy transfer can happen both in theforward (co-propagating) and in the backward (counter-propagating) directions.
¿e properties of the medium determines both the frequency shi and the prole ofthe Raman gain. Fig. 2.1 shows the Raman gain spectrum for silica bers. ¿e amorphousstructure of silica bers render the gain very broad. In fact, for silica bers, the peakof the Raman gain is downshi ed by about ΩR = 2π fR, where fR = 13.2THz. For apump at λp = 1550nm the corresponding shi of the peak is about 105 nm, providing abandwidth of about 50 nm [56].
¿e evolution of the powers of the pump Pp and of the Stokes signal Ps along the bercan be described by the following two coupled equations [50]:
dPsdz= −αsPs + дRPpPs , (2.8a)
ξdPp
dz= −αpPp −
ωp
ωs
дRPsPp , (2.8b)
where αs and αp are the attenuation coecients at the frequencies of the signal and ofthe pump, respectively, and where дR is the value of the Raman gain coecient at the
9

2. NONLINEAR AMPLIFICATION PROCESSES IN OPTICAL FIBERS
0 5 10 15 20 25 30 35 400
0.2
0.4
0.6
0.8
1
13.2
Detuning ∆Ω/(2π) [THz]
Norm
alized
Ram
angain
coe
cientд R
Figure 2.1: Normalized Raman gain coecient дR of silica bers as a function of the pump-signal detuning ∆Ω/(2π). ¿e frequency shi of the peak is about 13.2 THz. Reprintedfrom [55] © 1984 OSA.
frequency of the signal ωs. ¿e scaling term ωp/ωs accounts for the dierent energies ofphotons at the frequency of the signal and of the pump; as already noted, the remainingenergy ħ(ωp − ωs) is absorbed by the medium. In co-propagating conguration ξ = 1,whereas ξ = −1 if pump and signal are counter-propagating.
As delineated in Section 2.1, the establishment of SRS is characterized by a thresholdpower Pth given approximately by [50], [53]:
Pth ≈ CkAe
дRLe
, (2.9)
where, for silica bers, C = 16 in co-propagating congurations, whereas C = 20 incounter-propagating schemes [53].
¿e coecient k accounts for the polarization properties of the pump and of the Stokessignal and it is in the range 1 ≤ k ≤ 2. In particular, k = 1 for co-polarized pump and signal,whereas k = 2 if their state of polarizations (SOPs) are decorrelated. Note that Eqs. 2.8 donot account for the SOPs of the signal and pump. A more complete model accounting forthe vector properties of SRS will be presented in Section 4.2.
¿e threshold of Eq. (2.9) gives a rough estimate of the pump power required in orderto have equal output pump and signal powers. By neglecting ber losses (αs = αp = 0)and pump depletion (Ps ≪ Pp), it can be shown that the evolution of the signal Ps growsexponentially and it can be described by [50]:
dPsdz= дRPsPp , (2.10)
which can be readily integrated yielding:
Pouts = P
ins eдRPpL . (2.11)
10
2.3. PARAMETRIC AMPLIFICATION IN OPTICAL FIBERS
where L is the ber length and where Pouts = Ps(L) and Pin
s = Ps(0) are the output and theinput signal powers, respectively.
¿erefore, the signal gain G can be estimated as
G =Pouts
Pins
= eдRPpL . (2.12)
With the assumptions made above, Eq. (2.12) is valid for both the co- and the counter-propagating cases.
SRS can be stimulated if a signal Pins is present at the input of the ber. However, SRS
can also grow from spontaneous emission, i.e. from quantum uctuations.SRS can occur in any type of ber, and its response time is in the order of the femtosec-
ond. Moreover, another peculiar advantage of SRS is that it can occur at any wavelengthby properly positioning the pump wavelength. In fact, the gain coecient дR scales withthe inverse of the pump wavelength [46], [57]:
дR ∝1
λp
, (2.13)
and its peak value is about one half of the nonlinear coecient γ [57]–[59]:
дR(ΩR) ≈ γ
2. (2.14)
2.3 Parametric amplication in optical bers
Fiber optical parametric amplication (FOPA) uses FWM to provide amplication. InFWM, four waves4 interact through the Kerr eect.
In FOPA applications, two strong pump waves at frequencies ωp1 and ωp2 provideamplication to a Stokes wave at ωs and to an anti-Stokes wave at ωa, provided that thefollowing condition for photons energy conservation is satised [50], [51]:
ωp1 + ωp2 = ωs + ωa , (2.15)
i.e. the energy of two photons from the two pumps is converted to two new photons, onefor the Stokes and one for the anti-Stokes.
¿e equations describing two pump FOPA, in the scalar case, neglecting the losses,SRS and higher order dispersion, are given by [51]:
dAp1
dz= i γPp1Ap1 + 2 i γ(Pp2 + Ps + Pa)Ap1 + 2 i γAsAaA
∗
p2 ei∆βz , (2.16a)
dAp2
dz= i γPp2Ap2 + 2 i γ(Pp1 + Ps + Pa)Ap2 + 2 i γAsAaA
∗
p1 ei∆βz , (2.16b)
dAs
dz= i γPsAs + 2 i γ(Pp1 + Pp2 + Pa)As + 2 i γAp1Ap2A
∗
a e− i∆βz , (2.16c)
dAa
dz= i γPaAa + 2 i γ(Pp1 + Pp2 + Ps)Aa + 2 i γAp1Ap2A
∗
s e− i∆βz , (2.16d)
4In fact, despite the name, FWM interactions can involve more than four waves, and new signals atdierent wavelengths can be generated, some of which can be degenerate.
11

2. NONLINEAR AMPLIFICATION PROCESSES IN OPTICAL FIBERS
where Ai are the slowly varying envelopes of the waves i ∈ p1, p2, s, a, the star ∗ repre-sents conjugation, Pi = ∣Ai ∣2 is the power of the wave i and
∆β = βs + βa − βp1 − βp2 (2.17)
is the linear phase mismatch5, with βi = β(ωi) being the propagation constant of thewave i.
FOPA can also be achieved through degenerate-FWM, in which the two pumps are atthe same frequency ωp1 = ωp2 = ωp. As before, two photons of the pump are converted totwo new photons to provide amplication to a Stokes wave at ωs < ωp and to an anti-Stokeswave at ωa > ωp. In this case, the energy conservation relation becomes
2ωp = ωs + ωa , (2.18)
and the equations describing the phenomenon are given by [51], [60]–[62]:
dAp
dz= i γPpAp + 2 i γ(Ps + Pa)Ap + 2 i γAsAaA
∗
p ei∆βz , (2.19a)
dAs
dz= i γPsAs + 2 i γ(Pp + Pa)As + i γA
2pA∗
a e− i∆βz , (2.19b)
dAa
dz= i γPaAa + 2 i γ(Pp + Ps)Aa + i γA
2pA∗
s e− i∆βz , (2.19c)
where the linear phase mismatch is
∆β = βs + βa − 2βp . (2.20)
In the undepleted pump approximation the following parametric gain coecient дcan be derived from Eqs. 2.19 [50], [51]:
д =
√(γPp)2 − (κ
2)2 , (2.21)
where
κ = ∆β + 2γPp (2.22)
is the nonlinear phase mismatch. As it can be seen, real and positive gain д can be achievedfor
− 4γPp < ∆β < 0 . (2.23)
Perfect nonlinear phase matching is dened as:
κ = ∆β + 2γPp = 0 , (2.24)
in which case Eq. (2.21) is maximized yielding
дMAX = γPp . (2.25)
5Here it has been assumed a time dependence of ei ωt . By assuming, instead, a time dependence of e− i ωt
the signs of Eq. (2.17) are reversed.
12

2.3. PARAMETRIC AMPLIFICATION IN OPTICAL FIBERS
If only the pump and the Stokes signal are present6 at the input of a ber of length L,the Stokes gain G can be expressed as [50], [51]:
G =Ps(L)Ps(0) = 1 + (γPp
sinh(дL)д
)2 , (2.26)
which, in the case дL≫ 1, can be well approximated by:
G ≈1
4e2γPpL . (2.27)
During the interaction, part of the energy from the pump is transferred to the Stokes, andpart is used to generate a new signal at the anti-Stokes frequency, which at the output ofthe ber has a power given by
Pa(L) = Ps(0)(Gs − 1) , (2.28)
and a phase related to that of the Stokes signal.
As a note, if both the Stokes and the anti-Stokes are present at the input of the ber,their gain depends on their relative phase. In this case the process is called phase-sensitiveber optical parametric amplication (PS-FOPA) [63].
2.3.1 Broad-band ber optical parametric amplication
As written before, in FOPA, maximum gain is achieved for perfect nonlinear phase match-ing, given by Eq. (2.24):
∆β = −2γPp . (2.29)
If the pump is set near the zero-dispersion wavelength (ZDW)7 so that βp ≈ β0, thepropagation constant β can be approximated around the pump frequency ωp by its secondorder Taylor expansion:
β(ω) ≈ β0,p + β1,p∆ω + 12β2,p∆ω
2 , (2.31)
where ∆ω = ωi − ωp and
β j,p =d jβ(ω)dω j
∣ω=ωp
. (2.32)
¿e index i ∈ s, a refer to the Stokes and the anti-Stokes, respectively. By using thisexpansion, the linear phase mismatch of Eq. (2.20) becomes
∆β = β2,p∆ω2 , (2.33)
6¿e same holds true if only the anti-Stokes is present together with the pump.7¿e ZDW is the wavelength λ0 = 2πc/ω0 for which
β2 =d2β(ω)dω2
∣ω=ω0
= 0 . (2.30)
13

2. NONLINEAR AMPLIFICATION PROCESSES IN OPTICAL FIBERS
1400 1450 1500 1550 1600 1650 1700
−60
−40
−20
0
20
Wavelength [nm]
Meanpower
[dBm]
Pp [W]
10.939.137.716.354.18
Figure 2.2: Amplied spontaneous emission of a 500m long DSF for dierent pumppowers. ¿e spectra are obtained by pumping in the anomalous dispersion regime at λp =
1548.50nm.
and therefore perfect nonlinear phase matching can be achieved for
β2,p∆ω2= −2γPp , (2.34)
which is satised for
β2,p < 0 . (2.35)
¿is last condition individuates the anomalous dispersion regime (β2,p < 0) of the beras the region in which to set the pump in order to achieve phase matching and thereforemaximum gain.
Fig. 2.2 and Fig. 2.3 show dierent amplied spontaneous emission (ASE) spectraobtained by pumping in the anomalous dispersion regime. ¿e ber is a dispersion-shi edber (DSF) G.653 with γ ≈ 2W−1 km−1 and ZDW λ0 ≈ 1548nm. ¿is regime is calledbroad-band ber optical parametric amplication (BBFOPA) [64], [65], and, as it can beseen, gain is found for signal wavelengths around the pump wavelength [65].
In particular, if the pump is exactly set at λ0, the width δλ of the gain region can beexpresses as [64]:
δλ = 2 4
√3γPp∣β4∣ , (2.36)
where β4 is the fourth-order coecient of β. Actually, δλ is the maximum achievablegain width. As it can be seen in Fig. 2.3, as the pump is moved from the ZDW into theanomalous dispersion regime, the width of the gain region gets reduced.
14

2.3. PARAMETRIC AMPLIFICATION IN OPTICAL FIBERS
1400 1450 1500 1550 1600 1650 1700
−60
−40
−20
0
20
Wavelength [nm]
Meanpower
[dBm]
λp[nm]
1548.001548.501549.001549.501552.00
Figure 2.3: Amplied spontaneous emission of a 500m long DSF for dierent pumpwavelengths in the anomalous dispersion regime. ¿e pump power is Pp = 6.35W.
2.3.2 Narrow-band ber optical parametric amplication
Phase matching is possible also in the normal dispersion regime (β2,p > 0). As before, byconsidering the 4th-order expansion of β around ωp:
β(ω) ≈ β0,p + β1,p∆ω + 12β2,p∆ω
2+
1
6β3,p∆ω
3+
1
24β4,p∆ω
4 , (2.37)
the nonlinear phase matching condition becomes
β2,p∆ω2+
1
12β4,p∆ω
4= −2γPp , (2.38)
and therefore perfect phase matching can be still be attained provided that
β4,p < 0 . (2.39)
Fig. 2.4 and Fig. 2.5 show dierent ASE spectra obtained by pumping in the normaldispersion regime. ¿e ber is a DSF (G.653) with γ ≈ 2W−1 km−1 and ZDW λ0 ≈ 1548nm.In analogy with BBFOPA, this regime is called narrow-band ber optical parametricamplication (NBFOPA) [64], [66], and is characterized by two narrow gain regions welldetuned from the pump [64], [66], [67].
¿e bandwidth δλ of the two gain regions can be approximately given by [64]:
δλ ≈24γPpλ80(2πc)4 ∣β4(∆λ)3∣−1 , (2.40)
where ∆λ is the wavelength separation of the gain region from the pump.With appropriate ber characteristics the gain regions can be extended well above
2000 nm and below 1300 nm [68], [69]. ¿e presence of dierent peaks in the gain regions,clearly visible in Fig. 2.5, can be attributed to the variations of the ZDW along the ber [70].
15

2. NONLINEAR AMPLIFICATION PROCESSES IN OPTICAL FIBERS
1400 1450 1500 1550 1600 1650 1700
−60
−40
−20
0
20
Wavelength [nm]
Meanpower
[dBm]
Pp [W]
11.619.817.926.844.50
Figure 2.4: Amplied spontaneous emission of a 500m long DSF for dierent pumppowers. ¿e spectra are obtained by pumping in the normal dispersion regime at λp =
1547.50nm.
1400 1450 1500 1550 1600 1650 1700
−60
−40
−20
0
20
Wavelength [nm]
Meanpower
[dBm]
λp [nm]
1547.501547.001546.001545.001544.00
Figure 2.5: Amplied spontaneous emission of a 500m long DSF for dierent pumpwavelengths in the normal dispersion regime. ¿e pump power is Pp = 9.81W.
16

Chapter3Nonlinear fiber optical
oscillators
ε = hν
Max Karl Ernst Ludwig Planck
1858 – 1947
This chapter presents the topic of all-ber optical sources based on nonlinear ampli-cation processes. Over the past two decades, all-ber lasers have been the subjectof a considerable amount of research owing to the several potential advantages
they present with respect to bulk lasers. ¿e lack of critical components such as mirrors,crystals or prisms makes all-ber lasers very attractive due to the lower complexity andhigher ruggedness; moreover, being ber-based, they can have high coupling eciencyand beam quality, and inherently single spatial mode operations.
In the following Section 3.1 a continuous-wave (CW) pump for ber Raman ampliers(FRAs)-based nonlinear polarization attractions (NPAs) is presented. ¿e pump hasbeen developed with the goal of achieving high degree of polarization (DOP), tunabilityand stimulated Brillouin scattering (SBS) suppression. ¿en, in Section 3.2 the time-dispersion-tuning (TDT) technique is briey reviewed. TDT is applied to realize a widelytunable ber optical oscillator, presented in Section 3.3. ¿e oscillator is based on threenonlinear processes, namely stimulated Raman scattering (SRS), broad- and narrow-bandber optical parametric amplication (FOPA), and it results tunable over 160 nm. Finally,in Section 3.4 the use of TDT in a fast tunable optical frequency comb (OFC) based oncascaded four-wave mixing (CFWM) is described.
3.1 Continuous wave pump for ber Raman ampliers
In long-haul FRAs applications, in order to reduce the eects related to the polarization-dependent gain (PDG) of the SRS process, it is a common practice to use a depolarizedpump [71]–[80], e.g. by scrambling its state of polarization (SOP) or by multiplexingorthogonal pumps. Nevertheless, the PDG is the key feature to analyze the gain andpolarization properties of NPA in counter-propagating FRAs, thus there is the need of afully polarized and CW Raman pump.
17

3. NONLINEAR FIBER OPTICAL OSCILLATORS
¿emain drawback of using a highly polarized CW pump is associated to its depletioninduced by the SBS eect [81], which, being two orders of magnitude more ecient thanSRS, limits the maximum usable pump power to few tens of milliwatt, and it is generallydetrimental [82], [83]. ¿e aim of this section is therefore the development of a polarizedCW pump with high power to be used to realize NPA in FRAs.
3.1.1 Stimulated Brillouin scattering
SBS is a nonlinear process in which, similarly to SRS, a pump wave at frequency ωp andwith power Pp transfers energy to a counter-propagating Stokes wave with power PSBS atthe downshi ed frequency ωs = ωp − ΩB, where ΩB is the Brillouin frequency shi . Insilica bers, the frequency shi fB = ΩB/(2π) typically varies in the range from 9GHzto 12GHz [50]. ¿e physical process enabling the energy transfer is however dierentfrom that occurring for SRS.
SBS is induced by the process of electrostriction, throughwhich the pump, if sucientlyintense, generates a co-propagating acoustic wave which travels at the speed of sound vA inthe ber (vA ≈ 6kms−1 for silica bers [50]). ¿e refractive index n is therefore modulatedby the pressure exerted by the acoustic wave and acts as a moving grating, causing Braggdiraction of the pump. ¿e downshi of the Stokes wave frequency by the amount ΩB isgiven by the Doppler eect of the grating moving at speed vA, and it can be written as
ΩB = 2π fB = 2π2npvA
λp
, (3.1)
where λp = 2πc/ωp is the wavelength of the pump (c is the speed of light in vacuum),and np = n(ωp).
As delineated in Chapter 2, the establishment of SBS is characterized by a thresholdpower Pth given approximately by [50], [53], [84]:
Pth ≈ CkAe
дB( fB)Le
(1 + ∆ fp
∆ fB) , (3.2)
where C = 21 for silica bers [53] and 1 ≤ k ≤ 2 accounts for the polarization properties ofthe pump and of the Stokes signal [85]. In particular, k = 1 for co-polarized pump andsignal, whereas k = 2 if their SOPs are decorrelated. дB(ΩB) is the value of the Brillouincoecient at the Brillouin frequency shi ΩB from the pump, whereas ∆ fp and ∆ fB are,respectively, the linewidth of the pump and of the Brillouin gain. ¿e linewidth of thegain spectrum is related to the lifetime of the acoustic phonon, and, in silica bers, ∆ fBtypically varies in the range from 10MHz to 100MHz [50]. Le and Ae are, respectively,the eective length and the eective area. ¿e Brillouin gain and the pump spectralproles can be assumed to have a Lorentzian shape. In this case the eective area can beapproximated by [86]
Ae ≈ 2πW2 , (3.3)
whereW is the mode eld radius.When the pump input power Pin
p exceeds the threshold Pth, the evolution of thebackscattered signal PSBS due to SBS starts to grow exponentially and can be describedby [50]:
dPSBSdz= дBPSBSPp , (3.4)
18

3.1. CONTINUOUSWAVE PUMP FOR FIBER RAMAN AMPLIFIERS
−10 −5 0 5 10 15 20 25 30
−40
−20
0
20
Input pump power Pinp [dBm]
OutputpowersPout
pandPout
SBS[dBm]
transmittedbackscattered
CWPRBSPM
Figure 3.1: Measured transmitted Poutp (dashed curves) and backscattered Pout
SBS (solid curves)powers as functions of the input power, for a 25 km long G.655 NZDSF. Circles refer toa CW laser source. Triangles refer to the same source being intensity-modulated by10Gbit s−1 pseudo-random binary sequence (PRBS) patterns, whereas squared refer to thesame source being phase-modulated by a single sinusoidal tone (the frequency of the toneis chosen to maximize the threshold).
where ber losses, pump depletion and polarization eects have been neglected, resultingin
PoutSBS = P
inSBS e
дBPpL . (3.5)
SBS can be stimulated if a counter-propagating signal PinSBS is present in the ber. However,
SBS can also grow from spontaneous emission (quantum uctuations), in which case itbecame a stimulated process from noise.
3.1.2 Suppression of stimulated Brillouin scattering
Suppressing the SBS eect means increasing its threshold Pth dened in Eq. (3.2), whichcan be achieved by controlling the parameters dened there.
¿e threshold can be doubled by scrambling the SOP of the pump and consequentlylowering itsDOP, inwhich case k = 2. However, as explained above, one of the requirementis to have unitary DOP, i.e. k = 1.
Another common practice to increase the threshold is by broadening the spectrum ofthe pump, i.e. by increasing its linewidth ∆ fp. ¿is can be attained for example by internalor external modulation of the pump [82], [83]. In particular, phase modulation has provento be eective [87]–[90] in communications applications because it permits to maintainthe intensity unaltered, limiting relative intensity noise (RIN) transfers.
Fig. 3.1 shows the measured transmitted Poutp (dashed curves) and backscattered Pout
SBS
(solid curves) powers as functions of the input pump power, for a 25 km long non-zero
19

3. NONLINEAR FIBER OPTICAL OSCILLATORS
EDFA1 LP BPF OI OCo10%
90%
FPC EDFA2
OUTPUT
26 km G.655
Figure 3.2: Experimental setup of the CW ber ring laser. EDFA: erbium-doped beramplier; LP: linear polarizer; BPF: band pass lter; OI: optical isolator; OCo: opticalcoupler; FPC: ber polarization controller.
dispersion-shi ed ber (NZDSF) G.655 ber. For low input powers, both the transmittedand the backscattered powers grow linearly with length. ¿e backscattered power isdominated by Rayleigh scattering [91], [92], which is typically about 40 dB lower than theinput power. Conversely, in this low power regime the transmitted power is only aectedby the loss of the bers.
As it can be seen, for a CW pump (circles) at input power Pinp of about 5 dBm, the
backscattered power PoutSBS starts to grow exponentially, eventually outreaching the trans-
mitted power Poutp for Pin
p > 11 dBm. By intensity-modulating the laser with a 10Gbit s−1
PRBS pattern (triangles) an improvement of the threshold of few decibels is obtained.Even higher improvement is attained by only modulating the phase of the source witha single tone (squares). However, even in this case, the SBS starts to manifest for inputpower of about 20 dBm.
Other techniques rely on the break of the exponential grow of the backscatteredwave. ¿is can be obtained by inserting isolators along the ber [93], or by varying theBrillouin frequency shi ΩB [86], [94], [95] or the eective area Ae. Such variations can beobtained by varying the core radius [96]–[98] and the doping concentration [99]–[101], orby applying temperature [88], [97], [102]–[105] or strain [100], [104], [106], [107] gradients.
For reasons of practical opportunity, however, in our setupwe preferred to use standardbers; therefore SBS suppression has been pursued by modulating the pump. Furthermore,in order to further increase the SBS threshold, a multi-frequency ber ring laser has beenimplemented.
Fig. 3.2 shows the experimental setup of the ring laser. ¿e oscillation in the ring istriggered by the amplied spontaneous emission (ASE) generated by the erbium-dopedber amplier (EDFA1). ¿e ASE, a er being polarized by a linear polarizer (LP), passesthrough a tunable band pass lter (BPF) with bandwidth of about 0.9 nm, equivalent toabout 112.5 GHz at 1550 nm. ¿e ltered ASE is then feed back in the loop by a opticalcoupler (OCo) and amplied again by the EDFA1. ¿e 26 km-long G.655 ber is used tolengthen the cavity. ¿e optical isolator (OI) forces unidirectionality and protects frompossible backscattering from the ber.
By only considering the EDFA1 closed on itself and assuming 25m of erbium-dopedber (EDF), the resulting free spectral range (FSR) is approximately given by
∆ν =c
nдL≈ 8GHz , (3.6)
20

3.2. THE TIME-DISPERSION-TUNING TECHNIQUE
1538 1539 1540 1541 1542 1543 1544−70
−60
−50
−40
−30
−20
−10
0
Wavelength [nm]
Norm
alized
power
[dBm]
Figure 3.3: Spectrum generated by the CW ber ring laser.
where c is the speed of light in vacuum and nд is the group index. ¿e eect of the 26 km-long ber is to reduce the FSR by about a factor of 103, resulting in ∆ν ≈ 8MHz. In idealconditions, by considering the width of the BPF, a total of about 1.5 × 10⁵ lines would beoscillating. However, even if the spectrum of the gain of the EDFA1 can be considered atin the band of the BPF, the latter is not at. ¿erefore, there is competition between thedierent oscillating modes, resulting in the spectrum shown in Fig. 3.3 measured by anoptical spectrum analyzer (OSA). ¿e linewidth at −10 dB from the peak is about 0.15 nm,corresponding to ∆ fp,−10 dB ≈ 20GHz. ¿e ber polarization controller (FPC) and theEDFA2 are used, respectively, to control the output SOP and power. ¿e laser, throughthe BPF, can be tuned over all the amplication band of the EDFAs, i.e. from 1535 nmto 1565 nm.
Finally, Fig. 3.4 shows the gain G obtained by using the above described ring laser as apump in a counter-propagating FRA. ¿e ber used for the FRA is a 25 km long G.655NZDSF, and the gain is dened as
G =Sout0
Sin0, (3.7)
where S0 is the power of the signal undergoing Raman amplication.As it can be seen, the ring laser outperforms the phase-modulated pump, which was
subjected to strong SBS depletion as shown in Fig. 3.1. ¿e saturation of the gain happeningfor pump power above 33 dBm can be attributed to depletion due to SRS, as it will beexplained in Chapter 4.
3.2 ¿e time-dispersion-tuning technique
Time-dispersion-tuning (TDT) is a technique apt to enable wide and fast wavelength-tuning [108]–[113].
21

3. NONLINEAR FIBER OPTICAL OSCILLATORS
21 22 23 24 25 26 27 28 29 30 31 32 33 34
0
10
20
30
Input pump power Pinp [dBm]
GainG[dB]
PMring
Figure 3.4: Measured signal gain G in a counter-propagating FRA. ¿e ber is a 25 kmlong G.655 NZDSF. Results using a phase-modulated pump (red squares) and the CWber ring laser (black circles) are compared.
TDT can be applied to a ber loop laser into which a pulsed pump injects a trainof pulses with repetition frequency f at the optical frequency ωp. Each pump pulsegenerates inside the loop a new signal pulse at the optical frequency ω, which depend onthe particular amplication process occurring in the loop. ¿e propagation constant ofthe signal can be approximated by its second order Taylor expansion around the pumpfrequency ωp:
β(ω) ≈ β0 + β1∆ω + 12β2∆ω
2 , (3.8)
where ∆ω = ω − ωp and
β j =d jβ(ω)dω j
∣ω=ωp
. (3.9)
In particular the second order coecient β2 is the group velocity dispersion (GVD)parameter taking into account for the chromatic dispersion. Due to chromatic dispersion,each frequency components of the signal pulse travel at the respective group velocity vд(ω):
vд(ω) = 1
β1(ω) , (3.10)
which, by using the above expansion, can be rewritten as:
1
vд(ω) = β1 + β2∆ω = 1
vд(ωp) + β2∆ω . (3.11)
A er a propagation of length L, the relative delay ∆τ = τ(ω) − τ(ωp) accumulated bycomponents separated by ∆ω can be calculated as
∆τ = L( 1
vд(ω) − 1
vд(ωp)) = β2L∆ω = DcL∆λ , (3.12)
22

3.2. THE TIME-DISPERSION-TUNING TECHNIQUE
where, in the last equality, ∆λ is the wavelength separation and
Dc = −2πc
λ2β2 (3.13)
is the chromatic dispersion coecient. Typically the chromatic dispersion coecient Dc
is also accompanied by the dispersion slope coecient S0, dened as
S0 =dDc(λ)dλ
∣λ=λ0
, (3.14)
where λ0 is the zero-dispersion wavelength (ZDW) of the ber, i.e. S0 is the rst ordercoecient of the Taylor expansion of Dc(λ0) ≈ S0∆λ.
In a ber loop, TDT exploits such wavelength dependence of the signal group velocityto synchronize only a narrow band of the feed back signal with a new incoming pumppulse. In fact, the synchronization condition requires that the signal pulse time of ight inthe loop must equal an integer multiple N of the pulse repetition period:
L
vд(ω) = N
f. (3.15)
¿e laser tuning slope, as a function of the pump repetition rate, can be calculated bydening fp to be the pump repetition frequency necessary for self-synchronization:
fp = Nvд(ωp)
L, (3.16)
i.e. fp is the repetition frequency for which the wavelength of the pump pulses traveling inthe loop is synchronized with the incoming pulses from the pump. If the pump repetitionrate is shi ed by ∆ f = f − fp the optical frequency synchronized with a new pump pulseshi s by an amount ∆Ω = ωp − ω that can be approximated by
∆Ω ≃∆ f
β2(ωp) fpvд(ωp) , (3.17)
where it has been assumed ∆ f ≪ fp. An equivalent formula [113] can be obtained for thecorresponding wavelength shi :
∆λ ≃ Sλ∆ f =−∆ f
Dc(λp) fpvд(ωp) . (3.18)
It is worth to note that TDT can be used in conjunction with any gain process. In [108]SRS was exploited in a non-dispersive loop, and TDT was implemented by mechanicallycontrolling the length of the loop. However, the achieved tuning was slow due to the slowmechanical stages.
On the contrary, with the technique described above, tuning rates of 4 nm µs−1 canbe obtained [112]–[114]. For instance, in [113], [114] broad-band ber optical paramet-ric amplication (BBFOPA) was exploited and tunability over 100 nm was achieved bymodifying the pump pulse repetition rate f .
In particular, TDT completely removes the need of mechanically tunable devices ifthe pump pulse repetition frequency f is changed to adjust synchronization, thereforemaking the system extremely fast to tune. Moreover, by properly controlling the dispersionproperties of the loop, the tuning slope can be modied.
23

3. NONLINEAR FIBER OPTICAL OSCILLATORS
ECL
EOM
EPG
EDFA1 BPF1 EDFA2 BPF2
VOA FPC1
OCo1
50%
50%
500m DSF OCo2
10%
90%
OUTPUT
OI 2 km DCFFPC2
Figure 3.5: Experimental setup of the widely tunable ber laser. ECL: external cavity laser;EOM: electro-optic modulator; EPG: electrical pulse generator; EDFA: erbium-doped beramplier; BPF: band pass lter; VOA: variable optical attenuator; FPC: ber polarizationcontroller; OCo: optical coupler; OI: optical isolator. Reprinted from [P.1] © 2013 OSA.
3.3 Widely tunable oscillator based onmultiple processes
In this section, based on the publications [P.1] and [C.1], a widely tunable all-ber oscillatoris presented and experimentally characterized. ¿e optical oscillator is based on threedierent nonlinear amplication processes: stimulated Raman scattering, narrow- andbroad-band FOPA. Each process dominates in a dierent wavelength range, and throughthe TDT technique wide wavelength tuning spanning 160 nm is achieved. When FOPA isused, the oscillator also takes the name of ber optical parametric oscillator (FOPO).
Conventional lasers have fundamental limitations on the range and speed of tuningdue to the presence of mechanically controlled optical lters and gratings. For examplewidely tunable lasers, such as the external cavity lasers (ECLs), have a low sweep rate whilethe tuning range of fast tunable lasers¹ is usually narrow. In this respect, all-ber laserscan overcome such limitations.
Moreover, high-speed and wide-range wavelength tuning are mandatory requirementsfor applications in optical coherence tomography [4], distributed remote sensing [5],chromatic dispersion measurement [115] and in dense wavelength-division-multiplexingoptical telecommunication networks [6]. ¿e needs of such fast, compact and highperformance devices have been spurring research into all-ber lasers.
24

3.3. WIDELY TUNABLE OSCILLATOR BASED ONMULTIPLE PROCESSES
3.3.1 Experimental setup
¿e laser is constituted by an optical pulse generator which injects a train of high peakpower pulses in a highly dispersive ber ring. ¿e experimental setup is shown in Fig. 3.5.¿e pulsed pump, at the top, generates a train of optical pulses with a duration of 1 ns anda repetition rate fp of about 2.31MHz. Such train is carved from the CW beam emittedby the ECL through an electro-optic modulator (EOM), driven by an electrical pulsegenerator (EPG). ¿e pulses are then amplied by EDFAs operating in strong saturation,so that the output pulse peak power can be of a few tens of watts [116], [117]. ¿e BPFshave a 3 dB bandwidth of 3.5 nm and are centered at the pump wavelength to reduce theASE noise from the EDFAs. Finally, the variable optical attenuator (VOA) controls thepump power level and the FPC1 xes the pump SOP entering the loop through the 50/50OCo1.
¿e loop, shown at the bottom, comprises a nonlinear ber, in which the nonlinearamplication processes take place, and a dispersion-compensating ber (DCF), whichprovide the high dispersion required for the TDT.
¿e nonlinear ber is a spool of 500m of dispersion-shi ed ber (DSF). ¿e averageZDW is around λ0 ≈ 1548nm and the chromatic dispersion slope, dened in Eq. (3.14),is S0 = 0.05psnm−2 km−1. ¿emeasured nonlinear coecients is γ ≃ 2W−1 km−1, whereasthe measured Raman gain coecient is дR ≃ 1.2W−1 km−1, which agrees quite well withthe prediction [57]–[59] of Eq. (2.14). ¿e SBS is not an issue here due to the short lengthof the ber and relatively large bandwidth of the pulses. Upon comparison of the SBSthreshold for the 26 km ber presented in Section 3.1.2, here the threshold can be roughlyestimated to be more than 30 dB higher.
Beyond the amplication stage given by the DSF, 10% of the power is directed to theoutput, while the remaining 90% is fed back into the loop through a 2 km long DCF. ¿eDCF has a chromatic dispersion coecient at λ = 1550nm of Dc = −103 ps/nm/km and achromatic dispersion slope of S0 = −0.2024psnm−2 km−1. Finally, the FPC2 controls thealignment of the SOP of the circulating signal with respect to that of the input pump.
¿e total losses of the loop at λ = 1550nm are about αloop = 8.6dB, whereas thesingle-pass gain of the loop can be expressed as:
Gloop(λ) = 1
L ∫L
0G(z, λ)dz , (3.19)
where G(z, λ) depends on the particular amplication process and therefore on the wave-length. In particular, the dependence on the wavelength is also imposed by the TDTsynchronization. ¿e oscillation condition can then be written as:
Gloop = αloop . (3.20)
3.3.2 Amplication regions
Fig. 3.6 shows the open-loop ASE from the DSF pumped by 10W input peak powerpulses (corresponding to 26mWaverage power), for two dierent pumpwavelengths λp1 =
1548.50nm (solid curve) and λp2 = 1547.50nm (dashed curve).
¹Currently, fast tunable lasers can have a sweep rate on the order of few nmms−1 over a band of few tensof nanometers.
25

3. NONLINEAR FIBER OPTICAL OSCILLATORS
1400 1450 1500 1550 1600 1650 1700
−60
−40
−20
0
20
BB NB SRS
Wavelength [nm]
Meanpower
[dBm]
λp1 = 1548.50nmλp2 = 1547.50nm
Figure 3.6: Amplied spontaneous emission of a 500m long DSF obtained by pumpingwith 10W of peak power in the anomalous dispersion regime at λp1 = 1548.50nm (bluesolid curve) and in the normal dispersion regime at λp2 = 1547.50nm (blue dashed curve).Reprinted from [P.1] © 2013 OSA.
¿e latter pump wavelength (λp2) lays in the normal dispersion regime and givesrise to narrow-band ber optical parametric amplication (NBFOPA) [64], [66], whilethe former wavelength (λp1) is in the anomalous dispersion regime in which BBFOPAappears [65]. ¿e pumping wavelengths have been selected to enable an almost continuoustransition between the three dierent regimes, i.e. depending on the particular processselected, the pump wavelength is set above or below the ZDW.
As explained in Section 2.3.2, in the NBFOPA regime (dashed curve in Fig. 3.6), dueto phase matching conditions, there are two narrow gain regions well detuned from thepump [64], [66], which, in principle, with appropriate ber characteristics, could beextended well above 2000 nm and below 1300 nm [68], [69]. ¿e presence of two localmaxima in the gain spectrum (λ = 1587nm for the Stokes and its respective symmetricpeak for the anti-Stokes) can be attributed to the variations of the ZDWalong the ber [70].However, these peaks are 30 dB lower than the maximum.
On the contrary, BBFOPA regime is found for signal wavelengths around the pumpwavelength [65], as seen in Section 2.3.1.
In both regimes the spontaneous emission due to SRS is observable in the wavelengthrange from 1625 nm up to 1675 nm. In fact, the gain peak of SRS is upshi ed with respectto the pump wavelength of about 105 nm, and has a bandwidth of about 50 nm [56]. Inthe NBFOPA regime, the peak at about 1450 nm can be attributed to four-wave mixing(FWM) between the pump and the Raman ASE.
26

3.3. WIDELY TUNABLE OSCILLATOR BASED ONMULTIPLE PROCESSES
1400 1450 1500 1550 1600 1650 1700-70
-50
-30
-10
10
Wavelength [nm]
Meanpower
[dBm]
∆ f [kHz]
-0.78 (BBFOPA)1.95 (NBFOPA)5.47 (SRS)
Figure 3.7: Spectra of the widely tunable ber laser in the three dierent amplicationregimes. ¿e pump pulse repetition rate is fp = 2.3079MHz.
3.3.3 Tuning and eciency
As explained in Section 3.2, TDT enables to lock the oscillator to a predetermined wave-length. In this way each dierent nonlinear amplication process can be selected, thereforeenhancing the tuning range but maintaining a good spectral purity.
Fig. 3.7 shows the spectra obtained by synchronizing the signal on particular wave-lengths through the TDT technique. ¿e pump pulse repetition rate is fp = 2.3079MHz.¿e blue curve is obtained in the BBFOPA regime by shi ing the repetition rate by ∆ f =−0.78 kHz, whereas the red curve is obtained in the NBFOPA regime for ∆ f = 1.95kHz.¿e black curve, instead, is given by SRS amplication for ∆ f = 5.47kHz. For the BBFOPAand NBFOPA regimes the Stokes and the anti-Stokes waves have the same output power,whereas for SRS the Stokes wave is more intense because of the asymmetry of the Ramangain [118]–[120]. Moreover, in SRS regime a residual NBFOPA emission around 1500 nmand 1600 nm can be observed, because of its high eciency. However, due to TDT, any un-wanted emission is very weak (about 40 dB lower). In both the NBFOPA and the BBFOPAa higher harmonic peak is observed as a result of CFWM.¿is eect will be enhancedin Section 3.4 to realize a fast tunable OFC.
¿e tuning characteristic of the ber laser is shown in Fig. 3.8, and, as it can be seen,the tuning range is about 160 nm. When the signal wavelength synchronized with the newincoming pump pulse was set beyond 1680 nm the laser went below threshold due to thefading of SRS.
¿e regime dominated by BBFOPA is indicated by the blue plus markers while thatdominated by the SRS is indicated by red circle markers. ¿e smooth transition betweenthe two regimes, with an overlap ranging from 1580 nm to 1588 nm, is obtained throughthe NBFOPA.
¿e slope of the tting (dashed) line is Sλ = 22.65nmkHz−1; assuming a group in-
27

3. NONLINEAR FIBER OPTICAL OSCILLATORS
−1 0 1 2 3 4 5 61500
1550
1600
1650
1700
Repetition frequency shi ∆ f [kHz]
Outputwavelength[nm]
λp1 = 1548.50nmλp2 = 1547.50nm
data tting
Figure 3.8: Tuning characteristic of the widely tunable ber laser as a function of theshi ∆ f = f − fp of the pump pulse repetition rate ( fp = 2.3079MHz). ¿e blue plusmarkers refer to pumping in the anomalous dispersion regime, whereas red circle markersrefer to pumping in the normal dispersion regime. Reprinted from [P.1] © 2013 OSA.
dex nд = 1.46, the theoretical formula of Eq. (3.18) yields Sλ = 23.43nmkHz−1, which is ingood agreement with experimental data. ¿e slight deviation from the theoretical slopefor −1 ≤ ∆ f ≤ 0 might be attributed to higher order dispersion eects.
¿e sweep velocity is set by the time delay in the cavity. In fact any change in the lasingwavelength becomes eective a er the pulses have circulated enough times in the cavity inorder to satisfy Eq. (3.20). In [113] a sweep rate of 40 kHz has been achieved with a cavitylong 350m. Here, the cavity is 2.5 km long, and therefore the sweep rate can be estimatedto be about 5.6 kHz. However, the tuning range is larger than that achieved in [113].
¿e limiting factor in the sweep rate is the cavity length. ¿is could be improved byusing a shorter gain ber, such as a highly nonlinear ber (HNLF). HNLFs can have alarger nonlinear coecient, e.g. γ ≈ 20W−1 km−1, permitting to reduce the length of theber and consequently to increase the rate by a factor of 10. Similarly, the DCF could beshortened by increasing its dispersion properties.
¿e conversion eciency of the ber laser, dened as:
η =Pouts,avg
Pinp,avg
, (3.21)
where Pouts,avg is the average power of the oscillating signal and Pin
p,avg is the average inputpower of the pump, is shown in Fig. 3.9. ¿e average eciency is about η = 5% and thelaser threshold mean power ranged from about 2.5mW to about 15mW. ¿e maximumeciency is η = 16%, obtained in the BBFOPA regime. ¿e variations of the eciency inthis regime are compatible to those of the ASE shown in Fig. 3.6. For the NBFOPA, themaximum eciency is about η = 8%. ¿e transition from the NBFOPA to the SRS regime
28

3.3. WIDELY TUNABLE OSCILLATOR BASED ONMULTIPLE PROCESSES
1520 1560 1600 1640 16800
5
10
15
20
Output wavelength [nm]
Conversione
ciency
η[%
]λp1 = 1548.50nmλp2 = 1547.50nm
Figure 3.9: Eciency of thewidely tunable ber laser as a function of the outputwavelength.¿e blue plus markers refer to pumping in the anomalous dispersion regime, whereas redcircle markers refer to pumping in the normal dispersion regime. Reprinted from [P.1]© 2013 OSA.
can be identied by a drop of the eciency at about 1625 nm. ¿e SRS regime results inlower eciency due to the smaller gain coecient (see Eq. (2.14)).
As it can be seen, the eciency is not at because it depends on the spectral eciencyof the particular regime. If constant output power is required, then an automatic feedbackcontrol could be implemented for example. However, such control would set a limitationin the sweep velocity. On the other hand, inmany applications at output is not an issue [4].For instance, in measurements based on insertion losses or on back-reections, typicallywhat is measured is the relative dierence with respect to a referenced spectrum.
Finally, Fig. 3.10 shows the spectra of Fig. 3.7 and for some other oscillationwavelengthsreported in Fig. 3.8. ¿e dashed line is the tuning characteristic. ¿e residual NBFOPAemission around 1500 nm and 1600 nm is clearly observable in four traces (∆ f = 2.83 kHz,3.71 kHz, 4.58 kHz and 5.46 kHz), and no residual SRS emission is clearly visible. TDT inconjunction with NBFOPA was partially exploited in [68]; however, tuning was realizedby modifying the pump wavelength and a thulium-doped ber (TDF) had to be usedto eliminate unwanted SRS radiation [68], [69]. Here, on the contrary, TDT enables tosuppress unwanted oscillations down to −40 dB with respect to the tuned spectral line. Inall the measures the signal linewidth is below 0.05 nm (limited by the resolution of theOSA).
As already noted in Fig. 3.7, higher harmonic peaks due to CFWM are observed inthree traces (for ∆ f = −0.78 kHz, 1.17 kHz and 1.95 kHz). ¿is eect will be enhanced inthe following Section 3.4 to realize a fast tunable OFC.
29

3. NONLINEAR FIBER OPTICAL OSCILLATORS
1400 1450 1500 1550 1600 1650 1700-1
0+1+2+3+4+5+6
-70
-50
-30
-10
10
Wavelength [nm]
Repetitionfrequencyshi ∆f[kHz]
Meanpower[dBm]
Figure 3.10: Spectra of the widely tunable ber laser. ¿e dashed line is the tuning charac-teristic presented in Fig. 3.8. For the sake of comprehension the traces have been truncatedto −70 dBm. Reprinted from [P.1] © 2013 OSA.
3.4 Generation of fast tunable optical frequency combs
In Section 3.3 a widely tunable all-ber oscillator has been presented. ¿e oscillator,through TDT is able to generate oscillations on dierent regimes, in particular using theBBFOPA process. Moreover, it has also been shown that in the BBFOPA regime a CFWMprocess can appear. ¿is section, based on the publication [P.1], shows that the sameTDT technique used in Section 3.3 can be successfully applied to achieve tunable opticalfrequency combs (OFCs) through CFWM.
3.4.1 Optical frequency combs
Ideally, OFCs are optical sources whose spectrum F( f ) is a series of delta functions thatcan be described by
F( f ) = A0
+∞
∑k=−∞
δ( f − k∆ f − f0) (3.22)
where ∆ f is the comb tooth spacing, A0 is an arbitrary amplitude and f0 < ∆ f is aconstant oset. In particular, in the time domain it corresponds to a periodic signal withperiod ∆T = 1/∆ f .
Recently, OFCs have been gathering conspicuous attention because they are key com-ponents in several applications in communication [7], signal processing [8], metrology [9],[10] and spectroscopy [10], [11]. ¿e key characteristics of an OFC can include [121], [122]:
• frequency separation,
• power equalization,
30

3.4. GENERATION OF FAST TUNABLE OPTICAL FREQUENCY COMBS
ωωp1 ωp2 ωaωs
ωp1 + ωp2 = ωs + ωa
FWM
ωωp ωaωs
2ωp = ωs + ωa
Degenerate FWM
ωωpωs ωa
Cascaded FWM
Figure 3.11: Cascaded four-wave mixing for OFC generation.
• spectral purity,
• phase locking and orthogonality (needed for some coherent applications like or-thogonal frequency division multiplexing),
• tunability across a given spectral region,
• long term stability,
• and locking to an absolute frequency reference.
Currently, no OFC provides all these characteristics simultaneously [122].
¿emost straightforward OFCs are bulk mode-locked lasers [123] which are extremelyaccurate devices, though large and cumbersome. More compact solutions that have ap-peared are monolithic semiconductor mode-locked lasers [124], [125], or optical paramet-ric oscillators based on high Q-factor monolithic resonators [126] like microtoroids [127],[128], silica microspheres [129], silicon [130] or silicon nitride microrings [131], [132].Monolithic cavities can attain high spectral purity but their main drawback is that thecomb frequency spacing is o en xed by the cavity properties. ¿ey can, however, betuned by modifying the cavity through thermal eects [12], but the resulting tuning isslow.
In optical bers, tunable OFCs can be easily achieved through CFWM [133], [134],which, as depicted in Fig. 3.11, can be viewed as a combination of degenerate and non-degenerate FWM processes. Typically such OFCs are realized either in a single-passber amplier in which two CW pump waves are injected [14], [15], or through a doublestage amplier exploiting phase-sensitive amplication [135], [136]. ¿ose setups are verysimple, but OFC spectral purity is strongly inuenced by the pumps frequency and phasestability [16]. In fact, the main advantage of CFWM-based combs (the constant frequencyspacing between comb teeth) is lost unless a feedback error signal is used to stabilize boththe pump lasers [137].
31

3. NONLINEAR FIBER OPTICAL OSCILLATORS
1500 1510 1520 1530 1540 1550 1560 1570 1580 1590 1600−80
−60
−40
−20
0
20oscillating Stokesanti-Stokes
2nd-order
3rd-order
Wavelength [nm]
MeanPower
[dBm]
open loopclosed loop
Figure 3.12: CFWM establishment (black solid curve) obtained by pumping in the BB-FOPA regime at λp = 1549.50nm and by setting the resonating wavelength at a distanceof 8.25 nm from the pump wavelength. ¿e red dashed curve is the relative ASE spectrum.In both cases the pump peak power is Pp = 3.29W.
Also in Fabry-Pérot resonators [138] SBS limits the spectral purity. ¿e use of doublypumped ring cavities prevents the growth of Brillouin oscillations [139], but still presentslimitations in the frequency stability. To circumvent that problem a singly pumped cav-ity [13] has been very recently realized, but the comb teeth tuning has been realized byintracavity tunable lters, so limiting the comb reconguration time.
3.4.2 Results
As discussed above, OFCs can be obtained through CFWM. Moreover, in the spectraof Fig. 3.10 it has been shown that in the BBFOPA regime a CFWM process can appear.
Fig. 3.12 shows the spectrum (black solid curve) obtained by using the same setupof Section 3.3. ¿e pump is in the BBFOPA regime, at λp = 1549.50nm, and the syn-chronously pumped wavelength is selected to be very close to the pump wavelength(∆λ = 8.25nm). In this case an ecient CFWM occurs and an OFC is obtained.
In particular, here the resonant wavelength is properly synchronized through TDT.¿erefore, the OFC is obtained in a singly pumped ber CFWM resonator. ¿is fact canavoid the limitations in spectral purity and frequency and phase stability given by doublepump systems.
¿e comb teeth linewidth at −3 dB is at most 0.35 nm. ¿e broad linewidth can beattributed to the uctuations of dispersion parameters of the cavity, e.g. variations ofthe ZDW along the ber [70]. Moreover, the output pulses are chirped by cross-phasemodulation (XPM). ¿e resulting frequency broadening δω can be roughly estimatedby considering Gaussian pulses of duration T0 = 1 ns and by noting that the lines have
32

3.4. GENERATION OF FAST TUNABLE OPTICAL FREQUENCY COMBS
−80
−60
−40
−20
0
20
(a)
6.4THz
−35 −30 −25 −20 −15 −10 −5 0 5 10 15 20 25 30 35−80
−60
−40
−20
0
20
(b)
3.3 THz
Optical frequency shi ∆Ω [THz]
Meanpower[dBm] ∆ f = 155Hz
Figure 3.13: Spectra of the tunable OFC for two dierent synchronously pumped wave-lengths. ¿e repetition frequency shi between the two congurations is ∆ f = 0.135 kHz.¿e pump is set at λp = 1549.50nm with 3.29W peak power. Reprinted from [P.1]© 2013 OSA.
similar power. ¿erefore the XPM broadening is in the order of two times the self-phasemodulation (SPM) broadening [50], yielding approximately:
δω ≈ 4γPpLT−10 ≈ 0.32nm , (3.23)
which is very close to the observed value.Remarkably, by modifying the resonating wavelength, tuning of the OFC teeth spacing
can be obtained. ¿is is shown in Fig. 3.13, where two dierent frequency spacing ∆Ω anddierent numbers of Stokes waves have been obtained ((a) ∆Ω = 6.4THz and 4 Stokeswaves; (b) ∆Ω = 3.3THz and 7 Stokes waves).
For the DSF used in the experiments, BBFOPA gain drops signicantly for pump-signal frequency detunings smaller than 2.3 THz; so, no OFC formation has been observedbelow such value. Regarding the OFC properties, though no time characterization couldbe performed due to the lack of an autocorrelator, the coherence between comb teeth isassured by the CFWM and the fact that a single pump is injected, dierently from [15].
¿e rst remarkable property of the obtained OFC is the possibility of very fast tuning.¿e second is that the obtained high frequency modulation ∆Ω is linked directly to a lowfrequency f electrical signal through
∆Ω ≃∆ f
β2(ωp) fpvд(ωp) . (Eq. (3.17) revisited.)
¿erefore ∆Ω can be locked to microwave frequency standards, enabling frequency up-conversion for example.
33

3. NONLINEAR FIBER OPTICAL OSCILLATORS
3.5 Conclusions
In this chapter all-ber optical sources through nonlinear amplication processes havebeen presented and characterized.
First, in Section 3.1, a continuous-wave pump has been presented. ¿at pump, aimedto be used in ber Raman ampliers, enables to reduce the pump depletion induced bystimulated Brillouin scattering.
¿en, a widely tunable ber optical oscillator has been presented in Section 3.3. Suchoscillator, based on three nonlinear processes, namely stimulated Raman scattering, broad-band and narrow-band optical parametric amplication, uses the time-dispersion-tuningtechnique both for tuning the output wavelength and for suppressing unwanted radia-tion. ¿e achieved laser is tunable over a range of 160 nm, smoothly passing through thethree processes, with only one change in the pump wavelength. ¿erefore the oscillatorwavelength reconguration time, for the largest section of the spectrum (about 100 nm),is only set by the achievable speed of change of the pump pulse repetition rate, which canbe extremely high. Moreover, the tuning range could be further extended by properlydesigning ber dispersion. ¿e eciency, limited to 16%, and the limits on the sweepvelocity have been discussed, together with possible solutions.
Finally, in Section 3.4 through the same technique a fast tunable optical frequencycomb has been realized exploiting cascaded four-wave mixing. ¿e optical frequencycomb is obtained in a singly pumped ber CFWM resonator, therefore avoiding someof the limitations in spectral purity and stability given by double pump systems. ¿emost valuable features of the generated comb are that the frequency spacing may bequickly tuned without modifying the teeth bandwidth, which can be a useful property inapplications like orthogonal frequency division multiplexing. Furthermore, such opticalfrequency comb at very high frequency can be locked directly to a microwave frequencystandard.
34

Chapter4Nonlinear polarization
attraction in fiber Raman
amplifiers
pq − qp =h
2π i
Werner Karl Heisenberg
1901 – 1976
This chapter dealswith nonlinear polarization attraction (NPA) in counter-propagatingber Raman ampliers (FRAs) in standard, randomly birefringent, single-modebers (SMFs). Over the past few years, NPA has been proposed as an eective
method to optically control the state of polarization (SOP) of signals. Nonlinear polar-ization attraction in FRAs is driven by the polarization-dependent nature of the Ramaneect, and it enables the attraction of the SOP of a signal toward a SOP set by the pump.In particular, due to the attraction process a depolarized signal experiences an increase ofits degree of polarization (DOP).
A er a short introduction on the state of the art given in the following Section 4.1,in Section 4.2 a vector model for stimulated Raman scattering (SRS) will be briey re-viewed. ¿en, in Section 4.3 a full-scale numerical analysis and statistical evaluations ofNPA in counter-propagating FRAs in randomly birefringent SMFs are presented. ¿eanalysis includes the eects of pump depletion, nonlinear polarization rotation (NPR)and orthogonal Raman gain, and it shows that a counter-propagating FRA is eectivein attracting the signal toward a predetermined SOP settled by the pump input SOP.Furthermore, it is shown that pump depletion plays an important role in achieving signalrepolarization in bers with moderately-high polarization-mode dispersion (PMD). Re-markably, it is predicted the existence of a quantitative relationship between the gain andthe maximum DOP acquired by the signal in the amplier. Finally, in Section 4.4, suchrelationship, which approximates both the performances and the limitations of the attrac-tion eciency, is experimentally validated, conrming that it represents an upper-boundon the maximum achievable DOP.
35

4. NONLINEAR POLARIZATION ATTRACTION IN FIBER RAMAN AMPLIFIERS
4.1 Introduction
Polarization is an important degree of freedomof lightwhich is being increasingly exploitedin optical communications and sensing systems, among others. Over the past few years,the all-optical processing of polarization has been the subject of considerable researcheorts, giving rise to new devices able, for example, to perform polarization modulationand regeneration, or to control the SOP and the DOP. For instance, controlling the DOPpermits to attain signal depolarization or repolarization.
SOP control can be attained by electronically driven waveplates or polarization con-trollers [140]–[146], but the speed of such systems is limited by the electronic feedbackand the mechanical stages. Signal repolarization can be obtained by using classical bulkpolarizers, which operate by projecting the SOPs over a predetermined direction. However,the average eciency of such projection is physically limited to be lower than 50%. In 2000,Heebner et al. [17] demonstrated an all-optical repolarizer based on the photo-refractiveeect and with eciency higher than 50% [17]. ¿is is a fundamental example of NPA, aprocess in which the SOP is attracted, rather than projected, to a predetermined direction,therefore increasing the limits on the eciency. Since then, NPA has been proposed as aneective all-optical method to control the SOP. However, the photo-refractive eect usedin [17] has severe limitations due to the low response time of the mediating material.
Only recently, the nonlinear Raman amplication process has been demonstratedas an eective method to obtain NPA in standard telecommunications SMFs [P.2], [18]–[30], [C.2], [P.3]. NPA in SMFs can be achieved also by exploiting stimulated Brillouinscattering (SBS) [31]–[34] or Kerr nonlinearity [30], [35]–[45], and, depending on theactual conguration, some of the three eects may act together [30], [35]. ¿ese processeshave response time in the order of femtoseconds, enabling virtually instantaneous controlof the SOP.
In FRAs the NPA is driven by the polarization-dependent nature of SRS which causesthe component of the signal parallel to the pump to experience higher Raman gain than theorthogonal component. ¿is process cumulates along the ber and permits the attractionof the SOP of the signal toward a SOP set by the pump. In particular, if the pump ispolarized, a depolarized signal experiences an increase of the DOP due to the attractionprocess, and, therefore, such a device is also called a Raman polarizer (RP) [29], [147].
¿e main advantage of using FRAs to achieve NPA is, together with the fast responsetime of SRS, the possibility of achieving simultaneously both amplication and repolariza-tion over a band of more than 7 THz [25]. It has been also very recently demonstrated thepossibility to apply Raman-based NPA to realize RPs in integrated silicon devices [27],to obtain repolarization in wavelength-division-multiplexing (WDM) systems [26] or toenhance the performances of FRAs [28].
Under proper circumstances, co-propagating FRAs can achieve high signal repo-larization eciency. However, they suer of some disadvantages with respect to thecounter-propagating conguration, such as the higher relative intensity noise (RIN) trans-fer between pump and signal [52], [148]; but the main problem arise from the unpre-dictability of the output SOP [20], [22]. On the contrary, in a counter-propagating schemethe signal output SOP is fully determined by the pump input SOP, thus overcoming suchunpredictability [24], [33], [P.3].
¿e following analysis is therefore focused on FRAs in counter-propagating congu-ration. Moreover, only the case of continuous-wave (CW) signals is considered, which,
36
4.2. VECTOR MODEL OF STIMULATED RAMAN SCATTERING
however, provides a good approximation of the steady-state behavior of high bit-rate pulsestreams [30].
4.2 Vector model of stimulated Raman scattering
¿e scalar model of SRS briey reviewed in Section 2.2 is limited to the case of co-polarizedbeams, i.e. a case in which both the pump and the signal maintain exactly the same SOPduring all their interaction. In order to deal with signals with arbitrary SOPs and to studytheir polarization properties it is therefore necessary to introduce a vector model in whichthe pump and the signal can have arbitrary and, in general, dierent SOPs.
By using the model developed by Lin and Agrawal [149], the pump and the signalcan be described by fully polarized CW signals, i.e.monochromatic waves having unitaryDOP. ¿eir arbitrary SOPs are represented by three-components Stokes vectors of theform:
S =⎛⎜⎝S1S2S3
⎞⎟⎠ = S0s = S0⎛⎜⎝s1s2s3
⎞⎟⎠ . (4.1)
¿erefore this representation slightly simplies the full four-components representation ofthe Stokes vectors, which is discussed in Appendix A. In particular, there is no unpolarizedcomponent of the beam and the power is simply given by
S0 = ∥S∥ =√S21 + S22 + S
23 . (4.2)
¿e interaction of the signal S and of the backward propagating pump P is describedby the following two coupled equations [19], [149]:
dS
dz= −αsS +
дR2[P0S + S0P + µ(3P0S + S0P − 2S0P3)] + (ωsb +Ws) × S , (4.3a)
dP
dz= αpP +
ωp
ωs
дR2[S0P + P0S + µ(3S0P + P0S − 2P0S3)] − (Mωpb +Wp) × P , (4.3b)
where, as previously dened in Eq. (4.2), P0 = ∥P∥ and S0 = ∥S∥ represent, respectively,the powers of the pump and of the signal. ¿e vectors P3 and S3 are dened as
P3 = P3 e3 =⎛⎜⎝00P3
⎞⎟⎠ and S3 = S3 e3 =⎛⎜⎝00S3
⎞⎟⎠ , (4.4)
where e3 = (0, 0, 1)T is the unit vector representing right-handed circular polarization.¿e angular frequencies of the pump and of the signal are, respectively, ωp and ωs; αp
and αs are the attenuation coecients at the respective frequencies.¿e coecient дR in Eqs. 4.3 is the value of the Raman gain coecient at the frequency
of the signal ωs. As explained in Section 2.2, for silica bers the peak of the Raman gainis downshi ed from the frequency of the pump ωp by ΩR = 2π fR, where fR = 13.2THz.¿erefore the corresponding frequency for the signal is ωs = ωp − ΩR. In the pumpequation Eq. (4.3b) дR is scaled by the term ωp/ωs which account for the dierent energiesof photons at the frequency of the signal and of the pump; the rest of the energy is absorbedby the medium.
37

4. NONLINEAR POLARIZATION ATTRACTION IN FIBER RAMAN AMPLIFIERS
0 5 10 15 20 25 30 35 400
0.2
0.4
0.6
0.8
1
Detuning ∆Ω/(2π) [THz]
Norm
alized
Ram
angain
coe
cientд R
дRд⊥R
Figure 4.1: Normalized parallel дR (solid) and orthogonal д⊥R (dashed) Raman gain coe-cients of silica bers as a function of the pump-signal detuning ∆Ω/(2π). ¿e frequencyshi of the peak is about 13.2 THz. Reprinted from [50] © 2007 Elsevier.
¿e scalar model of Section 2.2 is augmented by dierentiating between the gainexerted on the parallel and on the orthogonal components of the signal with respect to thepump. Fig. 4.1 shows the parallel дR and the orthogonal д⊥R Raman gain coecients forsilica bers. As it can be seen, the gain induced on the component of the signal orthogonalto the pump is much smaller than that on the parallel. ¿e coecient µ in Eqs. 4.3, alsocalled the depolarization ratio, is the ratio between the orthogonal and parallel Ramangain coecients:
µ =д⊥RдR
. (4.5)
For silica bers, an accepted value of the depolarization ratio of the Raman peak is µ =0.012 [149], [150]. Near the peak, µ is generally lower than 0.05 [151].
¿e vectorsWp andWs in Eqs. 4.3 take into account for the NPR and are given by
Wp =2
3[γppP3 + 2γps(1 + δb)S3 − γps(2 + δa + δb)S] , (4.6a)
Ws =2
3[γssS3 + 2γsp(1 + δb)P3 − γsp(2 + δa + δb)P] . (4.6b)
¿e terms comprising γpp and γss are the self-phase modulation (SPM)-induced NPR,whereas those associated with γps and γsp describe the cross-phase modulation (XPM)-induced NPR; the parameters δa and δb are related to the delayed nonlinear Ramanresponse [149], [152], [153].
¿e vectors ωpb and ωsb describe the birefringence of the ber at the frequency ωp
38

4.3. ANALYSIS AND CHARACTERIZATION
and ωs, respectively; the matrix M in Eq. (4.3b) is given by Galtarossa et al. [19]:
M =⎛⎜⎝1 0 00 1 00 0 −1
⎞⎟⎠ . (4.7)
Actually, M accounts for the fact that P is backward-propagating with respect to thesignal [19], which has not been considered in the original model of Lin and Agrawal [149].
Finally, for a ber of length L, the system of Eqs. 4.3 is constrained by the followingtwo boundary conditions:
S(z = 0) = Sin , (4.8a)
P(z = L) = Pin , (4.8b)
where Sin is the Stokes vector of the input signal at z = 0 and Pin is the input pump enteringat the opposite end of the ber at z = L.
4.3 Analysis and characterization
¿is section, based on the publications [P.3] and [C.2], reports the analysis obtained bynumerically solving the system Eqs. 4.3 and by performing statistical evaluations.
¿e parameters of the counter-propagating FRAs are dened as follows. ¿e wave-length of the signal is set in the C band at λs = 1550nm. Consequently its angular frequencyis ωs = 2πc/λs with c being the speed of light in vacuum. ¿e frequency of the pumpis ωp = ωs + ΩR by ΩR = 2π fR, fR = 13.2THz, yielding λp = 1451 nm. ¿e attenua-tion coecients for the signal and for the pump are, respectively, αs = 0.200dBkm−1
and αp = 0.273dBkm−1. ¿e Raman gain coecient at the signal frequency ωs is дR =0.60W−1 km−1 [19], [22], [33], [P.3], [52], [149], [154] and the depolarization ratio is µ =0.0118 [19], [22], [33], [P.3], [52], [149], [154].
For the purpose of the present analysis, the parameters δa and δb in Eqs. 4.6, relatedto the delayed nonlinear Raman response [149], [152], [153], can be neglected [149], [152]–[156]. ¿erefore δa = δb = 0 and Eqs. 4.6 can be simplied to
Wp =2
3[γppP3 + 2γps(S3 − S)] , (4.9a)
Ws =2
3[γssS3 + 2γsp(P3 − P)] , (4.9b)
where the coecients for the SPM- and for the XPM-induced NPR are γpp = γps =1.24W−1 km−1 and γss = γsp = 1.06W−1 km−1, respectively.
As described in Appendix D, it can be reasonably assumed that standard SMFs do notpresent circular birefringence [157]–[161]. ¿erefore the random linear birefringence canbe accounted by the vector
b =⎛⎜⎝b1b20
⎞⎟⎠ , (4.10)
39

4. NONLINEAR POLARIZATION ATTRACTION IN FIBER RAMAN AMPLIFIERS
which can be described by the random modulus model (RMM) [160] (see Appendix D.1).¿e PMD coecient (PMDc) DP at the signal frequency ωs is given by
DP =2√2πLC
ωsLB
√L(e− L
LC +
L
LC
− 1) 1
2
, (4.11)
where LC and LB are, respectively, the correlation and the beat lengths.¿e nonlinear system of Eqs. 4.3 with the two boundary conditions given by Eqs. 4.8 is
solved by a shooting algorithm [162], whereas the numerical integration is performed by afourth-order Runge-Kutta (RK4) method, with a variable step size in the order of 10mmand sucient to follow the local birefringence variations. More details on the RK4methodand on the shooting technique can be found in Appendix E.
For a single ber birefringence realization, the gain G and the DOPD of the outputsignal
Soutdef
= S(z = L) (4.12)
are dened as
G = ⟨Sout0 ⟩sops/Sin0 , (4.13a)
D = ∥⟨Sout⟩sops∥/⟨Sout0 ⟩sops , (4.13b)
where the average ⟨⋅⟩sops is taken over 100 signal input random SOPs uniformly distributed
on the Poincaré sphere. Eventually, the mean gain G and the mean DOPD are estimatedas
G = ⟨G⟩bers , (4.14a)
D = ⟨D⟩bers , (4.14b)
where the average ⟨⋅⟩bers is taken over a large statistical ensemble of ber birefringencerealizations.
Fig. 4.2 shows various Poincaré spheres for the signal SOPs evolution along one berrealization, with length L = 2 km and PMDc DP = 0.05ps km−1/2. ¿e signal and thepump input powers are, respectively, Sin0 = 1mW and Pin
0 = 8W, and the pump inputSOP is pin = (1, 0, 0)T . Fig. 4.2(a) shows the initial conguration of the signal SOPsentering the ber, whereD = 0.01 indicates a depolarized signal. As the signal propagatestoward the input pump at z = L, both the gain G and the DOPD increase, as it can beseen in Fig. 4.2(b)–(f). ¿e reduction of the spread of the SOPs indicates that the SOPsare attracted toward a common point. In fact, as it will be explained later, the SOPs areattracted toward the pump SOP.¿e pump SOP p(z), however, evolves along the ber dueto the random birefringence. Only at z = 2 km, i.e. at the output of the ber (Fig. 4.2(f)),the signal SOPs are clearly attracted toward the pump input SOP pin = (1, 0, 0)T .4.3.1 ¿e role of pump depletion
When analyzing FRAs, it is a common, and o en justied, practice to assume that theinput power of the signal is much lower than that of the pump:
Sin0 ≪ Pin0 . (4.15)
40

4.3. ANALYSIS AND CHARACTERIZATION
z = 0kmG = 0dBD = 0.01
a)
S1 S2
S3
z = 0.8kmG = 8.0dBD = 0.51
b)
S1 S2
S3
z = 1.1 kmG = 11.4dBD = 0.65
c)
S1 S2
S3
z = 1.4kmG = 14.9dBD = 0.74
d)
S1 S2
S3
z = 1.7 kmG = 18.9dBD = 0.84
e)
S1 S2
S3
z = 2 kmG = 23.0dBD = 0.91
f)
S1 S2
S3
0
5
10
15
20
25
Sign
aloutputpower
Sout
0[dBm]
Figure 4.2: Poincaré spheres of the signal SOPs along one ber realization. ¿e ber lengthis L = 2 km and the PMDc is DP = 0.05ps km−1/2. ¿e signal and pump input power are,respectively, Sin0 = 1mW and Pin
0 = 8W, and the pump input SOP is pin = (1, 0, 0)T .¿is assumption lead to the so-called undepleted pump approximation, i.e. the pump isconsidered to be unaected by the signal as it propagates along the ber. ¿e undepletedpump approximation can be applied to the model of Eqs. 4.3 by substituting Eq. (4.3b)with the following equation for the evolution of the pump [19]:
dP
dz= αpP − (Mωpb +
2
3γppP3) × P , (4.16)
where the dependence on the signal S has been dropped. ¿e system of Eq. (4.16)and Eq. (4.3a) can be directly integrated using the RK4 method only.
Fig. 4.3 shows the evolution of the gain G and of the DOPD along the same berrealization and with the same pump parameters of Fig. 4.2. Circles, triangles and squaresrefer, respectively, to a signal input power Sin0 of 100mW, 1mW and 10 µW. Solid curvesrefer to the solution obtained solving the complete model of Eqs. 4.3, whereas dashedcurves refer to the undepleted pump approximation of Eq. (4.16). In particular, solidcurves with triangles refer to the Poincaré spheres of Fig. 4.2. As it can be seen in Fig. 4.3,in the undepleted pump approximation the DOP and the gain do not depend on the signalpower due to the decoupling of the pump from the signal Moreover, the complete modelperforms better in repolarizing the signal even if the gain is lower (circles). For low signalpowers (triangles and squares), the behavior of the gain and of the DOP is similar andboth increase as the signal propagates toward the input pump. In this case, at the endof the ber, the gain prediction by the approximated model is about 5 dB lower whencompared to the full model, and the output DOP is less than half.
41

4. NONLINEAR POLARIZATION ATTRACTION IN FIBER RAMAN AMPLIFIERS
0 0.2 0.4 0.6 0.8 1 1.2 1.4 1.6 1.8 20
5
10
15
20
25
0
0.2
0.4
0.6
0.8
1
Propagation length z [km]
GainG[dB]
DOPD
complete model
undepleted pumpapproximation
Sin0[dBm]+200-20
Figure 4.3: Evolution of the gain G and of the DOPD of the signal along the ber for onebirefringence realization. ¿eber length is L = 2 kmand the PMDc isDP = 0.05ps km−1/2.¿e pump input power is Pin
0 = 8W, and the pump input SOP is pin = (1, 0, 0)T . Cir-cles, triangles and squares refer, respectively, to a signal input power Sin0 of 100mW,1mW and 10 µW. Solid curves refer to the solution obtained solving the completemodel of Eqs. 4.3, whereas dashed curves refer to the undepleted pump approximationof Eq. (4.16).
42

4.3. ANALYSIS AND CHARACTERIZATION
10−5 10−4 10−3 10−2 10−10
0.2
0.4
0.6
0.8
1
PMD coecient DP [ps km−1/2]
MeanDOPD
complete model
undepleted pump
approximation
1
2
3
4
5
6
7
8
9
10
Pin 0[W
]
Figure 4.4: Mean signal output DOP as a function of the PMD coecient DP . ¿e signalinput power is Sin0 = 1mW and the pump input SOP is pin = (1, 0, 0)T . Dierent colorsencode dierent pump input power Pin
0 in the range from 1W to 10W. Reprinted from [P.3]© 2011 IEEE.
¿erefore, when dealing with polarization, the undepleted pump approximation doesnot always give correct results. ¿e positive inuence of depletion can be explainedconsidering the following term in Eqs. 4.3:
ρ = S0P + P0S = P0S0(p + s) = ρ0ρ , (4.17)
which describes parallel Raman gain for the signal S and acts as Raman depletion forthe pump P. In fact, ρ acts in exactly the same way both on the pump and on the signalpolarizations, forcing them to evolve toward the common direction ρ. For the signal at theoutput of the ber it holds p(z = L) = pin; therefore ρ(z = L) = P0S0(pin + sout) and sout
is forced to converge toward pin as P0 is maximum at its input, and S0 is being amplied.Fig. 4.4 shows the mean DOP of the output signal as a function of the PMDc DP for a
ber long L = 2 km. ¿e signal input power is xed at Sin0 = 1mWwhereas the pump inputpower Pin
0 is varied from 1W to 10W. ¿e pump has a linear input SOP pin = (1, 0, 0)T .Solid curves with circles refer to the complete model of Eqs. 4.3, whereas dashed curveswith triangles refer to the undepleted pump approximation of Eq. (4.16), achieved byneglecting the signal contributions. In the complete model, for a xed pump power theDOP is almost constant both for the very low (DP ≤ 10−4 ps km−1/2) and the moderately-high (DP ≥ 10−2 ps km−1/2) PMD regimes.
For very low PMD, high DOP (D > 0.9) is achieved for pump input powers higherthan 3W. In this region the eect of the birefringence is negligible and the ber can beconsidered isotropic. Moreover, in this PMD regime the results are in agreement withthose obtained in the undepleted pump approximation.
For increasing PMD, as it will be explained in Section 4.3.2, random birefringence
43

4. NONLINEAR POLARIZATION ATTRACTION IN FIBER RAMAN AMPLIFIERS
1 2 3 4 5 6 7 8 9 100
20
40
60
80
100
0
0.2
0.4
0.6
0.8
1
Fiber length L [km]
Meangain
G[dB]
MeanDOPD
gain
DOP
Sin0
−10 dBm0 dBm
+10 dBm+20 dBm
Figure 4.5: Mean signal output DOPD and gain G as a function of the ber length L, witha PMD coecient DP = 0.05ps km−1/2. ¿e pump input power is Pin
0 = 8W with SOPpin = (1, 0, 0)T . Triangles, circles, squares and diamonds refer to signal input power Sin0of 0.1mW, 1mW, 10mW and 100mW, respectively. Reprinted from [P.3] © 2011 IEEE.
reduces the eective Raman gain [149], lowering the DOP. In the moderately-high PMDregime, however, the results severely dier between the two models. Actually, if theundepleted regime is considered the achievable DOP drastically decreases. ¿is is inagreement with the analysis performed by Kozlov et al. [24], [21] made in the undepletedpump approximation. ¿e complete model, instead, gives better results, andD > 90% canstill be reached for pump power higher than 8W.
¿erefore, it is worthwhile remarking that in the moderately-high PMD regime pumpdepletion plays a crucial role. Note also that this eect is visible only for moderately-highPMD, because only in this regime Raman attraction is hampered by ber birefringence.However, for the same reason, in this PMD regime counter-propagating attraction per-forms better than co-propagatingRaman attraction, as it is evident upon comparing Fig. 4.4with Fig. 1(d) of Ursini et al. [22]. Indeed, in co-propagation the term ρ acts on pumpand signal with opposite signs (see Eqs. (1) and (2) of Ref. [22]), therefore hamperingpolarization attraction.
Fig. 4.5 shows the mean signal output DOPD and gain G as a function of the berlength L, for DP = 0.05ps km−1/2 and for four dierent signal input powers Sin0 . ¿e inputpump power is Pin
0 = 8W with SOP pin = (1, 0, 0)T . For low signal input powers (trianglesand circles) the DOP saturates, whereas for higher powers (squares and diamonds), theDOP reaches a maximum and then decreases for increasing ber length. It may be notedthat such a local maximum occurs when the gain G is almost compressed to a lower value.In this condition, an increase of the ber length does not increase signicantly Ramanamplication and attraction; whereas on the other hand, the increased ber length Lenhances the scrambling eect of PMD, worsening the DOP, as it will be explained
44

4.3. ANALYSIS AND CHARACTERIZATION
in Section 4.3.2. Clearly the lower the compression value of the gain, the stronger thiseect.
4.3.2 Eects of polarization-mode dispersion
As explained above, the vector b account for the random birefringence of the ber. ¿eeect of PMD can be analyzed by considering the diusion length LD, dened as [52]:
LD =3(DP∆Ω)2 , (4.18)
where ∆Ω = ωp + ωs is the relative frequency between the counter-propagating signal andpump [52], [149], i.e. due to the counter-propagation the relative frequency is given by thesum¹ of the optical frequencies of the pump and of the signal.
Actually, Eq. (4.18) describes the distance a er which the SOPs of the pump and ofthe signal become uncorrelated. If the diusion length is much shorter than the eectivelength² Le of the ber,
LD ≪ Le , (4.20)
then, due to the high relative velocity, the Raman gain coecient as seen by the signal isaveraged as follows [149], [163]:
дavgR =
дR + д⊥R2
≈дR2. (4.21)
Fig. 4.6 shows the mean gain G as a function of the length of the ber L and forfour dierent signal input powers Sin0 . ¿e input pump power is Pin
0 = 8W with linearSOP pin = (1, 0, 0)T . ¿e PMDc of the bers is DP = 0.05ps km−1/2. ¿e correspondingvalue of the diusion length given by Eq. (4.18) is LD ≈ 0.2m, which satises the abovecondition Eq. (4.20). ¿erefore the expected Raman coecient for the signal is givenby Eq. (4.21). In Fig. 4.6 solid curves refer to the complete model of Eqs. 4.3, whereas thedashed curves refer to the scalar model developed by Santagiustina [164], which givesexact, although integral, solutions for the gain considering pump depletion³. ¿e halvedRaman coecient д
avgR = дR/2 has been used only for the scalar model.
As it can be seen, the gain given by the scalar model always underestimate the gainobtained by solving the vector model. However, the two models agree quite well for longbers, where as previously seen, the eect of attraction is hampered by PMD (see Fig. 4.5).
For short bers, instead, the attraction process reduces the averaging eect of PMD,because the signal SOP s evolves with ρ and thus p. ¿erefore, the eective Ramancoecient as seen by the signal is higher than д
avgR given in Eq. (4.21).
Moreover, also the results regarding the pump depletion are in agreement between thetwo models.
¹If co-propagation is considered, then ∆Ω = ωp − ωs .²¿e eective length Leff of the ber is dened as [52]:
Leff =1
Pin0
∫L
0
P0(z)dz ≈ 1 − e−αpL
αp
, (4.19)
where the approximation is valid for the scalar case in the undepleted pump approximation [52].³Another solution for the gain in counter-propagating FRAs, but without considering pump depletion,
can be found in [165]. In the case of co-propagating FRAs, solutions considering pump depletion can befound in [164], [166].
45

4. NONLINEAR POLARIZATION ATTRACTION IN FIBER RAMAN AMPLIFIERS
1 2 3 4 5 6 7 8 9 10−20
0
20
40
60
Fiber length L [km]
Meansign
algain
G[dB]
vectormodel
scalarmodel
Sin0[dBm] -10 0 10 20
pumpdepletion
Figure 4.6: Mean signal gain G as a function of the ber length L, with PMD coe-cient DP = 0.05ps km−1/2. ¿e pump input power is Pin
0 = 8W with SOP pin = (1, 0, 0)T .Triangles, circles, squares and diamonds refer, respectively, to signal input power Sin0of 0.1mW, 1mW, 10mW and 100mW. Solid lines refer to the complete model of Eqs. 4.3,whereas dashed curves refer to the scalar model of [164]. ¿e curves at the bottom refer tothe pump depletion.
46

4.3. ANALYSIS AND CHARACTERIZATION
10−5 10−4 10−3 10−2 10−10
0.2
0.4
0.6
0.8
1
PMD coecient DP [ps km−1/2]
MeanDOPD
pin = (1, 0, 0)T
pin = (0, 0, 1)T
pin = 2−1/2(1, 0, 1)T
1
2
3
4
5
6
7
8
9
10
Pin 0[W
]
Figure 4.7: Mean signal output DOPD as a function of the PMD coecient DP for threedierent pump input SOPs pin. ¿e signal input power is Sin0 = 1mW. Dierent colorsencode dierent pump input power Pin
0 in the range from 1W to 10W.
4.3.3 Performance and limits
In Fig. 4.7 it is shown the mean DOP of the output signal as a function of the PMDcDP for a ber long L = 2 km. ¿e signal input power is xed at Sin0 = 1mW whereas thepump input power Pin
0 is varied from 1W to 10W. Circles, diamonds and triangles refer,respectively, to a linear (pin = (1, 0, 0)T), a right-handed circular (pin = (0, 0, 1)T) and anelliptical (pin = 2−1/2(1, 0, 1)T) pump input SOP. ¿e data for the linear case are the samepresented above in Fig. 4.4. As it can be seen, for a xed pump conguration the DOPis almost constant both for the very low and the moderately-high PMD regimes, as seenin Fig. 4.4.
Remarkably, in the moderately-high PMD regime the averaging eect of the randombirefringence render the output DOP independent of the pump input SOP. Note thatfor the power levels considered here, the Kerr contributionsWp and Ws are negligiblecompared with ber birefringence.
In the low PMD regime, instead, the repolarization eciency depends on the pumpSOP. In this regime LD > 47km and therefore the condition of Eq. (4.20) is not satised.In this case the signal is subjected to higher Raman gain. ¿e dierence for the dierentpump SOPs may be attributed to residual Kerr eect ofWp andWs which, for this PMDregime, are not negligible with respect to the birefringence vector b. However, it worth tonote that such a low value of PMD is not realistic for standard SMFs.
Fig. 4.8 shows the mean of the angle θ between the mean signal output SOP, ⟨sout⟩sops,and the pump input SOP, Mpin, dened analogously to the denitions ofD and G given
47

4. NONLINEAR POLARIZATION ATTRACTION IN FIBER RAMAN AMPLIFIERS
1 2 3 4 5 6 7 8 9 100
2
4
6
8
10
12
14
Fiber length L [km]
Meanangleθ[deg]
Sin0
−10 dBm0 dBm
+10 dBm+20 dBm
Figure 4.8: Mean signal-pump angle θ as a function of the ber length L, with a PMDcoecient DP = 0.05ps km−1/2. ¿e pump input power is Pin
0 = 8W with SOP pin =(1, 0, 0)T . Triangles, circles, squares and diamonds refer to signal input power Sin0 of 0.1mW,1mW, 10mW and 100mW, respectively. Reprinted from [P.3] © 2011 IEEE.
in Eqs. 4.14:
θ = arccos(⟨sout⟩sops ⋅Mpin) , (4.22a)
θ = ⟨θ⟩bers . (4.22b)
Actually, θ indicates that eectively the signal, when attracted, is attracted toward the pump,thus overcoming the unpredictability of co-propagating schemes [22]. Results almostidentical to those presented in Fig. 4.8 have been obtained also for circular (pin = (0, 0, 1)T)and elliptical (pin = 2−1/2(1, 0, 1)T) pump input SOPs, conrming the independence onthe pump input SOP.
Fig. 4.9 shows the signal output mean DOP D as a function of the mean gain G.¿e four curves with marks are the same presented in Fig. 4.5. Stars are obtained byvarying the parameters in such a way to prevent gain compression: the ber length L inthe range from 1 km to 10 km, the pump input power Pin
0 in the range from 1W to 5Wand the signal input power Sin0 in the range from 0.01mW to 1mW. ¿e pump input SOPis pin = (1, 0, 0)T .
¿e data have been empirically interpolated by the following function [P.3]:
D = 1 − e−GdB/Γ , (4.23)
where GdB = 10 log10G and Γ ≈ 10.2 (solid curve in Fig. 4.9). Only recently, Kozlov et al.[29], [147] have analytically calculated the relationship between the DOP and the meangain, G, in the case of standard or high PMD through a simplied theoretical model,
48

4.3. ANALYSIS AND CHARACTERIZATION
0 5 10 15 20 25 30 35 40 45 500
0.2
0.4
0.6
0.8
1
Mean gain G [dB]
MeanDOPD
Sin0[dBm]-100+10+20
1.001.47
2.15
3.16
4.64
6.81
10.00
Fiber
lengthL[km]
Figure 4.9: Mean signal DOP D as a function of the gain G, for a PMDc DP =
0.05ps km−1/2. ¿e four curves with marks are the same of Fig. 4.5. Stars are obtained byvarying ber length L in the range from 1 km to 10 km and pump (signal) input power Pin
0
(Sin0 ) in the range from 1W to 5W (0.01mW to 1mW). Pump input SOP is pin = (1, 0, 0)T .¿e solid curve is given by Eq. (4.23), whereas the dashed curve is obtained using Eq. (4.24).Reprinted from [P.3] © 2011 IEEE.
49

4. NONLINEAR POLARIZATION ATTRACTION IN FIBER RAMAN AMPLIFIERS
10−5 10−4 10−3 10−2 10−12
4
6
8
10
12
PMD coecient DP [ps km−1/2]
Γ
Figure 4.10: Coecient Γ as a function of the PMDc DP. ¿e pump input power isPin0 = 3W with SOP pin = (1, 0, 0)T . ¿e signal input power Sin0 is varied in the rangefrom 0.01mW to 1mW, while ber length L varies from 1 km to 8 km. Reprinted from [P.3]© 2011 IEEE.
according to which [29], [147]
D = 1 − 4(1 +√1 + 8G)−1 . (4.24)
¿is curve is also shown in Fig. 4.9 (dashed curve) together with Eq. (4.23) (solid curve).Clearly there is a good agreement between the two expressions.
Both functions provide a good estimate, except for those points corresponding to thealmost compressed gain regime shown in Fig. 4.5 and discussed above. Actually, Eq. (4.23)and Eq. (4.24) provide an estimate of the expected output DOP for a given mean gainG, or, conversely, they provide the required gain to reach a desired DOP. ¿at specicgain can be obtained by appropriately choosing the ber length, the signal and the pumpinput powers in such a way that the gain does not compress. For instance, in the casepresented in Fig. 4.9, where the bers have DP = 0.05ps km−1/2, which is a common valuefor standard bers, in order to have aD > 0.9, an uncompressed gain of about 25 dB isrequired at least.
It is however important to emphasize that Eq. (4.23) and Eq. (4.24) provide only anupper bound to the achievable DOPD for a given gainG. Actually, the attained DOPmaybe lower if the FRA is operated in a condition of gain compression, as previously seen.
Finally, Fig. 4.10 shows how the coecient Γ of Eq. (4.23) varies with the PMDc DP.Fig. 4.10 has been obtained by repeating the analysis of Fig. 4.9 for dierent values ofber L, correlation LC and beat LB lengths, and pump Pin
0 and signal Sin0 input powers,chosen in such a way to prevent gain compression.
Note in particular that Γ is almost constant in the very low and in the moderately-highPMD regimes, similarly to the DOPD in Fig. 4.7. Moreover, the analysis of Kozlov et
50

4.4. EXPERIMENTAL CHARACTERIZATION
FUT
1 2
3
OCi OI
SinPin
EDFAFPCFIBER
LASER
PUMP
ECL VOA
POLARIZATION
SCRAMBLER
SIGNAL
QWP LP
OSA
RECEIVER
Sout
Figure 4.11: Experimental setup for the analysis of NPA in FRAs. ECL: external cavity laser;VOA: variable optical attenuator; OI: optical isolator; FPC: ber polarization controller;EDFA: erbium-doped ber amplier; FUT: ber under test; OCi: optical circulator; QWP:quarter-wave plate; LP: linear polarizer; OSA: optical spectrum analyzer.
al. [29] is in agreement with the values of Γ in the two PMD regimes. It is worthwhile tonote that for PMDc values larger than about 0.005 ps km−1/2, i.e. for all existing SMFs, Γ ispractically a constant.
4.4 Experimental characterization
¿e rst experiment related to NPA in FRAs is due to Martinelli et al. [18], where signalrepolarization was observed in the case of a co-propagating FRA. Recently, Morin et al.[30] demonstrated simultaneous NPA and Raman amplication in a counter-propagatingsetup, but in their conguration the NPA was mostly driven by the Kerr eect.
¿is section presents the results, based on the publication [P.2], of the experimentalcharacterization of purely Raman-based polarization attraction in SMFs aimed to verifythe relationship between DOP and the gain given by Eq. (4.24). Ultimately, the dierencebetween the Raman-assisted Kerr-based NPA and the purely Raman-based NPA laysin the power levels of the pump and of the signal, which are comparable in the formercase [30] and very dierent in the latter [29], [P.3], [147].
4.4.1 Experimental setup
¿e experimental setup is shown in Fig. 4.11. ¿e pump source is realized by a tunable berlaser, a ber polarization controller (FPC) and a variable-gain high-power erbium-dopedber amplier (EDFA). ¿is pump source, described in detail in Section 3.1, is tunable inthe C band providing Raman amplication for signals in the U band; it has a linewidth ofabout 0.1 nm and DOPD = 0.99. Pumping in the C band permits to have wider exibility
51

4. NONLINEAR POLARIZATION ATTRACTION IN FIBER RAMAN AMPLIFIERS
in the pump due to the higher availability of devices. ¿e broad linewidth increases thethreshold of SBS and therefore decreases the induced pump depletion [81].
¿e gain of the EDFA can be varied, enabling the selection of the pump power Pin0
injected into the ber in the range between 20 dBm and 35 dBm. In order to increase theeciency and to reduce the noise, the wavelength of the pump is set to λp = 1541 nm tooperate at the maximum of the gain of the EDFA.
¿e signal is generated by an external cavity laser (ECL) and its power Sin0 can bevaried through a variable optical attenuator (VOA) from −30 dBm to 0 dBm. For a Raman
frequency shi of fR = 13.2THz the corresponding gain peak is at about c( fp − fR)−1 ≈1650nm ( fp = c/λp). However, due to limits in the operating range of the ECL, the signalis transmitted at λs = 1640nm. Consequently the eciency of SRS is slightly reducedfrom the maximum. ¿e signal polarization scrambler, analyzed in detail in Appendix C,is a fast four-channel ber-squeezer polarization controller driven by four statisticallyindependent random signals. ¿e resulting rate of the random scrambling of the signalSOP is about 20 kHz.
¿e SOP of the amplied signal Sout, emerging from the FRA, is measured and ana-lyzed by a rotating quarter-wave plate (QWP) polarimeter. ¿e polarimeter, describedin Appendix B, is composed by a rotating QWP followed by a xed linear polarizer (LP)and an optical spectrum analyzer (OSA). An OSA-based setup permits the measurementof the average SOP over the time and over a suitable bandwidth centered at the signalwavelength λs. In this way the amplied spontaneous emission (ASE) induced by theRaman amplier can be monitored and controlled. ¿is is necessary because for somecombinations of the signal and the pump input powers the ASE can become non-negligible.¿e SOP of the received signal Sout is determined by measuring the spectra transmitted bythe linear polarizer for ve dierent orientations of the QWP [167].
In previous experiments of NPA, the rate at which the output SOP is measured is fasterthan the rate at which the input SOP is scrambled [18]. In this way, the instantaneous SOPof the transmitted signal is measured, and the DOP is numerically evaluated by averagingthe measured SOPs. Instead, the OSA-based approach permits to directly measure themean SOP ⟨Sout⟩sops. ¿eOSA acquisitions are slowed down to about 5 s per wavelength byincreasing the averaging time. Recalling that the input SOP is scrambled at about 20 kHz,the above procedure is roughly equivalent to averaging the output SOP over some 105
random input SOPs. More details are given in Appendix C.
4.4.2 Results
¿e DOP and the mean gain G of the transmitted signal have been measured for dierentsignal (Sin0 ) and pump (P
in0 ) input powers, over four links made of G.655 ber bobbins,
with dierent lengths L and dierent PMDc DP. Results and link parameters are shownin Fig. 4.12, where the pump and the signal input powers are encoded in colors andmarkers, respectively, as detailed in the legend of the gure. ¿e solid lines connect pointscorresponding to the same signal input power, whereas the dashed curves represent thetheoretical result given by Eq. (4.24). ¿e DOP of the input signal was about 0.05, asshown by the points corresponding to Pin
0 = ‘‘o ’’.
Fig. 4.12(a), in particular, refers to the data measured on the 2.90 km ber link. Clearly,as the pump power is increased, the gain increases and so does correspondingly the
52

4.4. EXPERIMENTAL CHARACTERIZATION
0
0.2
0.4
0.6
0.8
1a)
L = 2.90kmDP = 0.039ps km−1/2
DOPD
b)
L = 5.67kmDP = 0.022ps km−1/2
−5 0 5 10 15 20 25 30 350
0.2
0.4
0.6
0.8
1c)
L = 8.00kmDP = 0.014ps km−1/2
Gain G [dB]
DOPD
−5 0 5 10 15 20 25 30 35
d)
L = 14.70kmDP = 0.018ps km−1/2
Gain G [dB]
o 24 27 29 30 31 32 33 34 35
Pin
0[dBm]
0 -10 -20 -25
Sin0[dBm]
Figure 4.12: Measured DOP D as a function of the gain G for dierent pump (Pin0 )
and signal (Sin0 ) input powers, and for four dierent link lengths L: (a) L = 2.90km(DP = 0.039ps km−1/2), (b) L = 6.57 km (DP = 0.022ps km−1/2), (c) L = 8.00km (DP =
0.014ps km−1/2), (d) L = 14.70km (DP = 0.018ps km−1/2). Dashed curves refer to Eq. (4.24).Reprinted from [P.2] © 2012 OSA.
53

4. NONLINEAR POLARIZATION ATTRACTION IN FIBER RAMAN AMPLIFIERS
0
0.2
0.4
0.6
0.8
1a)
Sin0= 0dBm
DOPD
b)
Sin0= −10 dBm
−5 0 5 10 15 20 25 30 350
0.2
0.4
0.6
0.8
1c)
Sin0= −20dBm
Gain G [dB]
DOPD
−5 0 5 10 15 20 25 30 35
d)
Sin0= −25dBm
Gain G [dB]
o 24 27 29 30 31 32 33 34 35
Pin
0[dBm]
2.90 5.67 8.00 14.70
L [km]
Figure 4.13: Measured DOPD as a function of the gain G for dierent pump input powersPin0 and link lengths L, and for four dierent signal input powers Sin0 : (a) S
in0 = 0dBm,
(b) Sin0 = −10 dBm, (c) Sin0 = −20dBm, (d) S
in0 = −25dBm. Dashed curves refer to Eq. (4.24).
Reprinted from [P.2] © 2012 OSA.
DOP. Noticeably, the relationship betweenD and G is in very good agreement with thetheoretical result and almost independent of the signal input power. As the ber lengthis increased, higher gain and DOP can be achieved, but the relationship between thetwo tends to deviate from the theoretical prediction. ¿is is due to the eect of gaincompression discussed in Section 4.3. For G < 5dB the DOP is higher than the theoreticalupper bound. ¿is eect is due to ber losses which can contrast Raman gain, but, beingscalar in nature, have no direct eect on repolarization. As a result, even if the overall gainmay be not large enough to overcome losses, there still is a local polarization attractionthat contributes to an overall small repolarization. Note that the model in [29], [147] doesnot account for losses, and the analysis of Section 4.3 has not fully explored the case of lowgain. Indeed, the upper bounds given by Eq. (4.23) and Eq. (4.24) should be consideredvalid only for high gain.
¿e same data shown in Fig. 4.12 are rearranged dierently in Fig. 4.13. In this caseeach graph refers to a specic signal input power, markers encode ber lengths, solid linesconnect points for increasing ber length and colors still encode pump input power asin Fig. 4.12. It is now clear that for a given signal input power and a given pump input power,as the ber length is increased both gain and DOP increase in agreement with Eq. (4.24),
54

4.5. CONCLUSIONS
but if the length is further increased, the condition of gain compression may be achieved,worsening the performance of the polarization attraction. ¿e experimental data conrms,however, that Eq. (4.24) (and Eq. (4.23)) represents an upper bound to the signal DOP thatcan be achieved by exploiting the Raman-based NPA, for a given Raman mean gain G.
4.5 Conclusions
In this chapter, the polarization evolution of signal and pump in counter-propagatingrandomly birefringent FRAs has been modeled and analyzed, including the eects ofNPR, pump depletion and orthogonal Raman gain. It has been shown that even for amoderately-high birefringent ber the counter-propagating scheme is eective in attractingthe signal output SOP toward the input pump SOP, achieving a DOP whose maximumis a function of the signal gain. Moreover, it has been shown that for moderately-highPMD, pump depletion plays a key role in signal repolarization, to the extent that in thisregime counter-propagation performs better than co-propagation. A simple empiricalrule, namely Eq. (4.23), lately theoretically demonstrated by Kozlov et al. [29], [147](see Eq. (4.24)), has been presented, which allows a straightforward sizing of the FRA inorder to achieve the requested DOP.
Finally, a detailed experimental characterization of the analysis of purely Raman-basedNPA given in Section 4.3, has been reported in Section 4.4. By measuring the DOP andthe Raman mean gain G of the transmitted signal, for dierent combinations of the pumpand the signal input powers, and for dierent ber link lengths, the relations between themaximum DOP and the mean gain G, as given by Eq. (4.23) and Eq. (4.24), have beenvalidated.
Concluding, in order to use FRAs as ecient Raman polarizers, short ber lengths andhigh power pumps should be preferred to prevent gain compression and the consequenteciency reduction.
55

Chapter5Conclusions
ei π +1 = 0
Leonhard Paul Euler
1707 – 1783
The focus of this thesis has been the all-optical signal generation and processingthrough nonlinear amplication phenomena in single-mode bers. Part of thethesis has been devoted to nonlinear ber optical oscillators and part has been
dedicated to nonlinear polarization attraction in ber Raman ampliers.In the rst part, three dierent nonlinear ber optical oscillators have been investi-
gated and experimentally demonstrated. First, a continuous-wave pump for ber Ramanampliers has been presented and discussed. Developed with the goal of achieving highdegree of polarization, tunability and suppression of stimulated Brillouin scattering, it hasbeen used to obtain nonlinear polarization attraction in ber Raman ampliers. One ofthe main feature of this ber laser is the higher eectiveness in increasing the thresholdof stimulated Brillouin scattering with respect to other suppression methods reported inthe literature. ¿en, a fast and widely tunable ber optical oscillator based on stimulatedRaman scattering and on broad- and narrow-band ber optical parametric amplica-tion, each one dominating in a dierent spectral region, has been demonstrated andcharacterized. ¿e time-dispersion-tuning technique permitted to select among the threeamplication regimes, and a tuning range of 160 nm has been achieved with a sensitivityof about 23 nmkHz−1 and an estimated sweep speed of about 0.4 nm µs−1. Finally, throughthe same time-dispersion-tuning method, a fast tunable optical frequency comb, realizedexploiting cascaded four-wave mixing in the broad-band ber optical parametric ampli-cation regime, has been obtained by using a single pump, avoiding the limitations inspectral purity and frequency and phase stability given by double pump systems.
In the other part, the control of the state of polarization and of the degree of polarizationthrough nonlinear polarization attraction in counter-propagating ber Raman ampliersin standard, randomly birefringent, single-mode bers has been studied, analyzed andcharacterized. ¿e analysis included the eects of pump depletion, nonlinear polarizationrotation and orthogonal Raman gain, and showed that counter-propagating ber Ramanampliers are eective in attracting the signal toward a predetermined state of polarizationsettled by the pump input state of polarization. Moreover, the key role of pump depletionin achieving signal repolarization in bers withmoderately-high polarization-mode disper-sion have been discussed, showing that in this regime counter-propagation performs better
57

5. CONCLUSIONS
than co-propagation. ¿e performances and the limits of repolarization eciency havebeen determined, leading to a quantitative relationship between the degree of polarizationand the gain of the ber Raman amplier. ¿is relationship represents an upper-boundon the maximum achievable degree of polarization, and allows a straightforward designof a ber Raman amplier in order to achieve a requested degree of polarization. ¿echaracterization showed that in order to use ber Raman ampliers as ecient Ramanpolarizers, short ber lengths and high power pumps should be preferred to prevent gaincompression and the consequent eciency reduction.
Issues and possible solutions have been presented and proposed.
5.1 Future research
¿e tunable continuous-wave pump, described in Section 3.1, has been developed with thegoal of achieving stimulated Brillouin scattering suppression in ber Raman ampliers, andmore specically to realize nonlinear polarization attraction in the U band (from 1625 nmto 1675 nm). Polarization attraction could be achieved, in theory, in any spectral regionwhere the stimulated Raman scattering eect can be eciently obtained by modifying thewavelength of the pump. In this case it is necessary to nd alternative methods to generatesuch type of pump. For instance, a pump in the U band could be generated through asimilar setup but using thulium-doped bers, and, more important, research eorts arebeing spent also to achieve ecient amplication in the E and S bands (from 1360 nmto 1460 nm and from 1460 nm to 1530 nm, respectively), which is necessary to obtainnonlinear polarization attraction in the ‘‘standard’’ C band (from 1530 nm to 1565 nm).
Regarding nonlinear polarization attraction in berRaman ampliers, analyzed inChap-ter 4, only continuous-wave waves have been considered. Even if they approximates thesteady state behavior of high data-rate transmissions, more detailed analysis should beperformed, in particular to evaluate the impact of noise and of the presence of multiplechannels, like in wavelength-division-multiplexing systems.
For what concern the tunable nonlinear ber optical oscillator, discussed in Section 3.3,the sweep rate could be improved by shortening the loop length, such as by using highlynonlinear bers or by using a higher dispersive element. Moreover, as the stimulatedRaman scattering eect scales with the pump wavelength, with proper dispersion proper-ties it could be possible to achieve lasing in other bands or in unusual spectral regionssuch as in the near infrared. As such region are continuously being explored, especiallyfor sensing applications, they are worth being investigated, and, as pointed out before,good amplication stages have to be developed to reach the required pump peak power.However, the required average power is lower than that required for nonlinear polarizationattraction.
Finally, for what concern the fast tunable optical frequency comb, discussed in Sec-tion 3.4, few issues should be addressed, the main being its temporal characterization, thatcould not be performed. ¿e cascaded four-wave mixing, realized through a single pump,guarantee the coherence of the comb. However, deriving sucient temporal informationfrom average spectra is not possible, therefore more detailed analysis should be done, forinstance through the use of an autocorrelator. Moreover, the time stability and the spectralbroadening of the comb lines, and their possible eects, should also be analyzed.
Concluding, nonlinear optics will undoubtedly play a major role in the development
58

5.1. FUTURE RESEARCH
of future photonic devices and networks, and the work that has been presented in thisthesis is an original contribution to advance knowledge in the elds of all-optical signalgeneration and processing.
59


AppendixAThe Stokes representation of
light
Polarization is a key degree of freedom of the electromagnetic eld. ¿is Appendixprovides a basic overview of the Stokes formalism for representing the polarizationof the electromagnetic eld; more in-depth discussions can be found in books such
as Damask [168] or Collett [169].
Consider a monochromatic wave at angular frequency ω, with time dependence eiωt,and propagating along the z-axis with propagation constant k. ¿e electric eld¹ E can beexpressed as
E(x , y, z, t) = E0(x , y) exp[i(ωt − kz)] . (A.1)
¿e complex amplitude E0 can be decomposed in terms of its orthogonal components inthe transverse (x , y)-plane as
E0 = (Ex
Ey) = (Ax eiφx
Ay eiφy) , (A.2)
which is called the Jones vector [170], and where Ax , Ay, φx and φy are four real parameters.¿e Jones vector fully determines the state of polarization (SOP) of the wave throughthe behavior of the two orthogonal components Ex and Ey over one optical cycle. How-ever, Jones vectors can not be easily measured directly as the measurement involves theknowledge of two amplitudes and two phases of the optical eld. Moreover, the Jonesformalism can describe only fully polarized waves, as it can not account for zero or partialpolarization.
A more useful and practical way to deal with polarization of light is by resorting tothe Stokes formalism [171], which, by dropping the information on the absolute opticalphases φx and φy, can directly deal with full and partial polarized waves and even withcompletely depolarized ones. Moreover, it only involves the measurement of opticalpowers (or intensities).
¿e Stokes representation is given by a four-component real vector S = (S0, S1, S2, S3)T ,¹Without loss of generality, the following discussion is restricted by only considering the electric eld E;
the magnetic eld H can be derived from E by using the Faraday’s law.
61

A. THE STOKES REPRESENTATION OF LIGHT
whose components are given by:
S0 = E∗
xEx + E∗
yEy = ∣Ex ∣2 + ∣Ey∣2 , (A.3a)
S1 = E∗
xEx − E∗
yEy = ∣Ex ∣2 − ∣Ey∣2 , (A.3b)
S2 = E∗
xEy + E∗
yEx = 2Re[E∗xEy] , (A.3c)
S3 = i(E∗yEx − E∗
xEy) = 2 Im[E∗xEy] , (A.3d)
where S0 is the total power of the electric eld given by the sum of the powers of the twoorthogonal components Ex and Ey, whereas S1 is the dierence between those powers.¿e third component S2 is given by the dierence between the intensities of the twoorthogonal components of the eld aligned at ±π/4 in the (x , y)-plane. Finally, S3 is givenby the dierence between the right- and the le -hand circular components. ¿erefore, theknowledge of six powers is needed to fully characterize a Stokes vector.
¿e Stokes vector S can be formally related² to the Jones vector ∣S⟩ by the relation [172]S = ⟨S∣σ ∣S⟩ , (A.4)
where σ is the following four-components vector of matrices:
σ =
⎛⎜⎜⎜⎝σ0σ1σ2σ3
⎞⎟⎟⎟⎠ . (A.5)
¿e matrix σ0 is the identity matrix
σ0 = (1 00 1) , (A.6)
whereas σi , i ∈ 1, 2, 3 are the Pauli’s spin matrices [173]:σ1 = (1 0
0 −1) , (A.7a)
σ2 = (0 11 0
) , (A.7b)
σ3 = (0 − ii 0) . (A.7c)
In this way the four Stokes components are given by
Si = ⟨S∣σi ∣S⟩ for i ∈ 0, 1, 2, 3 . (A.8)
²Jones vectors are commonly denoted with the ‘‘ket’’ notation ∣⋅⟩.62

A.1. THE DEGREE OF POLARIZATION
A.1 ¿e degree of polarization
¿e Stokes representation allows to deal not only with fully polarized waves, but also withpartially polarized and completely depolarized beams. In general a Stokes vector can bedecomposed as
S = Spol + Sunpol =
⎛⎜⎜⎜⎝DS0S1S2S3
⎞⎟⎟⎟⎠ + (1 −D)⎛⎜⎜⎜⎝S0000
⎞⎟⎟⎟⎠ , (A.9)
where the coecientD is the degree of polarization (DOP), which is calculated as
D =
√S21 + S
22 + S
23
S0. (A.10)
It can be shown from Eqs. A.3 thatD is constrained to the interval
0 ≤D ≤ 1 . (A.11)
Unpolarized waves have D = 0, whereas fully polarized waves have D = 1. Partialpolarization is described by 0 < D < 1. In particular, monochromatic plane waveshave D = 1. However, from a practical point of view, Stokes vectors are calculated byaveraging the measured powers, and therefore the parameters Si , over time. Eq. (A.10) isthus rewritten as
D =
√⟨S1⟩2 + ⟨S2⟩2 + ⟨S3⟩2⟨S0⟩ , (A.12)
where the averages ⟨⋅⟩ are taken over a time interval of duration T :
⟨⋅⟩ = ∫ T
0⋅dt . (A.13)
In this case, a wave exhibiting time uctuations of its SOP may yieldD < 1.
63


AppendixBMeasurement of the Stokes
parameters
Stokes vectors, as described in Appendix A, are dened by combining six dierentmeasurements of the residual power of the eld transmitted by six dierent polarizers:two linear polarizers aligned along the x-axis and the y-axis, two aligned at ±π/4, and
two circular polarizers for the right- and the le -handed circular polarizations. ¿erefore,even by assuming that the linear polarizer can be rotated, two more polarizers are neededfor the two circular polarizations. ¿us at least three dierent polarizers are required.Moreover, such dierent polarizers have to be exchanged during the measurement. ¿isrender the measurement slow and susceptible to errors in the alignment of the polarizers.
¿e rotating quarter-wave plate (QWP) polarimeter [167], [174]–[176] is an alternativemethod, yet simple, precise and versatile, to measure the four-components Stokes vectorof a light beam.
Fig. B.1 shows a schematic illustration of a rotating QWP polarimeter. ¿e incidentradiation, with unknown state of polarization S, propagates through a QWP whose fastaxis is at an angle θ from the x-axis of the reference system.
AQWPwith its fast axis oriented along the x-axis is described by the followingMüellermatrix [177]:
MQWP =
⎛⎜⎜⎜⎝1 0 0 00 1 0 00 0 0 10 0 −1 0
⎞⎟⎟⎟⎠ . (B.1)
¿e matrix of a QWP rotated by an angle θ can be calculated as [168], [177]
M(θ) = R(−θ)M(0)R(θ) , (B.2)
where R(θ) is the following rotation matrix:
R(θ) = ⎛⎜⎜⎜⎝1 0 0 00 cos 2θ sin 2θ 00 − sin 2θ cos 2θ 00 0 0 1
⎞⎟⎟⎟⎠ . (B.3)
65

B. MEASUREMENT OF THE STOKES PARAMETERS
x′x
θ
detector
linear polarizer
quarter-wave plate
radiation
S(θ)
MLHP
MQWP(θ)
S
x
y
z
Figure B.1: Illustration of the rotating QWP polarimeter.
¿e resulting Müeller matrix of the rotated QWP is
MQWP(θ) =⎛⎜⎜⎜⎝1 0 0 00 cos2 2θ 1
2sin 4θ − sin 2θ
0 12sin 4θ sin2 2θ cos 2θ
0 sin 2θ − cos 2θ 0
⎞⎟⎟⎟⎠ . (B.4)
A er passing through the rotated QWP, the beam arrives to an analyzer composed bya linear polarizer (LP) and a detector. ¿e fast axis of the LP is oriented along the x-axis,and it can be described by the following matrix:
MLHP =
⎛⎜⎜⎜⎝1 1 0 01 1 0 00 0 0 00 0 0 0
⎞⎟⎟⎟⎠ . (B.5)
Finally, the Stokes vector S(θ) of the signal transmitted by the LP and entering intothe detector is given by
S(θ) = MLHPMQWP(θ)S =⎛⎜⎜⎜⎝
12
14(1 + cos 4θ) 1
4sin 4θ − 1
2sin 2θ
12
14(1 + cos 4θ) 1
4sin 4θ − 1
2sin 2θ
0 0 0 00 0 0 0
⎞⎟⎟⎟⎠ S . (B.6)
¿erefore, the power S0(θ) read by the detector isS0(θ) = 1
2S0 +
1
4S1(1 + cos 4θ) + 1
4S2 sin 4θ −
1
2S3 sin 2θ , (B.7)
where Si , i ∈ 0, 1, 2, 3 are the four components of the unknown input Stokes vector S.It can be noted that Eq. (B.7) represents a truncated Fourier series. By dening In as
Indef
= S0(θn) = 12S0 +
1
4S1(1 + cos 4θn) + 1
4S2 sin 4θn −
1
2S3 sin 2θn , (B.8)
66

and by repeating its measurement for N dierent orientations θn of the QWP, the Stokesparameters Si can be calculated as follows:
S0 =2
N
N
∑n=1
In −4
N
N
∑n=1
In cos 4θn , (B.9a)
S1 =8
N
N
∑n=1
In cos 4θn , (B.9b)
S2 =8
N
N
∑n=1
In sin 4θn , (B.9c)
S3 = −4
N
N
∑n=1
In sin 2θn . (B.9d)
67


AppendixCEmulation of depolarized light
The degree of polarization (DOP) depends on the observation time-scale of thevariation of the state of polarization (SOP), as seen in Appendix A.1. ¿is meansthat measurements of DOP depends not only on the polarization properties of the
light but also on the apparatus used to perform the measure. Hereina er, fully depolarizedlight will means to haveD = 0 over a certain time interval, even if locally in time the lightcan haveD = 1.
¿erefore, light depolarization can be attained in dierent ways, such as with broad-band incoherent signals, with superposition of fully polarized signals or with signals whoseSOP varies in time. In either case,D = 0 is equivalent to have a uniform distribution ofSOPs over the whole Poincaré sphere.
Polarization scramblers can be used, for example, for testing installed ber opticlinks [178] or for evaluating the performance of coherent detection systems [179].
A uniform distribution of SOPs over the Poincaré sphere can be obtained by consider-ing a Stokes vector
S =⎛⎜⎝S1S2S3
⎞⎟⎠ (C.1)
whose components are independent and identically distributedGaussian random variables.It can be shown [180]–[182] that the associated normalized vector
s =⎛⎜⎝s1s2s3
⎞⎟⎠ =1√
S21 + S22 + S
23
⎛⎜⎝S1S2S3
⎞⎟⎠ (C.2)
is uniformly distributed on the Poincaré sphere. In particular, this means that the com-ponents si are uniformly distributed random variablesU(0, σ2) between -1 and +1, withmean
E[si] = 0 for i = 1, 2, 3 , (C.3)
and variance
σ2i = E[s2i ] = 13 for i = 1, 2, 3 . (C.4)
However, the components si are not independent anymore, due to the way they areconstructed ( Eq. (C.2)). Under the above hypotheses, because s has unitary modulus, theDOP is simply given by
D =
√⟨s1⟩2 + ⟨s2⟩2 + ⟨s3⟩2 , (C.5)
69

C. EMULATION OF DEPOLARIZED LIGHT
Sout(t)
x′
x
θ4
x′
x′
x
θ2
x′
δ1(t)
δ2(t)
δ3(t)
δ4(t)
θ1 = 0
θ2 =π
4
θ3 = 0
θ4 =π
4
Sin
x
y
z
Figure C.1: Illustration of the polarization scrambler, based on four waveplates withvariable delay δ and dierent axis orientations θ.
where ⟨⋅⟩ = ∫ T
0⋅dt . (C.6)
¿rough Eq. (C.2), uniform SOPs distributions over the Poincaré sphere can be ecientlyobtained numerically.
In Section 4.4, a polarization scrambler has been used to experimentally emulatedepolarized light. ¿e scrambler, depicted in Fig. C.1, is based on four ber squeezers thatcan be modeled as waveplates with variable delay δ(t) [183]. Other scrambling techniquesare based on electronic polarization controller [178], LiNbO3 waveguides [144] or on acombination of LiNbO3 waveguides and rotating waveplates [184].
Each waveplate, with variable delay δ = δ(t) can be described by the followingMüellermatrix:
MWP(δ) =⎛⎜⎜⎜⎝1 0 0 00 1 0 00 0 cos δ sin δ0 0 − sin δ cos δ
⎞⎟⎟⎟⎠ . (C.7)
As shown in Fig. C.1, two of the four waveplates have a rotation of θ = π/4. ¿e corre-sponding Müeller matrix can be obtained from Eq. (B.2), resulting in:
MWP(δ, θ) =⎛⎜⎜⎜⎝1 0 0 0
0 cos2 2θ + cos δ sin2 2θ sin2 δ2sin 4θ − sin δ sin 2θ
0 sin2 δ2sin 4θ cos δ cos2 2θ + sin2 2θ cos 2θ sin δ
0 sin δ sin 2θ − cos 2θ sin δ cos δ
⎞⎟⎟⎟⎠ .
(C.8)
70

S1 S2
S3
Figure C.2: Evolution of the SOP for N = 100 steps and for Sin = 3−1/2(1, 1, 1)T .¿e resulting SOP is therefore given by
Sout(t) = MWP(δ4(t), θ4)MWP(δ3(t), θ3)MWP(δ2(t), θ2)MWP(δ1(t), θ1)Sin . (C.9)
Actually, the four delays δi are driven by four statistically independent random signals,and the output SOP is randomly changed at a rate of ∆t−1 = 20kHz. Fig. C.2 shows theevolution of the SOP for N = 100 random steps obtained by simulating the scrambler.
¿eDOPobtained by implementing the scrambler described above can be seen Fig. C.3,which shows repeated measurements of the DOP for dierent observation times T . ¿eDOP is measured by using the rotating quarter-wave plate (QWP) polarimeter describedin Appendix B and also used in Section 4.4, for Nθ = 5 orientations of the QWP. As it canbe seen, the value of the DOP depends on the observation time T . In particular, lowerDOP is obtained by longer observation times. ¿is is expected, and it can be explainedby looking at Fig. C.4, which shows the mean and the variance of the components of theoutput Stokes vector as a function of the observation time T , obtained by simulating thesystem. As it can be seen, for long enough observation times the mean converge toward 0and the variance toward 1/3, i.e. the sphere coverage is almost uniform, as explained before.For shorter observation times, instead, the statistics indicate that the sphere coverage isnot uniform, and indeed the DOP is higher.
Finally, in Fig. C.5, the measured and the simulated average DOP ⟨D⟩ are reportedas a function of the normalized observation time T ′ = T/Nθ , where Nθ is the number oforientations of the QWP in the polarimeter, i.e. the normalized observation time T ′ isthe averaging time required by one QWP orientation. ¿is makes sense since the rotatingQWP estimates the DOP (and the SOP) by averaging over Nθ dierent time slots ofduration T ′ = T/Nθ .
¿e marks joined by the blue curve refer to the experimental data presented in Fig. C.3with same marks. ¿e black circles refer to the data presented in Fig. C.4. ¿e same SOPs
71

C. EMULATION OF DEPOLARIZED LIGHT
0 5 10 15 20 25 30 35 40 45 50 55 60 650.00
0.02
0.04
0.06
0.08
0.10
0.12
0.14
Normalized time t/T
DOPD
T = 0.25 s
T = 0.75 s
T = 2.5 s
T = 25 s
Figure C.3: Measured DOPs for various observation times T .
10−3 10−2 10−1 100−0.02
0.00
0.02
0.04
0.06
0.08
0.24
0.26
0.28
0.3
0.32
0.34
1/3
Observation time T [s]
Mean⟨ ⋅⟩
Variance
σ2
mean
variance
S1
S2
S3
Figure C.4: Mean and variance of the Stokes components as a function of the observationtime, calculated on N = 1000 realizations. ¿e step duration is ∆t = 50µs and the input
vector is Sin = 3−1/2(1, 1, 1)T .
72

10−4 10−3 10−2 10−1 100 1010.00
0.10
0.20
0.30
0.40
0.50
0.60
Normalized observation time T ′ = T/Nθ [s]
MeanDOP⟨ D⟩
ideal
Nθ = 5
Nθ = 6
Nθ = 7
Nθ = 8
measured
NPA
Figure C.5: Mean DOP ⟨D⟩.evolution is also used by simulating the rotating QWP polarimeter for dierent number oforientations Nθ , and the resulting mean DOP is shown with white marks joined by dashedcurves. Also in this case, the observation time T = T ′/Nθ of one QWP orientation hasbeen considered. As it can be seen, the agreement between measured and simulated data isgood. ¿erefore, to correctly emulate a low DOP by scrambling the SOP, the observationtime T have to be carefully chosen. ¿e red star is the mean DOP obtained from the dataof the experiments on nonlinear polarization attraction (NPA) presented in Section 4.4.¿e dierence with the data measured in Fig. C.3 might be attributed to some residualrepolarization due to polarization-dependent losses (PDLs) [185] of the devices in thesetup (see Fig. 4.11). However, for an observation time of T ′ = 1 s aD < 5% is achieved,which is usually considered the threshold for low polarization.
73


AppendixDPolarization-mode dispersion
Polarization-mode dispersion (PMD) is one of the impairments limiting high bit-rate transmissions over long-haul bers. ¿e phenomenon origins from the randomvarying birefringence along the ber.
An ideal isotropic single-mode ber (SMF) has a structure with perfect cylindri-cal symmetry. In this condition there exists two orthogonal fundamental modes HE
x11
and HEy11 [186] that are degenerate and that travel at the same group velocity. ¿erefore all
state of polarizations (SOPs) propagate unaltered in the ber.
However, real bers exhibit geometrical imperfections and anisotropies due to themanufacturing process or induced by external stress, like bendings, twisting and pressureor temperature gradients. Apart from the case of spun bers, where some control canbe attained during the fabrication process, all these imperfections vary randomly bothradially and along the propagation coordinate z. Even if these deformations are weak,their eect accumulates along the ber and the net eect is to broke the degeneracy and tomake the ber birefringent. ¿is means that a signal propagating into the ber is projectedonto two orthogonal SOPs that propagate with dierent group velocities. ¿is determinesthe development of a phase shi between the two components and indeed a change in theSOP. Because of the stochastic nature of the birefringence variations, also the SOP of thesignals vary randomly as they propagate.
From a practical point of view, PMD is responsible to for
1. a random evolution of the SOP of signals,
2. a delay between dierent SOPs, which travel at dierent speeds.
In the following Appendix D.1, a brief description of one of the models used to statisti-cally describe the eects of PMD, called the random modulus model (RMM), is given.More in-depth treatises on PMD statistics and impacts on transmission links can be found,for instance, in Gordon and Kogelnik [172], Gordon [187] or Karlsson and Sunnerud [188].
D.1 ¿e randommodulus model
¿e random modulus model (RMM), proposed by Wai and Menyuk [160], is a model todescribe the statistics of the random birefringence.
As depicted in Fig. D.1, the model divides the ber into many short sections. Each sec-tion has a constant birefringence vector β, which varies both in modulus and in direction
75

D. POLARIZATION-MODE DISPERSION
x
y
z
βx
βy
∥βL∥
Figure D.1: Illustration of the RMM.¿e ber is divided into many short sections, eachhaving constant birefringence. ¿e birefringence vector changes both in modulus and indirection when passing from one section to the next.
when passing from one section to the next. In the Stokes space, the birefringence vector βis described by
β =⎛⎜⎝β1β20
⎞⎟⎠ (D.1)
where β3 = 0 has been assumed, i.e. no circular birefringence is present [157]–[161]. ¿isassumption is justied because circular birefringence can be induced by twisting [157],[189], which is not the case of standard SMFs for telecommunications applications, or byexposition to very intense external magnetic elds [157].
¿e linear components β1(z) and β2(z) of the birefringence vector can be modeled astwo independent Langevin processes [157], [160]:
dβi
dz= −ρβi(z) + σηi(z) for i = 1, 2 , (D.2)
where η1(z) and η2(z) are statistically independent white Gaussian noises satisfyingE[ηi(z)] = 0 and E[ηi(u)ηi(z + u)] = δ(z) for i = 1, 2 . (D.3)
It may also be shown that, under proper initial conditions, β1(z) and β2(z) are Gaussiandistributed stationary processes [160] with zero mean
E[βi(z)] = 0 (D.4)
and equal standard deviation σβ given by
E[β2i (z)] = σ2β =
σ2
2ρ, (D.5)
meaning that they have a bilateral exponential autocorrelation given by
rβ(z) = E[βi(u)βi(z + u)] = σ2β e−ρ∣z∣ for i = 1, 2 . (D.6)
76
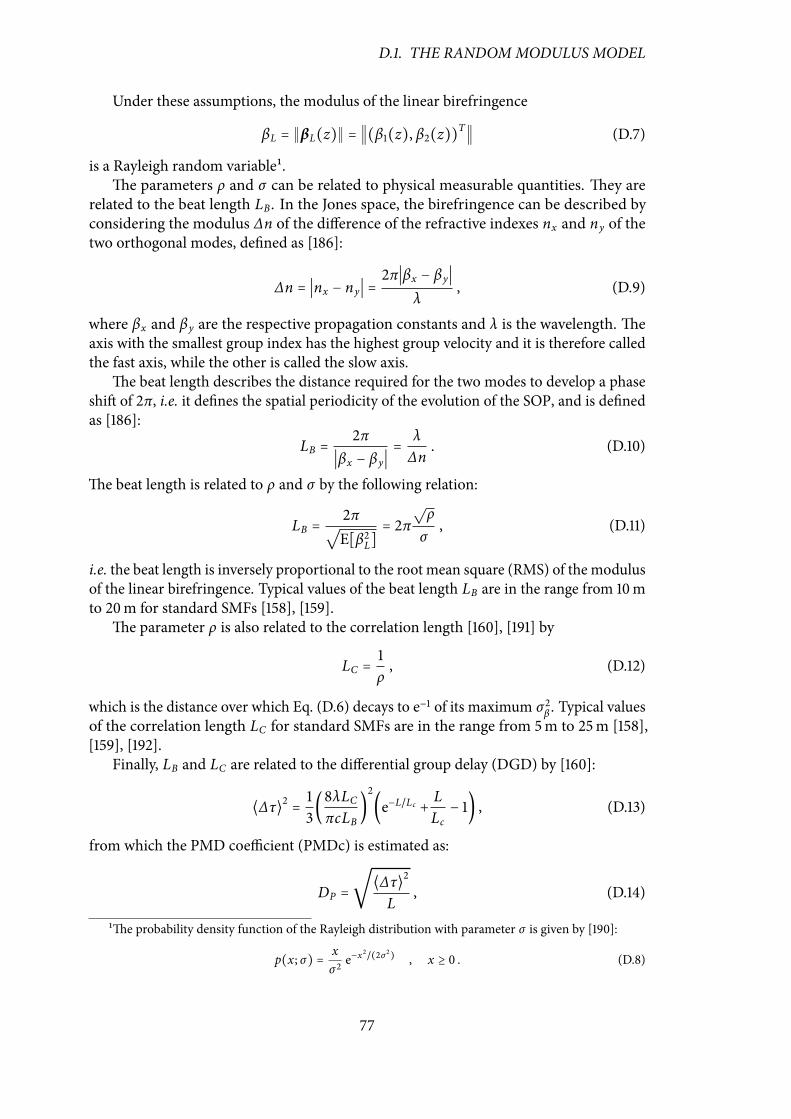
D.1. THE RANDOMMODULUS MODEL
Under these assumptions, the modulus of the linear birefringence
βL = ∥βL(z)∥ = ∥(β1(z), β2(z))T∥ (D.7)
is a Rayleigh random variable¹.¿e parameters ρ and σ can be related to physical measurable quantities. ¿ey are
related to the beat length LB. In the Jones space, the birefringence can be described byconsidering the modulus ∆n of the dierence of the refractive indexes nx and ny of thetwo orthogonal modes, dened as [186]:
∆n = ∣nx − ny∣ = 2π∣βx − βy∣λ
, (D.9)
where βx and βy are the respective propagation constants and λ is the wavelength. ¿eaxis with the smallest group index has the highest group velocity and it is therefore calledthe fast axis, while the other is called the slow axis.
¿e beat length describes the distance required for the two modes to develop a phaseshi of 2π, i.e. it denes the spatial periodicity of the evolution of the SOP, and is denedas [186]:
LB =2π∣βx − βy∣ =
λ
∆n. (D.10)
¿e beat length is related to ρ and σ by the following relation:
LB =2π√E[β2L] = 2π
√ρ
σ, (D.11)
i.e. the beat length is inversely proportional to the root mean square (RMS) of the modulusof the linear birefringence. Typical values of the beat length LB are in the range from 10mto 20m for standard SMFs [158], [159].
¿e parameter ρ is also related to the correlation length [160], [191] by
LC =1
ρ, (D.12)
which is the distance over which Eq. (D.6) decays to e−1 of its maximum σ2β . Typical values
of the correlation length LC for standard SMFs are in the range from 5m to 25m [158],[159], [192].
Finally, LB and LC are related to the dierential group delay (DGD) by [160]:
⟨∆τ⟩2 = 13(8λLC
πcLB
)2(e−L/Lc + L
Lc
− 1) , (D.13)
from which the PMD coecient (PMDc) is estimated as:
DP =
√⟨∆τ⟩2L
, (D.14)
¹¿e probability density function of the Rayleigh distribution with parameter σ is given by [190]:
p(x; σ) = x
σ 2e−x
2/(2σ 2), x ≥ 0 . (D.8)
77

D. POLARIZATION-MODE DISPERSION
where L is the ber length.However, the RMS of the group delay ⟨∆τ2⟩ is o en measured in practice, and the two
are related by [187]:
⟨∆τ⟩2 = 8
3π⟨∆τ2⟩ . (D.15)
As it can be seen, the two denitions give approximately the same value.
78

AppendixENumerical integration of
boundary value problems
This appendix delineates the numerical methods used to integrate the equationsgoverning the evolution of the Stokes vectors of the pump P and of the signal S ina counter-propagating ber Raman amplier (FRA). In Section 4.2 the following
equations have been presented:
dS
dz= −αsS +
дR2[P0S + S0P + µ(3P0S + S0P − 2S0P3)] + (ωsb +Ws) × S ,
(Eq. (4.3a) revisited.)
dP
dz= αpP +
ωp
ωs
дR2[S0P + P0S + µ(3S0P + P0S − 2P0S3)] − (Mωpb +Wp) × P .
(Eq. (4.3b) revisited.)
¿is is a system of nonlinear rst-order ordinary dierential equations (ODEs). ¿e initialvalue problem (IVP) associated with this system can not be solved in closed form, anda numerical approach is required. Moreover, the associated boundary conditions givenby Eqs. 4.8:
S(z = 0) = Sin , (Eq. (4.8a) revisited.)
P(z = L) = Pin , (Eq. (4.8b) revisited.)
render the system a boundary value problem (BVP). Generally, BVPs can be transformedinto optimization problems and therefore they can be numerically solved by nding someroot.
In the following Appendix E.1 the fourth-order Runge-Kutta (RK4) method is pre-sented. ¿e RK4 has been used in Chapter 4 to integrate the IVP associated with Eqs. 4.3.In Appendix E.2, instead, the shooting algorithm used to solve the BVP is described.
More in-depth and precise mathematical discussions can be found in the cited refer-ences.
E.1 ¿e Runge-Kutta method
¿e general form of a rst-order ODE system can be written as [193], [194]
dy
dx= f (x , y(x)) , a ≤ x ≤ b , (E.3)
79

E. NUMERICAL INTEGRATION OF BOUNDARY VALUE PROBLEMS
where x is the independent variable, y = (y1, y2, . . . , yn)T is the vector of unknownsand f = ( f1(x , y(x)), f2(x , y(x)), . . . , fn(x , y(x)))T is a vector of functions. In the gen-eral case the functions in f are nonlinear.
¿e system of Eq. (E.3) together with the initial conditions
y(a) = y0 , (E.4)
is an IVP.¿e Runge-Kutta (RK) integration scheme is an algorithm to integrate IVPs that can be
applied to a broad range of dierent problems, and it is usually known to be very accurate.¿e RK method divides the integration interval [a, b] into N steps of size h. At each stepan approximated value of the function is calculated.
In particular, the fourth-order Runge-Kutta (RK4) [162], [193]–[196] is based on fourevaluations of the function being integrated for each integration step. ¿e four evaluations,also called stages, are given by:
k1 = h f (xn , yn) (E.5a)
k2 = h f (xn + 12h, yn +
1
2k1) (E.5b)
k3 = h f (xn + 12h, yn +
1
2k2) (E.5c)
k4 = h f (xn + h, yn + k3) . (E.5d)
¿e estimated value at step n + 1 is calculated as
yn+1 = yn +1
6(k1 + 2k2 + 2k3 + k4) +O(h5) , (E.6)
where O is the Landau symbol. ¿e value of y(xn+1) is given by the approximation yn+1,which is based on the previous step yn and a weighted average of the intermediate valuesk1, k2, k3, k4. Each step introduces a truncation error of order O(h5). However, the overallerror has order O(h4), from which the name “fourth-order”.
E.2 Solution of boundary value problems
¿e shooting method [162], [193], [194], [196] reduces a BVP into an optimization probleminvolving only an IVP. ¿is is accomplished by adding to the system of Eq. (E.3) thefollowing equation
д(y(a), y(b)) = 0 . (E.7)
Intuitively, this method is equivalent to iterate on the ctitious initial conditions in a untilthe true initial conditions in b are satised.
¿e function д to be minimized can vary. For the analysis of Chapter 4, it has beenchosen to minimize the following error
ε =∥∆S∥Sin0
, (E.8)
80

E.2. SOLUTION OF BOUNDARY VALUE PROBLEMS
where Sin0 = ∥Sin∥ and ∆S = Sout − Sin. ¿e nonlinear minimization algorithm guaranteed
ε < 10−2 (E.9)
while preserving the input degree of polarization (DOP) and the power.
81


List of publications
Peer-reviewed international journals
[P.1] F. Chiarello, L. Palmieri, A. Galtarossa, and M. Santagiustina, “Widely time-dispersion-tuned ber optical oscillator and frequency comb based on multiplenonlinear processes”, Optics Letters, vol. 38, no. 22, pp. 4621–4624, Nov. 2013. doi:10.1364/OL.38.004621.
[P.2] F. Chiarello, L. Palmieri, M. Santagiustina, R. Gamatham, and A. Galtarossa,“Experimental characterization of the counter-propagating Raman polarizationattraction”, Optics Express, vol. 20, no. 23, pp. 26 050–26 055, Nov. 2012. doi: 10.1364/OE.20.026050.
[P.3] F. Chiarello, L. Ursini, L. Palmieri, and M. Santagiustina, “Polarization attractionin counterpropagating ber Raman ampliers”, Photonics Technology Letters, vol.23, no. 20, pp. 1457–1459, Oct. 15, 2011. doi: 10.1109/LPT.2011.2163061.
[P.4] F. Chiarello, L. Ursini, and M. Santagiustina, “Securing wireless infrared com-munications through optical chaos”, Photonics Technology Letters, vol. 23, no. 9,pp. 564–566, May 1, 2011. doi: 10.1109/LPT.2011.2114334.
Conference proceedings
[C.1] F. Chiarello, L. Palmieri, A. Galtarossa, and M. Santagiustina, “Nonlinear multi-process ber laser widely tunable through time-dispersion tuning (invited)”, in Fo-tonica 2013, 15° Convegno Nazionale delle Tecnologie Fotoniche, (May 21–23, 2013),Milano, Italy, 2013, p. C4.1.
[C.2] F. Chiarello, L. Ursini, L. Palmieri, M. Santagiustina, A. W. R. Leitch, and M.Guglielmucci, “Polarization attraction in counter-propagating ber Raman ampli-ers”, in Fotonica 2011, 13°Convegno Nazionale delle Tecnologie Fotoniche, (May 9–11, 2011), Genova, Italy, 2011, p. C4.3.
[C.3] M. Santagiustina, L. Ursini, A. Galtarossa, F. Chiarello, L. Palmieri, C. G. Someda,L. ¿évenaz, and A. Leitch, “Microwave photonic notch lter based on dynamicBrillouin gratings generated by PRBS signals”, in Fotonica 2012, 14° ConvegnoNazionale delle Tecnologie Fotoniche, (May 15–17, 2012), Firenze, Italy, 2012, B3.4.
83

LIST OF PUBLICATIONS
[C.4] L. Schenato, G. Marcato, A. Pasuto, L. Palmieri, F. Chiarello, A. Galtarossa, G.Gruca, T. van de Watering, and D. Iannuzzi, “Experimental analysis of ber opticsensor for detection of precursory acoustic signals in rockfall events”, in Fotonica2012, 14°ConvegnoNazionale delle Tecnologie Fotoniche, (May 15–17, 2012), Firenze,Italy, 2012, B6.5.
[C.5] M. Santagiustina, L. Ursini, L. Palmieri, F. Chiarello, andM. Bosiljevac, “DynamicBrillouin gratings permanently induced by chaotic signals for sensing applications”,in Fotonica 2011, 13° Convegno Nazionale delle Tecnologie Fotoniche, (May 9–11,2011), Genova, Italy, 2011, B6.6.
[C.6] F.Chiarello, M. Santagiustina, and L. Ursini, “Securing free space optics communi-cations through optical chaos”, in Access Networks and In-house Communications,(Jun. 12–14, 2011), Toronto, Canada: OSA, 2011, ATuC5.
[C.7] L. Ursini, F. Chiarello, M. Santagiustina, and L. Schenato, “Comunicazioni si-cure in spazio libero su portante ottica caotica”, in Fotonica 2010, 12° ConvegnoNazionale delle Tecnologie Fotoniche, (May 25–27, 2010), Pisa, Italy, 2010, P1.5.
84

References
[1] K. C. Kao and G. A. Hockham, “Dielectric-bre surface waveguides for opticalfrequencies”, Proceedings of the Institution of Electrical Engineers, vol. 113, no. 7,pp. 1151–1158, 1966. doi: 10.1049/piee.1966.0189.
[2] F. P. Kapron, D. B. Keck, and R. D. Maurer, “Radiation losses in glass opticalwaveguides”, Applied Physics Letters, vol. 17, no. 10, pp. 423–425, Nov. 1970. doi:10.1063/1.1653255.
[3] D. B. Keck, R. D. Maurer, and P. C. Schultz, “On the ultimate lower limit ofattenuation in glass optical waveguides”, Applied Physics Letters, vol. 22, no. 7,pp. 307–309, Apr. 1973. doi: 10.1063/1.1654649.
[4] Y. Takubo and S. Yamashita, “In vivo OCT imaging using wavelength-swept berlaser based on dispersion tuning”, Photonics Technology Letters, vol. 24, no. 12,pp. 979–981, Jun. 2012. doi: 10.1109/LPT.2012.2190503.
[5] S. H. Yun, D. J. Richardson, and B. Y. Kim, “Interrogation of ber grating sensorarrays with a wavelength-swept ber laser”, Optics Letters, vol. 23, no. 11, pp. 843–845, Jun. 1998. doi: 10.1364/OL.23.000843.
[6] V. Bertogalli, E. U. Wagemann, E. Miller, and E. Leckel, “Testing passive DWDMcomponents: uncertainties in swept-wavelength measurement systems”, inOpticalFiber Communication Conference and Exhibit (OFC), (Mar. 17–22, 2001), vol. 4,Anaheim, CA, USA, Mar. 2001, ¿B6.
[7] X. Yang, K. Xu, J. Yin, Y. Dai, F. Yin, J. Li, H. Lu, T. Liu, and Y. Ji, “Optical frequencycomb basedmulti-bandmicrowave frequency conversion for satellite applications”,Optics Express, vol. 22, no. 1, pp. 869–877, Jan. 2014. doi: 10.1364/OE.22.000869.
[8] M. Ziyadi, M. R. Chitgarha, S. Khaleghi, A. Mohajerin-Ariaei, A. Almaiman, J.Touch, M. Tur, C. Langrock, M. M. Fejer, and A. E. Willner, “Tunable opticalcorrelator using an optical frequency comb and a nonlinear multiplexer”, OpticsExpress, vol. 22, no. 1, pp. 84–89, Jan. 2014. doi: 10.1364/OE.22.000084.
[9] S. T. Cundi and J. Ye, “Colloquium: femtosecond optical frequency combs”,Reviews of Modern Physics, vol. 75, no. 1, pp. 325–342, Mar. 2003. doi: 10.1103/RevModPhys.75.325.
[10] N. R. Newbury, “Searching for applications with a ne-tooth comb”, Nature Pho-tonics, vol. 5, no. 4, pp. 186–188, Apr. 2011. doi: 10.1038/nphoton.2011.38.
85

REFERENCES
[11] Y. Silberberg, “Physical chemistry: combs for molecules”, Nature, vol. 502, no.7471, pp. 307–308, Oct. 2013. doi: 10.1038/502307a.
[12] P. Del’Haye, T. Herr, E. Gavartin, M. L. Gorodetsky, R. Holzwarth, and T. J. Kippen-berg, “Octave spanning tunable frequency comb from a microresonator”, PhysicalReview Letters, vol. 107, no. 6, p. 063 901, Aug. 2011. doi: 10.1103/PhysRevLett.107.063901.
[13] N. A. Cholan, M. H. Al-Mansoori, A. S. M. Noor, A. Ismail, and M. A. Mahdi,“Multi-wavelength generation by self-seeded four-wave mixing”, Optics Express,vol. 21, no. 5, pp. 6131–6138, Mar. 2013. doi: 10.1364/OE.21.006131.
[14] M. Tadakuma, O. Aso, and S. Namiki, “A 104 GHz 328 fs soliton pulse train gener-ation through a comb-like dispersion proled ber using short high nonlinearitydispersion bers”, in Optical Fiber Communication Conference (OFC), (Mar. 7–10,2000), vol. 3, Baltimore, MD, USA, 2000, pp. 178–180. doi: 10.1109/OFC.2000.868557.
[15] A. Cerqueira Sodre, J. M. Chavez Boggio, A. A. Rieznik, H. E. Hernandez-Figueroa,H. L. Fragnito, and J. C. Knight, “Highly ecient generation of broadband cascadedfour-wavemixing products”,Optics Express, vol. 16, no. 4, pp. 2816–2828, Feb. 2008.doi: 10.1364/OE.16.002816.
[16] F. C. Cruz, “Optical frequency combs generated by four-wave mixing in opticalbers for astrophysical spectrometer calibration and metrology”, Optics Express,vol. 16, no. 17, pp. 13 267–13 275, Aug. 2008. doi: 10.1364/OE.16.013267.
[17] J. E. Heebner, R. S. Bennink, R. W. Boyd, and R. A. Fisher, “Conversion of unpo-larized light to polarized light with greater than 50% eciency by photorefractivetwo-beam coupling”, Optics Letters, vol. 25, no. 4, pp. 257–259, Feb. 2000. doi:10.1364/OL.25.000257.
[18] M. Martinelli, M. Cirigliano, M. Ferrario, L. Marazzi, and P. Martelli, “Evidence ofRaman-induced polarization pulling”, Optics Express, vol. 17, no. 2, pp. 947–955,2009. doi: 10.1364/OE.17.000947.
[19] A. Galtarossa, L. Palmieri,M. Santagiustina, and L. Ursini, “Polarized backward Ra-man amplication in randomly birefringent bers”, Journal of Lightwave Technol-ogy, vol. 24, no. 11, pp. 4055–4063, Nov. 2006. doi: 10.1109/JLT.2006.883640.
[20] M. Ferrario, V. Gilardone, P. Martelli, L. Marazzi, and M. Martinelli, “Eective all-optical polarization control induced by Raman nonlinear amplication”, in 36thEuropean Conference and Exhibition onOptical Communication (ECOC), (Sep. 19–23, 2010), Torino, Italy, 2010, P1.19. doi: 10.1109/ECOC.2010.5621415.
[21] V. V. Kozlov, J. Nuño, J. D. Ania-Castañón, and S. Wabnitz, “Theory of ber opticRaman polarizers”, Optics Letters, vol. 35, no. 23, pp. 3970–3972, Dec. 2010. doi:10.1364/OL.35.003970.
[22] L. Ursini,M. Santagiustina, and L. Palmieri, “Ramannonlinear polarization pullingin the pump depleted regime in randomly birefringent bers”, Photonics Tech-nology Letters, vol. 23, no. 4, pp. 254–256, Feb. 2011. doi: 10.1109/LPT.2010.2098024.
86

REFERENCES
[23] S. V. Sergeyev, “Activated polarization pulling and de-correlation of signal andpump states of polarization in a ber Raman amplier”, Optics Express, vol. 19, no.24, pp. 24 268–24 279, 2011. doi: 10.1364/OE.19.024268.
[24] V. V. Kozlov, J. Nuño, J. D. Ania-Castañón, and S. Wabnitz, “Theoretical studyof optical ber Raman polarizers with counterpropagating beams”, Journal ofLightwave Technology, vol. 29, no. 3, pp. 341–347, Feb. 2011. doi: 10.1109/JLT.2010.2099644.
[25] N. J. Muga, M. F. S. Ferreira, and A. N. Pinto, “Broadband polarization pullingusing Raman amplication”, Optics Express, vol. 19, no. 19, pp. 18 707–18 712, Sep.2011. doi: 10.1364/OE.19.018707.
[26] V. V. Kozlov, J. Nuño, J. D. Ania-Castañón, and S. Wabnitz, “Multichannel Ramanpolarizer with suppressed relative intensity noise for wavelength division multi-plexing transmission lines”,Optics Letters, vol. 37, no. 11, pp. 2073–2075, 2012. doi:10.1364/OL.37.002073.
[27] V. V. Kozlov and S. Wabnitz, “Silicon Raman polarizer”, Optics Letters, vol. 37, no.4, pp. 737–739, 2012. doi: 10.1364/OL.37.000737.
[28] S. Sergeyev and S. Popov, “Two-section ber optic Raman polarizer”, Journalof Quantum Electronics, vol. 48, no. 1, pp. 56–60, Jan. 2012. doi: 10.1109/JQE.2011.2177073.
[29] V. V. Kozlov, J. Nuño, J. D. Ania-Castañón, and S. Wabnitz, “Trapping polarizationof light in nonlinear optical bers: an ideal Raman polarizer”, in Spontaneous Sym-metry Breaking, Self-Trapping, and Josephson Oscillations, ser. Progress in OpticalScience and Photonics, B. A. Malomed, Ed., vol. 1, Springer Berlin Heidelberg, Jan.2012, pp. 227–246. doi: 10.1007/10091_2012_8.
[30] P.Morin, S. Pitois, and J. Fatome, “Simultaneous polarization attraction andRamanamplication of a light beam in optical bers”, Journal of the Optical Society ofAmerica B, vol. 29, no. 8, pp. 2046–2052, 2012. doi: 10.1364/JOSAB.29.002046.
[31] A. Zadok, E. Zilka, A. Eyal, L.¿évenaz, andM. Tur, “Vector analysis of stimulatedBrillouin scattering amplication in standard single-mode bers”, Optics Express,vol. 16, no. 26, pp. 21 692–21 707, Dec. 2008. doi: 10.1364/OE.16.021692.
[32] J. Fatome, S. Pitois, and G. Millot, “Experimental evidence of Brillouin-inducedpolarization wheeling in highly birefringent optical bers”, Optics Express, vol. 17,no. 15, pp. 12 612–12 618, 2009. doi: 10.1364/OE.17.012612.
[33] L. Ursini, M. Santagiustina, and L. Palmieri, “Polarization-dependent Brillouingain in randomly birefringent bers”, Photonics Technology Letters, vol. 22, no. 10,pp. 712–714, May 2010. doi: 10.1109/LPT.2010.2044655.
[34] Z. Shmilovitch, N. Primerov, A. Zadok, A. Eyal, S. Chin, L. ¿évenaz, and M. Tur,“Dual-pump push-pull polarization control using stimulated Brillouin scattering”,Optics Express, vol. 19, no. 27, pp. 25 873–25 880, Dec. 2011. doi: 10.1364/OE.19.025873.
[35] S. Pitois, A. Sauter, and G. Millot, “Simultaneous achievement of polarizationattraction and Raman amplication in isotropic optical bers”, Optics Letters, vol.29, no. 6, pp. 599–601, 2004. doi: 10.1364/OL.29.000599.
87

REFERENCES
[36] S. Pitois, J. Fatome, andG.Millot, “Polarization attraction using counter-propagatingwaves in optical ber at telecommunication wavelengths”, Optics Express, vol. 16,no. 9, pp. 6646–6651, Apr. 2008. doi: 10.1364/OE.16.006646.
[37] J. Fatome, S. Pitois, P. Morin, and G.Millot, “Observation of light-by-light polariza-tion control and stabilization in optical bre for telecommunication applications”,Optics Express, vol. 18, no. 15, pp. 15 311–15 317, Jul. 2010. doi: 10.1364/OE.18.015311.
[38] P. Morin, J. Fatome, C. Finot, S. Pitois, R. Claveau, and G. Millot, “All-opticalnonlinear processing of both polarization state and intensity prole for 40 Gbit/sregeneration applications”, Optics Express, vol. 19, no. 18, pp. 17 158–17 166, 2011.doi: 10.1364/OE.19.017158.
[39] J. Fatome, P. Morin, S. Pitois, and G. Millot, “Light-by-light polarization controlof 10-Gb/s RZ and NRZ telecommunication signals”, Journal of Selected Topicsin Quantum Electronics, vol. 18, no. 2, pp. 621–628, 2012. doi: 10.1109/JSTQE.2011.2119467.
[40] E. Assémat, S. Lagrange, A. Picozzi, H. R. Jauslin, and D. Sugny, “Complete non-linear polarization control in an optical ber system”, Optics Letters, vol. 35, no.12, pp. 2025–2027, Jun. 2010. doi: 10.1364/OL.35.002025.
[41] J. Fatome, S. Pitois, P. Morin, E. Assémat, D. Sugny, A. Picozzi, H. R. Jauslin, G.Millot, V. V. Kozlov, and S. Wabnitz, “A universal optical all-ber omnipolarizer”,Scientic Reports, vol. 2, Dec. 2012. doi: 10.1038/srep00938.
[42] M. Guasoni, V. V. Kozlov, and S. Wabnitz, “Theory of polarization attraction inparametric ampliers based on telecommunication bers”, Journal of the OpticalSociety of America B, vol. 29, no. 10, pp. 2710–2720, Oct. 2012. doi: 10.1364/JOSAB.29.002710.
[43] V. V. Kozlov, K. Turitsyn, and S. Wabnitz, “Nonlinear repolarization in opticalbers: polarization attraction with copropagating beams”, Optics Letters, vol. 36,no. 20, pp. 4050–4052, Oct. 2011. doi: 10.1364/OL.36.004050.
[44] V. V. Kozlov, J. Nuño, and S. Wabnitz, “Theory of lossless polarization attractionin telecommunication bers”, Journal of the Optical Society of America B, vol. 28,no. 1, pp. 100–108, Jan. 2011. doi: 10.1364/JOSAB.28.000100.
[45] V. V. Kozlov and S. Wabnitz, “Theoretical study of polarization attraction in high-birefringence and spun bers”, Optics Letters, vol. 35, no. 23, pp. 3949–3951, Dec.2010. doi: 10.1364/OL.35.003949.
[46] K. Rottwitt, J. Bromage, A. J. Stentz, L. Leng, M. E. Lines, and H. Smith, “Scalingof the Raman gain coecient: applications to germanosilicate bers”, Journal ofLightwave Technology, vol. 21, no. 7, pp. 1652–1662, 2003. doi: 10.1109/JLT.2003.814386.
[47] M. Buchanan, “Thesis: past the Schwinger limit”, Nature Physics, vol. 2, no. 11,pp. 721–721, Nov. 2006. doi: 10.1038/nphys448.
[48] E. G. Sauter,Nonlinear Optics, K. Chang, Ed., ser. Microwave and optical engineer-ing. John Wiley & Sons, Sep. 1996.
88

REFERENCES
[49] R. W. Boyd, Nonlinear optics. Academic Press, 2008.
[50] G. P. Agrawal, Nonlinear Fiber Optics, 4th ed., ser. Optics and Photonics. ElsevierAcademic Press, Oct. 2007.
[51] M. E. Marhic, Fiber Optical Parametric Ampliers, Oscillators and Related Devices.Cambridge University Press, 2008.
[52] C. Headley and G. Agrawal, Eds., Raman Amplication in Fiber Optical Commu-nication Systems, 1st ed., ser. Optics and Photonics. Elsevier Academic Press, Dec.2005.
[53] R. G. Smith, “Optical power handling capacity of low loss optical bers as deter-mined by stimulated Raman and Brillouin scattering”, Applied Optics, vol. 11, no.11, pp. 2489–2494, Nov. 1972. doi: 10.1364/AO.11.002489.
[54] J. Toulouse, “Optical nonlinearities in bers: review, recent examples, and systemsapplications”, Journal of Lightwave Technology, vol. 23, no. 11, pp. 3625–3641, Nov.2005. doi: 10.1109/JLT.2005.855877.
[55] R. H. Stolen, C. Lee, and R. K. Jain, “Development of the stimulated Ramanspectrum in single-mode silica bers”, Journal of the Optical Society of America B,vol. 1, no. 4, pp. 652–657, Aug. 1984. doi: 10.1364/JOSAB.1.000652.
[56] M.N. Islam, “Raman ampliers for telecommunications”, Journal of SelectedTopicsinQuantumElectronics, vol. 8, no. 3, pp. 548–559, Jun. 2002.doi: 10.1109/JSTQE.2002.1016358.
[57] C. Headley III and G. P. Agrawal, “Simultaneous amplication and compression ofpicosecond optical pulses during Raman amplication in optical bers”, Journalof the Optical Society of America B, vol. 10, no. 12, pp. 2383–2389, Dec. 1993. doi:10.1364/JOSAB.10.002383.
[58] J. P. Gordon, “Theory of the soliton self-frequency shi ”, Optics Letters, vol. 11, no.10, pp. 662–664, Oct. 1986. doi: 10.1364/OL.11.000662.
[59] C. Headley III and G. P. Agrawal, “Unied description of ultrafast stimulatedRaman scattering in optical bers”, Journal of the Optical Society of America B, vol.13, no. 10, pp. 2170–2177, Oct. 1996. doi: 10.1364/JOSAB.13.002170.
[60] R. H. Stolen and J. E. Bjorkholm, “Parametric amplication and frequency conver-sion in optical bers”, Journal of Quantum Electronics, vol. 18, no. 7, pp. 1062–1072,1982. doi: 10.1109/JQE.1982.1071660.
[61] G. Cappellini and S. Trillo, “Third-order three-wave mixing in single-mode bers:exact solutions and spatial instability eects”, Journal of the Optical Society ofAmerica B, vol. 8, no. 4, pp. 824–838, Apr. 1991. doi: 10.1364/JOSAB.8.000824.
[62] M. E. Marhic, K. K. Y. Wong, and L. G. Kazovsky, “Fiber optical parametricampliers with linearly or circularly polarizedwaves”, Journal of theOptical Societyof America B, vol. 20, no. 12, pp. 2425–2433, Dec. 2003. doi: 10.1364/JOSAB.20.002425.
[63] C. J. McKinstrie and S. Radic, “Phase-sensitive amplication in a ber”, OpticsExpress, vol. 12, no. 20, pp. 4973–4979, Oct. 2004. doi: 10.1364/OPEX.12.004973.
89

REFERENCES
[64] M. E. Marhic, K. K.-Y. Wong, and L. G. Kazovsky, “Wide-band tuning of the gainspectra of one-pump ber optical parametric ampliers”, Journal of Selected Topicsin Quantum Electronics, vol. 10, no. 5, pp. 1133–1141, Oct. 2004. doi: 10.1109/JSTQE.2004.835298.
[65] M. E. Marhic, N. Kagi, T.-K. Chiang, and L. G. Kazovsky, “Broadband ber opticalparametric ampliers”, Optics Letters, vol. 21, no. 8, pp. 573–575, 1996. doi: 10.1364/OL.21.000573.
[66] S. Pitois andG.Millot, “Experimental observation of a newmodulational instabilityspectral window induced by fourth-order dispersion in a normally dispersivesingle-mode optical ber”, Optics Communications, vol. 226, no. 1–6, pp. 415–422,Oct. 2003. doi: 10.1016/j.optcom.2003.09.001.
[67] G. K. L. Wong, S. G. Murdoch, R. Leonhardt, J. D. Harvey, and V. Marie, “High-conversion-eciency widely-tunable all-ber optical parametric oscillator”,OpticsExpress, vol. 15, no. 6, pp. 2947–2952, Mar. 2007. doi: 10.1364/OE.15.002947.
[68] A. Gershikov, E. Shumakher, A. Willinger, and G. Eisenstein, “Fiber parametricoscillator for the 2 µm wavelength range based on narrowband optical parametricamplication”, Optics Letters, vol. 35, no. 19, pp. 3198–3200, Oct. 2010. doi: 10.1364/OL.35.003198.
[69] A. Gershikov, J. Lasri, Z. Sacks, and G. Eisenstein, “A tunable ber parametricoscillator for the 2 µmwavelength range employing an intra-cavity thulium dopedber active lter”, Optics Communications, vol. 284, no. 21, pp. 5218–5220, Oct.2011. doi: 10.1016/j.optcom.2011.07.043.
[70] K. Inoue, “Four-wave mixing in an optical ber in the zero-dispersion wavelengthregion”, Journal of Lightwave Technology, vol. 10, no. 11, pp. 1553–1561, Nov. 1992.doi: 10.1109/50.184893.
[71] Y. Emori, S.-I. Matsushita, and S. Namiki, “Cost-eective depolarized diode pumpunit designed for C-band at-gain Raman ampliers to control EDFA gain pro-le”, in Optical Fiber Communication Conference (OFC), (Mar. 7–10, 2000), vol. 4,Baltimore, MD, USA, 2000, pp. 106–108. doi: 10.1109/OFC.2000.869430.
[72] S. Namiki and Y. Emori, “Ultrabroad-band Raman ampliers pumped and gain-equalized by wavelength-division-multiplexed high-power laser diodes”, Journalof Selected Topics in Quantum Electronics, vol. 7, no. 1, pp. 3–16, 2001. doi: 10.1109/2944.924003.
[73] H. H. Kee, C. R. S. Fludger, and V. Handerek, “Statistical properties of polarisationdependent gain in bre Raman ampliers”, in Optical Fiber Communication Con-ference and Exhibit (OFC), (Mar. 17–22, 2002), Anaheim, CA, USA, 2002, pp. 180–181. doi: 10.1109/OFC.2002.1036289.
[74] T. Tokura, T. Kogure, T. Sugihara, K. Shimizu, T. Mizuochi, and K. Motoshima,“Pump light depolarization method for low PDG Raman amplication”, inOpticalFiber CommunicationConference and Exhibit (OFC), (Mar. 17–22, 2002), Anaheim,CA, USA, 2002, pp. 645–646. doi: 10.1109/OFC.2002.1036620.
[75] E. S. Son, J. H. Lee, and Y. C. Chung, “Exact analysis for statistics of gain incounter-pumped Raman amplier”, in Optical Fiber Communication Conference(OFC), (Feb. 23–27, 2004), vol. 1, Los Angeles, CA, USA, 2004, WJ3.
90

REFERENCES
[76] J. Bromage, “Raman amplication for ber communications systems”, Journalof Lightwave Technology, vol. 22, no. 1, pp. 79–93, Jan. 2004. doi: 10.1109/JLT.2003.822828.
[77] E. S. Son, J. H. Lee, and Y. C. Chung, “Statistics of polarization-dependent gain inber Raman ampliers”, Journal of Lightwave Technology, vol. 23, no. 3, pp. 1219–1226, Mar. 2005. doi: 10.1109/JLT.2005.843499.
[78] Z. Li, Z. Li, X. H. Lim, C. Lu, J. Chen, and Y. Wang, “Reduction of polarization-dependent gain due to signal-to-signal Raman interaction in ber Raman am-plier”, Photonics Technology Letters, vol. 17, no. 3, pp. 558–560, Mar. 2005. doi:10.1109/LPT.2004.842369.
[79] X. Zhou, P. Magill, and M. Birk, “Model for polarization-dependent gain due topump depletion in a WDM system with forward-pumped Raman amplication”,Journal of Lightwave Technology, vol. 23, no. 3, pp. 1056–1062, Mar. 2005. doi:10.1109/JLT.2004.839990.
[80] T. Tokura, T. Kogure, T. Sugihara, K. Shimizu, T. Mizuochi, and K. Motoshima,“Ecient pump depolarizer analysis for distributed Raman amplier with lowpolarization dependence of gain”, Journal of Lightwave Technology, vol. 24, no. 11,pp. 3889–3896, Nov. 2006. doi: 10.1109/JLT.2006.883600.
[81] B. Foley, M. L. Dakss, R. W. Davies, and P. Melman, “Gain saturation in berRaman ampliers due to stimulated Brillouin scattering”, Journal of LightwaveTechnology, vol. 7, no. 12, pp. 2024–2032, Dec. 1989. doi: 10.1109/50.41624.
[82] E. Lichtman, R. G. Waarts, and A. A. Friesem, “Stimulated Brillouin scatteringexcited by a modulated pump wave in single-mode bers”, Journal of LightwaveTechnology, vol. 7, no. 1, pp. 171–174, Jan. 1989. doi: 10.1109/50.17750.
[83] A. R. Chraplyvy, “Limitations on lightwave communications imposed by optical-ber nonlinearities”, Journal of Lightwave Technology, vol. 8, no. 10, pp. 1548–1557,Oct. 1990. doi: 10.1109/50.59195.
[84] A. Kobyakov, M. Sauer, and D. Chowdhury, “Stimulated Brillouin scattering inoptical bers”, Advances in Optics and Photonics, vol. 2, no. 1, pp. 1–59, Mar. 2010.doi: 10.1364/AOP.2.000001.
[85] M. O. van Deventer and A. J. Boot, “Polarization properties of stimulated Brillouinscattering in single-mode bers”, Journal of Lightwave Technology, vol. 12, no. 4,pp. 585–590, 1994. doi: 10.1109/50.285349.
[86] C. A. S. de Oliveira, C. K. Jen, A. Shang, and C. Saravanos, “Stimulated brillouinscattering in cascaded bers of dierent Brillouin frequency shi s”, Journal of theOptical Society of America B, vol. 10, no. 6, pp. 969–972, Jun. 1993. doi: 10.1364/JOSAB.10.000969.
[87] D. Cotter, “Suppression of stimulated Brillouin scattering during transmission ofhigh-power narrowband laser light in monomode bre”, Electronics Letters, vol.18, no. 15, pp. 638–640, Jul. 1982. doi: 10.1049/el:19820435.
91

REFERENCES
[88] M. Lorenzen, D. Noordegraaf, C. Vandel Nielsen, O. Odgaard, L. Gruner-Nielsen,and K. Rottwitt, “Brillouin suppression in a ber optical parametric amplier bycombining temperature distribution and phase modulation”, inConference on Op-tical Fiber communication/National FiberOptic Engineers Conference (OFC/NFOEC),(Feb. 24–28, 2008), San Diego, CA, USA, 2008, pp. 1–3. doi: 10.1109/OFC.2008.4528357.
[89] F. H. Tithi and M. S. Islam, “Suppression of stimulated Brillouin scattering eectusing nonlinear phase modulation”, in International Conference on Electrical andComputer Engineering (ICECE), (Dec. 18–20, 2010), Dhaka, Dec. 2010, pp. 135–138.doi: 10.1109/ICELCE.2010.5700645.
[90] F. W. Willems, W. Muys, and J. S. Leong, “Simultaneous suppression of stimulatedBrillouin scattering and interferometric noise in externally modulated lightwaveAM-SCM systems”, Photonics Technology Letters, vol. 6, no. 12, pp. 1476–1478, Dec.1994. doi: 10.1109/68.392206.
[91] M. Nakazawa, “Rayleigh backscattering theory for single-mode optical bers”,Journal of the Optical Society of America, vol. 73, no. 9, pp. 1175–1180, Sep. 1983.doi: 10.1364/JOSA.73.001175.
[92] O. Okusaga, J. P. Cahill, A. Docherty, C. R. Menyuk, and W. Zhou, “Spontaneousinelastic Rayleigh scattering in optical bers”,Optics Letters, vol. 38, no. 4, pp. 549–551, Feb. 2013. doi: 10.1364/OL.38.000549.
[93] Y. Takushima and T. Okoshi, “Suppression of stimulated Brillouin scatteringusing optical isolators”, Electronics Letters, vol. 28, no. 12, pp. 1155–1157, 1992. doi:10.1049/el:19920729.
[94] K. Shiraki, M. Ohashi, and M. Tateda, “SBS threshold of a ber with a Brillouinfrequency shi distribution”, Journal of Lightwave Technology, vol. 14, no. 1, pp. 50–57, Jan. 1996. doi: 10.1109/50.476136.
[95] F. Poletti, K. Furusawa, Z. Yuso, N. G. R. Broderick, and D. J. Richardson, “Non-linear tapered holey bers with high stimulated Brillouin scattering threshold andcontrolled dispersion”, Journal of the Optical Society of America B, vol. 24, no. 9,pp. 2185–2194, Sep. 2007. doi: 10.1364/JOSAB.24.002185.
[96] K. Shiraki, M. Ohashi, and M. Tateda, “Suppression of stimulated Brillouin scat-tering in a bre by changing the core radius”, Electronics Letters, vol. 31, no. 8,pp. 668–669, Apr. 1995. doi: 10.1049/el:19950418.
[97] A. Liu, “Suppressing stimulatedBrillouin scattering inber ampliers using nonuni-form ber andtemperature gradient”, Optics Express, vol. 15, no. 3, pp. 977–984,Feb. 2007. doi: 10.1364/OE.15.000977.
[98] M. D. Mermelstein, “SBS threshold measurements and acoustic beam propagationmodeling in guiding and anti-guiding single mode optical bers”, Optics Express,vol. 17, no. 18, pp. 16 225–16 237, Aug. 2009. doi: 10.1364/OE.17.016225.
[99] M.-J. Li, X. Chen, J. Wang, S. Gray, A. Liu, J. A. Demeritt, A. B. Run, A. M.Crowley, D. T. Walton, and L. A. Zenteno, “Al/Ge co-doped large mode area berwith high SBS threshold”, Optics Express, vol. 15, no. 13, pp. 8290–8299, Jun. 2007.doi: 10.1364/OE.15.008290.
92

REFERENCES
[100] L. Gruner-Nielsen, S. Dasgupta, M. D. Mermelstein, D. Jakobsen, S. Herstrøm,M. E. V. Pedersen, E. L. Lim, S. Alam, F. Parmigiani, D. Richardson, and B. Pals-dottir, “A silica based highly nonlinear bre with improved threshold for stimu-lated Bbrillouin scattering”, in 36th European Conference and Exhibition on Opti-cal Communication (ECOC), (Sep. 19–23, 2010), Torino, Italy, 2010, pp. 1–3. doi:10.1109/ECOC.2010.5621232.
[101] Y. Koyamada, S. Sato, S. Nakamura, H. Sotobayashi, andW.Chujo, “Simulating anddesigning Brillouin gain spectrum in single-mode bers”, Journal of LightwaveTechnology, vol. 22, no. 2, pp. 631–639, Feb. 2004. doi: 10.1109/JLT.2003.822007.
[102] Y. Imai and N. Shimada, “Dependence of stimulated Brillouin scattering on tem-perature distribution in polarization-maintaining bers”, Photonics TechnologyLetters, vol. 5, no. 11, pp. 1335–1337, Nov. 1993. doi: 10.1109/68.250061.
[103] J. Hansryd, F. Dross, M. Westlund, P. A. Andrekson, and S. N. Knudsen, “Increaseof the SBS threshold in a short highly nonlinear ber by applying a temperaturedistribution”, Journal of Lightwave Technology, vol. 19, no. 11, pp. 1691–1697, Nov.2001. doi: 10.1109/50.964069.
[104] L. Gruner-Nielsen, S. Herstrøm, S. Dasgupta, D. Richardson, D. Jakobsen, C. Lund-ström, P. A. Andrekson, M. E. V. Pedersen, and B. Palsdottir, “Silica-based highlynonlinear bers with a high SBS threshold”, in IEEE Winter Topicals (WTM),(Jan. 10–12, 2011), Keystone, CO, USA, 2011, pp. 171–172. doi: 10.1109/PHOTWTM.2011.5730102.
[105] T. Kurashima, T. Horiguchi, and M. Tateda, “Thermal eects of Brillouin gainspectra in single-mode bers”, Photonics Technology Letters, vol. 2, no. 10, pp. 718–720, Oct. 1990. doi: 10.1109/68.60770.
[106] J. M. C. Boggio, J. D. Marconi, and H. L. Fragnito, “Experimental and numericalinvestigation of the SBS-threshold increase in an optical ber by applying straindistributions”, Journal of Lightwave Technology, vol. 23, no. 11, pp. 3808–3814, Nov.2005. doi: 10.1109/JLT.2005.856226.
[107] W. Zou, Z. He, A. D. Yablon, and K. Hotate, “Dependence of Brillouin frequencyshi in optical bers on draw-induced residual elastic and inelastic strains”, Pho-tonics Technology Letters, vol. 19, no. 18, pp. 1389–1391, Sep. 2007. doi: 10.1109/LPT.2007.903341.
[108] R. H. Stolen, C. Lin, and R. K. Jain, “A time-dispersion-tuned ber Raman oscilla-tor”, Applied Physics Letters, vol. 30, no. 7, pp. 340–342, Apr. 1977. doi: 10.1063/1.89391.
[109] K. Tamura and M. Nakazawa, “Dispersion-tuned harmonically mode-locked berring laser for self-synchronization to an external clock”, Optics Letters, vol. 21, no.24, pp. 1984–1986, Dec. 1996. doi: 10.1364/OL.21.001984.
[110] S. Li and K. T. Chan, “Electrical wavelength tunable and multiwavelength activelymode-locked ber ring laser”,Applied Physics Letters, vol. 72, no. 16, pp. 1954–1956,Apr. 1998. doi: 10.1063/1.121263.
93

REFERENCES
[111] K. Chan and C. Shu, “Compensated dispersion tuning in harmonically mode-locked ber laser”, Applied Physics Letters, vol. 75, no. 7, pp. 891–893, Aug. 1999.doi: 10.1063/1.124545.
[112] S. Yamashita andM. Asano, “Wide and fast wavelength-tunable mode-locked berlaser based on dispersion tuning”, Optics Express, vol. 14, no. 20, pp. 9299–9306,Oct. 2006. doi: 10.1364/OE.14.009299.
[113] Y. Zhou, K. K. Y. Cheung, Q. Li, S. Yang, P. C. Chui, and K. K.-Y. Wong, “Fastand wide tuning wavelength-swept source based on dispersion-tuned ber opticalparametric oscillator”, Optics Letters, vol. 35, no. 14, pp. 2427–2429, Jul. 2010. doi:10.1364/OL.35.002427.
[114] S. Yang, K. K. Y. Cheung, Y. Zhou, and K. K.-Y. Wong, “Dispersion-tuned har-monically mode-locked ber-optical parametric oscillator”, Photonics TechnologyLetters, vol. 22, no. 8, pp. 580–582, Apr. 2010. doi: 10.1109/LPT.2010.2043091.
[115] H. Takesue and T. Horiguchi, “Chromatic dispersion measurement of opticalcomponents using lightwave synthesized frequency sweeper”, Journal of LightwaveTechnology, vol. 20, no. 4, pp. 625–633, Apr. 2002. doi: 10.1109/50.996582.
[116] B. Desthieux, R. I. Laming, and D. N. Payne, “111 kW (0.5 mJ) pulse amplicationat 1.5 µm using a gated cascade of three erbium-doped ber ampliers”, AppliedPhysics Letters, vol. 63, no. 5, pp. 586–588, Aug. 1993. doi: 10.1063/1.109957.
[117] J. Nilsson and B. Jaskorzynska, “Modeling and optimization of low-repetition-ratehigh-energy pulse amplication in cw-pumped erbium-doped ber ampliers”,Optics Letters, vol. 18, no. 24, pp. 2099–2101, Dec. 1993. doi: 10.1364/OL.18.002099.
[118] D. Dahan and G. Eisenstein, “Tunable all optical delay via slow and fast lightpropagation in a Raman assisted ber optical parametric amplier: a route to alloptical buering”, Optics Express, vol. 13, no. 16, pp. 6234–6249, Aug. 2005. doi:10.1364/OPEX.13.006234.
[119] A. S. Y. Hsieh, G. K. L. Wong, S. G. Murdoch, S. Coen, F. Vanholsbeeck, R. Leon-hardt, and J. D. Harvey, “Combined eect of Raman and parametric gain onsingle-pump parametric ampliers”, Optics Express, vol. 15, no. 13, pp. 8104–8114,Jun. 2007. doi: 10.1364/OE.15.008104.
[120] A. Willinger, E. Shumakher, and G. Eisenstein, “On the roles of polarizationand Raman-assisted phase matching in narrowband ber parametric ampliers”,Journal of Lightwave Technology, vol. 26, no. 14, pp. 2260–2268, Jul. 2008. doi:10.1109/JLT.2008.923273.
[121] J. Ye and S. T. Cundi, Eds., Femtosecond Optical Frequency Comb: Principle, Op-eration and Applications. Springer, 2005.
[122] S. A. Diddams, “The evolving optical frequency comb [invited]”, Journal of theOptical Society of America B, vol. 27, no. 11, B51–B62, Nov. 2010. doi: 10.1364/JOSAB.27.000B51.
[123] T. Udem, R. Holzwarth, and T.W. Hänsch, “Optical frequency metrology”,Nature,vol. 416, no. 6877, pp. 233–237, Mar. 2002. doi: 10.1038/416233a.
94

REFERENCES
[124] M. Kuntz, G. Fiol, M. Lämmlin, D. Bimberg, M. G. ¿ompson, K. T. Tan, C.Marinelli, R. V. Penty, I. H. White, V. M. Ustinov, A. E. Zhukov, Y. M. Shernyakov,and A. R. Kovsh, “35 GHz mode-locking of 1.3 µm quantum dot lasers”, AppliedPhysics Letters, vol. 85, no. 5, pp. 843–845, Aug. 2004. doi: 10.1063/1.1776340.
[125] E. U. Rafailov, M. A. Cataluna, andW. Sibbett, “Mode-locked quantum-dot lasers”,Nature Photonics, vol. 1, no. 7, pp. 395–401, Jul. 2007. doi: 10.1038/nphoton.2007.120.
[126] A. A. Savchenkov, A. B. Matsko, W. Liang, V. S. Ilchenko, D. Seidel, and L. Maleki,“Kerr combs with selectable central frequency”, Nature Photonics, vol. 5, no. 5,pp. 293–296, May 2011. doi: 10.1038/nphoton.2011.50.
[127] T. J. Kippenberg, S. M. Spillane, and K. J. Vahala, “Kerr-nonlinearity optical para-metric oscillation in an ultrahigh-Q toroid microcavity”, Physical Review Letters,vol. 93, no. 8, p. 083 904, Aug. 2004. doi: 10.1103/PhysRevLett.93.083904.
[128] P.Del’Haye, A. Schliesser, O. Arcizet, T.Wilken, R.Holzwarth, andT. J. Kippenberg,“Optical frequency comb generation from a monolithic microresonator”, Nature,vol. 450, no. 7173, pp. 1214–1217, Dec. 2007. doi: 10.1038/nature06401.
[129] I. H. Agha, Y. Okawachi, M. A. Foster, J. E. Sharping, and A. L. Gaeta, “Four-wave-mixing parametric oscillations in dispersion-compensated high-Q silicamicrospheres”, Physical Review A, vol. 76, no. 4, p. 043 837, Oct. 2007. doi: 10.1103/PhysRevA.76.043837.
[130] A. C. Turner, M. A. Foster, A. L. Gaeta, and M. Lipson, “Ultra-low power para-metric frequency conversion in a silicon microring resonator”, Optics Express, vol.16, no. 7, pp. 4881–4887, Mar. 2008. doi: 10.1364/OE.16.004881.
[131] J. S. Levy, A. Gondarenko, M. A. Foster, A. C. Turner-Foster, A. L. Gaeta, andM. Lipson, “CMOS-compatible multiple-wavelength oscillator for on-chip opticalinterconnects”,Nature Photonics, vol. 4, no. 1, pp. 37–40, Jan. 2010. doi: 10.1038/nphoton.2009.259.
[132] J. S. Levy, K. Saha, Y. Okawachi, M. A. Foster, A. L. Gaeta, and M. Lipson, “High-performance silicon-nitride-based multiple-wavelength source”, Photonics Tech-nology Letters, vol. 24, no. 16, pp. 1375–1377, 2012. doi: 10.1109/LPT.2012.2204245.
[133] C. J. McKinstrie and M. G. Raymer, “Four-wave-mixing cascades near the zero-dispersion frequency”, Optics Express, vol. 14, no. 21, pp. 9600–9610, Oct. 2006.doi: 10.1364/OE.14.009600.
[134] A. Varanavičius, A. Dubietis, A. Beržanskis, R. Danielius, and A. Piskarskas, “Near-degenerate cascaded four-wave mixing in an optical parametric amplier”, OpticsLetters, vol. 22, no. 21, pp. 1603–1605, Nov. 1997. doi: 10.1364/OL.22.001603.
[135] R. Tang, J. Lasri, P. S. Devgan, V. Grigoryan, P. Kumar, and M. Vasilyev, “Gaincharacteristics of a frequency nondegenerate phase-sensitive ber-optic parametricamplier with phase self-stabilized input”,Optics Express, vol. 13, no. 26, pp. 10 483–10 493, Dec. 2005. doi: 10.1364/OPEX.13.010483.
95

REFERENCES
[136] A. Gershikov and G. Eisenstein, “Narrowband phase sensitive ber parametricamplier”,Optics Letters, vol. 37, no. 15, pp. 3204–3206, Aug. 2012. doi: 10.1364/OL.37.003204.
[137] L.-S. Ma, P. Jungner, J. Ye, and J. L. Hall, “Delivering the same optical frequency attwo places: accurate cancellation of phase noise introduced by an optical ber orother time-varying path”, Optics Letters, vol. 19, no. 21, pp. 1777–1779, Nov. 1994.doi: 10.1364/OL.19.001777.
[138] D. Braje, L. Hollberg, and S. Diddams, “Brillouin-enhanced hyperparametricgeneration of an optical frequency comb in a monolithic highly nonlinear bercavity pumped by a CW laser”, Physical Review Letters, vol. 102, no. 19, p. 193 902,May 2009. doi: 10.1103/PhysRevLett.102.193902.
[139] J. Li, X. Xiao, L. Kong, and C. Yang, “Enhancement of cascaded four-wave mixingvia optical feedback”, Optics Express, vol. 20, no. 20, pp. 21 940–21 945, Sep. 2012.doi: 10.1364/OE.20.021940.
[140] R. Noé, H. Heidrich, and D. Homann, “Endless polarization control systemsfor coherent optics”, Journal of Lightwave Technology, vol. 6, no. 7, pp. 1199–1208,1988. doi: 10.1109/50.4117.
[141] N. G. Walker and G. R. Walker, “Polarization control for coherent communi-cations”, Journal of Lightwave Technology, vol. 8, no. 3, pp. 438–458, 1990. doi:10.1109/50.50740.
[142] R. Noé, D. Sandel, and V.Mirvoda, “PMD in high-bit-rate transmission andmeansfor its mitigation”, Journal of Selected Topics in Quantum Electronics, vol. 10, no. 2,pp. 341–355, 2004. doi: 10.1109/JSTQE.2004.827842.
[143] P. Oswald and C. K. Madsen, “Deterministic analysis of endless tuning of polar-ization controllers”, Journal of Lightwave Technology, vol. 24, no. 7, pp. 2932–2939,Jul. 2006. doi: 10.1109/JLT.2006.872688.
[144] A. Hidayat, B. Koch, H. Zhang, V. Mirvoda, M. Lichtinger, D. Sandel, and R. Noé,“High-speed endless optical polarization stabilization using calibrated waveplatesand eld-programmable gate array-based digital controller”, Optics Express, vol.16, no. 23, pp. 18 984–18 991, Nov. 2008. doi: 10.1364/OE.16.018984.
[145] M. Martinelli, P. Martelli, and S. M. Pietralunga, “Polarization stabilization inoptical communications systems”, Journal of Lightwave Technology, vol. 24, no. 11,pp. 4172–4183, Nov. 2006. doi: 10.1109/JLT.2006.884228.
[146] B. Koch, A. Hidayat, H. Zhang, V. Mirvoda, M. Lichtinger, D. Sandel, and R.Noe, “Optical endless polarization stabilization at 9 krad/s with FPGA-basedcontroller”, Photonics Technology Letters, vol. 20, no. 12, pp. 961–963, 2008. doi:10.1109/LPT.2008.922910.
[147] V. V. Kozlov, J. Nuño, J. D. Ania-Castañón, and S. Wabnitz, “Analytic theory ofber-optic Raman polarizers”, Optics Express, vol. 20, no. 24, pp. 27 242–27 247,Nov. 2012. doi: 10.1364/OE.20.027242.
[148] C. R. S. Fludger, V. Handerek, and R. J. Mears, “Pump to signal RIN transfer inRaman ber ampliers”, Journal of Lightwave Technology, vol. 19, no. 8, pp. 1140–1148, Aug. 2001. doi: 10.1109/50.939794.
96

REFERENCES
[149] Q. Lin and G. P. Agrawal, “Vector theory of stimulated Raman scattering andits application to ber-based Raman ampliers”, Journal of the Optical Society ofAmerica B, vol. 20, no. 8, pp. 1616–1631, 2003. doi: 10.1364/JOSAB.20.001616.
[150] R. Hellwarth, J. Cherlow, and T.-T. Yang, “Origin and frequency dependenceof nonlinear optical susceptibilities of glasses”, Physical Review B, vol. 11, no. 2,pp. 964–967, Jan. 1975. doi: 10.1103/PhysRevB.11.964.
[151] I. Mandelbaum, M. Bolshtyansky, T. F. Heinz, and A. R. H. Walker, “Method formeasuring the Raman gain tensor in optical bers”, Journal of the Optical Societyof America B, vol. 23, no. 4, pp. 621–627, Apr. 2006. doi: 10.1364/JOSAB.23.000621.
[152] S. Kumar, A. Selvarajan, and G. V. Anand, “Inuence of Raman scattering on thecross phase modulation in optical bers”, Optics Communications, vol. 102, no.3–4, pp. 329–335, Oct. 1993. doi: 10.1016/0030-4018(93)90405-T.
[153] A. Höök, “Inuence of stimulated Raman scattering on cross-phase modulationbetween waves in optical bers”, Optics Letters, vol. 17, no. 2, pp. 115–117, Jan. 1992.doi: 10.1364/OL.17.000115.
[154] Q. Lin and G. P. Agrawal, “Polarization mode dispersion-induced uctuationsduring Raman amplications in optical bers”, Optics Letters, vol. 27, no. 24,pp. 2194–2196, Dec. 2002. doi: 10.1364/OL.27.002194.
[155] ——, “Statistics of polarization-dependent gain in ber-based Raman ampliers”,Optics Letters, vol. 28, no. 4, pp. 227–229, Feb. 2003. doi: 10.1364/OL.28.000227.
[156] R. H. Stolen, J. P. Gordon, W. J. Tomlinson, and H. A. Haus, “Raman responsefunction of silica-core bers”, Journal of the Optical Society of America B, vol. 6,no. 6, pp. 1159–1166, Jun. 1989. doi: 10.1364/JOSAB.6.001159.
[157] A. Galtarossa and L. Palmieri, “Reectometric measurements of polarizationproperties in optical-ber links”, Journal of Optical and Fiber CommunicationsReports, vol. 1, no. 2, pp. 150–179, Oct. 2004. doi: 10.1007/s10297-004-0012-2.
[158] A. Galtarossa, L. Palmieri, M. Schiano, and T. Tambosso, “Measurement of bire-fringence correlation length in long, single-mode bers”, Optics Letters, vol. 26,no. 13, pp. 962–964, Jul. 2001. doi: 10.1364/OL.26.000962.
[159] ——, “Statistical characterization of ber random birefringence”, Optics Letters,vol. 25, no. 18, pp. 1322–1324, Sep. 2000. doi: 10.1364/OL.25.001322.
[160] P. K. A. Wai and C. R. Menyuk, “Polarization mode dispersion, decorrelation,and diusion in optical bers with randomly varying birefringence”, Journal ofLightwave Technology, vol. 14, no. 2, pp. 148–157, Feb. 1996. doi: 10.1109/50.482256.
[161] P. K. A. Wai, W. L. Kath, C. R. Menyuk, and J. W. Zhang, “Nonlinear polarization-mode dispersion in optical bers with randomly varying birefringence”, Journalof the Optical Society of America B, vol. 14, no. 11, pp. 2967–2979, Nov. 1997. doi:10.1364/JOSAB.14.002967.
97

REFERENCES
[162] W.H. Press, S. A. Teukolsky,W. T. Vetterling, and B. P. Flannery,Numerical Recipes3rd Edition: ¿e Art of Scientic Computing, 3rd ed. Cambridge University Press,Sep. 2007.
[163] R. H. Stolen, “Polarization eects in ber Raman and Brillouin lasers”, Journalof Quantum Electronics, vol. 15, no. 10, pp. 1157–1160, 1979. doi: 10.1109/JQE.1979.1069913.
[164] M. Santagiustina, “Exact integral solution of saturation and depletion in for-ward and backward optical ber Raman ampliers”, Optics Letters, vol. 32, no. 20,pp. 3023–3025, Oct. 2007. doi: 10.1364/OL.32.003023.
[165] S. R. Chinn, “Analysis of counter-pumped small-signal bre Raman ampliers”,Electronics Letters, vol. 33, no. 7, pp. 607–608, Mar. 1997. doi: 10.1049/el:19970428.
[166] J. AuYeung and A. Yariv, “Spontaneous and stimulated Raman scattering in longlow loss bers”, Journal of Quantum Electronics, vol. 14, no. 5, pp. 347–352, 1978.doi: 10.1109/JQE.1978.1069797.
[167] H. G. Berry, G. Gabrielse, and A. E. Livingston, “Measurement of the Stokesparameters of light”, Applied Optics, vol. 16, no. 12, pp. 3200–3205, Dec. 1977. doi:10.1364/AO.16.003200.
[168] J. N. Damask, Polarization Optics in Telecommunications, W. T. Rhodes, Ed., ser.Springer Series in Optical Sciences. Springer, 2005, vol. 101. doi: 10 . 1007 /b137386.
[169] E. Collett, Field Guide to Polarization, J. E. Greivenkamp, Ed., ser. SPIE FieldGuides. SPIE, 2005, vol. FG05. doi: 10.1117/3.626141.
[170] R. C. Jones, “A new calculus for the treatment of optical systems I: descriptionand discussion of the calculus”, Journal of the Optical Society of America, vol. 31,no. 7, pp. 488–493, Jul. 1941. doi: 10.1364/JOSA.31.000488.
[171] G. G. Stokes, “On the composition and resolution of streams of polarized lightfrom dierent sources”, Transactions of the Cambridge Philosophical Society, vol.9, pp. 399–416, 1852.
[172] J. P. Gordon and H. Kogelnik, “PMD fundamentals: polarization mode dispersionin optical bers”, Proceedings of the National Academy of Sciences of the UnitedStates of America, vol. 97, no. 9, pp. 4541–4550, Apr. 2000. doi: 10.1073/pnas.97.9.4541.
[173] J. W. E. M. von Pauli, “Zur Quantenmechanik des magnetischen Elektrons”,Zeitschri für Physik, vol. 43, no. 9–10, pp. 601–623, Sep. 1927. doi: 10.1007/BF01397326.
[174] C. Flueraru, S. Latoui, J. Besse, and P. Legendre, “Error analysis of a rotating quarter-wave plate Stokes’ polarimeter”, Transactions on Instrumentation and Measure-ment, vol. 57, no. 4, pp. 731–735, Apr. 2008. doi: 10.1109/TIM.2007.913752.
[175] B. Schaefer, E. Collett, R. Smyth, D. Barrett, and B. Fraher, “Measuring the Stokespolarization parameters”, American Journal of Physics, vol. 75, no. 2, p. 163, 2007.doi: 10.1119/1.2386162.
98

REFERENCES
[176] L. Giudicotti and M. Brombin, “Data analysis for a rotating quarter-wave, far-infrared Stokes polarimeter”, Applied Optics, vol. 46, no. 14, pp. 2638–2648, May2007. doi: 10.1364/AO.46.002638.
[177] M. J. Walker, “Matrix calculus and the Stokes parameters of polarized radiation”,American Journal of Physics, vol. 22, no. 4, pp. 170–174, 1954. doi: 10.1119/1.1933670.
[178] P. J. Leo, G. R. Gray, G. J. Simer, and K. B. Rochford, “State of polarization changes:classication and measurement”, Journal of Lightwave Technology, vol. 21, no. 10,pp. 2189–2193, 2003. doi: 10.1109/JLT.2003.816813.
[179] W. H. J. Aarts and G.-D. Khoe, “New endless polarization control method usingthree ber squeezers”, Journal of Lightwave Technology, vol. 7, no. 7, pp. 1033–1043,1989. doi: 10.1109/50.29630.
[180] G. Marsaglia, “Choosing a point from the surface of a sphere”, ¿e Annals ofMathematical Statistics, vol. 43, no. 2, pp. 645–646, Apr. 1972. doi: 10.1214/aoms/1177692644.
[181] M. E.Muller, “Anote on amethod for generating points uniformly on n-dimensionalspheres”, Communications of the ACM, vol. 2, no. 4, pp. 19–20, Apr. 1959. doi:10.1145/377939.377946.
[182] ——, “Some continuous Monte Carlo methods for the Dirichlet problem”,¿eAnnals of Mathematical Statistics, vol. 27, no. 3, pp. 569–589, Sep. 1956. doi: 10.1214/aoms/1177728169.
[183] L. Yao, H. Huang, J. Chen, E. Tan, and A. Willner, “A novel scheme for achievingquasi-uniform rate polarization scrambling at 752 krad/s”, Optics Express, vol. 20,no. 2, pp. 1691–1699, Jan. 2012. doi: 10.1364/OE.20.001691.
[184] B. Koch, R. Noé, V. Mirvoda, and D. Sandel, “100 krad/s endless polarisationtrackingwithminiaturisedmodule card”,Electronics Letters, vol. 47, no. 14, pp. 813–814, 2011. doi: 10.1049/el.2011.1522.
[185] C. R. Menyuk, D. Wang, and A. N. Pilipetskii, “Repolarization of polarization-scrambled optical signals due to polarization dependent loss”, Photonics Technol-ogy Letters, vol. 9, no. 9, pp. 1247–1249, 1997. doi: 10.1109/68.618493.
[186] I. Kaminow, “Polarization in optical bers”, Journal of Quantum Electronics, vol.17, no. 1, pp. 15–22, Jan. 1981. doi: 10.1109/JQE.1981.1070626.
[187] J. P. Gordon, “Statistical properties of polarization mode dispersion”, Journal ofOptical and Fiber Communications Reports, vol. 1, no. 3, pp. 210–217, Nov. 2004.doi: 10.1007/s10297-004-0003-3.
[188] M. Karlsson and H. Sunnerud, “PMD impact on optical systems: single- andmultichannel eects”, Journal of Optical and Fiber Communications Reports, vol.1, no. 2, pp. 123–140, Oct. 2004. doi: 10.1007/s10297-004-0013-1.
[189] R. Ulrich and A. Simon, “Polarization optics of twisted single-mode bers”, Ap-plied Optics, vol. 18, no. 13, pp. 2241–2251, Jul. 1979. doi: 10.1364/AO.18.002241.
[190] A. Papoulis and S. U. Pillai,Probability, RandomVariables, and Stochastic Processes,4th ed. McGraw-Hill, 2002.
99

REFERENCES
[191] P. K. A. Wai and C. R. Menyuk, “Polarization decorrelation in optical bers withrandomly varying birefringence”, Optics Letters, vol. 19, no. 19, pp. 1517–1519, Oct.1994. doi: 10.1364/OL.19.001517.
[192] A. Galtarossa, L. Palmieri, M. Schiano, and T. Tambosso, “Measurements of beatlength and perturbation length in long single-mode bers”, Optics Letters, vol. 25,no. 6, pp. 384–386, Mar. 2000. doi: 10.1364/OL.25.000384.
[193] J. Stoer and R. Bulirsch, Introduction to Numerical Analysis. Springer, 1992.
[194] U.M.Ascher, R.M.M.Mattheij, andR.D. Russell,Numerical Solution of BoundaryValue Problems for Ordinary Dierential Equations. SIAM, 1995.
[195] M. Abramowitz and I. A. Stegun, Handbook of Mathematical Functions: WithFormulas, Graphs, and Mathematical Tables. Dover Publications, 1964.
[196] J. C. Butcher, Numerical methods for ordinary dierential equations, 2nd ed. JohnWiley & Sons, 2008.
100