Embed Size (px)
Citation preview

Analysis on the Factors and Effects of Engine Tapping Noise by Design of Experiment (DOE)
Mohd Shahrudin Mohd AliasNor Hayati Saad*
Juri SaedonFaculty of Mechanical Engineering
Universiti Teknologi MARA (UiTM), Shah AlamE-mail: [email protected]
*Corresponding author / E-mail: [email protected]: [email protected]
Nor Hidayahti HassanSaidi Harun
Perusahaan Otomobil Nasional Sdn Bhd, Shah AlamE-mail: [email protected]: [email protected]
ABSTRACT
The effect of various factors on engine noises have been studied in several ways involving component simulation and product investigations. However, the solution remain exclusive and investigation may be expensive but yet to solve the engine noise issues entirely for several engine Original Equipment Manufacturers (OEMs). Manufacturing has many factors that much to be considered and this includes the uncontrolled or ‘noise’ factors that exist within the process and product operation. The main research objective is to determine the optimum combination of control factors for engine valvetrain tapping sound while robust to noise factors by using Taguchi method. The objective is also to identify the most significant factors by using Analysis of Variance (ANOVA) approach. In this study, the effects of seven controlled factors and two uncontrolled factors were investigated by implementing the Orthogonal Arrays (OA) of Taguchi experimental method on a DOHC gasoline engine. The Orthogonal Array design of L82
7 was chosen and eight experiment runs with pre-test run were conducted at the manufacturing plant in actual engine running condition. The optimum parameters from the DOE yield the best sound pressure level of 70.34 dB SPL based on software prediction, while the most significant factor found to be considered for improvement was the camshaft exhaust waviness of minimum level (waviness curve-maximum, WCM 2.0μm and
journal jMeche Vol 12.indd 27 4/20/2016 12:38:39 PM

28
Journal of Mechanical engineering (JMeche)
below). Based on the confirmation run result, the optimum parameters yield the actual sound pressure level of 70.4 dB SPL which equal to predicted value. This result further convince that the implemented methodology is effective to find the best combinations of the studied factor parameters and able to reduce the engine valvetrain noise level.
Keywords: Valvetrain noise, DOHC (Double Overhead Camshaft) gasoline engine, Taguchi methodologies, Orthogonal Array, Controlled and Uncontrolled factors.
Introduction
Original Equipment Manufacturers (OEMs) in automotive sector nowadays are facing high challenges in creating high quality vehicle in terms of safety, comfort, advance technology and reliability. It is due to the increase of customer expectation and demand for a better car at a lower price. The highest challenge is definitely coming from conserving and maintaining the internal in-house quality which turned out to be difficult for process quality and production engineer due to various factors and critical points that collectively resulted to the defects. It is practically not easy to control the effects of uncontrolled factors in production. The effect will always be an obstacle for effective quality improvement. One of the major problems found to be faced by the OEM is engine abnormal noise which consists of numerous type of noise such as the tapping noise. The engine manufacturing plant is facing a lot of challenge to identify the main cause of the noise sources. By emphasizing on the valvetrain noise in low engine RPM (Revolution per Minutes) of idling condition which around 750 to 850 RPM, it could be from various components such as camshaft, cylinder head, or even the small components such as tappets and the valve spring. The total variation exists in the assembly condition will typically requires a massive measurement on related components especially to measure the quality level of the mating surfaces. The inspection time will take longer to complete, while the production continue to waste more on the operation, child parts and other indirect cost. Finally without proper investigation, inaccurate judgment will never solve the root cause.
In the present study, it is hypothesized that the implementation of Design of Experiment (DOE) which based on Taguchi approach will be able to achieve the targeted objectives in product quality improvement and manufacturing process optimization through any three specific situations which are the ‘Larger-the-Better’, ‘Smaller-the-Better’ or ‘Nominal-the-Best’. However, what are the effects of this approach to abnormal noise in idle condition for a DOHC engine? Does focusing on the multiple factors have an effect on reducing the noise level? Will the optimum combination of control factors be achieved through the experimentation? It is therefore, the intent of this study to apply DOE methodology utilizing the Taguchi
journal jMeche Vol 12.indd 28 4/20/2016 12:38:39 PM
29
AnAlysis on the FActors And eFFects oF engine tApping noise by design oF experiment (doe)
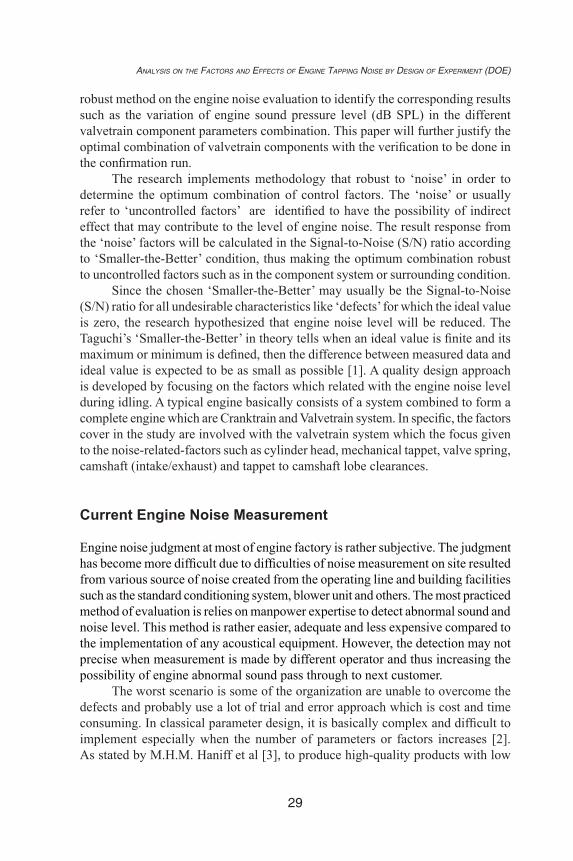
robust method on the engine noise evaluation to identify the corresponding results such as the variation of engine sound pressure level (dB SPL) in the different valvetrain component parameters combination. This paper will further justify the optimal combination of valvetrain components with the verification to be done in the confirmation run.
The research implements methodology that robust to ‘noise’ in order to determine the optimum combination of control factors. The ‘noise’ or usually refer to ‘uncontrolled factors’ are identified to have the possibility of indirect effect that may contribute to the level of engine noise. The result response from the ‘noise’ factors will be calculated in the Signal-to-Noise (S/N) ratio according to ‘Smaller-the-Better’ condition, thus making the optimum combination robust to uncontrolled factors such as in the component system or surrounding condition.
Since the chosen ‘Smaller-the-Better’ may usually be the Signal-to-Noise (S/N) ratio for all undesirable characteristics like ‘defects’ for which the ideal value is zero, the research hypothesized that engine noise level will be reduced. The Taguchi’s ‘Smaller-the-Better’ in theory tells when an ideal value is finite and its maximum or minimum is defined, then the difference between measured data and ideal value is expected to be as small as possible [1]. A quality design approach is developed by focusing on the factors which related with the engine noise level during idling. A typical engine basically consists of a system combined to form a complete engine which are Cranktrain and Valvetrain system. In specific, the factors cover in the study are involved with the valvetrain system which the focus given to the noise-related-factors such as cylinder head, mechanical tappet, valve spring, camshaft (intake/exhaust) and tappet to camshaft lobe clearances.
Current Engine Noise Measurement
Engine noise judgment at most of engine factory is rather subjective. The judgment has become more difficult due to difficulties of noise measurement on site resulted from various source of noise created from the operating line and building facilities such as the standard conditioning system, blower unit and others. The most practiced method of evaluation is relies on manpower expertise to detect abnormal sound and noise level. This method is rather easier, adequate and less expensive compared to the implementation of any acoustical equipment. However, the detection may not precise when measurement is made by different operator and thus increasing the possibility of engine abnormal sound pass through to next customer.
The worst scenario is some of the organization are unable to overcome the defects and probably use a lot of trial and error approach which is cost and time consuming. In classical parameter design, it is basically complex and difficult to implement especially when the number of parameters or factors increases [2]. As stated by M.H.M. Haniff et al [3], to produce high-quality products with low
journal jMeche Vol 12.indd 29 4/20/2016 12:38:39 PM
30
Journal of Mechanical engineering (JMeche)
development and manufacturing cost by applying a robust technique, one can significantly reduce the time required for experimental investigation. Therefore, a robust methodology or commonly known as DOE should be implemented.
Valvetrain Noise
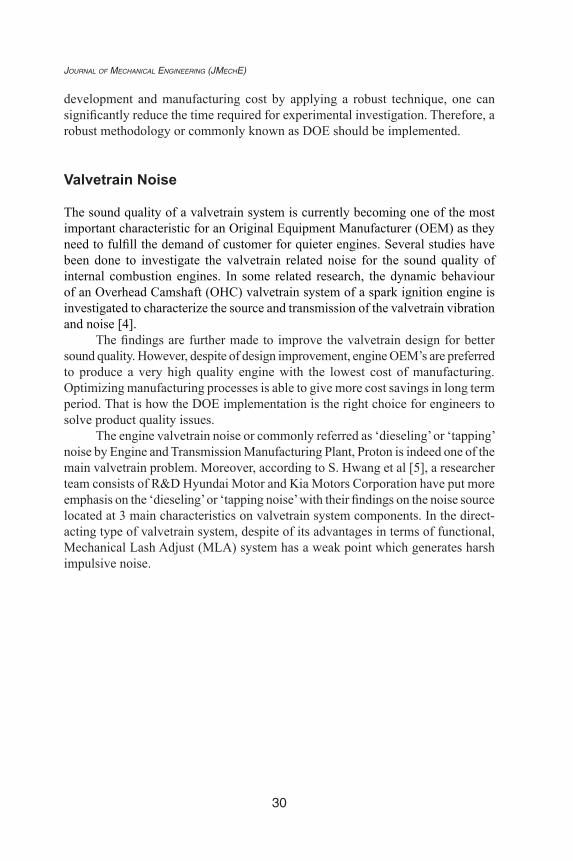
The sound quality of a valvetrain system is currently becoming one of the most important characteristic for an Original Equipment Manufacturer (OEM) as they need to fulfill the demand of customer for quieter engines. Several studies have been done to investigate the valvetrain related noise for the sound quality of internal combustion engines. In some related research, the dynamic behaviour of an Overhead Camshaft (OHC) valvetrain system of a spark ignition engine is investigated to characterize the source and transmission of the valvetrain vibration and noise [4].
The findings are further made to improve the valvetrain design for better sound quality. However, despite of design improvement, engine OEM’s are preferred to produce a very high quality engine with the lowest cost of manufacturing. Optimizing manufacturing processes is able to give more cost savings in long term period. That is how the DOE implementation is the right choice for engineers to solve product quality issues.
The engine valvetrain noise or commonly referred as ‘dieseling’ or ‘tapping’ noise by Engine and Transmission Manufacturing Plant, Proton is indeed one of the main valvetrain problem. Moreover, according to S. Hwang et al [5], a researcher team consists of R&D Hyundai Motor and Kia Motors Corporation have put more emphasis on the ‘dieseling’ or ‘tapping noise’ with their findings on the noise source located at 3 main characteristics on valvetrain system components. In the direct-acting type of valvetrain system, despite of its advantages in terms of functional, Mechanical Lash Adjust (MLA) system has a weak point which generates harsh impulsive noise.
journal jMeche Vol 12.indd 30 4/20/2016 12:38:39 PM

31
AnAlysis on the FActors And eFFects oF engine tApping noise by design oF experiment (doe)
FIGURE 1Noise Feature of Mechanical Valvetrain (MLA) in 1 cycle operation [5]
Based on their study, MLA type will produce noise sources with 3 main characteristics which are high frequency impulsive noise, impact noise and chattering noise. As shown in Figure 1, the main characteristics are mainly due to the impacts of cam on the tappet in open/close RAMP area, valve seated in the seat face of cylinder head in closing RAMP area, rotating and reciprocating tappet rubbing with tappet bore of cylinder head during valve open/close operation.
In case of Over Head Valve (OHV) engine system type, N. Bansod and H. Negi [6] investigated the cases which the manufacturer of a motorcycle engine suffered from the valvetrain noise around 300-350 (average) engines out of the 1000 engines assembled daily. They found that the valvetrain noise or specifically known as 'tappet' noise is due to the lash or clearance between rocker arm and valve stem. It also occurs as a result of lash or clearance between valve lifter (tappet) and valve stem at engine start up for at least 30 seconds. This occurence is similar with the impact noise between camshaft and valve lifter (tappet) for Over Head Camshaft (OHC) engine type as shown in Figure 1.
Figure 1: Noise Feature of Mechanical Valvetrain (MLA) in 1 cycle operation [5]
Based on their study, MLA type will produce noise sources with 3 main characteristics which are high frequency impulsive noise, impact noise and chattering noise. As shown in Figure 1, the main characteristics are mainly due to the impacts of cam on the tappet in open/close RAMP area, valve seated in the seat face of cylinder head in closing RAMP area, rotating and reciprocating tappet rubbing with tappet bore of cylinder head during valve open/close operation.
In case of Over Head Valve (OHV) engine system type, N. Bansod and H. Negi [6] investigated the cases which the manufacturer of a motorcycle engine suffered from the valvetrain noise around 300-350 (average) engines out of the 1000 engines assembled daily. They found that the valvetrain noise or specifically known as ‘tappet’ noise is due to the lash or clearance between rocker arm and valve stem. It also occurs as a result of lash or clearance between valve lifter (tappet) and valve stem at engine start up for at least 30 seconds. This occurence is similar with the impact noise between camshaft and valve lifter (tappet) for Over Head Camshaft (OHC) engine type as shown in Figure 1.
journal jMeche Vol 12.indd 31 4/20/2016 12:38:39 PM

32
Journal of Mechanical engineering (JMeche)
Noise Reduction and Improvement
The successful of previous study has encouraged the author to implement DOE method in the improvement activity for the engine valvetrain noise or referred as ‘dieseling’ or ‘tapping’ noise problem encountered by Engine and Transmission Manufacturing Plant, Proton. Moreover, there are still very few studies concentrating DOE implementation in actual engine production condition related with abnormal noise on Over Head Cam (OHC) type of engine.
In attempt to improve the engine noise and reduce the level at once, an experimentation is specifically designed based on Taguchi approach and Smaller-the-Better for Signal-to-Noise (S/N) ratio is chosen for all undesirable characteristics like ‘defects’ whereby the ideal value is zero.
Let the measured response results as y1, y2, ...yi,
The equation for Signal-to-Noise (S/N) ratio for Smaller-the-Better is given by [7] :
Noise Reduction and Improvement
The successful of previous study has encouraged the author to implement DOE method in the improvement activity for the engine valvetrain noise or referred as 'dieseling' or 'tapping' noise problem encountered by Engine and Transmission Manufacturing Plant, Proton. Moreover, there are still very few studies concentrating DOE implementation in actual engine production condition related with abnormal noise on Over Head Cam (OHC) type of engine.
In attempt to improve the engine noise and reduce the level at once,an experimentation is specifically designed based on Taguchi approach and Smaller-the-Better for Signal-to-Noise (S/N) ratio is chosen for all undesirable characteristics like 'defects' whereby the ideal value is zero.
Let the measured response resultsas 𝑦𝑦𝑦𝑦1, 𝑦𝑦𝑦𝑦2...𝑦𝑦𝑦𝑦𝑖𝑖𝑖𝑖 ,
The equation for Signal-to-Noise (S/N) ratio for Smaller-the-Better is given by[7]:
S/N = 𝜂𝜂𝜂𝜂𝑑𝑑𝑑𝑑𝑑𝑑𝑑𝑑 = 10Log� 11𝑛𝑛𝑛𝑛∑ 𝑦𝑦𝑦𝑦𝑖𝑖𝑖𝑖
2𝑛𝑛𝑛𝑛𝑖𝑖𝑖𝑖=1
� = 10Log� 1𝑦𝑦𝑦𝑦�2+ 𝜎𝜎𝜎𝜎2� (1)
Where:𝜂𝜂𝜂𝜂𝑑𝑑𝑑𝑑𝑑𝑑𝑑𝑑 : Signal to noise ratio calculated for sound pressure level (decibel)σ : Variance of response
𝑦𝑦𝑦𝑦𝑖𝑖𝑖𝑖 : Response value𝑦𝑦𝑦𝑦� : Response average
𝑛𝑛𝑛𝑛 : Number of results
Design of Experiments (DOE)
In selecting the experiment variables, a set of controlled (Xs) factors are decided based on current process control with two level sample productsprepared according to Taguchi's method for experimentation. The factors are also selected by referring to previous research done by industrial experts on valvetrain noise reduction and sound quality improvement.
As being stated by Mohamed Yunus et. al [8], the prime objective goal of using Taguchi methodology is to maintain the minimal variance in the results even in the presence of 'noise' inputs to make the process robust against all variations. BalaRaju et.al [9] further specified the minimal
(1)
Where:
Noise Reduction and Improvement
The successful of previous study has encouraged the author to implement DOE method in the improvement activity for the engine valvetrain noise or referred as 'dieseling' or 'tapping' noise problem encountered by Engine and Transmission Manufacturing Plant, Proton. Moreover, there are still very few studies concentrating DOE implementation in actual engine production condition related with abnormal noise on Over Head Cam (OHC) type of engine.
In attempt to improve the engine noise and reduce the level at once,an experimentation is specifically designed based on Taguchi approach and Smaller-the-Better for Signal-to-Noise (S/N) ratio is chosen for all undesirable characteristics like 'defects' whereby the ideal value is zero.
Let the measured response resultsas 𝑦𝑦𝑦𝑦1, 𝑦𝑦𝑦𝑦2...𝑦𝑦𝑦𝑦𝑖𝑖𝑖𝑖 ,
The equation for Signal-to-Noise (S/N) ratio for Smaller-the-Better is given by[7]:
S/N = 𝜂𝜂𝜂𝜂𝑑𝑑𝑑𝑑𝑑𝑑𝑑𝑑 = 10Log� 11𝑛𝑛𝑛𝑛∑ 𝑦𝑦𝑦𝑦𝑖𝑖𝑖𝑖
2𝑛𝑛𝑛𝑛𝑖𝑖𝑖𝑖=1
� = 10Log� 1𝑦𝑦𝑦𝑦�2+ 𝜎𝜎𝜎𝜎2� (1)
Where:𝜂𝜂𝜂𝜂𝑑𝑑𝑑𝑑𝑑𝑑𝑑𝑑 : Signal to noise ratio calculated for sound pressure level (decibel)σ : Variance of response
𝑦𝑦𝑦𝑦𝑖𝑖𝑖𝑖 : Response value𝑦𝑦𝑦𝑦� : Response average
𝑛𝑛𝑛𝑛 : Number of results
Design of Experiments (DOE)
In selecting the experiment variables, a set of controlled (Xs) factors are decided based on current process control with two level sample productsprepared according to Taguchi's method for experimentation. The factors are also selected by referring to previous research done by industrial experts on valvetrain noise reduction and sound quality improvement.
As being stated by Mohamed Yunus et. al [8], the prime objective goal of using Taguchi methodology is to maintain the minimal variance in the results even in the presence of 'noise' inputs to make the process robust against all variations. BalaRaju et.al [9] further specified the minimal
: Signal to noise ratio calculated for sound pressure level (decibel)σ : Variance of responseyi : Response value
Noise Reduction and Improvement
The successful of previous study has encouraged the author to implement DOE method in the improvement activity for the engine valvetrain noise or referred as 'dieseling' or 'tapping' noise problem encountered by Engine and Transmission Manufacturing Plant, Proton. Moreover, there are still very few studies concentrating DOE implementation in actual engine production condition related with abnormal noise on Over Head Cam (OHC) type of engine.
In attempt to improve the engine noise and reduce the level at once,an experimentation is specifically designed based on Taguchi approach and Smaller-the-Better for Signal-to-Noise (S/N) ratio is chosen for all undesirable characteristics like 'defects' whereby the ideal value is zero.
Let the measured response resultsas 𝑦𝑦𝑦𝑦1, 𝑦𝑦𝑦𝑦2...𝑦𝑦𝑦𝑦𝑖𝑖𝑖𝑖 ,
The equation for Signal-to-Noise (S/N) ratio for Smaller-the-Better is given by[7]:
S/N = 𝜂𝜂𝜂𝜂𝑑𝑑𝑑𝑑𝑑𝑑𝑑𝑑 = 10Log� 11𝑛𝑛𝑛𝑛∑ 𝑦𝑦𝑦𝑦𝑖𝑖𝑖𝑖
2𝑛𝑛𝑛𝑛𝑖𝑖𝑖𝑖=1
� = 10Log� 1𝑦𝑦𝑦𝑦�2+ 𝜎𝜎𝜎𝜎2� (1)
Where:𝜂𝜂𝜂𝜂𝑑𝑑𝑑𝑑𝑑𝑑𝑑𝑑 : Signal to noise ratio calculated for sound pressure level (decibel)σ : Variance of response
𝑦𝑦𝑦𝑦𝑖𝑖𝑖𝑖 : Response value𝑦𝑦𝑦𝑦� : Response average
𝑛𝑛𝑛𝑛 : Number of results
Design of Experiments (DOE)
In selecting the experiment variables, a set of controlled (Xs) factors are decided based on current process control with two level sample productsprepared according to Taguchi's method for experimentation. The factors are also selected by referring to previous research done by industrial experts on valvetrain noise reduction and sound quality improvement.
As being stated by Mohamed Yunus et. al [8], the prime objective goal of using Taguchi methodology is to maintain the minimal variance in the results even in the presence of 'noise' inputs to make the process robust against all variations. BalaRaju et.al [9] further specified the minimal
: Response averagen : Number of results
Design of Experiments (DOE)
In selecting the experiment variables, a set of controlled (Xs) factors are decided based on current process control with two level sample products prepared according to Taguchi’s method for experimentation. The factors are also selected by referring to previous research done by industrial experts on valvetrain noise reduction and sound quality improvement.
As being stated by Mohamed Yunus et. al [8], the prime objective goal of using Taguchi methodology is to maintain the minimal variance in the results even in the presence of ‘noise’ inputs to make the process robust against all variations. BalaRaju et.al [9] further specified the minimal variance could be achieved in Taguchi method together with the optimum settings of control parameters.
journal jMeche Vol 12.indd 32 4/20/2016 12:38:39 PM

33
AnAlysis on the FActors And eFFects oF engine tApping noise by design oF experiment (doe)
Therefore, the seven (7) controlled factors are identified as the cylinder head tappet bore diameter (CH DIA(1)), mechanical tappet diameter (MT DIA(2)), valve spring force (SP LOAD(3)), camshaft lobe waviness (CAM IN WAV-camshaft inlet waviness(4); CAM EX WAV-camshaft exhaust waviness(5)) and tappet clearance for both inlet (TAP CL IN)(6) and exhaust (TAP CL EX)(7) area. Meanwhile, the noise (Zs) factors are identified as the, engine oil contamination, and air intake condition. The Taguchi method measures the variance effects of each factors, the calculation base on Linear Model Analysis will be applied to quantify the significant factors for optimum design.
Response Variable Selection
Response variable decided for the project is the engine tapping/dieseling noise level or commonly known as Sound Pressure Level (SPL) that will be measured according to the experimental design.
Taguchi Experimentation Design Selection
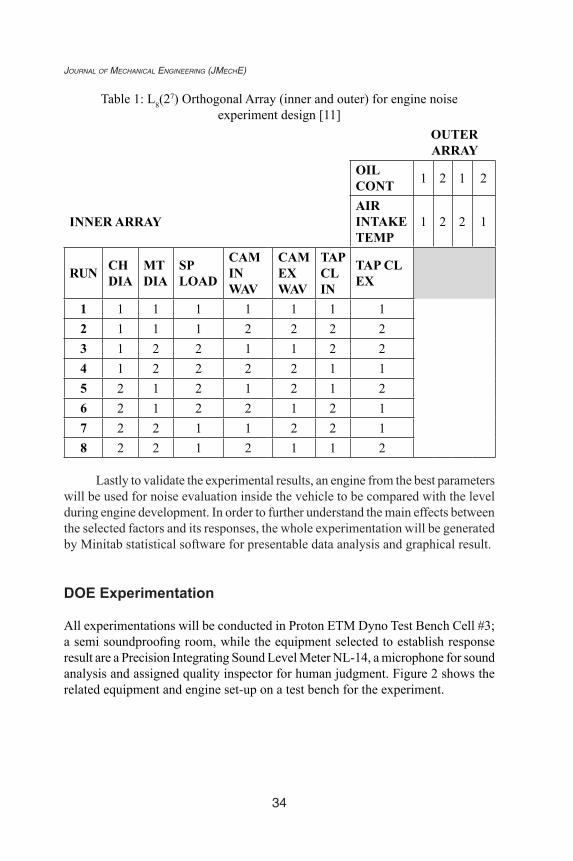
As emphasized by D.H. Stamatis[10], the orthogonal array of control factors and interactions is called the inner array. In order to make the process or product robust to ‘noise’ factors, an array of noise-inducing conditions or setting is needed to be selected. In other words, an outer array of ‘noise’ factors must be constructed for the purpose of replicating the runs of the inner array. After all factors and response are decided, the L8(2
7) Orthogonal Array of Taguchi fractional factorial design is employed at two levels with seven factors in inner array and two ‘noise’ factors in outer array as indicated in Table 1.
Eight (8) runs of experiment sequence have been generated by Minitab; the experimental is conducted by following the experiments sequence. All factors are considered as minimum and maximum parameters as indicated by number 1(one) and 2 (two) respectively. For each eight (8) runs, the experiment will be replicated four (4) times according to the outer array design. Finally, the mean result of Sound Pressure Level (SPL) will be calculated by the average of the replication result taking into account all possible combinations of noise factors to make the the final parameters robust to interactions among the noise factors.
journal jMeche Vol 12.indd 33 4/20/2016 12:38:39 PM
34
Journal of Mechanical engineering (JMeche)
Table 1: L8(27) Orthogonal Array (inner and outer) for engine noise
experiment design [11]OUTER ARRAY
OIL CONT 1 2 1 2
INNER ARRAYAIR INTAKE TEMP
1 2 2 1
RUN CH DIA
MT DIA
SP LOAD
CAM IN WAV
CAM EX WAV
TAP CL IN
TAP CL EX
1 1 1 1 1 1 1 1 2 1 1 1 2 2 2 2 3 1 2 2 1 1 2 2 4 1 2 2 2 2 1 1 5 2 1 2 1 2 1 2 6 2 1 2 2 1 2 1 7 2 2 1 1 2 2 1 8 2 2 1 2 1 1 2
Lastly to validate the experimental results, an engine from the best parameters will be used for noise evaluation inside the vehicle to be compared with the level during engine development. In order to further understand the main effects between the selected factors and its responses, the whole experimentation will be generated by Minitab statistical software for presentable data analysis and graphical result.
DOE Experimentation
All experimentations will be conducted in Proton ETM Dyno Test Bench Cell #3; a semi soundproofing room, while the equipment selected to establish response result are a Precision Integrating Sound Level Meter NL-14, a microphone for sound analysis and assigned quality inspector for human judgment. Figure 2 shows the related equipment and engine set-up on a test bench for the experiment.
journal jMeche Vol 12.indd 34 4/20/2016 12:38:39 PM

35
AnAlysis on the FActors And eFFects oF engine tApping noise by design oF experiment (doe)
Proton ETM Dyno Test Bench Cell #3 is chosen in the experimentation in order to give accurate setting on the design parameters such as air intake temperature and sound proofing from external surrounding noise. The test bench will be verified prior to the actual experimentation in order to identify and eliminate the unnecessary sound source that will interfere in the overall sound pressure level if available.
FIGURE 2An engine on a test bench ready for testing [12]
Measurement of Valvetrain Noise (dB SPL)
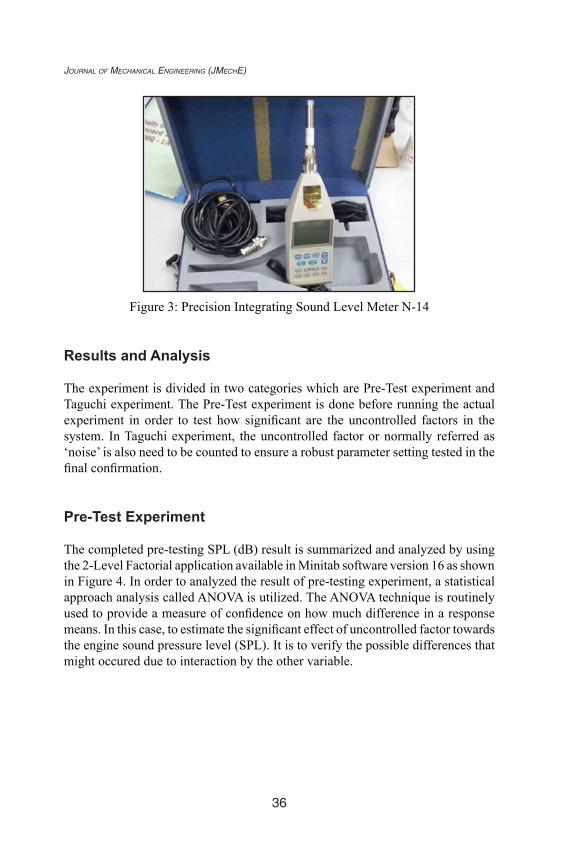
As shown in Figure 3, the Precision Integrating Sound Level Meter NL-14(SLM) is chosen in the experiment as the equipment is able to measure and record the sound pressure level 300mm above the intended point from engine cam cover side. In order to give more detail figure regarding sound profile of each run, a sound analyzer is applied in the measurement of sound pressure level SPL with a microphone to be located at the same points as SLM.
FIGURE 3Precision Integrating Sound Level Meter N-14
Figure 2: An engine on a test bench ready for testing [12]
Measurement of Valvetrain Noise (dB SPL)
As shown in Figure 3, the Precision Integrating Sound Level Meter NL-14 (SLM) is chosen in the experiment as the equipment is able to measure and record the sound pressure level 300mm above the intended point from engine cam cover side. In order to give more detail figure regarding sound profile of each run, a sound analyzer is applied in the measurement of sound pressure level SPL with a microphone to be located at the same points as SLM.
journal jMeche Vol 12.indd 35 4/20/2016 12:38:39 PM
36
Journal of Mechanical engineering (JMeche)
FIGURE 2An engine on a test bench ready for testing [12]
Measurement of Valvetrain Noise (dB SPL)
As shown in Figure 3, the Precision Integrating Sound Level Meter NL-14(SLM) is chosen in the experiment as the equipment is able to measure and record the sound pressure level 300mm above the intended point from engine cam cover side. In order to give more detail figure regarding sound profile of each run, a sound analyzer is applied in the measurement of sound pressure level SPL with a microphone to be located at the same points as SLM.
FIGURE 3Precision Integrating Sound Level Meter N-14
Figure 3: Precision Integrating Sound Level Meter N-14
Results and Analysis
The experiment is divided in two categories which are Pre-Test experiment and Taguchi experiment. The Pre-Test experiment is done before running the actual experiment in order to test how significant are the uncontrolled factors in the system. In Taguchi experiment, the uncontrolled factor or normally referred as ‘noise’ is also need to be counted to ensure a robust parameter setting tested in the final confirmation.
Pre-Test Experiment
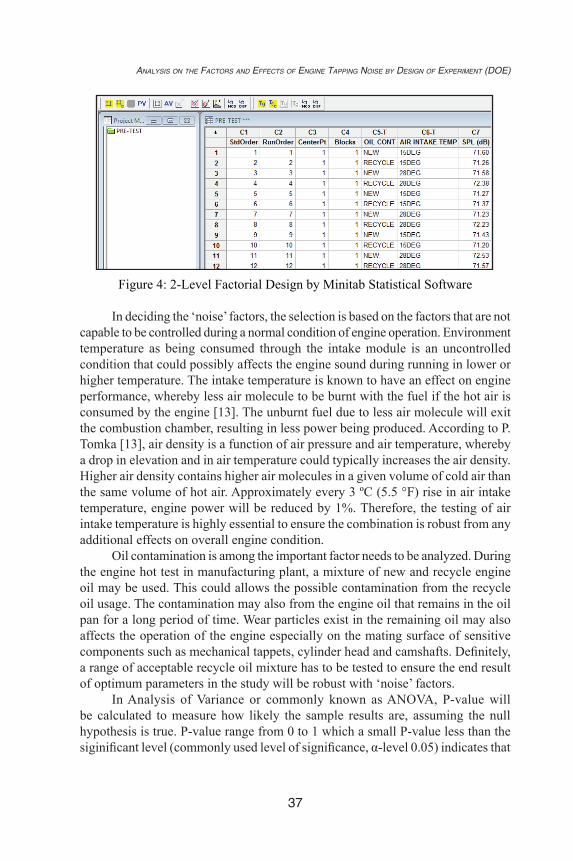
The completed pre-testing SPL (dB) result is summarized and analyzed by using the 2-Level Factorial application available in Minitab software version 16 as shown in Figure 4. In order to analyzed the result of pre-testing experiment, a statistical approach analysis called ANOVA is utilized. The ANOVA technique is routinely used to provide a measure of confidence on how much difference in a response means. In this case, to estimate the significant effect of uncontrolled factor towards the engine sound pressure level (SPL). It is to verify the possible differences that might occured due to interaction by the other variable.
journal jMeche Vol 12.indd 36 4/20/2016 12:38:39 PM
37
AnAlysis on the FActors And eFFects oF engine tApping noise by design oF experiment (doe)
Results and Analysis
The experiment is divided in two categories which are Pre-Test experiment and Taguchi experiment. The Pre-Test experiment is done before running the actual experiment in order to test how significant are the uncontrolled factorsin the system. In Taguchi experiment, the uncontrolled factor or normally referred as 'noise' is also need to be counted to ensure a robust parameter setting tested in the final confirmation.
Pre-Test Experiment
The completed pre-testing SPL (dB) result is summarized and analyzed by using the 2-Level Factorial application available in Minitab software version 16 as shown in Figure 4. In order to analyzed the result of pre-testing experiment, a statistical approach analysis called ANOVA is utilized.The ANOVA technique is routinely used to provide a measure of confidenceon how much difference in a response means.In this case, to estimate the significant effect of uncontrolled factor towards the engine sound pressure level (SPL). It is to verify the possible differences that might occured due to interaction by the other variable.
FIGURE 42-Level Factorial Design by Minitab Statistical Software
In deciding the 'noise' factors, the selection is based on the factors that are not capable to be controlled during a normal condition of engine operation. Environment temperature as being consumed through the intake module is an uncontrolled condition that couldpossibly affects the engine sound during running in lower or higher temperature. The intake temperature is known to have an effect on engine performance, whereby less air molecule to be burnt with the fuel if the hot air is consumed by the engine[13]. The
Figure 4: 2-Level Factorial Design by Minitab Statistical Software
In deciding the ‘noise’ factors, the selection is based on the factors that are not capable to be controlled during a normal condition of engine operation. Environment temperature as being consumed through the intake module is an uncontrolled condition that could possibly affects the engine sound during running in lower or higher temperature. The intake temperature is known to have an effect on engine performance, whereby less air molecule to be burnt with the fuel if the hot air is consumed by the engine [13]. The unburnt fuel due to less air molecule will exit the combustion chamber, resulting in less power being produced. According to P. Tomka [13], air density is a function of air pressure and air temperature, whereby a drop in elevation and in air temperature could typically increases the air density. Higher air density contains higher air molecules in a given volume of cold air than the same volume of hot air. Approximately every 3 ºC (5.5 °F) rise in air intake temperature, engine power will be reduced by 1%. Therefore, the testing of air intake temperature is highly essential to ensure the combination is robust from any additional effects on overall engine condition.
Oil contamination is among the important factor needs to be analyzed. During the engine hot test in manufacturing plant, a mixture of new and recycle engine oil may be used. This could allows the possible contamination from the recycle oil usage. The contamination may also from the engine oil that remains in the oil pan for a long period of time. Wear particles exist in the remaining oil may also affects the operation of the engine especially on the mating surface of sensitive components such as mechanical tappets, cylinder head and camshafts. Definitely, a range of acceptable recycle oil mixture has to be tested to ensure the end result of optimum parameters in the study will be robust with ‘noise’ factors.
In Analysis of Variance or commonly known as ANOVA, P-value will be calculated to measure how likely the sample results are, assuming the null hypothesis is true. P-value range from 0 to 1 which a small P-value less than the siginificant level (commonly used level of significance, α-level 0.05) indicates that
journal jMeche Vol 12.indd 37 4/20/2016 12:38:40 PM

38
Journal of Mechanical engineering (JMeche)
the response studied has statistically significant effect on the response observed. The ANOVA analysis results in Table 2 show the Air Intake Temperature has the P-value less than the significant level (P-value 0.044 < α-level 0.05), while the Oil Contamination factor has the P-value more than the significant level (P-value 0.801 > α-level 0.05). The interaction of Oil Contamination against the Air Intake Temperature has the P-value more than the significant level (P-value 0.383 > α-level 0.05). A small P-value of the Air Intake Temperature factor indicates that the factor has statistically significant effect on the response.
Table 2: ANOVA result for engine noise (dB SPL) against the tested factors
SOURCE DF SUM OF SQUARES
MEAN SQUARE
P VALUE
Oil Contamination 1 0.01141 0.011408 0.801Air Intake Temperature 1 0.95767 0.957675 0.044
Interaction (Oil Cont*Air Intake Temp) 1 0.143008 0.143008 0.383
Error 8 1.34573 0.168217Total 11 2.45782 0.168217
Taguchi Experiment
The data gathered from experimental result is then analyzed through the aid of Minitab Statistical Software in order to determine the main effects between the factors and response. Taguchi analysis in the software package will be used for this purpose. Delta value will be used to decide on which factors are more significant according to the experimental results. All the specified factors have been modeled by using the Taguchi function in the Minitab software which automatically organized into L8(2
7) orthogonal array analysis. Table 3 shows the concise form of the matrix for all possible combinations of controlled and uncontrolled factors with the experiment results.
journal jMeche Vol 12.indd 38 4/20/2016 12:38:40 PM

39
AnAlysis on the FActors And eFFects oF engine tApping noise by design oF experiment (doe)
Table 3: The matrix for all possible combinations of controlled and uncontrolled factors with the experiment results
Taguchi Experiment
The data gathered from experimental result is then analyzed through the aid of Minitab Statistical Software in order to determine the main effects between the factors and response. Taguchi analysis in the software package will be used for this purpose. Delta value will be used to decide on which factors are more significant according to the experimental results. All the specified factors have been modeled by using the Taguchi function in the Minitab software which automatically organized into L8(27) orthogonal array analysis.Table 3 shows the concise form of the matrix for all possible combinations of controlled and uncontrolled factors with the experiment results.
TABLE 3The matrix for all possible combinations of controlled and uncontrolled
factors with the experiment results.
Discussion
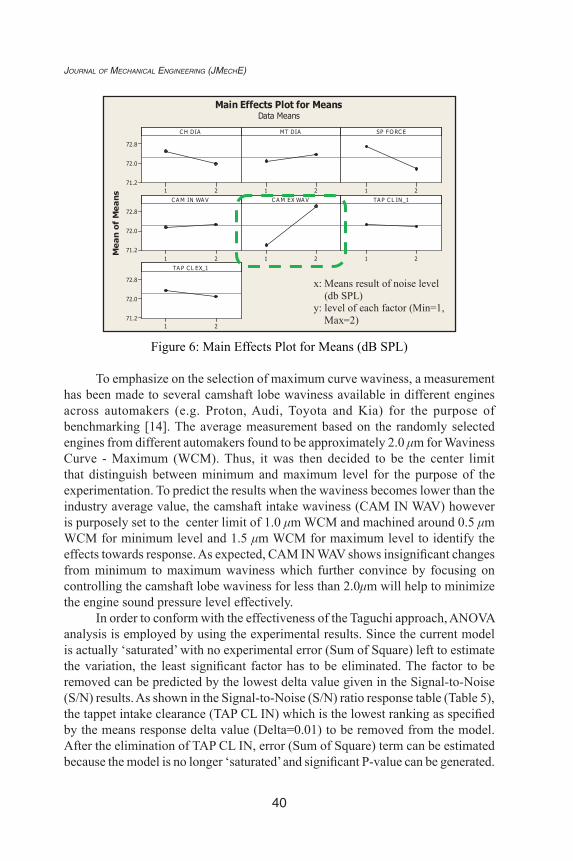
In interpreting the experiment results, the Main Effects Plot are also obtained through Minitab software. As shown in Figure 6, the plot shows the main effect of minimum versus maximum parameter for seven factors specified in the study. In overall, all factors have insignificant effect on the responseexcept for Camshaft Exhaust Waviness (marked with green dotted line).
The line connecting the mean responses for most of the components which have a slope similar or closed to slope of the line connecting their mean response around 72 dB SPL. However, the Camshaft Exhaust Waviness shows a steepest slope with minimum parameter yields a lower noise level than the maximum parameter. Since the slope of the line for the Camshaft Exhaust Waviness is steeper, it is found that the engine noise level has a greater effect when the maximum waviness is used versus the minimum waviness for the Camshaft Exhaust Waviness. By focusing more to the
Discussion
In interpreting the experiment results, the Main Effects Plot are also obtained through Minitab software. As shown in Figure 6, the plot shows the main effect of minimum versus maximum parameter for seven factors specified in the study. In overall, all factors have insignificant effect on the response except for Camshaft Exhaust Waviness (marked with green dotted line).
The line connecting the mean responses for most of the components which have a slope similar or closed to slope of the line connecting their mean response around 72 dB SPL. However, the Camshaft Exhaust Waviness shows a steepest slope with minimum parameter yields a lower noise level than the maximum parameter. Since the slope of the line for the Camshaft Exhaust Waviness is steeper, it is found that the engine noise level has a greater effect when the maximum waviness is used versus the minimum waviness for the Camshaft Exhaust Waviness. By focusing more to the Camshaft Exhaust Waviness (CAM EX WAV), the plot shows that the engine noise level with the minimum waviness (< 2.0 μm) yields the lowest result (about 71db SPL) when across any factors. Meanwhile, engine noise level with the maximum waviness (> 2.0 μm) will always yield the highest result (about 74db SPL) when across with any factors.
journal jMeche Vol 12.indd 39 4/20/2016 12:38:40 PM
40
Journal of Mechanical engineering (JMeche)
Camshaft Exhaust Waviness (CAM EX WAV), the plot shows that the engine noise level with the minimum waviness (< 2.0μm) yields the lowest result (about 71db SPL) when across any factors. Meanwhile, engine noise level with the maximum waviness (> 2.0μm) will always yield the highest result (about 74db SPL) when across with any factors.
FIGURE 6Main Effects Plot for Means (dB SPL)
To emphasize on the selection of maximum curve waviness, a measurement has been made to several camshaft lobe waviness available in different engines across automakers (e.g. Proton, Audi, Toyota and Kia) for the purpose of benchmarking[14]. The average measurement based on therandomly selected engines from different automakers found to beapproximately2.0μm for Waviness Curve - Maximum (WCM). Thus,it was then decided to be the center limit that distinguish between minimum and maximum level for the purpose of the experimentation.To predict the results when the waviness becomes lower than the industry average value, the camshaft intake waviness (CAM IN WAV)however is purposely set to the center limit of 1.0μm WCM and machined around 0.5μm WCM for minimum level and 1.5μmWCM for maximum level to identify the effects towards response. As expected, CAM IN WAV shows insignificant changes from minimum to maximum waviness which further convince by focusing on controlling the camshaft lobe waviness for less than 2.0μm will helps to minimize the engine sound pressure level effectively.
In order to conform with the effectiveness of the Taguchi approach, ANOVA analysis is employed by using the experimental results. Since the current model is actually'saturated' with no experimental error (Sum of
21
72.8
72.0
71.221 21
21
72.8
72.0
71.221 21
21
72.8
72.0
71.2
C H DIA
Me
an
of
Me
an
s
MT DIA SP FO RC E
C A M IN WA V C A M EX WA V TA P C L IN_1
TA P C L EX_1
Main Effects Plot for MeansData Means
x: Means result of noise level (db SPL)
y: level of each factor (Min=1, Max=2)
Figure 6: Main Effects Plot for Means (dB SPL) To emphasize on the selection of maximum curve waviness, a measurement
has been made to several camshaft lobe waviness available in different engines across automakers (e.g. Proton, Audi, Toyota and Kia) for the purpose of benchmarking [14]. The average measurement based on the randomly selected engines from different automakers found to be approximately 2.0 μm for Waviness Curve - Maximum (WCM). Thus, it was then decided to be the center limit that distinguish between minimum and maximum level for the purpose of the experimentation. To predict the results when the waviness becomes lower than the industry average value, the camshaft intake waviness (CAM IN WAV) however is purposely set to the center limit of 1.0 μm WCM and machined around 0.5 μm WCM for minimum level and 1.5 μm WCM for maximum level to identify the effects towards response. As expected, CAM IN WAV shows insignificant changes from minimum to maximum waviness which further convince by focusing on controlling the camshaft lobe waviness for less than 2.0μm will help to minimize the engine sound pressure level effectively.
In order to conform with the effectiveness of the Taguchi approach, ANOVA analysis is employed by using the experimental results. Since the current model is actually ‘saturated’ with no experimental error (Sum of Square) left to estimate the variation, the least significant factor has to be eliminated. The factor to be removed can be predicted by the lowest delta value given in the Signal-to-Noise (S/N) results. As shown in the Signal-to-Noise (S/N) ratio response table (Table 5), the tappet intake clearance (TAP CL IN) which is the lowest ranking as specified by the means response delta value (Delta=0.01) to be removed from the model. After the elimination of TAP CL IN, error (Sum of Square) term can be estimated because the model is no longer ‘saturated’ and significant P-value can be generated.
journal jMeche Vol 12.indd 40 4/20/2016 12:38:40 PM

41
AnAlysis on the FActors And eFFects oF engine tApping noise by design oF experiment (doe)
The ANOVA analysis result is shown by reduced ANOVA model in Table 4 indicating camshaft exhaust waviness (CAM EX WAV) with P-value less than 0.05, different with other factors which having P-value more than 0.05. A small P-value of the CAM EX WAV indicates that the factor has statistically significant effect on the response.
Table 4: ANOVA analysis result for engine noise (dB SPL) reduced model
SOURCE DF SUM OF SQUARES
MEAN SQUARE P VALUE
CH DIA 1 0.5253 0.5253 0.093MT DIA 1 0.1512 0.1512 0.170
SP FORCE 1 1.7578 1.7578 0.051CAM IN WAV 1 0.0200 0.0200 0.410CAM EX WAV 1 5.3628 5.3628 0.029
TAP CL EX 1 0.1128 0.1128 0.195Error 1 0.0112 0.0112Total 7 7.9413
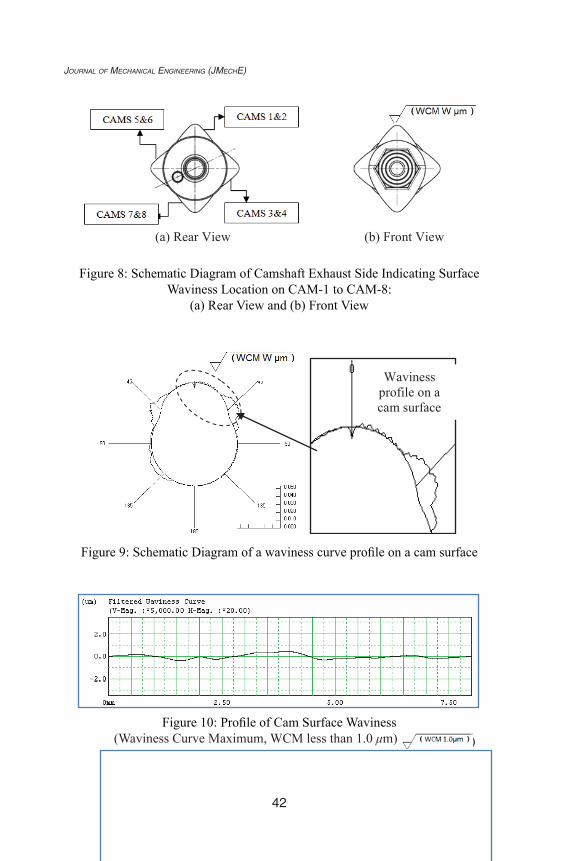
Several profile of surface waviness are shown for further understanding on the camshaft waviness location and profile. Figure 7, 8 and 9 show the exact location and waviness profile on a cam surface, while Figure 10, 11 and 12 provide the details of waviness profile in actual curve pattern as captured by a camshaft lobe tester.
Square)left to estimate the variation,the least significant factor has to beeliminated. The factor to be removed can be predicted by the lowest delta value given in the Signal-to-Noise (S/N) results.As shown in the Signal-to-Noise (S/N) ratio response table (Table 5), the tappet intake clearance (TAP CL IN) which is the lowest ranking as specified by the means response delta value (Delta=0.01)to beremoved from the model. After the elimination of TAP CL IN, error (Sum of Square) term can be estimated because the model is no longer 'saturated' and significant P-value can be generated.
The ANOVA analysis result is shown by reduced ANOVA model in Table 4 indicatingcamshaft exhaust waviness (CAM EX WAV) with P-valueless than 0.05, different with other factors which having P-value more than 0.05. A small P-value of the CAM EX WAV indicates that the factor has statistically significant effect on the response.
TABLE 4ANOVA analysis result for engine noise (dB SPL) reduced model
SOURCEDF SUM OF
SQUARESMEAN
SQUARE P VALUE
CH DIA 1 0.5253 0.5253 0.093MT DIA 1 0.1512 0.1512 0.170
SP FORCE 1 1.7578 1.7578 0.051CAM IN WAV 1 0.0200 0.0200 0.410CAM EX WAV 1 5.3628 5.3628 0.029
TAP CL EX 1 0.1128 0.1128 0.195Error 1 0.0112 0.0112Total 7 7.9413
Several profile of surface waviness are shown for further understanding on the camshaft waviness location and profile. Figure 7, 8 and 9show the exact location and waviness profile on a cam surface, while Figure 10, 11 and 12 provide the details of waviness profile in actual curve pattern as captured by a camshaft lobe tester.
FIGURE 7
Legend: Fr-J = Front JournalJ = JournalCAM = Camshaft lobe
Figure 7: Schematic Diagram of Camshaft Exhaust Side Indicating Surface Waviness Location on CAM-1 to CAM-8 Side View
(marked by the dotted line)
journal jMeche Vol 12.indd 41 4/20/2016 12:38:40 PM
42
Journal of Mechanical engineering (JMeche)Schematic Diagram of Camshaft Exhaust Side Indicating Surface Waviness Location on CAM-1 to CAM-8 Side View (marked by the dotted line)
(a) Rear View (b) Front ViewFIGURE 8
Schematic Diagram of Camshaft Exhaust Side Indicating Surface Waviness Location on CAM-1 to CAM-8:(a) Rear View and(b) Front View.
FIGURE 9Schematic Diagram of a waviness curve profile on a cam surface.
FIGURE 10
Waviness profile on a cam surface
Schematic Diagram of Camshaft Exhaust Side Indicating Surface Waviness Location on CAM-1 to CAM-8 Side View (marked by the dotted line)
(a) Rear View (b) Front ViewFIGURE 8
Schematic Diagram of Camshaft Exhaust Side Indicating Surface Waviness Location on CAM-1 to CAM-8:(a) Rear View and(b) Front View.
FIGURE 9Schematic Diagram of a waviness curve profile on a cam surface.
FIGURE 10
Waviness profile on a cam surface
Figure 8: Schematic Diagram of Camshaft Exhaust Side Indicating Surface Waviness Location on CAM-1 to CAM-8:
(a) Rear View and (b) Front View
Schematic Diagram of Camshaft Exhaust Side Indicating Surface Waviness Location on CAM-1 to CAM-8 Side View (marked by the dotted line)
(a) Rear View (b) Front ViewFIGURE 8
Schematic Diagram of Camshaft Exhaust Side Indicating Surface Waviness Location on CAM-1 to CAM-8:(a) Rear View and(b) Front View.
FIGURE 9Schematic Diagram of a waviness curve profile on a cam surface.
FIGURE 10
Waviness profile on a cam surface
Figure 9: Schematic Diagram of a waviness curve profile on a cam surface
Schematic Diagram of Camshaft Exhaust Side Indicating Surface Waviness Location on CAM-1 to CAM-8 Side View (marked by the dotted line)
(a) Rear View (b) Front ViewFIGURE 8
Schematic Diagram of Camshaft Exhaust Side Indicating Surface Waviness Location on CAM-1 to CAM-8:(a) Rear View and(b) Front View.
FIGURE 9Schematic Diagram of a waviness curve profile on a cam surface.
FIGURE 10
Waviness profile on a cam surface
Figure 10: Profile of Cam Surface Waviness (Waviness Curve Maximum, WCM less than 1.0 μm)
Profile of Cam Surface Waviness (Waviness Curve Maximum, WCM less than 1.0 μm )
FIGURE 11Profile of Cam Surface Waviness (Waviness Curve Maximum, WCM less
than 2.0 μm )
FIGURE 12Profile of Cam Surface Waviness (Waviness Curve Maximum, WCM more
than 2.0 μm)
Based on the results of the experiment, it is recommended that the Camshaft Exhaust Waviness to be controlled below 2.0 μm and necessary action shall be taken to revise specification into the recommended value.
Significant factor identification
According to Kim et. al [15], Taguchi method is a combination of mathematical and statistical techniques used in an empirical study which is economical for characterizing a complicated process. It uses fewer experiments to study all levels of input parameters and determines thecondition having the least variability as the optimum condition. The Taguchi approach is actually a type of fractional factorial design which requires only a partial runs that could representing the same results as general full factorial.
Furthermore, each of the experiment condition will have the minimum variation with the combination of control and uncontrolled factorsin the fractional design. The variability of a property can be expressed by Signal-to-Noise (S/N) ratiowhere the experimental condition having the
journal jMeche Vol 12.indd 42 4/20/2016 12:38:40 PM

43
AnAlysis on the FActors And eFFects oF engine tApping noise by design oF experiment (doe)
Figure 11: Profile of Cam Surface Waviness
(Waviness Curve Maximum, WCM less than 2.0 μm
Profile of Cam Surface Waviness (Waviness Curve Maximum, WCM less than 1.0 μm )
FIGURE 11Profile of Cam Surface Waviness (Waviness Curve Maximum, WCM less
than 2.0 μm )
FIGURE 12Profile of Cam Surface Waviness (Waviness Curve Maximum, WCM more
than 2.0 μm)
Based on the results of the experiment, it is recommended that the Camshaft Exhaust Waviness to be controlled below 2.0 μm and necessary action shall be taken to revise specification into the recommended value.
Significant factor identification
According to Kim et. al [15], Taguchi method is a combination of mathematical and statistical techniques used in an empirical study which is economical for characterizing a complicated process. It uses fewer experiments to study all levels of input parameters and determines thecondition having the least variability as the optimum condition. The Taguchi approach is actually a type of fractional factorial design which requires only a partial runs that could representing the same results as general full factorial.
Furthermore, each of the experiment condition will have the minimum variation with the combination of control and uncontrolled factorsin the fractional design. The variability of a property can be expressed by Signal-to-Noise (S/N) ratiowhere the experimental condition having the
Figure 12: Profile of Cam Surface Waviness
(Waviness Curve Maximum, WCM more than 2.0 μm
Profile of Cam Surface Waviness (Waviness Curve Maximum, WCM less than 1.0 μm )
FIGURE 11Profile of Cam Surface Waviness (Waviness Curve Maximum, WCM less
than 2.0 μm )
FIGURE 12Profile of Cam Surface Waviness (Waviness Curve Maximum, WCM more
than 2.0 μm)
Based on the results of the experiment, it is recommended that the Camshaft Exhaust Waviness to be controlled below 2.0 μm and necessary action shall be taken to revise specification into the recommended value.
Significant factor identification
According to Kim et. al [15], Taguchi method is a combination of mathematical and statistical techniques used in an empirical study which is economical for characterizing a complicated process. It uses fewer experiments to study all levels of input parameters and determines thecondition having the least variability as the optimum condition. The Taguchi approach is actually a type of fractional factorial design which requires only a partial runs that could representing the same results as general full factorial.
Furthermore, each of the experiment condition will have the minimum variation with the combination of control and uncontrolled factorsin the fractional design. The variability of a property can be expressed by Signal-to-Noise (S/N) ratiowhere the experimental condition having the
)
Based on the results of the experiment, it is recommended that the Camshaft Exhaust Waviness to be controlled below 2.0 μm and necessary action shall be taken to revise specification into the recommended value.
Significant Factor Identification
According to Kim et. al [15], Taguchi method is a combination of mathematical and statistical techniques used in an empirical study which is economical for characterizing a complicated process. It uses fewer experiments to study all levels of input parameters and determines the condition having the least variability as the optimum condition. The Taguchi approach is actually a type of fractional factorial design which requires only a partial runs that could representing the same results as general full factorial.
Furthermore, each of the experiment condition will have the minimum variation with the combination of control and uncontrolled factors in the fractional design. The variability of a property can be expressed by Signal-to-Noise (S/N) ratio where the experimental condition having the maximum Signal-to-Noise (S/N)
journal jMeche Vol 12.indd 43 4/20/2016 12:38:41 PM

44
Journal of Mechanical engineering (JMeche)
ratio is considered as the optimum condition, as the variability of characteristics is in inverse proportion to the Signal-to-Noise (S/N) ratio [15]. The generated Main Effects Plot for Signal-to-Noise (S/N) ratio is shown in Figure 13. For smaller-the-better condition, further attention is given to the Signal-to-Noise (S/N) ratio which nearest to zero in order to select the optimal parameters for next confirmation run.
maximum Signal-to-Noise (S/N) ratio is considered as the optimumcondition, as the variability of characteristics is in inverse proportion to the Signal-to-Noise (S/N) ratio [15].The generated Main Effects Plot for Signal-to-Noise (S/N) ratio is shown in Figure 13. For smaller-the-better condition, further attention is given to the Signal-to-Noise (S/N) ratiowhich nearest to zero in order to select the optimal parameters for next confirmation run.
FIGURE 13Main Effects Plot for Signal-to-Noise (S/N) ratio
Optimized combination prediction
For the optimum parameters selection, the best conditions are selected from the Signal-to-Noise (S/N) ratio as illustrated inFigure 13 and tabulated in Table 5. The CH DIA (Cylinder head bore diameter), SP Load (Valve spring force), Tap CL IN(Tappet clearance intake side) and Tap CL EX(Tappet clearance exhaust side) are selected for the maximum level. Meanwhile, the minimum level are MT DIA (mechanical tappet diameter), Cam In Wav(Camshaft intake waviness) and Cam Ex Wav (Camshaft exhaust waviness).
TABLE 5Response table for Signal-to-Noise (S/N) ratio (Smaller-the-Better)
Level CH DIA MT DIA
SPFORCE
CAM IN WAV
CAM EX WAV
TAP CL IN
TAP CL EX
1 -37.20 -37.16 -37.23 -37.17 -37.07 -37.18 -37.19
21
-37.1
-37.2
-37.321 21
21
-37.1
-37.2
-37.321 21
21
-37.1
-37.2
-37.3
C H DIA
Me
an
of
SN
rati
os
MT DIA SP FO RC E
C A M IN WA V C A M EX WA V TA P C L IN_1
TA P C L EX_1
Main Effects Plot for SN ratiosData Means
Signal-to-noise: Smaller is better
Figure 13: Main Effects Plot for Signal-to-Noise (S/N) ratio
Optimized Combination Prediction
For the optimum parameters selection, the best conditions are selected from the Signal-to-Noise (S/N) ratio as illustrated in Figure 13 and tabulated in Table 5. The CH DIA (Cylinder head bore diameter), SP Load (Valve spring force), Tap CL IN (Tappet clearance intake side) and Tap CL EX (Tappet clearance exhaust side) are selected for the maximum level. Meanwhile, the minimum level are MT DIA (mechanical tappet diameter), Cam In Wav (Camshaft intake waviness) and Cam Ex Wav (Camshaft exhaust waviness).
journal jMeche Vol 12.indd 44 4/20/2016 12:38:41 PM

45
AnAlysis on the FActors And eFFects oF engine tApping noise by design oF experiment (doe)
Table 5: Response table for Signal-to-Noise (S/N) ratio (Smaller-the-Better)Level CH DIA MT
DIASP
FORCECAM
IN WAVCAM EX
WAV
TAP CL IN
TAP CL EX
1 -37.20 -37.16 -37.23 -37.17 -37.07 -37.18 -37.192 -37.14 -37.19 -37.12 -37.18 -37.27 -37.17 -37.16
Delta 0.06 0.03 0.11 0.01 0.20 0.01 0.03Rank 3 4 2 6 1 7 5
After the optimum parameters are selected, Taguchi predictor available in
Minitab is utilized to predict the response value. Based on those optimal parameters of the ‘maximum’ and ‘minimum’ level, the mean response value of 70.34 dB SPL and Signal-to-Noise (S/N) ratio of -36.95 were predicted by the Taguchi Results Predictor (see Figure 14). Obviously, the selected parameters are the best condition or even lower for ideal engine noise level.
2 -37.14 -37.19 -37.12 -37.18 -37.27 -37.17 -37.16Delta 0.06 0.03 0.11 0.01 0.20 0.01 0.03Rank 3 4 2 6 1 7 5
After the optimum parameters are selected, Taguchi predictor available in Minitab is utilized to predict the response value. Based on those optimal parameters of the 'maximum' and 'minimum' level, the mean response value of 70.34 dB SPL and Signal-to-Noise (S/N) ratio of -36.95 were predicted by the Taguchi Results Predictor (see Figure 14). Obviously, the selected parameters are the best condition or even lower for ideal engine noise level.
FIGURE 14Prediction of mean response value and Signal-to-Noise (S/N) ratio by using
Taguchi predictor available in Minitab software.
The predicted optimized parameters are then being validated by aconfirmation run on the final sample build up according to the best combinations. Based on the test result, actual value of sound pressure level is 70.4dB SPL which highly identical with the predicted value. The identical result shows that the combinations selected for optimized engine is correct and thus all eight runs are considered successful.
Conclusion and Future Research
Conclusion
The confirmation run result has shown that the methodology implemented in the experiment is effective in order to find the best combinations of parameter setting, in this case a product parameters. Based on the main effect plot, the parameter which most significant especially to reduce engine valvetrain noise is CAM EX WAV (Camshaft Exhaust Waviness) with lessthan 2.0μm maximum waviness curve (WCM). Besides of the optimum
Figure 14: Prediction of mean response value and Signal-to-Noise (S/N) ratio by using Taguchi predictor available in Minitab software
The predicted optimized parameters are then being validated by a confirmation run on the final sample build up according to the best combinations. Based on the test result, actual value of sound pressure level is 70.4 dB SPL which highly identical with the predicted value. The identical result shows that the combinations selected for optimized engine is correct and thus all eight runs are considered successful.
journal jMeche Vol 12.indd 45 4/20/2016 12:38:41 PM

46
Journal of Mechanical engineering (JMeche)
Conclusion and Future Research
Conclusion
The confirmation run result has shown that the methodology implemented in the experiment is effective in order to find the best combinations of parameter setting, in this case a product parameters. Based on the main effect plot, the parameter which most significant especially to reduce engine valvetrain noise is CAM EX WAV (Camshaft Exhaust Waviness) with less than 2.0μm maximum waviness curve (WCM). Besides of the optimum setting, this method is also able to identify the most significant factors affecting the response as shown in the Main Effect Plot and ANOVA table. With approximately 5.5% reduction of the sound pressure level (dB SPL) on the bench, this approach could be cost effective and more precisely will be able to avoid wrong judgment and unnecessary investigation.
Future Research
In order to satisfy the final quality of the optimal engine, a test needs to be carried out to validate its performance curve on dynometer bench according to the benchmark specification. This test is essential to find out any possible changes on the performance of the engine in which the customer will finally gain during driving. In specific, at certain engine RPM, the engine performance shall achieve at least the minimum Brake Torque and Brake Power value as specified in the manufacturer standard to indicate that the engine is operated within its intended design.
References
[1] P. R Apte, “Introduction to Taguchi Method,” Indian Institute of Technology at Mumbai, 2013. [Online]. Available: https://www.ee.iitb.ac.in/~apte/CV_PRA_TAGUCHI_INTRO.htm.
[2] M. Nalbant, H. Gökkaya, and G. Sur, “Application of Taguchi method in the optimization of cutting parameters for surface roughness in turning,” Mater. Des., Vol. 28, no. 4, pp. 1379–1385, Jan. 2007.
[3] B. M. D. M. N. A. R. and K. K. M.H.M. Haniff, A.R. Ismail, “The Taguchi Approach In Optimizing Environmental Factors Affecting Productivity In The Automotive Industry,” Vol. 3, no. June, pp. 306–317, 2011.
[4] I. Suh and R. Lyon, “An investigation of valvetrain noise for the sound quality of IC engines,” Noise Vib. Conf. Expo., no. 724, 1999.
journal jMeche Vol 12.indd 46 4/20/2016 12:38:41 PM
47
AnAlysis on the FActors And eFFects oF engine tApping noise by design oF experiment (doe)
[5] S. Hwang, K. Kang, B. Lim, and Y. Lim, “Noise reduction and sound quality improvement of valvetrain in V6 gasoline engine,” SAE World Congr., no. 724, 2005.
[6] N. Bansod and H. S. Negi, “Tappet Noise Reduction in Motorcycle Engine,” Int. J. Emerg. Technol. Adv. Eng., vol. 5, no. 4, pp. 505–516, 2015.
[7] R. L. Mason, Statistical Design and Analysis of Experiments With Applications to Engineering and Science, Second Ed. New Jersey: John Wiley & Sons Inc., 2003.
[8] Mohammed Yunus, Mohammad S. Alsoufi, Mohammed Salman Mustafa, “Application of Taguchi Design Approach in the Optimization of Die Design Parameters of a Two Cavity Injection Molding Tool for a Fan Blade Back Cover,” Int. J. IT Eng., Vol. 03, no. 07, pp. 11–20, 2015.
[9] Balaraju.J, A. Kumar.J., D. Saran.P, and C. S. Krishna Prasad.Rao, “Application of Taguchi Technique for Identifying Optimum Surface Roughness in CNC end Milling Process,” Int. J. Eng. Trends Technol., Vol. 21, no. 2, pp. 103–110, 2015.
[10] D. H. Stamatis, Six Sigma and Beyond: Design of Experiments. CRC Press LLC, 2002.
[11] Perusahaan Otomobil Nasional Sendirian Berhad, “Design of Experiment (Engine Valvetrain Noise).” Unpublished, p. 2, 2013.[12] Perusahaan Otomobil Nasional Sendirian Berhad, “ETM Dyno Test Bench
Facilities.” Unpublished, 2013.[13] P. Tomka, “Understanding Air Intake Systems (Air Density),” Performance
Systems Manufacturing, pp. 130–134, 2008.[14] Perusahaan Otomobil Nasional Sendirian Berhad, “Camshaft Lobe Waviness
Benchmarking.” Unpublished, 2005.[15] K. Do Kim, D. N. Han, and H. T. Kim, “Optimization of experimental
conditions based on the Taguchi robust design for the formation of nano-sized silver particles by chemical reduction method,” Chem. Eng. J., Vol. 104, no. 1–3, pp. 55–61, Nov. 2004.
journal jMeche Vol 12.indd 47 4/20/2016 12:38:41 PM