Embed Size (px)
Citation preview
Analysis of Wireless Data Transmission Characteristics
Rachel RubinFaculty Mentor: David Culler
Graduate Mentor: Robert Szewczyk
August 4, 2000
Abstract
The cooperation between the Ninja and SmartDust projects at the University ofCalifornia at Berkeley has produced an operating system that runs on a set of networkedsensors. The sensors are connected through a wireless radio. The error characteristicsin the data transmissions are not well known or well understood; the knowledge ofthe error patterns will allow the system designers to pick an encoding scheme forthe packets. We present a study of these error characteristics. In the process ofcharacterizing these errors, we discovered several problems within Tiny OS. The errorcharacteristics show that the current encoding scheme used by the designers of TinyOSis inappropriate.
1 Introduction
1.1 The Ninja Project
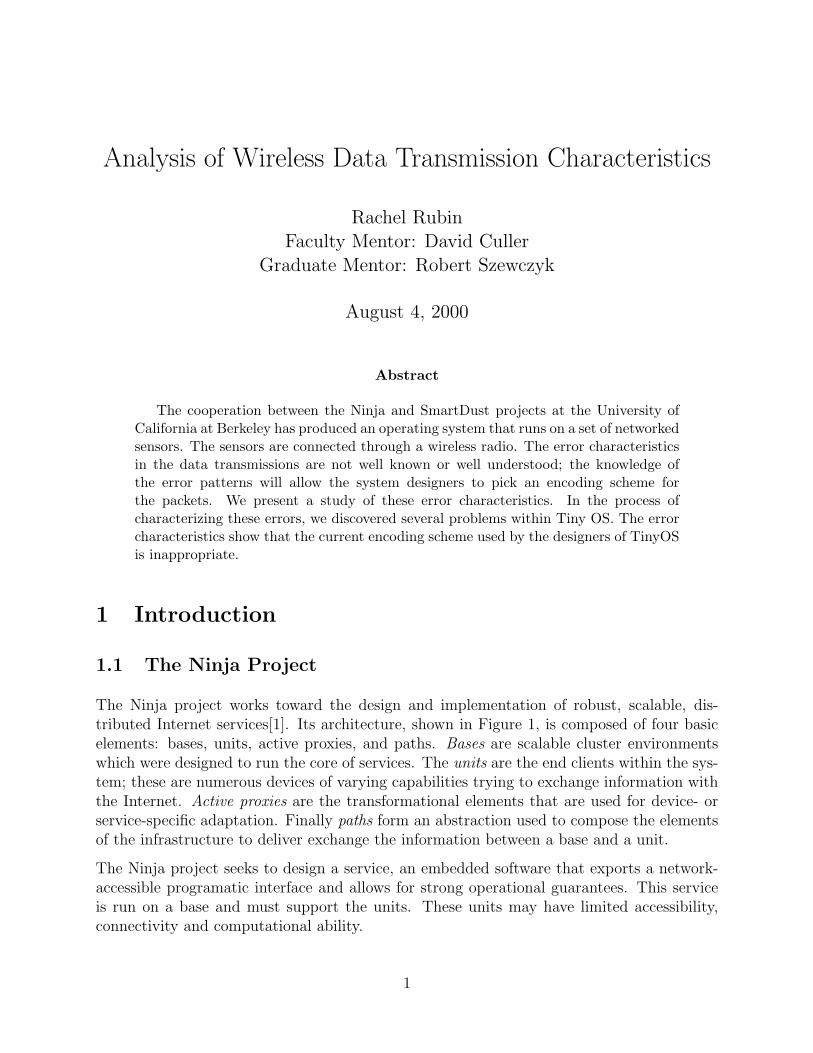
The Ninja project works toward the design and implementation of robust, scalable, dis-tributed Internet services[1]. Its architecture, shown in Figure 1, is composed of four basicelements: bases, units, active proxies, and paths. Bases are scalable cluster environmentswhich were designed to run the core of services. The units are the end clients within the sys-tem; these are numerous devices of varying capabilities trying to exchange information withthe Internet. Active proxies are the transformational elements that are used for device- orservice-specific adaptation. Finally paths form an abstraction used to compose the elementsof the infrastructure to deliver exchange the information between a base and a unit.
The Ninja project seeks to design a service, an embedded software that exports a network-accessible programatic interface and allows for strong operational guarantees. This serviceis run on a base and must support the units. These units may have limited accessibility,connectivity and computational ability.
1
Internet
ActiveProxy
ActiveProxy
Bases
Active Proxies
Units
Path
Figure 1: Ninja architecture
The service gains robustness through a process called conditioning the service. This is doneby selecting an appropriate programming model and concurrency strategy to maintain theresources. The service is viewed as a series of stages separated by variable-latency operations,such as receiving a requested file from the file system or returning a response to a browser,by the programming model. These stages share data using pass-by-value semantics and thisconstraint allows stages to be separated from each other, perhaps across physical machineboundaries. The task-driven composition of the stages works well with the event-drivendevices the Ninja project is working with and allows the architecture to scale to the pointwhere it can handle thousands of concurrent tasks.
1.2 Networked Sensors
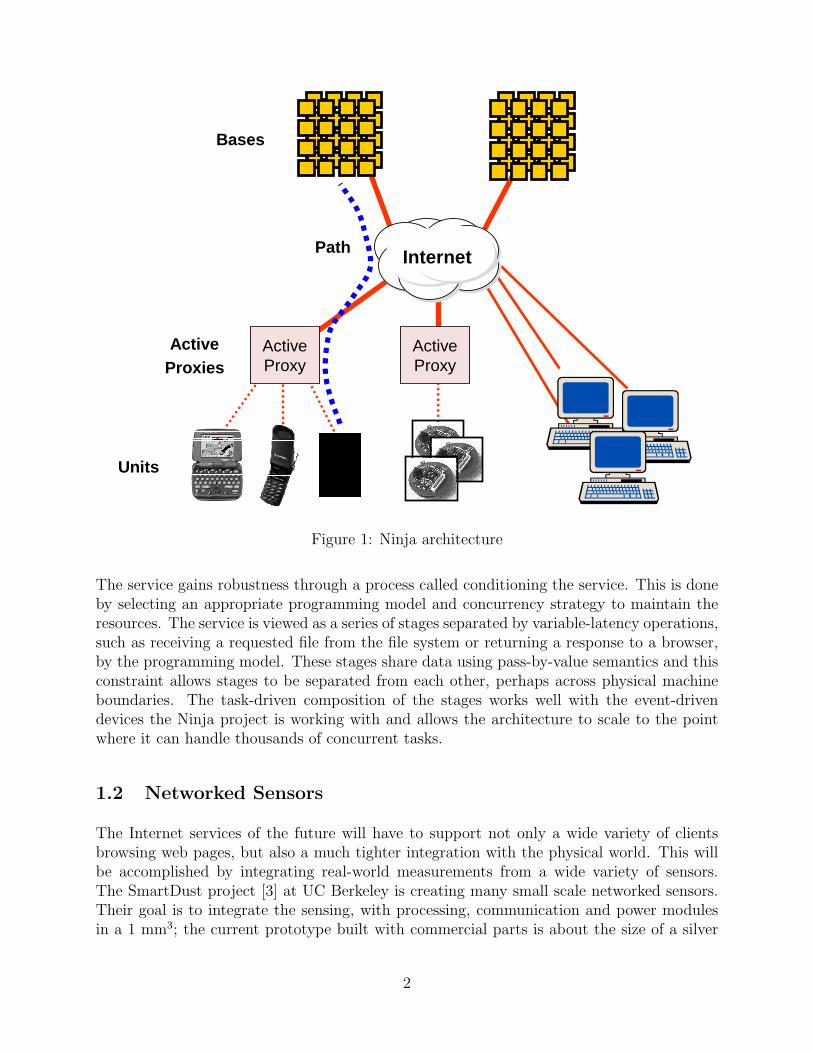
The Internet services of the future will have to support not only a wide variety of clientsbrowsing web pages, but also a much tighter integration with the physical world. This willbe accomplished by integrating real-world measurements from a wide variety of sensors.The SmartDust project [3] at UC Berkeley is creating many small scale networked sensors.Their goal is to integrate the sensing, with processing, communication and power modulesin a 1 mm3; the current prototype built with commercial parts is about the size of a silver
2
Figure 2: Hardware picture
dollar (see Figure 2). A part of the Ninja project is to develop a software architecture forprogramming these devices.
In order to meet the goals of size and cost, the networked sensors will have limited compu-tational resources, low storage capability, no human interface [2]. A current prototype of anetworked sensor developed by the SmartDust group contains a radio, a microcontroller andphoto and light sensors. The sensor, also called a mote1, can form ad hoc wireless networks,take measurements, and report information to services for analysis. This device is used asthe unit in the Ninja architecture in all of the work described below.
1.3 Tiny OS
There are several requirements that a networked sensor must meet[2]. Limited amountof storage means that the software running on the sensor may not be able to do a lot ofbuffering. Thus rather than operating in request-response mode, the software system shouldbe able to handle information flows. The constraints of cost and energy usage will limit thededicated hardware resources available on the device; the software system must thus copewith concurrency intensive operations in spite of limited physical resources. The applicationsof networked sensors are expected to be quite diverse; the operating system for these devicesmust be able to support these multiple applications. Finally, the system as a whole must berobust to failure of its parts.
In order to meet these requirements, researchers at UC Berkeley developed a small micro-threaded operating system called Tiny-OS. It is an event-driven system composed of plug-gable software modules. It is designed to handle a high degree of concurrency despite limitedhardware resources. The implementation language for the system is C.
The basic abstraction in Tiny OS is a software component. The component consists offour interrelated parts: command handlers, event handlers, a fixed-size frame and a bundle
1The current generation of these devices is clearly too large to earn the name “dust”. Currently a morefitting name could be a smart pebble, the Smart Dust felt it was appropriate to call this device a “dustmote”.
3
(add
r,ty
pe,d
ata)
send
_msg
send_msg_thread internalstate
RX
_pac
ket_
done
(buf
fer)
TX
_pac
ket_
done
(suc
cess
)
MessagingComponent
msg
_sen
d_do
ne(s
ucce
ss)
msg
_rec
(typ
e, d
ata)
init
pow
er(m
ode)
init
pow
er(m
ode)
TX
_pac
ket(
buf)
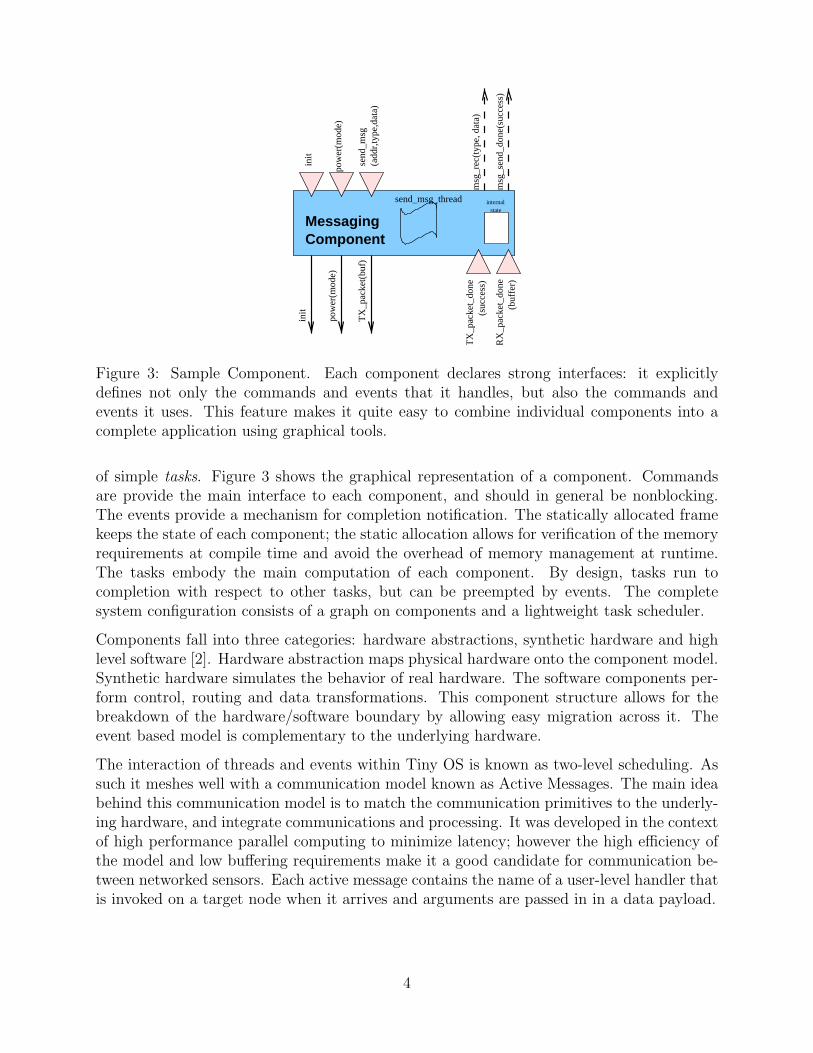
Figure 3: Sample Component. Each component declares strong interfaces: it explicitlydefines not only the commands and events that it handles, but also the commands andevents it uses. This feature makes it quite easy to combine individual components into acomplete application using graphical tools.
of simple tasks. Figure 3 shows the graphical representation of a component. Commandsare provide the main interface to each component, and should in general be nonblocking.The events provide a mechanism for completion notification. The statically allocated framekeeps the state of each component; the static allocation allows for verification of the memoryrequirements at compile time and avoid the overhead of memory management at runtime.The tasks embody the main computation of each component. By design, tasks run tocompletion with respect to other tasks, but can be preempted by events. The completesystem configuration consists of a graph on components and a lightweight task scheduler.
Components fall into three categories: hardware abstractions, synthetic hardware and highlevel software [2]. Hardware abstraction maps physical hardware onto the component model.Synthetic hardware simulates the behavior of real hardware. The software components per-form control, routing and data transformations. This component structure allows for thebreakdown of the hardware/software boundary by allowing easy migration across it. Theevent based model is complementary to the underlying hardware.
The interaction of threads and events within Tiny OS is known as two-level scheduling. Assuch it meshes well with a communication model known as Active Messages. The main ideabehind this communication model is to match the communication primitives to the underly-ing hardware, and integrate communications and processing. It was developed in the contextof high performance parallel computing to minimize latency; however the high efficiency ofthe model and low buffering requirements make it a good candidate for communication be-tween networked sensors. Each active message contains the name of a user-level handler thatis invoked on a target node when it arrives and arguments are passed in in a data payload.
4
2 Project
2.1 Purpose
The purpose of the project this summer was to characterize the errors in the radio trans-mission of the remote sensors. Although the radio is used often, its error characteristics arenot well known or understood. This would allow an encoding scheme to be picked to matchthe error characteristics. As a byproduct of this project, however, the analysis of the typesand placements of errors allowed conclusions to be drawn about the locations of the bugs inTiny OS.
2.2 Hardware
The motes that the Ninja project works with consist of a microcontroller with internal flashprogram memory, data SRAM and data EEPROM. These are connected to actuator andsensor devices including LEDs, a low-power radio transceiver, an analog photo-sensor, adigital temperature sensor, a serial port and a small coprocessor unit [2].
The radio is the most important part of the sensor for this project, since the data examinedis all transmitted via radio. It is an asynchronous input/output device with real-time con-straints [2]. The radio has no buffering, so each bit that passes through the radio must bedealt with as it is sensed. The radio is an RF Monolithics TR1000 operating in 916.50 MHzband[4]. The radio is designed for low-power, short-range wireless data communications. Itsdesign has several implications on the Tiny OS: in particular, the radio exposes raw bit-levelinterface, and the software needs to ensure the synchronization between sender and receiver,as well as reading every bit within tight real-time constraints.
2.3 Packets
The sensors sent information which was interpreted in 60-byte packets. Packets were setup to conform to to the standard set by Active Messaging. On the sender side, Tiny OSexposes asynchronous interface to send Active Messages. On the receiver side, the systemaccepts a message incoming from the network, and dispatches it to the handler for which itwas addressed.
The messages have a standard format: the packets contains a fixed header, and a datapayload. Currently, the payload is 20 bytes long and is replicated 3 times to ensure robustnessagainst errors. A voting scheme is used on a byte-by-byte basis to recover the data. Withinthe payload there is an address, and a dispatch identifier. The dispatch routine invokedby the handler is generated at compile time based on the message handlers present, whicheliminates the need for handler registration mechanisms.
5
2.4 Code
Code was developed that would read in bits from the mote and compare them with the bitsthat were expected given that packet type. The bits were read in in sixty character chunks orpackets. These packets were compared with the packet that was expected given the openingsequence of bits.
The bits, once they were read in, were dealt with in two different ways: encoded and decoded.The encoded bits were the ones read in from the mote-base. However, the program alsoneeded to deal with the data in a decoded fashion, where the expected behavior was known.The decoding was done by taking two consecutive eight-bit characters and making them intoone character. The stream that was being dealt with was reduced from 480 bits to 240 bitsand the behavior of this stream was known. This allowed the packets to be classified anddealt with appropriately.
There were two different packets that the sensors could send. One, beginning with an 0xff,described a routing path and did not change. The other transmitted packet began with a0x05 and 0x06. However, as opposed to the other packet-type, the contents of this packetchanged in a known pattern. The hex-values of the tenth and twentieth decoded characterincremented by 11. When the hex-value of this decoding reached 0xff, the value wouldwrap around and the ninth and tenth decoded character’s hex value would increase by one.A similar event occurred in the thirtieth decided bit, except that the hex-value increased by16. A known but changing bit pattern was generated, which made it easier to detect biterrors. Since the bits were constantly changing, errors would show up and not be hidden ina constant stream; the pattern also made it easier to see if any packets were missed.
3 Experiment
3.1 Setup
A mote-base was attached to a PC via the serial port and was used to gather data. Aremote sensor transmitted packets to the mote-base which were subsequently analyzed bythe program. The remote sensor was placed at four distances: 2 inches, 10 inches, 21 inchesand 58 inches. At these distances, the sensor was turned on and the program run untilit read approximately 3000 packets. Only the dynamic packets were sent to the PC foranalysis. However, since changes occurred, the behavior of the mote was variable and errorsmay occur.
3.2 Design
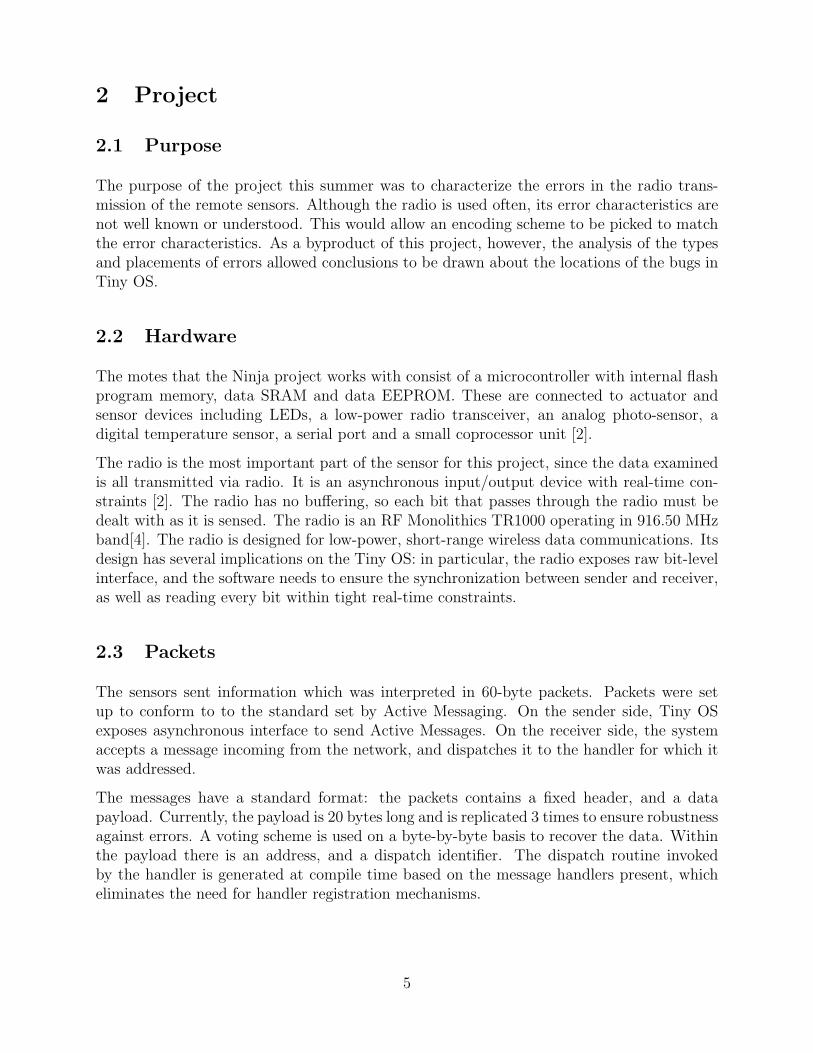
The error analysis tool, as opposed to be run on the motes, was a higher-level interface, orservice, that was run on the bases. It was written in C. The code was structured simply, asshown by the flow chart in Figure 4 . After it checked its alignment, so that the beginnings
6
Figure 4: Flow chart of the code structure
of the packets were being read in at the correct time, the program would read in a sixtycharacter chunk. The first decoded characters of this packet were examined and the packettype was determined. If the packet began with the 0x5 0x6 the correct, stored packet wasincremented so that the packets were, in theory, identical. Then, the expected and receivedpackets were compared bit by bit to determine if there was an error and, if so, where theerror was. This process was repeated until the user hard stopped it.
3.3 Measurements
Several pieces of data were collected during this process. The data collected was the totalnumber of bits seen, the total number of packets seen, the total number of bit errors, whichbits were wrong and which way they were off, the number of errors turning up in each typeof packet, the number of times each packet was seen, total number of packets with errors inthem, the number of 0x05 0x06, or data, packets that came out of sequence, the position ofeach bit error, and the number of unrecognizable packets. After each packet was analyzed,the data and analysis was displayed so that the user could follow what was happening. Themeasurements were made across two independent variables - distance between the mote-baseand the sensor and the time that the sensor had been running. Although there were twotypes of packets, only one was used for the experiments for simplicity sake.
3.4 Problems
One problem that was run across during the course of the experiments was that the mea-surements were taken with a faulty radio. This problem led to false initial conclusions being
7
0
0.5
1
1.5
2
2.5
0 500 1000 1500 2000 2500 3000 3500
Bit
erro
r ra
te (
%)
# of packets
Bit error rate for transmisiion over several distances
58 inches21 inches10 inches
2 inches
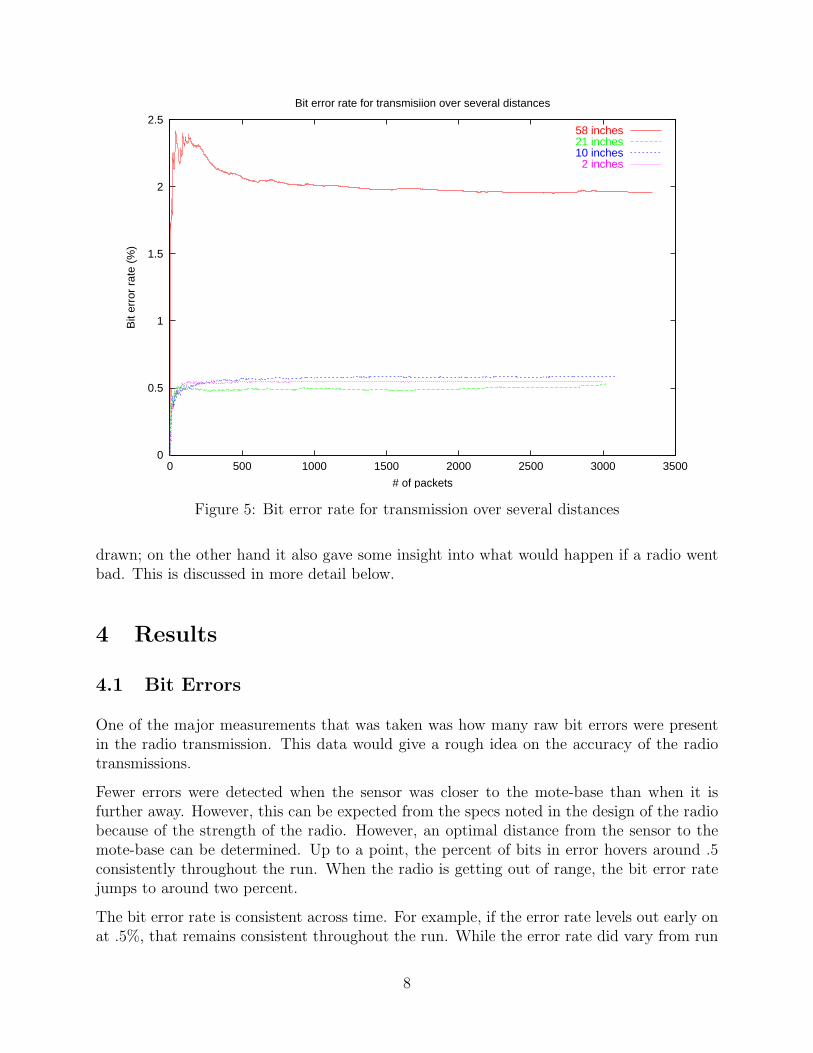
Figure 5: Bit error rate for transmission over several distances
drawn; on the other hand it also gave some insight into what would happen if a radio wentbad. This is discussed in more detail below.
4 Results
4.1 Bit Errors
One of the major measurements that was taken was how many raw bit errors were presentin the radio transmission. This data would give a rough idea on the accuracy of the radiotransmissions.
Fewer errors were detected when the sensor was closer to the mote-base than when it isfurther away. However, this can be expected from the specs noted in the design of the radiobecause of the strength of the radio. However, an optimal distance from the sensor to themote-base can be determined. Up to a point, the percent of bits in error hovers around .5consistently throughout the run. When the radio is getting out of range, the bit error ratejumps to around two percent.
The bit error rate is consistent across time. For example, if the error rate levels out early onat .5%, that remains consistent throughout the run. While the error rate did vary from run
8
to run, this variation was fairly small within the normal range of the radio.
Originally, there was an increase in the bit error rate over time. This led to the conclusionthat there was a problem in Tiny-OS, since the bit error rate should be constant across time.The bug was eventually tracked down. There was a race condition within the queue of TinyOS which was causing bits to be changed. Using the information gathered, the bug wastracked down and fixed.
4.2 Bit Error Position and Characteristics
The bit errors are evenly distributed between runs. It is a random, even distribution fromrun to run. However, the errors in one run tend to cluster in certain bits, but the positionsof these clusters vary from run to run. Interestingly enough, the most of the bit errorsobserved occur in a fixed bit within a payload. As we pointed out above, the currentencoding scheme transmits a 20 byte payload 3 times; many of the bit errors are separatedby 160 bits. For example, in one run there were nine errors at bit position twenty-six, onehundred and eighty-six and three hundred and forty-six. That finding suggests that there issome erroneous behavior within the Tiny OS which will have to be investigated further.
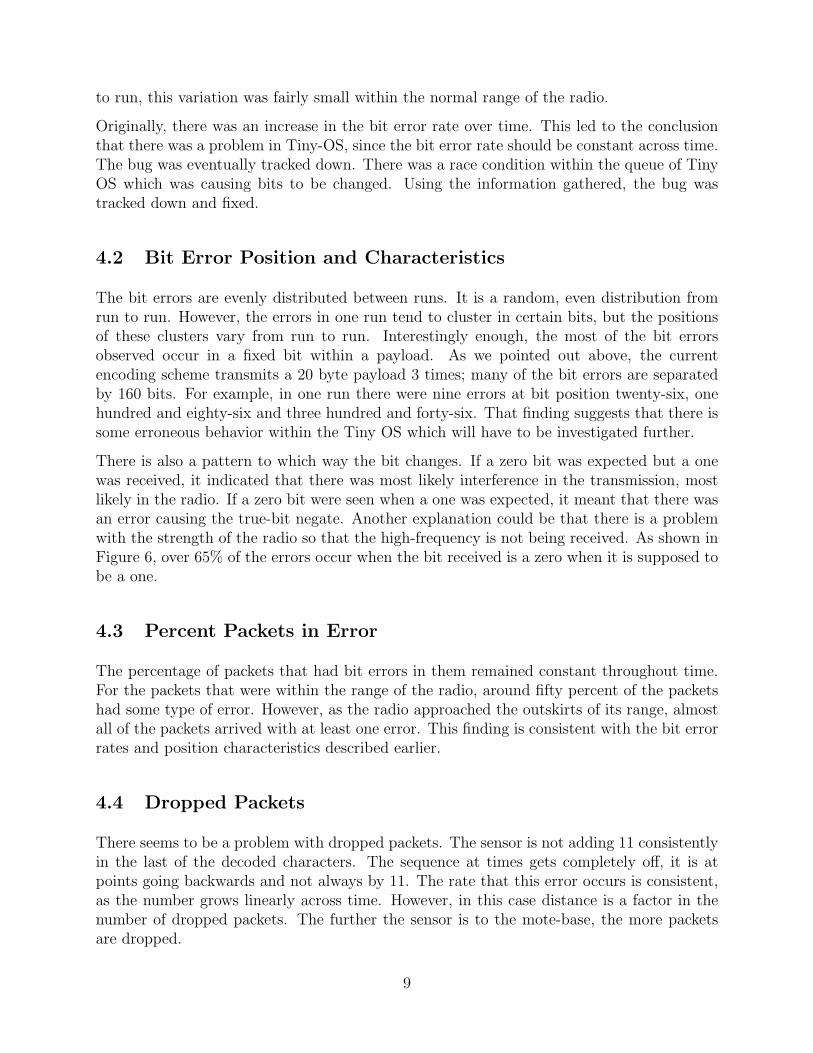
There is also a pattern to which way the bit changes. If a zero bit was expected but a onewas received, it indicated that there was most likely interference in the transmission, mostlikely in the radio. If a zero bit were seen when a one was expected, it meant that there wasan error causing the true-bit negate. Another explanation could be that there is a problemwith the strength of the radio so that the high-frequency is not being received. As shown inFigure 6, over 65% of the errors occur when the bit received is a zero when it is supposed tobe a one.
4.3 Percent Packets in Error
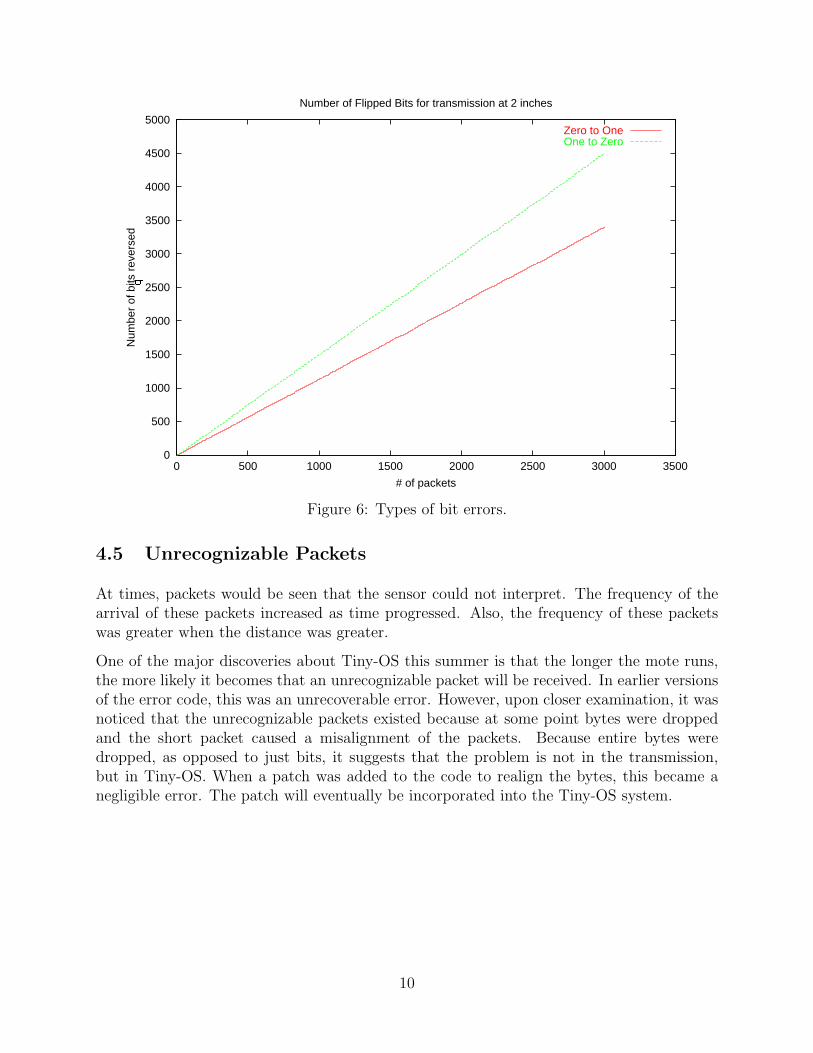
The percentage of packets that had bit errors in them remained constant throughout time.For the packets that were within the range of the radio, around fifty percent of the packetshad some type of error. However, as the radio approached the outskirts of its range, almostall of the packets arrived with at least one error. This finding is consistent with the bit errorrates and position characteristics described earlier.
4.4 Dropped Packets
There seems to be a problem with dropped packets. The sensor is not adding 11 consistentlyin the last of the decoded characters. The sequence at times gets completely off, it is atpoints going backwards and not always by 11. The rate that this error occurs is consistent,as the number grows linearly across time. However, in this case distance is a factor in thenumber of dropped packets. The further the sensor is to the mote-base, the more packetsare dropped.
9
0
500
1000
1500
2000
2500
3000
3500
4000
4500
5000
0 500 1000 1500 2000 2500 3000 3500
Num
ber
of b
its r
ever
sed
�
# of packets
Number of Flipped Bits for transmission at 2 inches
Zero to OneOne to Zero
Figure 6: Types of bit errors.
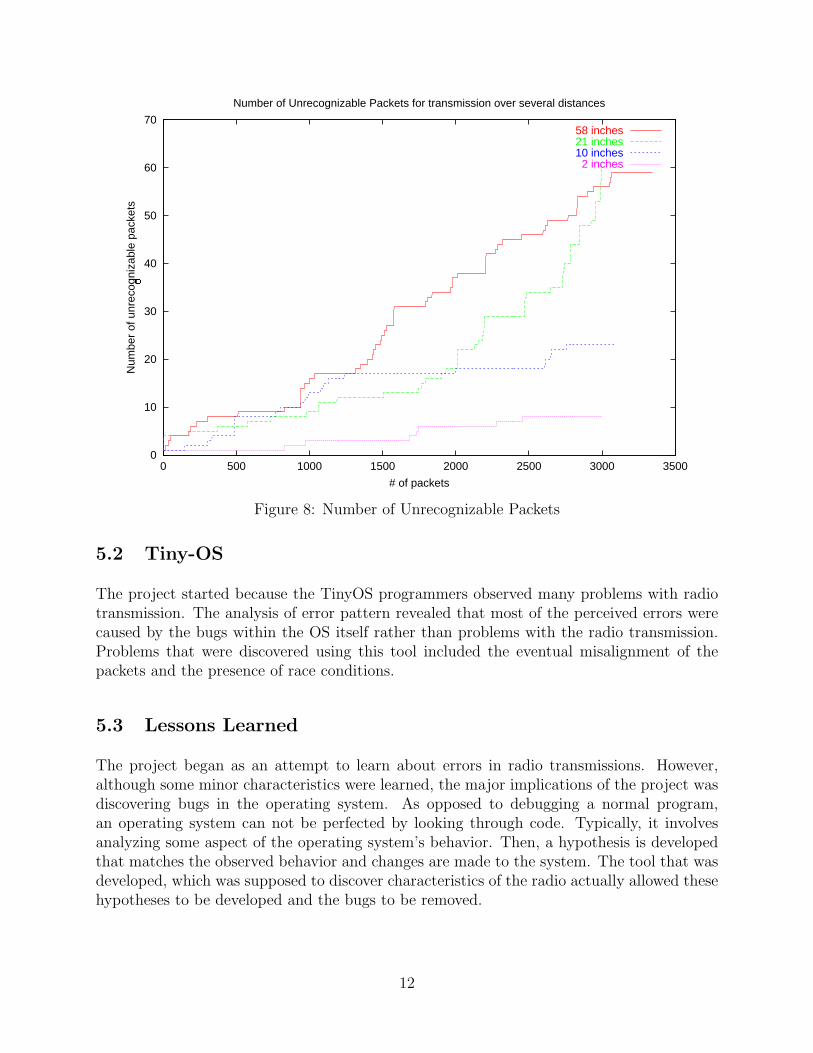
4.5 Unrecognizable Packets
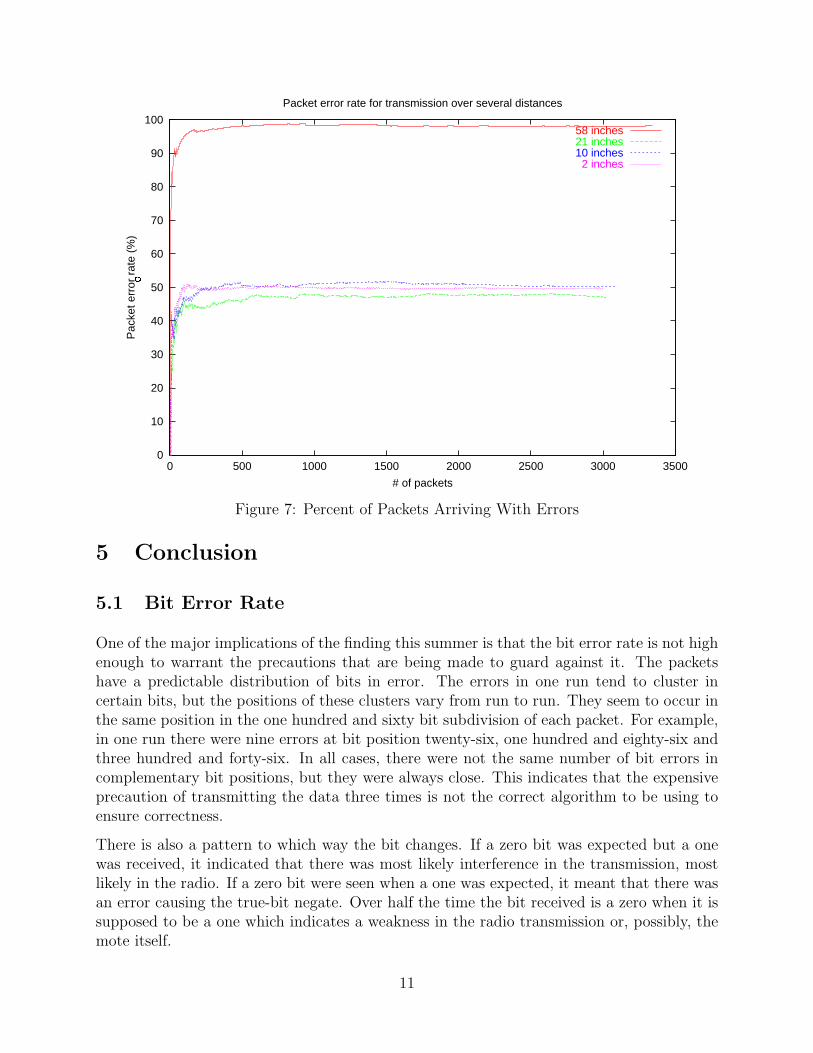
At times, packets would be seen that the sensor could not interpret. The frequency of thearrival of these packets increased as time progressed. Also, the frequency of these packetswas greater when the distance was greater.
One of the major discoveries about Tiny-OS this summer is that the longer the mote runs,the more likely it becomes that an unrecognizable packet will be received. In earlier versionsof the error code, this was an unrecoverable error. However, upon closer examination, it wasnoticed that the unrecognizable packets existed because at some point bytes were droppedand the short packet caused a misalignment of the packets. Because entire bytes weredropped, as opposed to just bits, it suggests that the problem is not in the transmission,but in Tiny-OS. When a patch was added to the code to realign the bytes, this became anegligible error. The patch will eventually be incorporated into the Tiny-OS system.
10
0
10
20
30
40
50
60
70
80
90
100
0 500 1000 1500 2000 2500 3000 3500
Pac
ket e
rror
rat
e (%
)
�
# of packets
Packet error rate for transmission over several distances
58 inches21 inches10 inches
2 inches
Figure 7: Percent of Packets Arriving With Errors
5 Conclusion
5.1 Bit Error Rate
One of the major implications of the finding this summer is that the bit error rate is not highenough to warrant the precautions that are being made to guard against it. The packetshave a predictable distribution of bits in error. The errors in one run tend to cluster incertain bits, but the positions of these clusters vary from run to run. They seem to occur inthe same position in the one hundred and sixty bit subdivision of each packet. For example,in one run there were nine errors at bit position twenty-six, one hundred and eighty-six andthree hundred and forty-six. In all cases, there were not the same number of bit errors incomplementary bit positions, but they were always close. This indicates that the expensiveprecaution of transmitting the data three times is not the correct algorithm to be using toensure correctness.
There is also a pattern to which way the bit changes. If a zero bit was expected but a onewas received, it indicated that there was most likely interference in the transmission, mostlikely in the radio. If a zero bit were seen when a one was expected, it meant that there wasan error causing the true-bit negate. Over half the time the bit received is a zero when it issupposed to be a one which indicates a weakness in the radio transmission or, possibly, themote itself.
11
0
10
20
30
40
50
60
70
0 500 1000 1500 2000 2500 3000 3500
Num
ber
of u
nrec
ogni
zabl
e pa
cket
s
�
# of packets
Number of Unrecognizable Packets for transmission over several distances
58 inches21 inches10 inches
2 inches
Figure 8: Number of Unrecognizable Packets
5.2 Tiny-OS
The project started because the TinyOS programmers observed many problems with radiotransmission. The analysis of error pattern revealed that most of the perceived errors werecaused by the bugs within the OS itself rather than problems with the radio transmission.Problems that were discovered using this tool included the eventual misalignment of thepackets and the presence of race conditions.
5.3 Lessons Learned
The project began as an attempt to learn about errors in radio transmissions. However,although some minor characteristics were learned, the major implications of the project wasdiscovering bugs in the operating system. As opposed to debugging a normal program,an operating system can not be perfected by looking through code. Typically, it involvesanalyzing some aspect of the operating system’s behavior. Then, a hypothesis is developedthat matches the observed behavior and changes are made to the system. The tool that wasdeveloped, which was supposed to discover characteristics of the radio actually allowed thesehypotheses to be developed and the bugs to be removed.
12
6 Acknowledgements
I would like to thank Professor David Culler for giving me the opportunity to work in hislab. Of course, without the help and knowledge of my graduate mentor Robert Szewczykand the other members of the lab, Jason Hill and Matt Welsh, I would not have been ableto have a successful summer. I would also like to thank the organizers of the SUPERBprogram, especially Marie Mayne, Dr. Shelia Humphries, Monica Lin and Suzanne Kauerfor putting together the program. Finally, I would like to thank my fellow SUPERB-ites fortheir friendship and support throughout the summer.
References
[1] Steven D. Gribble et. al. The ninja architecture for robust internet-scale systems andservices. Special Issue of Computer Networks on Pervasive Computing, 2000.
[2] Jason Hill, Robert Szewczyk, Alec Woo, Seth Hollar, David Culler, Kristofer Pister.System Architecture Directions for Networked Sensors. In Architectural Support for Pro-gramming Languages and Operating Systems, 2000.
[3] K. S. J. Pister, J. M. Kahn, and B. E. Boser. Smart dust: Wireless networks of millimeter-scale sensor nodes, 1999.
[4] RF Monolithics. Tr1000 916 Mhz Hybrid Transceiver.
13