Embed Size (px)
Citation preview
NOAA’s National Marine Protected Areas (MPA) Center’s mission is to facilitate the effective use of science, technology, training, and information in the planning, management, and evaluation of the nation’s system of marine protected areas. The MPA Center works in partnership with federal, state, tribal, and local governments and stakeholders to develop a science-based, comprehensive national system of MPAs. These collaborative efforts will lead to a more efficient, effective use of MPAs now and in the future to conserve and sustain the nation’s vital marine resources.
Office of Ocean and Coastal Resource Management, NOAA Ocean Service, 1305 East West Hwy (N/ORM), Silver Spring, MD 20910, U.S.A.
www.mpa.gov
Analysis of United States MPAsMarch 2012
April 2012
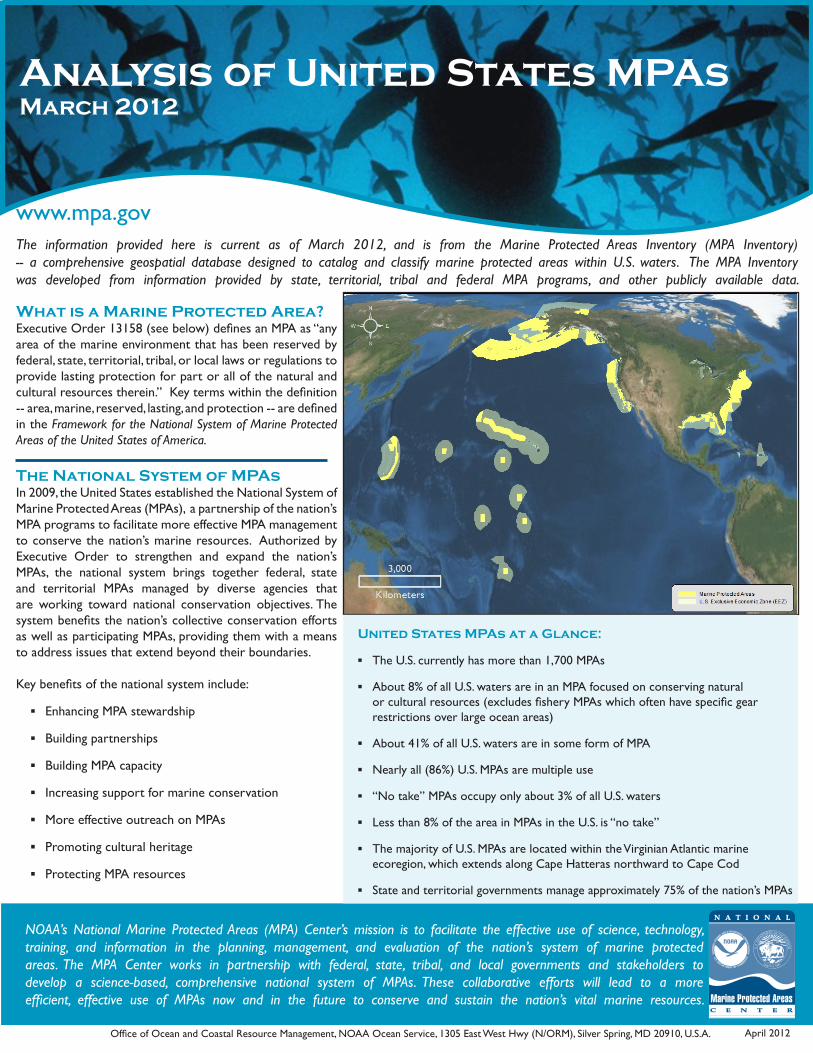
What is a Marine Protected Area?Executive Order 13158 (see below) defines an MPA as “any area of the marine environment that has been reserved by federal, state, territorial, tribal, or local laws or regulations to provide lasting protection for part or all of the natural and cultural resources therein.” Key terms within the definition -- area, marine, reserved, lasting, and protection -- are defined in the Framework for the National System of Marine Protected Areas of the United States of America.
The information provided here is current as of March 2012, and is from the Marine Protected Areas Inventory (MPA Inventory) -- a comprehensive geospatial database designed to catalog and classify marine protected areas within U.S. waters. The MPA Inventory was developed from information provided by state, territorial, tribal and federal MPA programs, and other publicly available data.
United States MPAs at a Glance:
▪ The U.S. currently has more than 1,700 MPAs
▪ About 8% of all U.S. waters are in an MPA focused on conserving natural or cultural resources (excludes fishery MPAs which often have specific gear restrictions over large ocean areas)
▪ About 41% of all U.S. waters are in some form of MPA
▪ Nearly all (86%) U.S. MPAs are multiple use
▪ “No take” MPAs occupy only about 3% of all U.S. waters
▪ Less than 8% of the area in MPAs in the U.S. is “no take”
▪ The majority of U.S. MPAs are located within the Virginian Atlantic marine ecoregion, which extends along Cape Hatteras northward to Cape Cod
▪ State and territorial governments manage approximately 75% of the nation’s MPAs
The National System of MPAsIn 2009, the United States established the National System of Marine Protected Areas (MPAs), a partnership of the nation’s MPA programs to facilitate more effective MPA management to conserve the nation’s marine resources. Authorized by Executive Order to strengthen and expand the nation’s MPAs, the national system brings together federal, state and territorial MPAs managed by diverse agencies that are working toward national conservation objectives. The system benefits the nation’s collective conservation efforts as well as participating MPAs, providing them with a means to address issues that extend beyond their boundaries.
Key benefits of the national system include:
▪ Enhancing MPA stewardship
▪ Building partnerships
▪ Building MPA capacity
▪ Increasing support for marine conservation
▪ More effective outreach on MPAs
▪ Promoting cultural heritage
▪ Protecting MPA resources

Analysis of united states marine protected areas
www.mpa.gov
8
6317
218
35 18
331
381
28 12
60
2 233 30
58
114
17 4 21 1947 34
104
10 634
11 10 27 26 26 28 1047
7340
0
50
100
150
200
250
300
350
400
450
MPAs Around the Nation
Percent of Sites By Region Percent of Area By Region
There are 1,729 MPAs in place in the U.S. These areas cover more than 41% of U.S. marine waters, and vary widely in purpose, legal authorities, managing agencies, management approaches, level of protection, and restrictions on human uses. Excluding fishery MPAs, which are typically established over large areas with targeted gear restrictions, 8% of U.S. waters are within an MPA. Regionally, the Northeast region has the highest percentage of regional waters (0-200 nautical miles) in some form of MPA. The Alaska region has the largest MPA area while the Great Lakes and Caribbean regions combined have the least MPA area. Approximately 23% of U.S. MPAs are found in the Northeast region while 20% of U.S. MPAs are found in the Southeast region.
Alaska4%
Pacific Islands
7%
Caribbean3%
Great Lakes7%
Gulf of Mexico
19%
Northeast23%
Southeast20%
West Coast19%
53%
< 1% < 1%5% 8%
18%
7% 8%
0%
10%
20%
30%
40%
50%
60%
Number of MPAs By State
INTERACTIVE MAP VIEWER OF U.S. MPAsThe National Marine Protected Areas Center’s Interactive MPA Mapping Tool allows users to view boundaries and access data for nearly1,600 marine protected areas (MPAs) in the United States. The viewer can be downloaded at: http://www.mpa.gov/dataanalysis/mpainventory/mpaviewer/
National System StatusThe national system of MPAs is a voluntary partnership of MPAs to foster collaboration to enhance protection of marine resources and represent the nation’s diverse ecosystems. The national system does not bring state, territorial or local sites under federal authority, nor does it restrict or change the management of any MPA. There are currently 355 members of the national system (as of March 2012). An additional 741 sites are eligible for national system membership. To be eligible for the national system, a site must meet criteria set forth in the Framework for the National System of MPAs of the United States.
Eligible741
Not Eligible 633 National
System Members
355
www.mpa.gov
Analysis of united states marine protected areas
< 1% < 1%7% 10%
92%
8%
< 1%0%
20%
40%
60%
80%
100%
No Access No Impact No Take Other UniformMultiple Use
ZonedMultiple Use
Zoned w/NoTake Areas
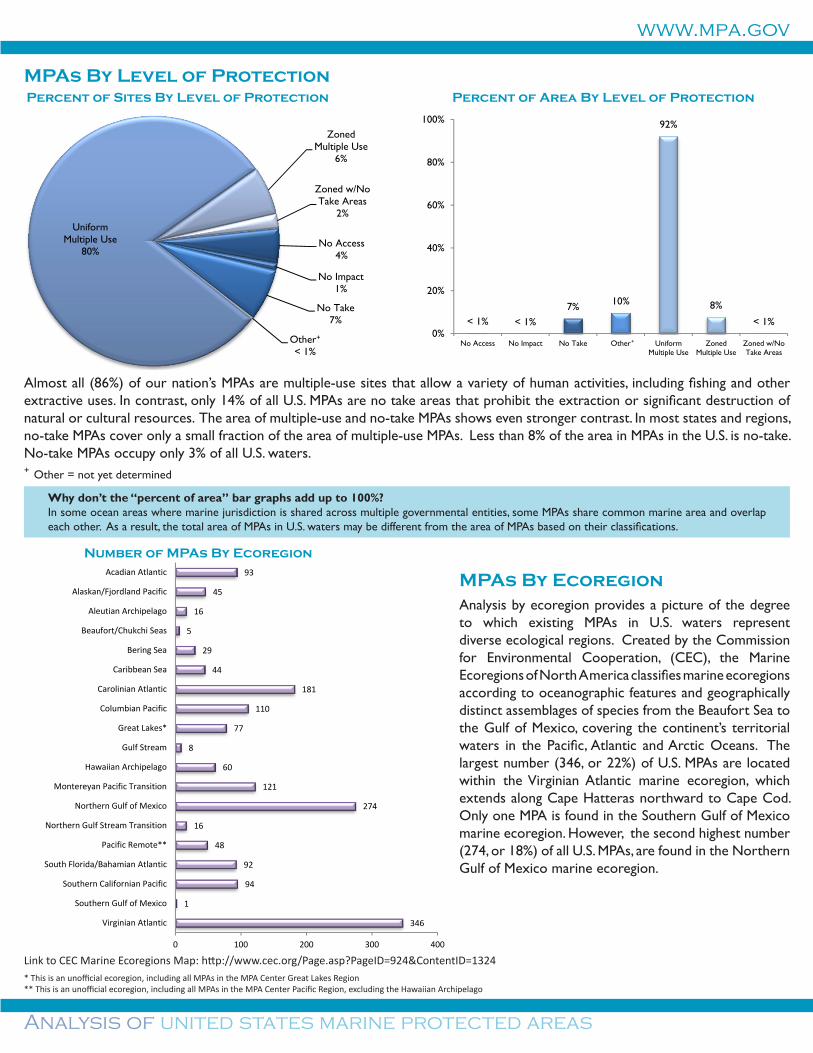
Almost all (86%) of our nation’s MPAs are multiple-use sites that allow a variety of human activities, including fishing and other extractive uses. In contrast, only 14% of all U.S. MPAs are no take areas that prohibit the extraction or significant destruction of natural or cultural resources. The area of multiple-use and no-take MPAs shows even stronger contrast. In most states and regions, no-take MPAs cover only a small fraction of the area of multiple-use MPAs. Less than 8% of the area in MPAs in the U.S. is no-take. No-take MPAs occupy only 3% of all U.S. waters.
MPAs By Level of ProtectionPercent of Sites By Level of Protection Percent of Area By Level of Protection
MPAs By Ecoregion Analysis by ecoregion provides a picture of the degree to which existing MPAs in U.S. waters represent diverse ecological regions. Created by the Commission for Environmental Cooperation, (CEC), the Marine Ecoregions of North America classifies marine ecoregions according to oceanographic features and geographically distinct assemblages of species from the Beaufort Sea to the Gulf of Mexico, covering the continent’s territorial waters in the Pacific, Atlantic and Arctic Oceans. The largest number (346, or 22%) of U.S. MPAs are located within the Virginian Atlantic marine ecoregion, which extends along Cape Hatteras northward to Cape Cod. Only one MPA is found in the Southern Gulf of Mexico marine ecoregion. However, the second highest number (274, or 18%) of all U.S. MPAs, are found in the Northern Gulf of Mexico marine ecoregion.
* This is an unofficial ecoregion, including all MPAs in the MPA Center Great Lakes Region** This is an unofficial ecoregion, including all MPAs in the MPA Center Pacific Region, excluding the Hawaiian Archipelago
No Access4%
No Impact1%
No Take7%
Other+
< 1%
Uniform Multiple Use
80%
Zoned Multiple Use
6%
Zoned w/No Take Areas
2%
93
45
16
5
29
44
181
110
77
8
60
121
274
16
48
92
94
1
346
0 100 200 300 400
Acadian Atlantic
Alaskan/Fjordland Pacific
Aleutian Archipelago
Beaufort/Chukchi Seas
Bering Sea
Caribbean Sea
Carolinian Atlantic
Columbian Pacific
Great Lakes*
Gulf Stream
Hawaiian Archipelago
Montereyan Pacific Transition
Northern Gulf of Mexico
Northern Gulf Stream Transition
Pacific Remote**
South Florida/Bahamian Atlantic
Southern Californian Pacific
Southern Gulf of Mexico
Virginian Atlantic
Why don’t the “percent of area” bar graphs add up to 100%?In some ocean areas where marine jurisdiction is shared across multiple governmental entities, some MPAs share common marine area and overlap each other. As a result, the total area of MPAs in U.S. waters may be different from the area of MPAs based on their classifications.
+ Other = not yet determined
+
Link to CEC Marine Ecoregions Map: http://www.cec.org/Page.asp?PageID=924&ContentID=1324
Number of MPAs By Ecoregion

Office of Ocean and Coastal Resource Management, NOAA Ocean Service, 1305 East West Hwy (N/ORM), Silver Spring, MD 20910, U.S.A.
www.mpa.gov
April,2012
Lauren Wenzel Dr. Mimi D’Iorio Kara YeagerActing Director, National MPA Center GIS/Database Manager Communications [email protected] [email protected] [email protected](301) 563-1136 (831) 645-2703 (301) 563-1162
MPAs By Primary Conservation Focus
MPAs By Level of Government
Percent of Sites By Conservation focus Percent ofArea By Conservation Focus
U.S. MPAs are used to conserve natural and cultural heritage, and/or to support sustainable production of our marine resources. Many MPAs have more than one conservation focus. Sixty-eight percent were created, at least in part, to conserve natural heritage values such as biodiversity, ecosystems, or protected species. Approximately 23% of U.S. MPAs focus on sustainable production, and 9% focus primarily on conserving our nation’s cultural heritage. About half of the MPA area in the U.S. is focused on natural heritage, and half on sustainable production, with less than 1% focused primarily on cultural heritage protection (the numbers in the graph do not add up to 100% because some MPAs overlap each other). These natural heritage MPAs include some very large areas managed by NOAA Fisheries to protect right whales and other threatened species from fishing impacts.
Percent of Sites By Level of Government Percent of Area By Level of Government
Approximately 75% of the nation’s MPAs are managed by coastal states and territories, while 22% are under federal jurisdiction. Fewer than 1% of U.S. MPAs are managed by a local agency. Although most U.S. MPAs are managed by states and territories, these areas are typically quite small. In contrast, federally managed areas such as Federal fishery closures and National Monuments are often very large. For this reason, approximately 98% of the total MPA area is managed by federal agencies.
ABOUT THE DATAThe information presented in this fact sheet is based on data from the National MPA Center’s MPA Inventory. Statistics are based on 1,563 sites in U.S. marine waters (0-200 nautical miles) with GIS data. For more information, see www.mpa.gov, or contact [email protected].
Cultural Heritage
9%
Natural Heritage
68%
Sustainable Production
23%
State72%
Federal22%
Partnership3%
Territorial3%
Local< 1%
98%
< 1% 7% 8%
< 1%0%
20%
40%
60%
80%
100%
Federal Local Partnership State Territorial
< 1%
56% 54%
0%
10%
20%
30%
40%
50%
60%
Cultural Heritage Natural Heritage SustainableProduction