Embed Size (px)
Citation preview

Ao
AA
a
ARRAA
KMFANNR
1
tn[hasafpta[sat
k
0d
Talanta 81 (2010) 1529–1535
Contents lists available at ScienceDirect
Talanta
journa l homepage: www.e lsev ier .com/ locate / ta lanta
nalysis of total dissolved mercury in waters after on-line preconcentrationn an active gold column
nja Zierhut, Kerstin Leopold ∗, Lena Harwardt, Michael Schusterrbeitsgruppe für Analytische Chemie, Technische Universität München, Lichtenbergstrasse 4, D-85747 Garching, Germany
r t i c l e i n f o
rticle history:eceived 27 October 2009eceived in revised form 11 February 2010ccepted 25 February 2010vailable online 6 March 2010
eywords:ercury preconcentration
low injection analysistomic fluorescence spectrometryano-structured active gold
a b s t r a c t
A reagent-free fully automated flow injection analysis (FIA) system coupled to atomic fluorescence spec-trometry (AFS) for mercury (Hg) quantification is reported, using active nano-structured gold collectorsfor direct preconcentration of dissolved mercury species from natural waters. Recently we had shownthe potential of such an approach for Hg analysis in seawater. This paper now describes the optimisationand validation of the proposed method including the investigation of possible limitations arising withmatrix constituents, such as dissolved organic carbon (DOC). A broad variety of water matrices (seawater,river water, moorland water, effluent from wastewater treatment plant) were investigated in order tocheck the feasibility of the proposed method for total dissolved Hg determination in natural waters. AllFIA parameters were optimised by checking Hg recovery in real water samples. Figures of merit of theproposed method – working range, carry over effects, detection limit, reproducibility, etc. – were deter-
atural watereagent-free mercury determination
mined. The method provides a high sensitivity (detection limit: 0.2 pg Hg) and very good reproducibility(RSD 1.1%, [Hg] = 5 ng L−1, n = 10). It offers several advantages because no reagents are needed for speciesconversion, preconcentration, or desorption and therefore the risk of contamination and blank valuesare lowered, reagent and time consumption are minimized. The system was successfully validated bymeasurement of a series of recoveries in real waters (all >96%) and in the certified standard referencematerial BCR 579 (mercury in coastal sea water, recovery 100.5%). Furthermore, the proposed method
ter sa
was applied to 15 real wa. Introduction
Environmental mercury (Hg) monitoring is very important dueo its high toxicity. Mercury is released to the environment throughatural and anthropogenic processes and is distributed globally1]. Nowadays, mercury levels of the land, atmosphere and oceanave increased by a factor of 3–5 due to human activities [2] andpproximately one third of the total atmospheric mercury emis-ion is of direct anthropogenic origin [3]. Bioaccumulation in thequatic food chain has been well documented and factors of 106
rom water to predatory fish are reached [4–6]. Furthermore, theortion of the most toxic mercury species – methyl mercury – ofhe total mercury content increases with the trophic level from
value of approximately 5% in water to over 95% in fish tissue
4,7]. Therefore, fish consumption is the most important expo-ure risk for human and wildlife posing a serious risk to healthnd enormous costs to public health systems [8]. Consequently,he determination of mercury in the hydrosphere is mandatory∗ Corresponding author. Tel.: +49 89 289 13764; fax: +49 89 289 14513.E-mail addresses: [email protected],
[email protected] (K. Leopold).
039-9140/$ – see front matter © 2010 Elsevier B.V. All rights reserved.oi:10.1016/j.talanta.2010.02.064
mples for Hg ultra trace analysis.© 2010 Elsevier B.V. All rights reserved.
in the European Water Framework Directive, where mercury andits compounds are classified as one of the 20 priority hazardoussubstances.
Among the techniques that have been developed for mercuryanalysis during the past decades only few are sufficient for mer-cury determination in the sub ng L−1 range, as required for theanalysis of natural water samples. Comprehensive reviews on mer-cury ultra trace analysis techniques are given by e.g. Clevenger etal. [9] and Leopold et al. [10]. Highly sensitive detection methodscombined with preconcentration and matrix separation techniquesare useful for this purpose. Commonly applied sensitive detectiontechniques are atomic fluorescence spectrometry (AFS) [11,12] orinductively coupled plasma-mass spectrometry (ICP-MS) [13,14].For matrix separation and preconcentration cold vapour (CV) gen-eration and subsequent Hg vapour trapping on precious metal traps[11–16] or solid phase microextraction (SPME) techniques in com-bination with species derivatisation [17–21] are often used priorto Hg detection. The combination of CV generation and AFS detec-
tion provides a high sensitivity and is therefore recommended forHg analysis in natural waters by several standard methods, suchas the European Standard (EN) and International Organization forStandardization (ISO) method 17852:2006 and the United StatesEnvironment Protection Agency (US EPA) method 1631. However,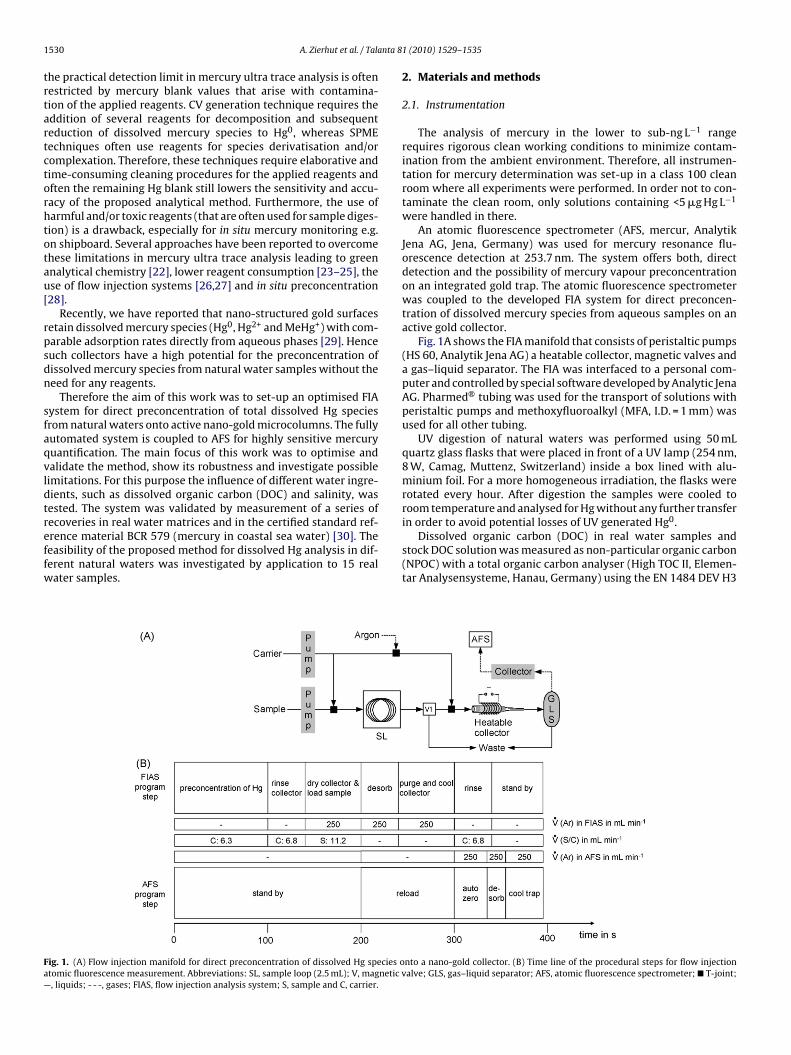
1 nta 8
trtartctorhtotau[
rpsdn
sfaqvldtreffw
Fa—
530 A. Zierhut et al. / Tala
he practical detection limit in mercury ultra trace analysis is oftenestricted by mercury blank values that arise with contamina-ion of the applied reagents. CV generation technique requires theddition of several reagents for decomposition and subsequenteduction of dissolved mercury species to Hg0, whereas SPMEechniques often use reagents for species derivatisation and/oromplexation. Therefore, these techniques require elaborative andime-consuming cleaning procedures for the applied reagents andften the remaining Hg blank still lowers the sensitivity and accu-acy of the proposed analytical method. Furthermore, the use ofarmful and/or toxic reagents (that are often used for sample diges-ion) is a drawback, especially for in situ mercury monitoring e.g.n shipboard. Several approaches have been reported to overcomehese limitations in mercury ultra trace analysis leading to greennalytical chemistry [22], lower reagent consumption [23–25], these of flow injection systems [26,27] and in situ preconcentration28].
Recently, we have reported that nano-structured gold surfacesetain dissolved mercury species (Hg0, Hg2+ and MeHg+) with com-arable adsorption rates directly from aqueous phases [29]. Henceuch collectors have a high potential for the preconcentration ofissolved mercury species from natural water samples without theeed for any reagents.
Therefore the aim of this work was to set-up an optimised FIAystem for direct preconcentration of total dissolved Hg speciesrom natural waters onto active nano-gold microcolumns. The fullyutomated system is coupled to AFS for highly sensitive mercuryuantification. The main focus of this work was to optimise andalidate the method, show its robustness and investigate possibleimitations. For this purpose the influence of different water ingre-ients, such as dissolved organic carbon (DOC) and salinity, wasested. The system was validated by measurement of a series ofecoveries in real water matrices and in the certified standard ref-
rence material BCR 579 (mercury in coastal sea water) [30]. Theeasibility of the proposed method for dissolved Hg analysis in dif-erent natural waters was investigated by application to 15 realater samples.ig. 1. (A) Flow injection manifold for direct preconcentration of dissolved Hg species otomic fluorescence measurement. Abbreviations: SL, sample loop (2.5 mL); V, magnetic v, liquids; - - -, gases; FIAS, flow injection analysis system; S, sample and C, carrier.
1 (2010) 1529–1535
2. Materials and methods
2.1. Instrumentation
The analysis of mercury in the lower to sub-ng L−1 rangerequires rigorous clean working conditions to minimize contam-ination from the ambient environment. Therefore, all instrumen-tation for mercury determination was set-up in a class 100 cleanroom where all experiments were performed. In order not to con-taminate the clean room, only solutions containing <5 �g Hg L−1
were handled in there.An atomic fluorescence spectrometer (AFS, mercur, Analytik
Jena AG, Jena, Germany) was used for mercury resonance flu-orescence detection at 253.7 nm. The system offers both, directdetection and the possibility of mercury vapour preconcentrationon an integrated gold trap. The atomic fluorescence spectrometerwas coupled to the developed FIA system for direct preconcen-tration of dissolved mercury species from aqueous samples on anactive gold collector.
Fig. 1A shows the FIA manifold that consists of peristaltic pumps(HS 60, Analytik Jena AG) a heatable collector, magnetic valves anda gas–liquid separator. The FIA was interfaced to a personal com-puter and controlled by special software developed by Analytic JenaAG. Pharmed® tubing was used for the transport of solutions withperistaltic pumps and methoxyfluoroalkyl (MFA, I.D. = 1 mm) wasused for all other tubing.
UV digestion of natural waters was performed using 50 mLquartz glass flasks that were placed in front of a UV lamp (254 nm,8 W, Camag, Muttenz, Switzerland) inside a box lined with alu-minium foil. For a more homogeneous irradiation, the flasks wererotated every hour. After digestion the samples were cooled toroom temperature and analysed for Hg without any further transferin order to avoid potential losses of UV generated Hg0.
Dissolved organic carbon (DOC) in real water samples andstock DOC solution was measured as non-particular organic carbon(NPOC) with a total organic carbon analyser (High TOC II, Elemen-tar Analysensysteme, Hanau, Germany) using the EN 1484 DEV H3
nto a nano-gold collector. (B) Time line of the procedural steps for flow injectionalve; GLS, gas–liquid separator; AFS, atomic fluorescence spectrometer; � T-joint;

nta 8
ma
met
2
aio2pHilftbsmgtcts
2
oasp(mGwla(
bc5it
a(fv0h(hgscts
C
A. Zierhut et al. / Tala
ethod. This method provides a detection limit of 1.0 mg L−1 andrelative standard deviation (RSD) <10%.
The gold surfaces were examined using a scanning electronicroscope (SEM, JEOL JSM 5900 LV, JEOL Ltd., Tokyo, Japan)
quipped with a RÖNTEC system for energy dispersive X-ray spec-roscopy (EDX).
.2. Flow injection analysis procedure
In the following the general procedure for preconcentrationnd desorption of Hg in the flow injection analysis (FIA) systems described. First, preconcentration of dissolved mercury speciesnto the active gold collector is performed. A sample volume of.5 mL, which is defined by the length of the sample loop, is trans-orted through the FIA system by the carrier solution (0.5%, v/vCl). Then the collector is rinsed with carrier solution and dried
n an argon stream (250 mL min−1). Meanwhile the sample loop isoaded for the next measurement. The adsorbed mercury is releasedrom the collector by heating (700 ◦C) and an argon gas streamransports the Hg vapour to an in-build gold trap for mercury reloady amalgamation. On the way to the in-build gold trap the gastream passes a gas–liquid separator (GLS) and a water-permeableembrane tube for the removal of remaining water. The hot active
old collector is purged and cooled in an Ar gas stream. As a last stephe collector is rinsed with carrier solution to ensure the completeooling of the gold collector to room temperature. The optimisedimeline and flow rates for the FIA procedure coupled to AFS areummarised in Fig. 1B.
.3. Chemicals and cleaning procedures
Ultra pure water (UPW) with a resistivity of 18.2 M� cm wasbtained from a Milli-Q-Gradient system (Millipore, Billerica, USA)nd was used for preparation of all aqueous solutions. Mercurytock standard solutions of 10 mg Hg L−1 as Hg2+ or MeHg+ wererepared weekly from commercially available standard solutionsmercury(II)nitrate, 1000 mg L−1, Merck, Darmstadt, Germany;
ethylmercury chloride, 1000 mg L−1, Alfa Aesar, Karlsruhe,ermany) by dilution in 0.5% (v/v) hydrochloric acid (HCl) andere stored in the dark at 4 ◦C. Solutions with mercury contents
ower than 10 mg Hg L−1 were prepared daily prior to analysis bydequate dilution of 10 mg Hg L−1 stock mercury solution in 0.5%v/v) HCl.
Elemental mercury standard solutions were prepared freshlyefore each experiment by purging Hg0 vapour with a nitrogenarrier stream (50 mL min−1) into 0.5% (v/v) hydrochloric acid formin at room temperature. The resulting stock solutions were
nvestigated for their Hg0 concentration by AFS and standard solu-ions were prepared by diluting with 0.5% (v/v) hydrochloric acid.
All chemicals were purchased in the highest available puritynd/or purified by the following procedures. Hydrochloric acidp.a. max 0.001 mg Hg L−1, Merck, Darmstadt, Germany) – usedor acidification of samples, standard and carrier solution (0.5%,/v HCl) – was efficiently reduced in Hg contamination by adding.1 g of NaBH4 (p.a., Merck, Darmstadt, Germany) to 400 mL ofydrochloric acid and purging the solution for 12 h with nitrogen120 mL min−1). The nitrogen was purified by passing it over aomemade activated carbon/sulphur column (activated carbon:ranular, 2.5 mm, Merck, Darmstadt, Germany; sulphur: elementalulphur for external pharmaceutical application, Merck). The glass
olumn (length 180 mm; I.D. 55 mm) was filled with 500 mL ofhe carbon/sulphur mixture (sulphur content 3%, m/m) and had aintered-glass filter.NaCl (p.a., Merck, Darmstadt, Germany), Na2SO4 (p.a., Merck),aCl2 (technical, VWR BDH Prolabo, Darmstadt, Germany) and
1 (2010) 1529–1535 1531
KCl (p.a., Merck) were heated in a drying oven at 260 ◦C for atleast 24 h and KBr and KBrO3 (both p.a., Merck) are pre-treated at220 ◦C for 48 h to reduce mercury contamination by evaporation.MgCl2·6H2O (p.a., Merck, Darmstadt, Germany), NaHCO3 (p.a.,Merck, Darmstadt, Germany) and H3BO3 (p.a., Merck, Darmstadt,Germany) were used as purchased without further purification.Most salts were required for the preparation of the artificial sea-water according to DIN EN ISO 10253 with a salinity of 33 practicalsalinity units (psu). Model solutions with lower salinity wereprepared by appropriate dilution of this stock standard in UPW.
Dissolved organic carbon (DOC) stock solution was preparedby dissolving 110 mg of the sodium salt of humic acid (Roth,Karlsruhe, Germany) in 100 mL UPW. For this DOC stock solutiona carbon concentration of 342 mg L−1 was determined. DOC modelsolutions were obtained by dilution of adequate amounts of thestock solution in 0.5% HCl (v/v).
For ethylene diamine tetraacetic acid (EDTA) interference testa Titriplex® III-Solution (c(Na2-EDTA·2H2O) = 0.1 mol L−1, Merck,Darmstadt, Germany) was added to mercury standard solutions.
Blank values in model solutions caused by the addition of matrixsubstances were carefully investigated and given results were cor-rected when necessary.
For the preparation of bromine chloride (BrCl) stock solution,4.32 g of KBr were dissolved in 400 mL of hydrochloric acid. In afume hood, 6.08 g of KBrO3 were then added slowly under constantstirring. This process generates free halogens (Cl2, Br2, BrCl), whichare released from the bottle. Therefore, the solution was stirredfor another hour in a loosely capped bottle before the lid was tight-ened. Warning: because of the release of free halogens it is stronglyrecommended to work in an appropriate fume hood. The resultingsaturated BrCl solution was used as a stock solution for the prepa-ration of oxidant solution in the application of EPA method 1631and as reagent for cleaning procedures (dilutions are further givenas % (v/v) of the saturated stock solution). The stock solution wasstored for a maximum of 1 week.
The gold collectors used for the direct mercury preconcen-tration consisted of a rolled up gold gauze (purity 99.99%;gauze size 20 mm × 30 mm; diameter of the wires 0.06 mm;1024 meshes cm−2, Heraeus, Hanau, Germany) placed in a quartzglass tube (length 70 mm; inner diameter 3 mm; wall thickness0.5 mm) that was reduced in diameter at the flow outlet (innerdiameter 0.5 mm). The rolled up gold gauze was fixed in the tubewith quartz wool wads (4–12 �m, VWR, Darmstadt, Germany).Purification of the collectors was achieved by heating to 700 ◦C forat least 60 min. A detailed description of the activation procedurecan be found in [29].
The cleaning of vessels was adapted according to the Hg concen-trations to be handled. For the handling of solutions with mercurycontents higher than 5 �g L−1, glass vessels were used and cleanedwith nitric acid steam in a steaming apparatus (quartz glass steam-ing apparatus, H. Kuerner Analysetechnik, Rosenheim, Germany)for at least 6 h, rinsed three times with ultra pure water and thenkept under a laminar stream of particle-free air. For Hg concen-trations lower than 5 �g L−1, the vessels were treated with a BrClsolution (1%, v/v) for at least 24 h. After removing the BrCl solution,the vessels were rinsed with UPW three times and the whole pro-cedure was then repeated. Polytetrafluoroethylene (PTFE) vesselswere then put in plastic bags and kept in sealed plastic boxes in theclean room until use, whereas glass vessels were heated to 260 ◦Cfor at least 12 h in a drying oven. After cooling to room tempera-ture, the vessels were put in plastic bags and kept in sealed plastic
boxes in the clean room until use. Polyethylene (PET) containers forwater sampling (VWR, Darmstadt, Germany) were used only oncewithout previous cleaning. Mercury blank values of the PET bot-tles were examined for each acquired batch of bottles confirmingabsence of Hg contamination.
1 nta 8
i
2
G(mEwcaWowwdw
BttGW(t2ptsSaU
chu0VGi(tfiw
wa
FR((
532 A. Zierhut et al. / Tala
All pre-cleaned chemicals, collectors and containers were storedn the clean room.
.4. Sampling and storage
Seawater samples from the North Sea were collected by theerman federal office for maritime navigation and hydrography
Bundesamt für Seeschifffahrt und Hydrographie, Hamburg, Ger-any) and the Institute for Chemistry and Biology of the Marine
nvironment–Terramare (ICBM, Wilhelmshaven, Germany). Sea-aters from 4 different sampling sites, namely a station off the
oast (NGW8), two coastal stations (AMRU1, ELBE1) near Amrumnd near Elbe esturary, respectively, and a shore water station nearilhelmshaven (Groedendamm) were investigated. The sampling
f North Sea water was performed with PTFE polymer containersith automated sealing controlled by a shipboard crane. A Black Seaater sample was taken manually at Varna harbour (Bulgaria) in aistance of 10 m to the shore in PET bottles. All seawater samplesere determined without the use of UV digestion.
River, brook and lake water samples were collected manually inavaria in South-Eastern Germany in PET bottles. 2 samples wereaken from the river Isar (near Munich) in 100 m and 5000 m dis-ance to the outlet of the wastewater treatment plant (WWTP)ut Grosslappen. Furthermore, a sample from the effluent of theWTP itself was taken. Brook water samples from the Leuschnitz
near Wallenfels) were taken at 4 different sampling sites, namelyhe spring and in 3 distances from the spring of approximately000 m, 4000 m and 6000 m downstream. The first three sam-ling sites were located in the forest, whereas the last sample wasaken in an inhabited area beside a street. The four lake wateramples were collected in the surrounding area of Munich at thetarnberger See at Possenhofen, at the Ammersee in Herrsching,t the Wesslinger See in Wessling and at the Feringasee nearnterföhring/Munich.
The sampling procedure always included a 3-fold rinsing of theontainer with the water sample before it was filled up until noeadspace remained. Samples were collected in depths of 20–30 cmnderneath the water surface. All samples were filtered through.45 �m filters (either polyethersulfone or polycarbonate filters,WR, Darmstadt, Germany; or cellulose membrane filter Sartorius,oettingen, Germany) and acidified (by addition of HCl (0.5%, v/v)
mmediately after collection. The filters were pre-cleaned with 0.5%v/v) HCl solution and mercury blank values were checked. Each fil-er was conditioned with 20 mL of the sample solution before the
ltered water was collected in a bottle for storage and analysis. Allater samples were stored in the dark at 4 ◦C until analysis.The certified reference material BCR 579 (mercury in coastal seaater) was purchased from the Institute for Reference Materials
nd Measurements of the European Commission (IRMM, Geel, Bel-
ig. 2. (A) Mercury recovery from different model solutions containing (�) Hg0; (�) H2 = 0.9985, n = 27; error bars represent ± one standard deviation, n = 3); (B) Investigation oas Hg2+) and (-) blank solution (0.5% (v/v) HCl); (C) enhancement of sensitivity with incr[Hg] = 1–10 ng L−1) obtained by the proposed method compared to cold vapour AFS mea
1 (2010) 1529–1535
gium) and handled according to the recommendations given in thecertificate.
3. Results and discussion
3.1. Optimisation of the flow injection analysis procedure
The most crucial points that had to be assured within the FIAprocedure are:
- Reproducible and equivalent adsorption of all dissolved mercuryspecies,
- Quantitative desorption of Hg from the gold collector,- Complete removal of water for interference-free mercury AFS
detection,- Minimization of memory effects within the FIA system.
For the purpose of checking reproducible adsorption rate ofmercury species onto the active gold collector model solutionsof Hg0, Hg2+, MeHg+ and Me2Hg were passed over the collectorand mercury was measured in the flowing through. Thereby, anadsorption rate of 83 ± 4% (for all Hg species) up to a concentra-tion of at least 100 ng Hg L−1 was obtained at a sample flow rate of6.3 mL min−1. Higher flow rates lead to lower adsorption rates dueto reduced residence time. However, more important in this regardis the composition of the sample solutions which can strongly affectthe adsorption rate. Therefore, a systematic study on the impact ofdifferent matrix constituents is given in the next section.
Different heating temperatures of the gold collector wereapplied to assure quantitative release of Hg from the collec-tor. A temperature of 700 ◦C for 40 s ensures complete thermaldesorption.
Interference-free mercury detection by AFS requires the com-plete removal of water and water vapour from the collector andthe tubing to the AFS cell, because water vapour in the fluores-cence cell causes signal quenching and condensed water dropsresult in irreproducible values. In cold vapour generation techniquea gas–liquid separator (GLS) is usually sufficient for this purpose.In the proposed method a more sophisticated procedure is neces-sary because, remaining water drops in the collector are evaporatedduring the heating step. Hence, not only water droplets have tobe separated from the gas stream, but also water vapour has to beremoved. For this purpose, beside a GLS for separation of condensedwater droplets a water-permeable membrane tube that connects
the GLS with an in-build gold trap assures removal of water vapour.With these optimal adsorption/desorption conditions severalrecovery experiments with different Hg species in a concentrationrange from 0.4 to 5.5 ng L−1 were performed. In Fig. 2A the results ofthese measurements are presented as a recovery function reveal-
g2+; and (-) MeHg+ (recovery function: y = 1.007x + 0.079; regression coefficientf carry over effects: alternating measurement of (�) 10 ng Hg L−1 standard solutioneasing sample volumes given as a factor calculated from the slope of a calibration
surement.

A. Zierhut et al. / Talanta 81 (2010) 1529–1535 1533
F n cona nd wa5 (�) [
inct
smtummftctm
3c
aphsc
c01wcmriHar
TR
ig. 3. Percentage of Hg recovery dependent on (A) DOC content in a model solutiond (�) after 7 h of UV digestion, respectively, (B) digestion time in a natural moorlang Hg L−1 as a mixture of Hg2+ and MeHg+ (1:1) and with (�) [DOC] = 0.5 mg L−1 or
ng excellent accuracy and precision (y = 1.01x + 0.08; R2 = 0.9985;= 27). Furthermore, this experiment proves that accurate and pre-ise Hg detection with the proposed method is independent fromhe Hg species.
Moreover, the used tubing material and optimised mea-urement conditions allow mercury determination without anyemory effects as shown in Fig. 2B. Finally, the enrichment factor of
he optimised procedure was determined at different sample vol-mes by comparison of the slopes of a calibration function of thisethod and CV-AFS measurement [11]. As expected, the enrich-ent factor increases linear with the sample volume (Fig. 2C) and
or a sample volume of only 2.5 mL (which was used in all fur-her experiments) the sensitivity is enhanced by a factor of 10 inomparison to CV-AFS measurement. Higher sample volumes offerhe possibility to further increase the sensitivity of the proposed
ethod for the detection of extremely low mercury levels.
.2. Investigation of possible interferences from matrixonstituents
Several natural and anthropogenic water constituents mayffect mercury determination with the proposed method. Inarticular substances that form complexes with Hg species (andinder thereby its adsorption onto the gold collector) and sub-tances that may cause fouling of the active gold surface have to beonsidered.
Ionic mercury species have high affinity to dissolved organicarbon (DOC). In marine waters DOC content is usually less than.5 mg L−1, whereas the DOC content in fresh waters can be0 mg L−1 or even more (e.g. in marsh waters). Hence in freshaters 94–99% of inorganic mercury and 72–97% of methyl mer-
ury are complexed by DOC [31]. In seawater the proportion ofercury bound to humic matter is very low due to high chlo-
ide ion concentration (∼19 g L−1), which stabilises Hg species byonic interactions. In ocean waters the dominant complexes aregCl42−, HgCl3− and CH3HgCl [32]. Besides these natural ligands,nthropogenic complexing agents can occur in contaminated natu-al waters. Ethylene diamine tetraacetic acid (EDTA) is nowadays a
able 1esults of mercury recovery experiments in different water samples spiked with mercury
Samples Origin [Hg] spike
Artificial seawater DIN EN ISO 10253 0.0, 0.5, 1.Natural seawater North Sea, ELBE1 0.0, 0.5, 1.River water Isar, Garching, Germany 0.0, 0.5, 1.Moorland water Deininger Moor, Deining, Germany 5.0
a DOC values measured by EN 1484 DEV H3 method.b After 7 h UV digestion.c After 14 h UV digestion.
taining 5 ng Hg L−1 as a mixture of Hg2+ and MeHg+ (1:1) (�) without UV digestionter sample with [DOC] = 14.5 mg L−1 and (C) salinity in a model solution containing
DOC] = 5 mg L−1, respectively.
commonly used complexing agent in many sectors of industry andcan be found in a concentration range from 1 to 100 �g L−1 in con-taminated surface waters [33]. Therefore, in a series of experimentsthe influence of DOC, chloride and EDTA content of the sampleon mercury recovery with the proposed method was investigated.Thereby, model solutions of the different potential interferingagents were spiked with 5 ng Hg L−1 as a mixture of MeHg+ andHg2+ (1:1).
Fig. 3A shows the percentage of mercury recovery with increas-ing DOC revealing that even low DOC contents affect quantitativerecovery. At a DOC concentration of 15 mg L−1 Hg recovery of only41% was achieved. Hence, the strong bonding between DOC andmercury inhibits the preconcentration of mercury on the gold col-lector. Therefore, the Hg–DOC complexes have to be cracked inorder to achieve quantitative Hg adsorption. In a first attempt diges-tion of the model sample solution by UV radiation was performedfor 7 h. The resulting recoveries are also given in Fig. 3A. Withthis pre-treatment procedure the maximum tolerable DOC con-tent is 5 mg L−1. Water samples with higher DOC require longerdigestion times. Fig. 3B shows the increase of the mercury recov-ery rate in a natural water sample from the Deininger marsh witha DOC content of 14.5 mg L−1 with increasing UV digestion dura-tion. Complete mercury recovery was obtained after 14 h for thissample.
Another approach to enhance recovery in DOC containing sam-ples is to increase the ionic strength of the sample solution in orderto shift the chemical equilibrium of bound mercury [34,35]. Fig. 3Cshows the obtained Hg recoveries from model solutions containing0.5 mg L−1 or 5 mg L−1 DOC, respectively dependent on the salinityof the solution. Sample salinity of at least 20 psu ensures quantita-tive Hg recovery without the need for UV radiation. Furthermore,the results indicate that accurate analysis of seawater samplesshould be possible. As expected, no interferences from chloride (up
−1 −1
to 21 g L ) and sulphate (up to 3 g L ) were observed in recoveryexperiments.The investigation of EDTA containing model solutions up to aconcentration of 200 �g L−1 revealed no detectable influence onHg recovery.
as a mixture of Hg2+ and MeHg+ (1:1).
s (ng L−1) Recovery rate (%) [DOC]a (mg L−1)
0, 1.5, 2.0, 2.5, 3.0 102.4 ± 6.4 <10, 1.5, 2.0, 2.5, 3.0 97.0 ± 6.8 2.30, 1.5, 2.0 96.0 ± 7.8b 3.9
97.6 ± 2.7c 14.5
1534 A. Zierhut et al. / Talanta 81 (2010) 1529–1535
Table 2Analytical figures of merit.
Linear working range 0.08–100 ng Hg L−1
Typical calibration range 0.1–5 ng Hg L−1
Regression coefficient R2 (n = 12) 0.9997Detection limit as derived from calibration
function [41]80 pg Hg L−1
Blank value as fluorescence intensity 0.40 × 10⁻³ ± 0.02 × 10⁻³
Relative standard deviationWith [Hg] = 5 ng L−1 and n = 10 1.1%With [Hg] = 1 ng L−1 and n = 7 2.1%With [Hg] = 0.2 ng L−1 and n = 8 3.3%
Sample volume 2.5 mL
ftCaoHcTwaasr
ow
3
ewTia
uw
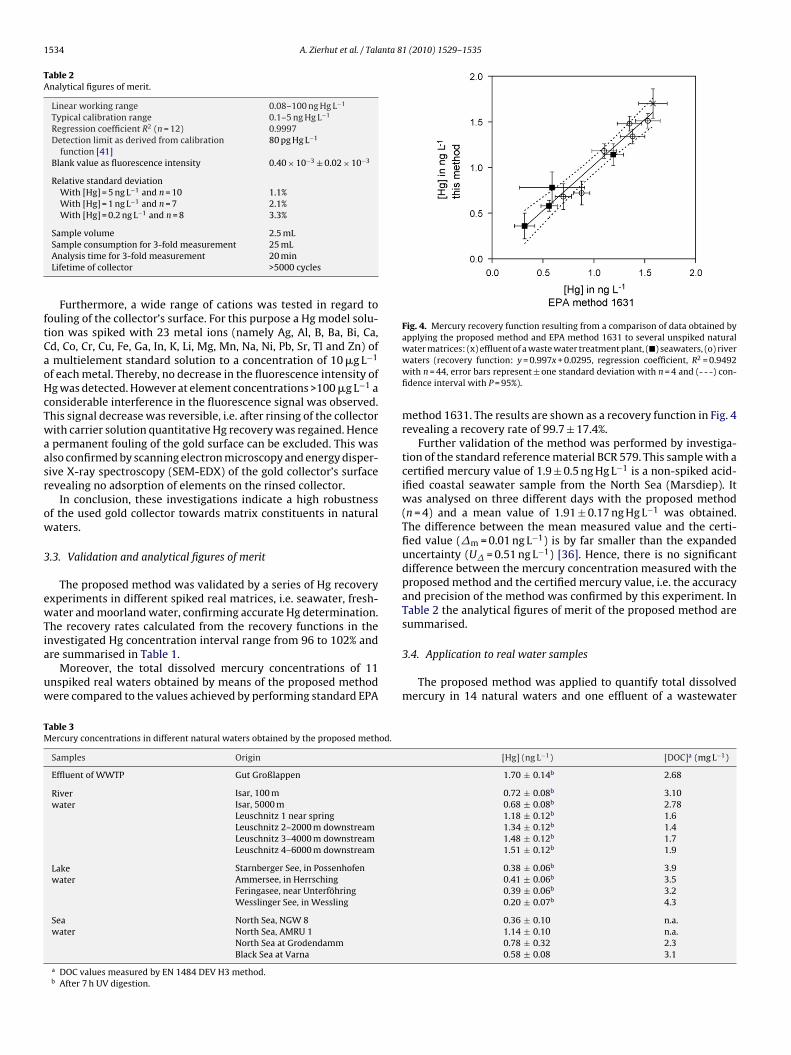
Fig. 4. Mercury recovery function resulting from a comparison of data obtained byapplying the proposed method and EPA method 1631 to several unspiked natural
TM
Sample consumption for 3-fold measurement 25 mLAnalysis time for 3-fold measurement 20 minLifetime of collector >5000 cycles
Furthermore, a wide range of cations was tested in regard toouling of the collector’s surface. For this purpose a Hg model solu-ion was spiked with 23 metal ions (namely Ag, Al, B, Ba, Bi, Ca,d, Co, Cr, Cu, Fe, Ga, In, K, Li, Mg, Mn, Na, Ni, Pb, Sr, Tl and Zn) ofmultielement standard solution to a concentration of 10 �g L−1
f each metal. Thereby, no decrease in the fluorescence intensity ofg was detected. However at element concentrations >100 �g L−1 aonsiderable interference in the fluorescence signal was observed.his signal decrease was reversible, i.e. after rinsing of the collectorith carrier solution quantitative Hg recovery was regained. Hencepermanent fouling of the gold surface can be excluded. This waslso confirmed by scanning electron microscopy and energy disper-ive X-ray spectroscopy (SEM-EDX) of the gold collector’s surfaceevealing no adsorption of elements on the rinsed collector.
In conclusion, these investigations indicate a high robustnessf the used gold collector towards matrix constituents in naturalaters.
.3. Validation and analytical figures of merit
The proposed method was validated by a series of Hg recoveryxperiments in different spiked real matrices, i.e. seawater, fresh-ater and moorland water, confirming accurate Hg determination.
he recovery rates calculated from the recovery functions in the
nvestigated Hg concentration interval range from 96 to 102% andre summarised in Table 1.Moreover, the total dissolved mercury concentrations of 11nspiked real waters obtained by means of the proposed methodere compared to the values achieved by performing standard EPA
able 3ercury concentrations in different natural waters obtained by the proposed method.
Samples Origin
Effluent of WWTP Gut Großlappen
Riverwater
Isar, 100 mIsar, 5000 mLeuschnitz 1 near springLeuschnitz 2–2000 m downstreamLeuschnitz 3–4000 m downstreamLeuschnitz 4–6000 m downstream
Lakewater
Starnberger See, in PossenhofenAmmersee, in HerrschingFeringasee, near UnterföhringWesslinger See, in Wessling
Seawater
North Sea, NGW 8North Sea, AMRU 1North Sea at GrodendammBlack Sea at Varna
a DOC values measured by EN 1484 DEV H3 method.b After 7 h UV digestion.
water matrices: (x) effluent of a waste water treatment plant, (�) seawaters, (o) riverwaters (recovery function: y = 0.997x + 0.0295, regression coefficient, R2 = 0.9492with n = 44, error bars represent ± one standard deviation with n = 4 and (- - -) con-fidence interval with P = 95%).
method 1631. The results are shown as a recovery function in Fig. 4revealing a recovery rate of 99.7 ± 17.4%.
Further validation of the method was performed by investiga-tion of the standard reference material BCR 579. This sample with acertified mercury value of 1.9 ± 0.5 ng Hg L−1 is a non-spiked acid-ified coastal seawater sample from the North Sea (Marsdiep). Itwas analysed on three different days with the proposed method(n = 4) and a mean value of 1.91 ± 0.17 ng Hg L−1 was obtained.The difference between the mean measured value and the certi-fied value (�m = 0.01 ng L−1) is by far smaller than the expandeduncertainty (U� = 0.51 ng L−1) [36]. Hence, there is no significantdifference between the mercury concentration measured with theproposed method and the certified mercury value, i.e. the accuracyand precision of the method was confirmed by this experiment. InTable 2 the analytical figures of merit of the proposed method aresummarised.
3.4. Application to real water samples
The proposed method was applied to quantify total dissolvedmercury in 14 natural waters and one effluent of a wastewater
[Hg] (ng L−1) [DOC]a (mg L−1)
1.70 ± 0.14b 2.68
0.72 ± 0.08b 3.100.68 ± 0.08b 2.781.18 ± 0.12b 1.61.34 ± 0.12b 1.41.48 ± 0.12b 1.71.51 ± 0.12b 1.9
0.38 ± 0.06b 3.90.41 ± 0.06b 3.50.39 ± 0.06b 3.20.20 ± 0.07b 4.3
0.36 ± 0.10 n.a.1.14 ± 0.10 n.a.0.78 ± 0.32 2.30.58 ± 0.08 3.1
nta 8
ta
e(r[o(LdatLrtHis
vfm
4
sista0ylqatc5Sas
A
(eDAaa(oGSv
[
[[[
[
[
[[[[[[[[[
[
[
[
[[
[
[
[
[
[
[[
[[
A. Zierhut et al. / Tala
reatment plant (WWTP). Table 3 summarises the found mercurynd DOC concentrations.
The highest mercury concentration found was in theffluent of the WWTP “Grosslappen” in Munich, Germany1.70 ± 0.14 ng Hg L−1). However, this value is lower than otherseported from outlets of WWTPs that range from 3.5 to 39 ng Hg L−1
28,37,38]. The samples taken 100 m and 5000 m downstreamf the inlet of the WWTP in the river Isar are significantly lower∼0.7 ng Hg L−1). The series of samples collected in the rivereuschnitz show increasing Hg concentrations with increasingistance from the spring. Natural leaching from ore rich soilnd sediment in this former mining area most probably causeshis increase. The obtained mercury levels of the rivers Isar andeuschnitz are in an expected concentration range for Bavarianivers (usually <5 to maximum 41 ng L−1) [39]. The same applies tohe dissolved mercury concentrations found in the lakes [12]. Lowg concentrations were found at the off shore sampling position
n the North Sea (0.36 ± 0.10 ng Hg L−1). The 3 coastal seawatershowed mercury concentrations in an expected range [40].
The very good agreement of the obtained Hg values with thealues determined by EPA method 1631 (see Fig. 4) confirms theeasibility of Hg analysis in natural waters with the proposed
ethod.
. Conclusions
The applicability of direct preconcentration of dissolved Hgpecies onto active gold collectors for reagent-free total Hg analysisn natural waters has been clearly demonstrated in this work. Highensitivity with a detection limit of 0.08 ng Hg L−1 (derived fromhe calibration function [41]) was achieved with a sample volumes low as 2.5 mL, corresponding to an absolute detection limit of.2 pg Hg. However, the large linear working range allows for anal-sis not only of pristine waters. The low blank value and detectionimit as well as the high precision and reproducibility are a conse-uence of the reagent-free procedure where only hydrochloric acids carrier solution and for sample acidification is used. Furthermore,he applied gold collector shows a high tolerance towards matrixonstituents as well as a high robustness with a lifetime of at least000 measuring cycles without any measureable loss of activity.aline waters can be analysed with the proposed method withoutny pre-treatment, whereas DOC containing fresh water sampleshould be digested by UV radiation prior to analysis.
cknowledgements
The authors are grateful to the German Research FoundationDeutsche Forschungsgemeinschaft, DFG) and the German Fed-ral Environmental Foundation (Deutsche Bundesumweltstiftung,BU) for financial support. The authors also thank Analytik JenaG (Jena, Germany) for the provision of apparatus and equipmentpparatus, equipment, and technical support. Furthermore, theuthors thank the Bundesamt für Seeschifffahrt und Hydrographie
BSH, Hamburg, Germany) and the Institute for Chemistry and Biol-gy of the Marine Environment–Terramare (ICBM, Wilhelmshaven,ermany) for seawater sampling. Moreover, the authors thanktephanie West (Institute of Water Quality Control, Technische Uni-ersitaet Muenchen, Garching, Germany) for performing the DOC[
[[
1 (2010) 1529–1535 1535
measurements and Sima Avadieva and Ilina Mintova for their assis-tance with field sampling.
References
[1] F.M.M. Morel, A.M.L. Kraepiel, M. Amyot, Annu. Rev. Ecol. Syst. 29 (1998)543–566.
[2] N.E. Selin, Annu. Rev. Environ. Resour. 34 (2009) 1–30.[3] R.P. Mason, G.-R. Sheu, Glob. Biogeochem. Cycles 16 (2002) 1093.[4] R.P. Mason, J.R. Reinfelder, F.M.M. Morel, Water Air Soil Pollut. 80 (1995)
915–921.[5] D.J. Spry, J.G. Wiener, Environ. Pollut. 71 (1991) 243–304.[6] K.A. Kidd, R.H. Hesslein, R.J.P. Fudge, K.A. Hallard, Water Air Soil Pollut. 80
(1995) 1011–1015.[7] M. Horvat, L. Liang, N.S. Bloom, Anal. Chim. Acta 282 (1993) 148–153.[8] L. Trasande, P.J. Landrigan, C. Schechter, Environ. Health Perspect. 113 (2005)
590–596.[9] W.L. Clevenger, B.W. Smith, J.D. Winefordner, Crit. Rev. Anal. Chem. 27 (1997)
1–26.10] K. Leopold, M. Foulkes, P. Worsfold, Anal. Chim. Acta (2010),
doi:10.1016/j.aca.2010.01.048.11] T Labatzke, G. Schlemmer, Anal. Bioanal. Chem. 378 (2004) 1075–1082.12] K. Leopold, L. Harwardt, M. Schuster, G. Schlemmer, Talanta 76 (2008) 382–388.13] M. Monperrus, E. Tessier, S. Veschambre, D. Amouroux, O. Donard, Anal. Bioanal.
Chem. 381 (2005) 854–862.14] F.A.M. Planchon, P. Gabrielli, P.A. Gauchard, A. Dommergue, C. Barbante, W.R.L.
Cairns, G. Cozzi, S.A. Nagorski, C.P. Ferrari, C.F. Boutron, G. Capodaglio, P. Cescon,A. Vargac, E.W. Wolff, J. Anal. At. Spectrom. 19 (2004) 823–830.
15] R. Ferrara, A. Seritti, C. Barghigiani, A. Petrosino, Anal. Chim. Acta 117 (1980)391–395.
16] L. Liang, N. Bloom, J. Anal. At. Spectrom. 8 (1993) 591–594.17] Y. Cai, J.M. Bayona, J. Chromatogr. A 696 (1995) 113–122.18] A. Krata, K. Pyrzynska, E. Bulska, Anal. Bioanal. Chem. 277 (2003) 735–739.19] S. Mothes, R. Wennrich, J. High Resolut. Chromatogr. 22 (1999) 181–182.20] S. Díez, J.M. Bayona, Talanta 77 (2008) 21–27.21] K. Leopold, M. Foulkes, P.J. Worsfold, Trends Anal. Chem. 28 (2009) 426–435.22] F.R.P. Rocha, J.A. Nóbrega, O. Fatibello-Filho, Green Chem. 3 (2001) 216–220.23] O. Wurl, O. Elsholz, R. Ebinghaus, Talanta 52 (2000) 51–57.24] C. Fernandez, A.C.L. Conceicão, R. Rial-Otero, C. Vaz, J.L. Capelo, Anal. Chem. 78
(2006) 2494–2499.25] Y. Li, C. Zheng, Q. Ma, L. Wu, C. Hu, X. Hou, J. Anal. At. Spectrom. 21 (2006)
82–85.26] M.J. Bloxham, S.J. Hill, P.J. Worsfold, J. Anal. At. Spectrom. 11 (1996) 511–
514.27] O. Elsholz, C. Frank, B. Matyschok, F. Steiner, O. Wurl, B. Stachel, H. Reincke,
M. Schulze, R. Ebinghaus, M. Hempel, Fresen. J. Anal. Chem. 366 (2000) 196–199.
28] K. Leopold, M. Foulkes, P.J. Worsfold, Anal. Chem. 81 (2009) 3421–3428.29] A. Zierhut, K. Leopold, L. Harwardt, P.J. Worsfold, M. Schuster, J. Anal. At. Spec-
trom. 24 (2009) 767–774.30] K.J.M. Kramer, Ph. Quevauviller, W.S. Dorten, E.M. van der Vlies, H.P.M. de Haan,
Analyst 123 (1998) 959–963.31] R.J.M. Hudson, S.A. Gherini, C.J. Watras, D.B. Porcella, in: C.J. Watras, J.W. Huck-
abee (Eds.), Mercury Pollution—Integration and Synthesis, Lewis Publishers,Boca Raton, FL, 1994, pp. 473–523.
32] R.P. Mason, G.A. Gill, in: M.B. Parsons, J.B. Percival (Eds.), Mercury Sources,Measurements, Cycles, and Effects, Short Course Series, Vol. 34, MineralogicalAssociation of Canada, Halifax, Nova Scotia, 2005, pp. 179–216.
33] European Union risk assessment report on tetrasodium ethylenediaminetetraacetate. (Na. 4. EDTA), 1st priority list, Vol. 51, 2004 (EUR 21315 EN).
34] M. Leermakers, C. Meuleman, W. Baeyens, Water Air Soil Pollut. 80 (1995)641–652.
35] X. Lu, R. Jaffe, Water Res. 35 (2001) 1793–1803.36] T.P.J. Linsinger, Comparison of Measurement Result with the Certified Value,
Application Note 1 EC-JRC, IRMM, 2005, http://www.erm-crm.37] S.J. Balogh, Y.H. Nollet, Sci. Total Environ. 389 (2008) 125–131.38] X.J. Kong, D. Li, L.Q. Cao, X.M. Zhang, Y. Zhao, Y. Lv, J. Zhang, Chemosphere 72
(2008) 59–66.
39] P. Krause, in: Bavarian Ministry for the Environment (Ed.), Ergeb-nisse der Gewässerüberwachung zu den Prioritären Stoffen, 2008,http://www.wasserrahmenrichtlinie.bayern.de/bewirtschaftungsplanung/hintergrunddokumente/daten/doc/fl2 prioritaere stoffe.pdf.
40] D. Schmidt, Water Air Soil Pollut. 62 (1992) 43–55.41] A. Hubaux, G. Vos, Anal. Chem. 42 (1970) 849.