Embed Size (px)
Citation preview

Analysis of Tomographic Pumping Tests with Regularized Inversion
Geoffrey C. BohlingKansas Geological SurveySIAM Geosciences ConferenceSanta Fe, NM, 22 March 2007
Santa Fe, 22 March 2007
Bohling 2
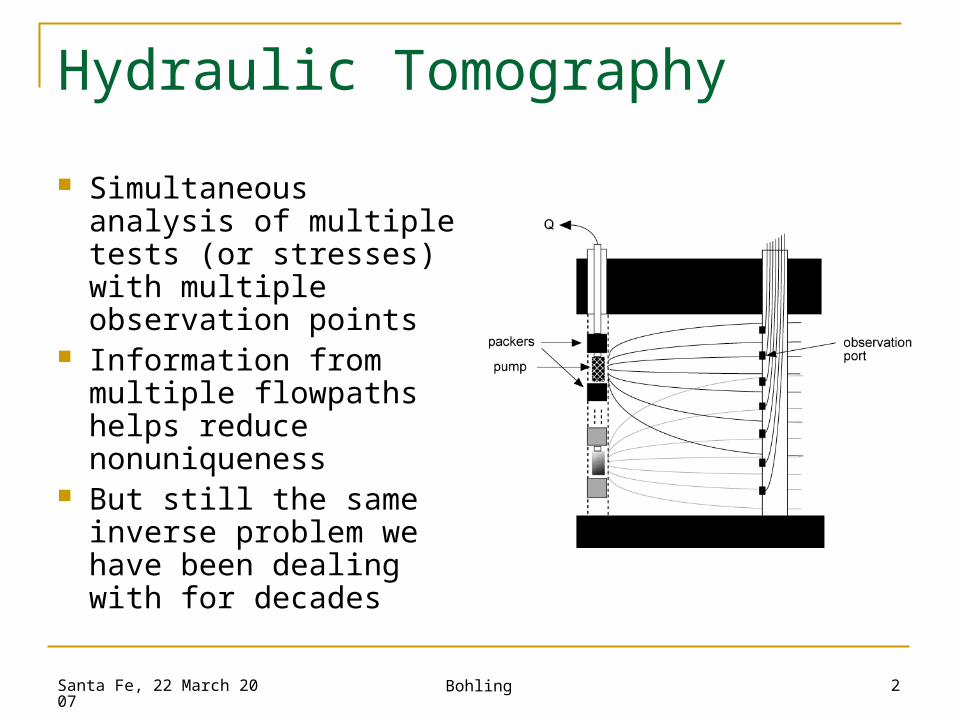
Hydraulic Tomography
Simultaneous analysis of multiple tests (or stresses) with multiple observation points
Information from multiple flowpaths helps reduce nonuniqueness
But still the same inverse problem we have been dealing with for decades

Santa Fe, 22 March 2007
Bohling 3
Forward and Inverse Modeling Forward Problem: d = G(m)
Approximate: No model represents true mapping from parameter space (m) to data space (d)
Nonunique: BIG m small d Inverse Problem: m = G-1(d)
Effective: Estimated parameters are always “effective” (contingent on approximate model)
Unstable: small d BIG m

Santa Fe, 22 March 2007
Bohling 4
Regularizing the Inverse Problem Groundwater flow models potentially have a
very large number of parameters Uncontrolled inversion with many parameters
can match almost anything, most likely with wildly varying parameter estimates
Regularization restricts variation of parameters to try to keep them plausible
Regularization by zonation is traditional approach in groundwater modeling
Santa Fe, 22 March 2007
Bohling 5
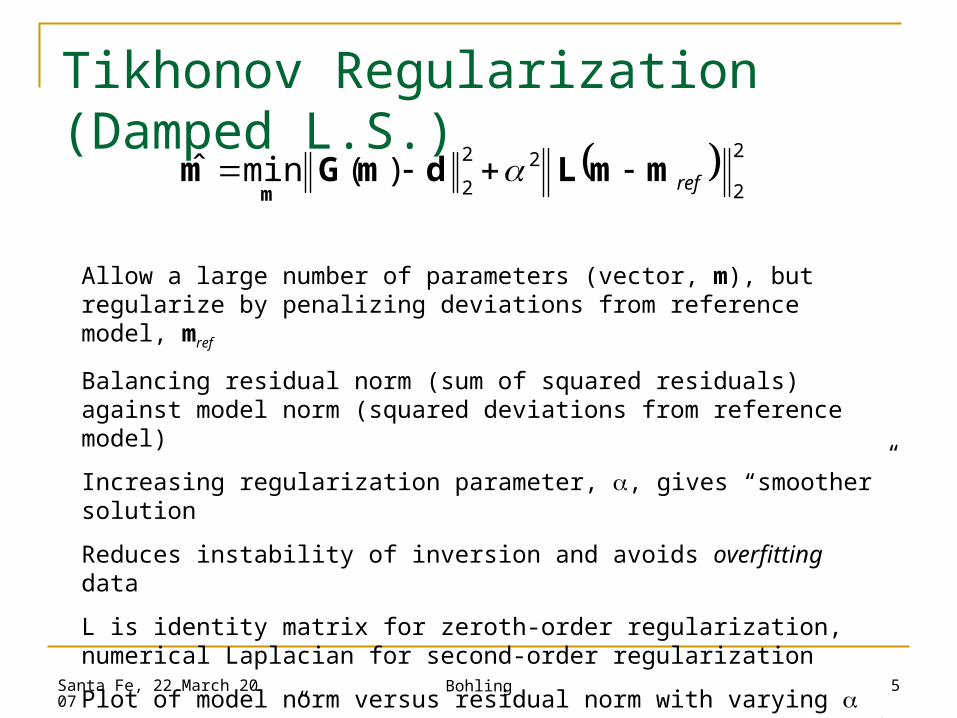
Tikhonov Regularization (Damped L.S.) 2
2
22
2)(minˆ refmmLdmGm
m
Allow a large number of parameters (vector, m), but regularize by penalizing deviations from reference model, mref
Balancing residual norm (sum of squared residuals) against model norm (squared deviations from reference model)
Increasing regularization parameter, , gives “smoother” solution
Reduces instability of inversion and avoids overfitting data
L is identity matrix for zeroth-order regularization, numerical Laplacian for second-order regularization
Plot of model norm versus residual norm with varying is an “L-curve” – used in selecting appropriate level of regularization

Santa Fe, 22 March 2007
Bohling 6
Field Site (GEMS)
Highly permeable alluvial aquifer (K ~ 1.5x10⁻³ m/s)
Many experiments over past 19 years
Induced gradient tracer test (GEMSTRAC1) in 1994
Hydraulic tomography experiments in 2002
Various direct push tests over past 7 years

Santa Fe, 22 March 2007
Bohling 7
Field Site Stratigraphy
From Butler, 2005, in Hydrogeophysics (Rubin and Hubbard, eds.), 23-58
Santa Fe, 22 March 2007
Bohling 8
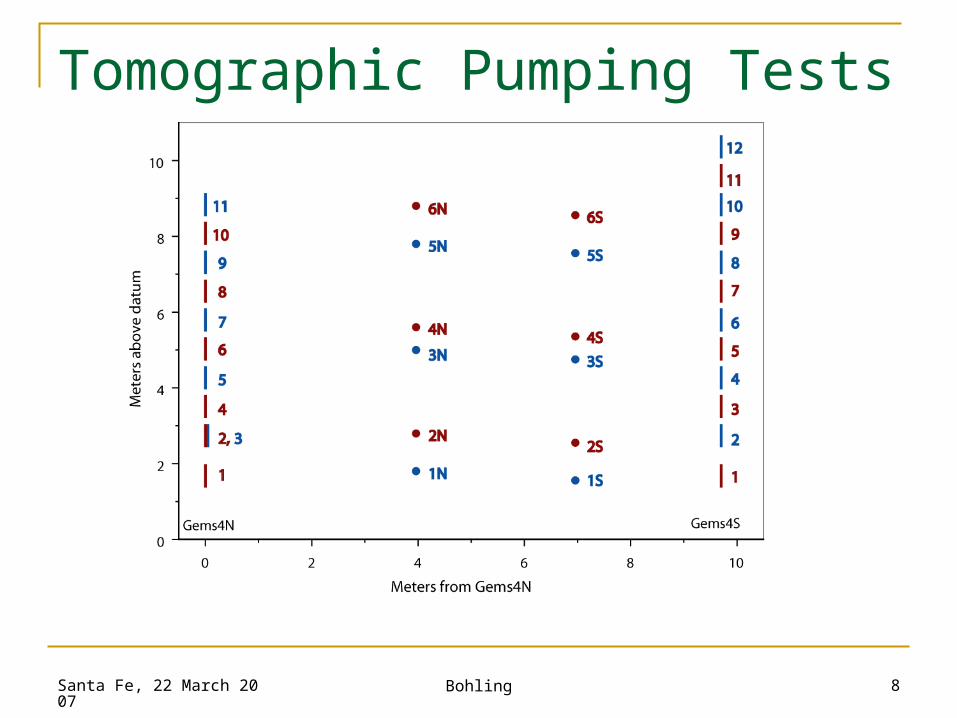
Tomographic Pumping Tests
Santa Fe, 22 March 2007
Bohling 9
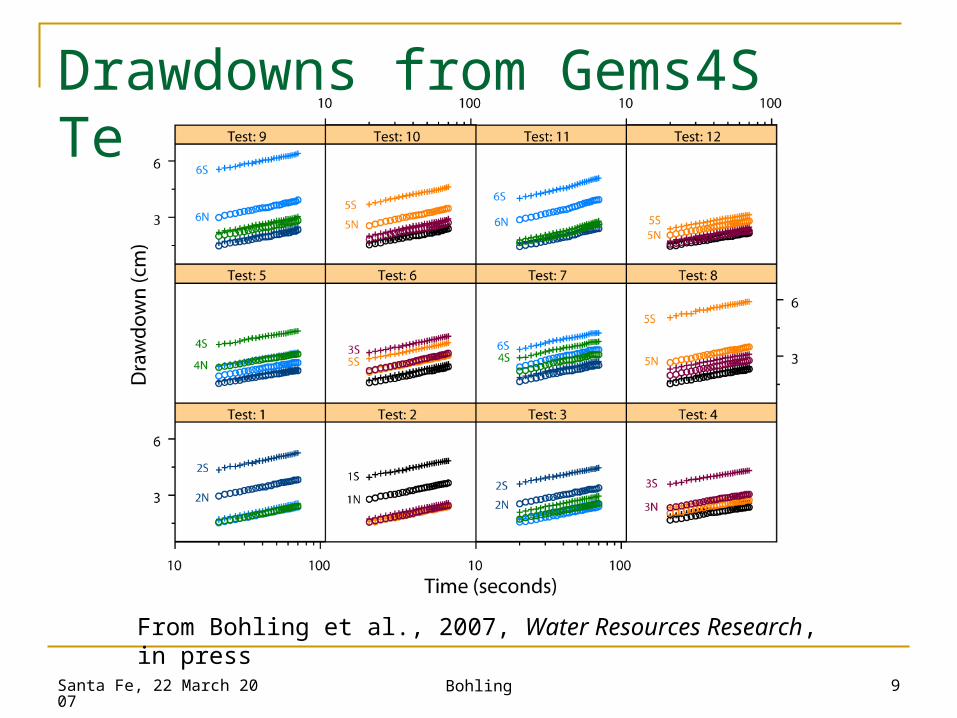
Drawdowns from Gems4S Tests
From Bohling et al., 2007, Water Resources Research, in press

Santa Fe, 22 March 2007
Bohling 10
Analysis Approach
Forward simulation with 2D radial-vertical flow model in Matlab Vertical “wedge” emanating from pumping well Common 10 x 14 Cartesian grid of lnK values mapped into
radial grid for each pumping well Inverse analysis with Matlab nonlinear least squares
function, lsqnonlin Fitting parameters are Cartesian grid lnK values Regularization relative to uniform lnK (K = 1.5 x 10⁻³ m/s)
model for varying values of Steady-shape analysis

Santa Fe, 22 March 2007
Bohling 11
Parallel Synthetic Experiments For guidance, tomographic pumping tests simulated
in Modflow using synthetic aquifer Vertical lnK variogram for synthetic aquifer derived
from GEMSTRAC1 lnK profile Vertical profile includes fining upward trend and
periodic (cyclic) component Large horizontal range (61 m) yields “imperfectly
layered” aquifer K values range from 4.9 x 10⁻⁵ m/s (silty to clean
sand) to 1.7 x 10⁻² m/s (clean sand to gravel) with a geometric mean of 1.2 x 10⁻³ m/s

Santa Fe, 22 March 2007
Bohling 12
Synthetic Aquifer (81 x 49 x 70)

Santa Fe, 22 March 2007
Bohling 13
Four Grids

Santa Fe, 22 March 2007
Bohling 14
L-curves, Real and Synthetic Tests

Santa Fe, 22 March 2007
Bohling 15
Synthetic Results

Santa Fe, 22 March 2007
Bohling 16
Model Norm Relative to “Truth”
Santa Fe, 22 March 2007
Bohling 17
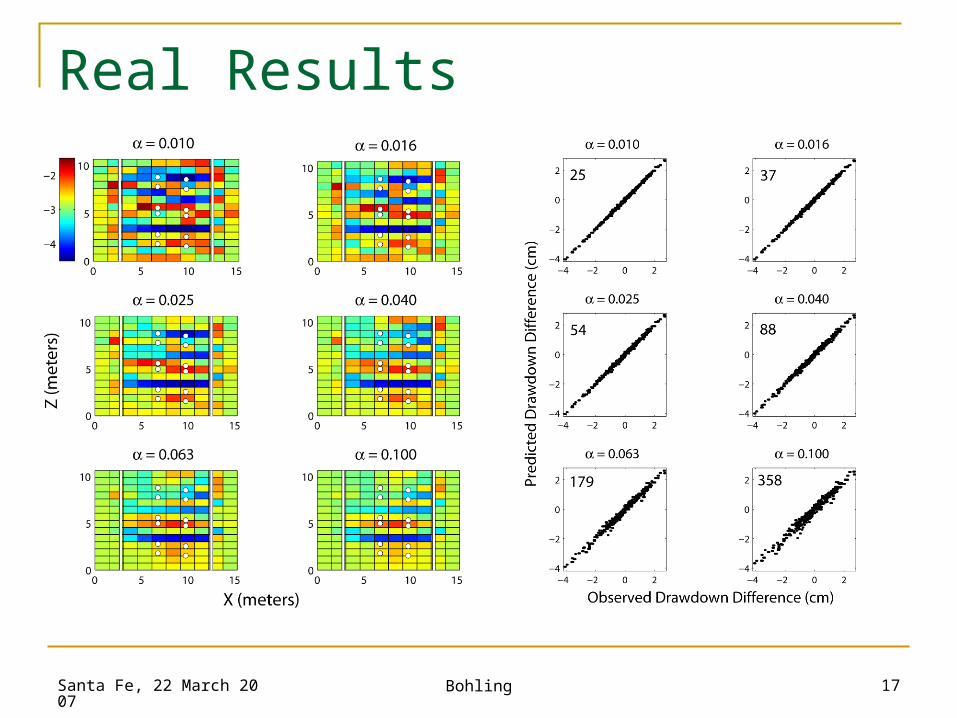
Real Results

Santa Fe, 22 March 2007
Bohling 18
Transient Fit, Gems4SUsing K field for = 0.025 with Ss = 3x10⁻⁵ m-1

Santa Fe, 22 March 2007
Bohling 19
Transient Fit, Gems4NUsing K field for = 0.025 with Ss = 3x10⁻⁵ m-1
Santa Fe, 22 March 2007
Bohling 20
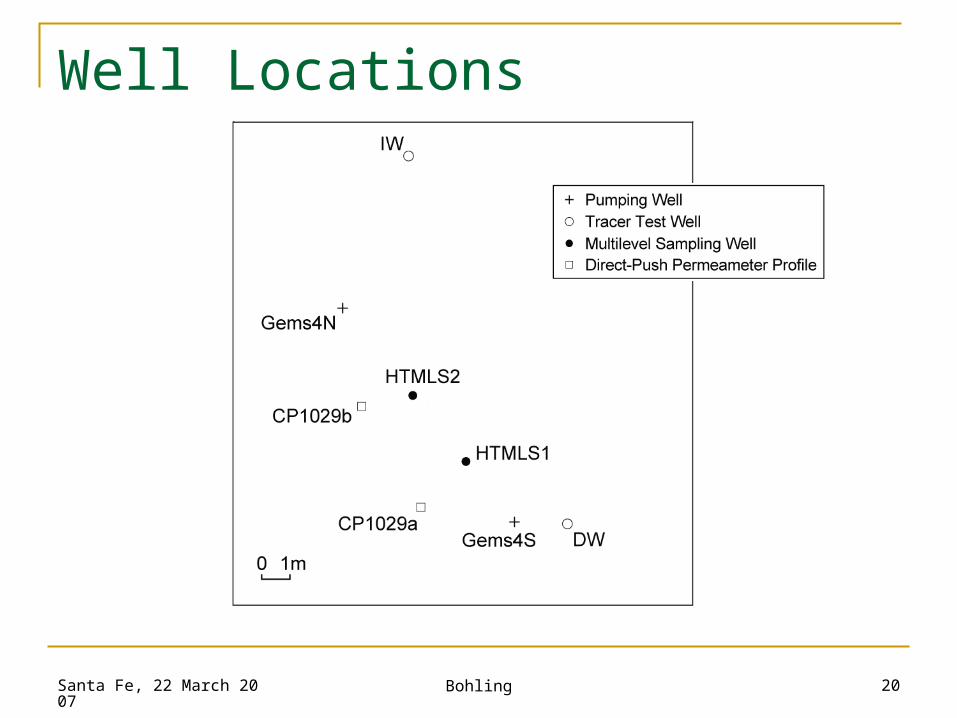
Well Locations

Santa Fe, 22 March 2007
Bohling 21
Comparison to Other Estimates

Santa Fe, 22 March 2007
Bohling 22
Conclusions
Synthetic results show that steady-shape radial analysis of tests captures salient features of K field, but also indicate “effective” nature of fits
For real tests, pattern of estimated K probably reasonable, although range of estimated values may be too wide
A lot of effort to characterize a 10 m x 10 m section of aquifer; perhaps not feasible for routine aquifer characterization studies
Should be valuable for detailed characterization at research sites

Santa Fe, 22 March 2007
Bohling 23
Acknowledgment s
Field effort led by Jim Butler with support from John Healey, Greg Davis, and Sam Cain
Support from NSF grant 9903103 and KGS Applied Geohydrology Summer Research Assistantship Program

Santa Fe, 22 March 2007
Bohling 24
Regularizing w.r.t. Stochastic PriorsSecond-order regularization – asking for smooth variations from prior model
Fairly strong regularization here (α = 0.1)
Best 5 fits of 50