Embed Size (px)
Citation preview
Analysis of Time of Day Models from Various Urban Areas
William G. Allen, Jr.Transportation Planning ConsultantWindsor, SC
TRB Transportation Planning Applications ConferenceDaytona Beach, FL9 May 2007
Overview
Comparisons among cities: can you borrow your neighbor’s TOD model?
Peak spreading: a myth? NHB sub-purposes: worthwhile? Validation: it’s a good thing
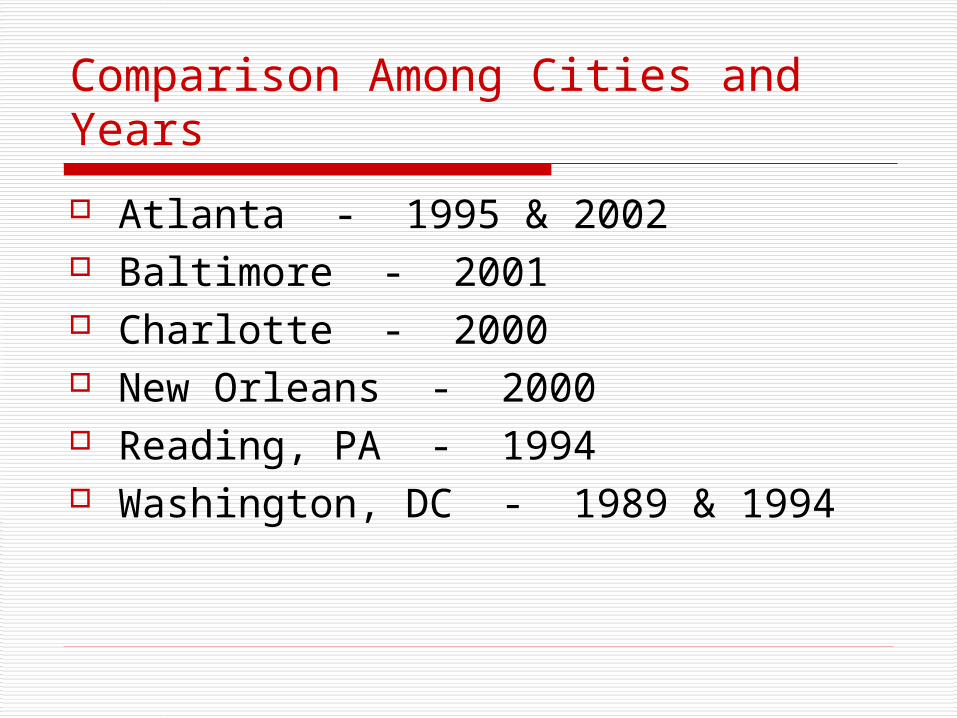
Comparison Among Cities and Years
Atlanta - 1995 & 2002 Baltimore - 2001 Charlotte - 2000 New Orleans - 2000 Reading, PA - 1994 Washington, DC - 1989 & 1994
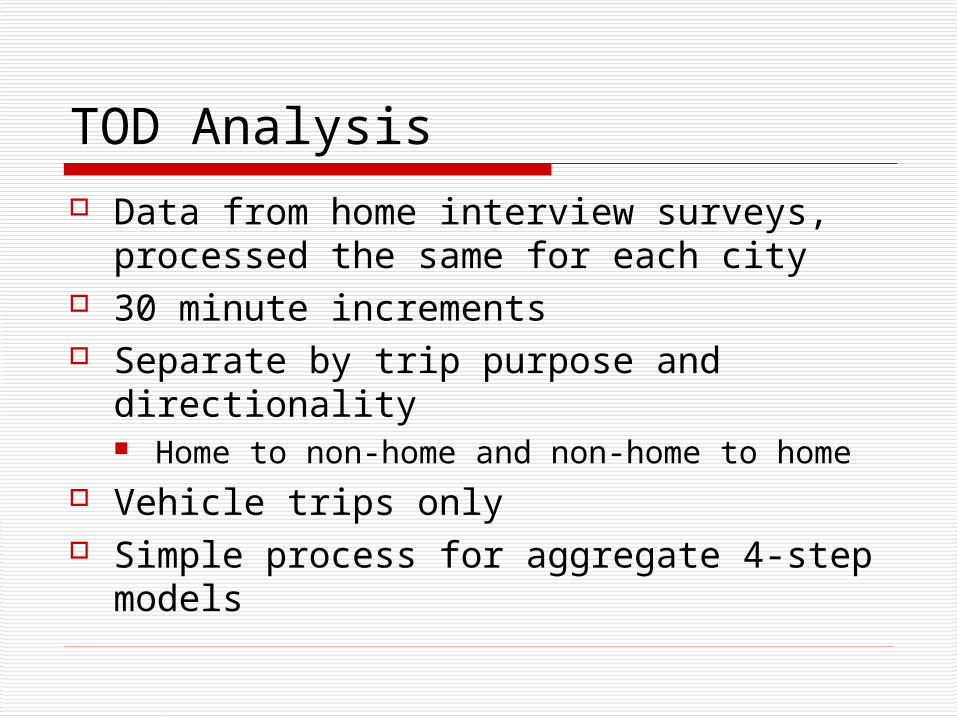
TOD Analysis Data from home interview surveys,
processed the same for each city 30 minute increments Separate by trip purpose and
directionality Home to non-home and non-home to home
Vehicle trips only Simple process for aggregate 4-step
models
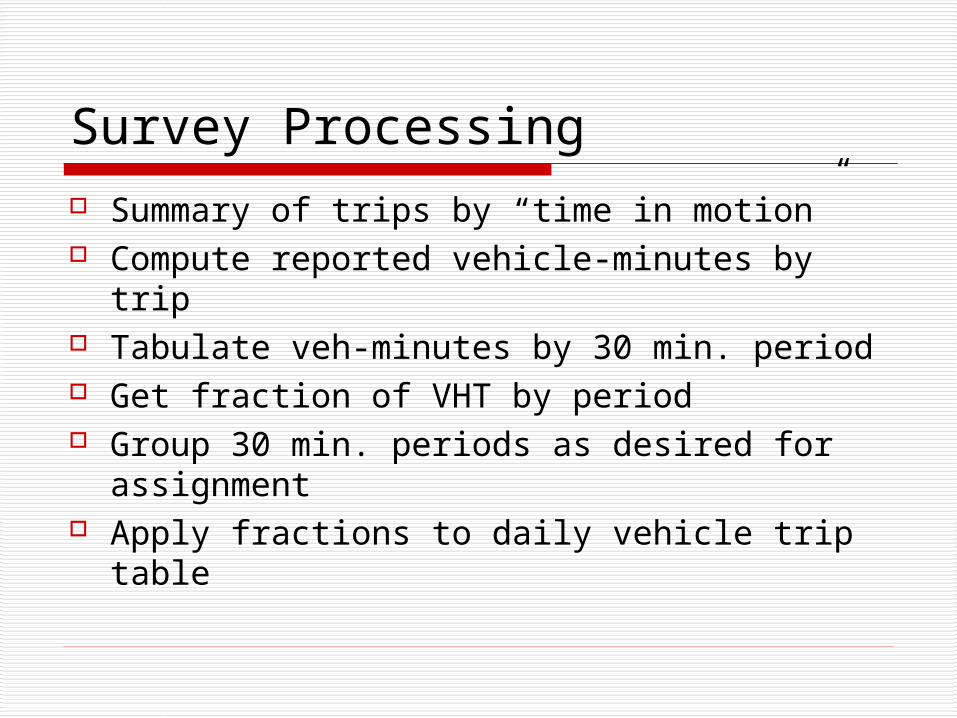
Survey Processing Summary of trips by “time in motion” Compute reported vehicle-minutes by trip Tabulate veh-minutes by 30 min. period Get fraction of VHT by period Group 30 min. periods as desired for
assignment Apply fractions to daily vehicle trip table
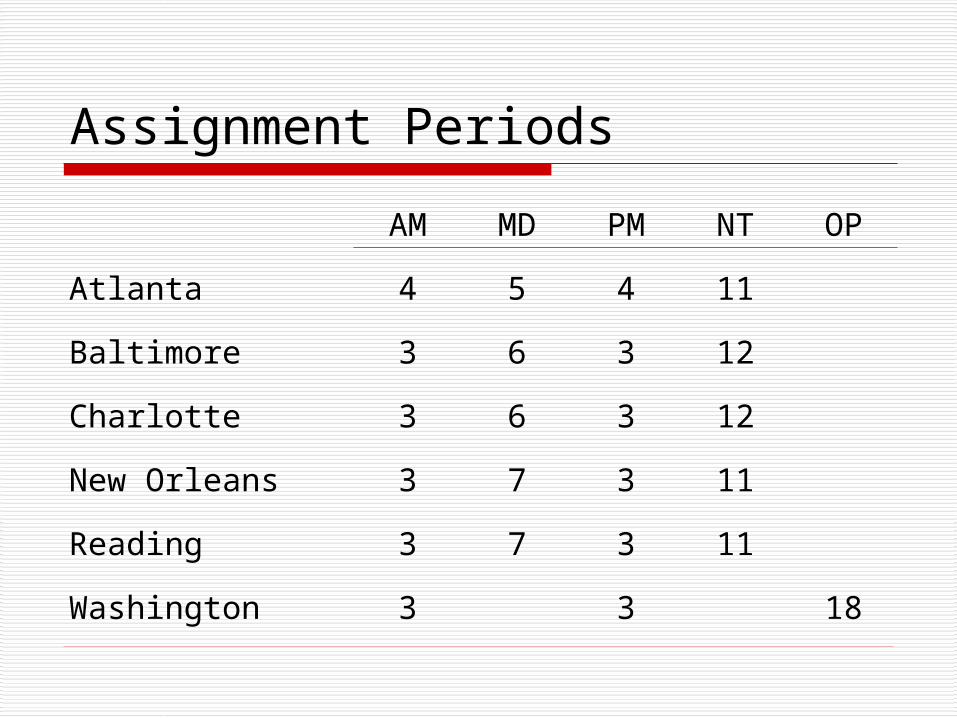
Assignment Periods
AM MD PM NT OP
Atlanta 4 5 4 11
Baltimore 3 6 3 12
Charlotte 3 6 3 12
New Orleans 3 7 3 11
Reading 3 7 3 11
Washington 3 3 18
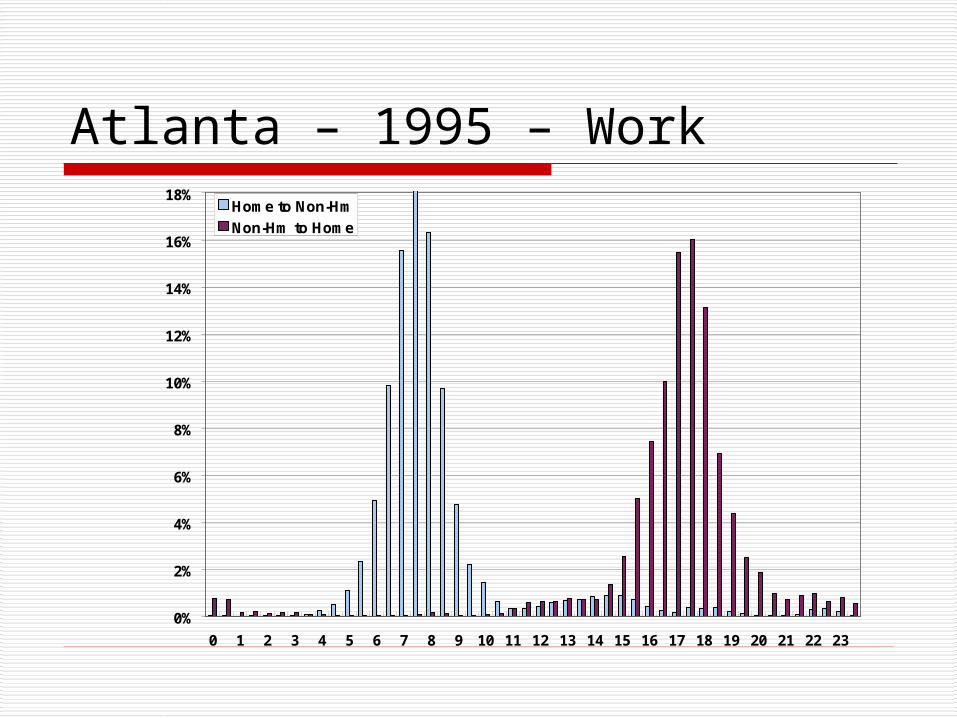
Atlanta – 1995 – Work
0%
2%
4%
6%
8%
10%
12%
14%
16%
18%
0 1 2 3 4 5 6 7 8 9 10 11 12 13 14 15 16 17 18 19 20 21 22 23
Home to Non-Hm
Non-Hm to Home
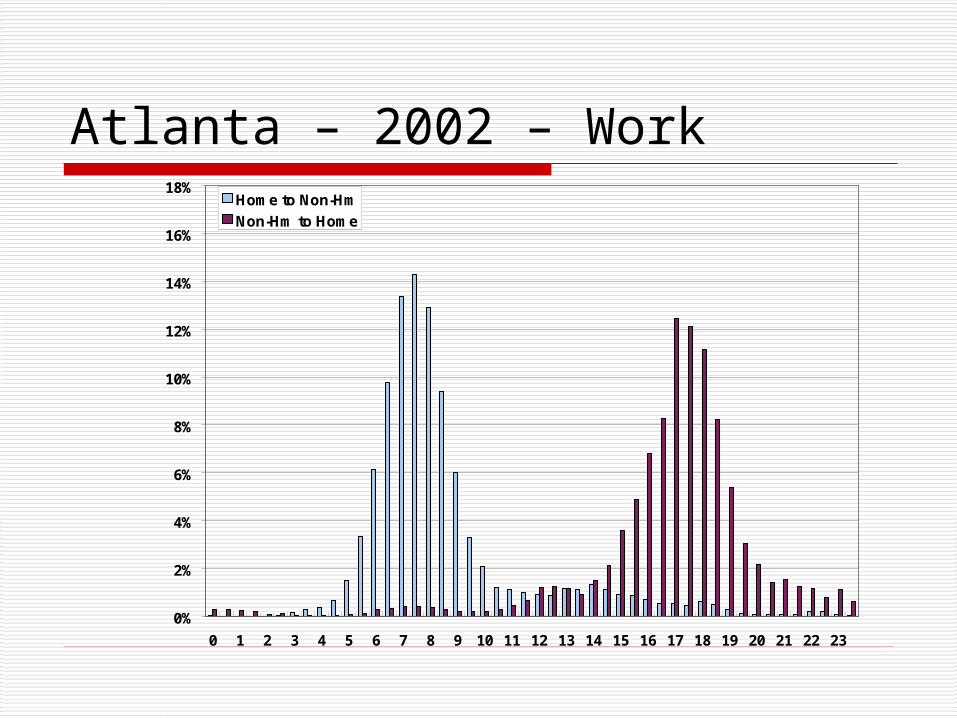
Atlanta – 2002 – Work
0%
2%
4%
6%
8%
10%
12%
14%
16%
18%
0 1 2 3 4 5 6 7 8 9 10 11 12 13 14 15 16 17 18 19 20 21 22 23
Home to Non-Hm
Non-Hm to Home
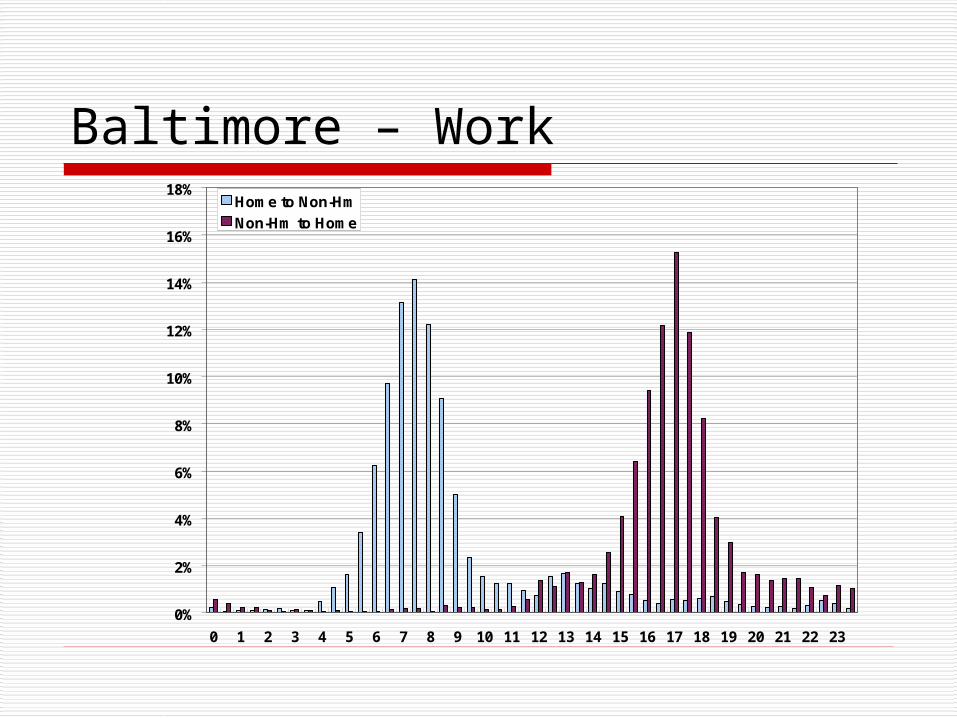
Baltimore – Work
0%
2%
4%
6%
8%
10%
12%
14%
16%
18%
0 1 2 3 4 5 6 7 8 9 10 11 12 13 14 15 16 17 18 19 20 21 22 23
Home to Non-Hm
Non-Hm to Home
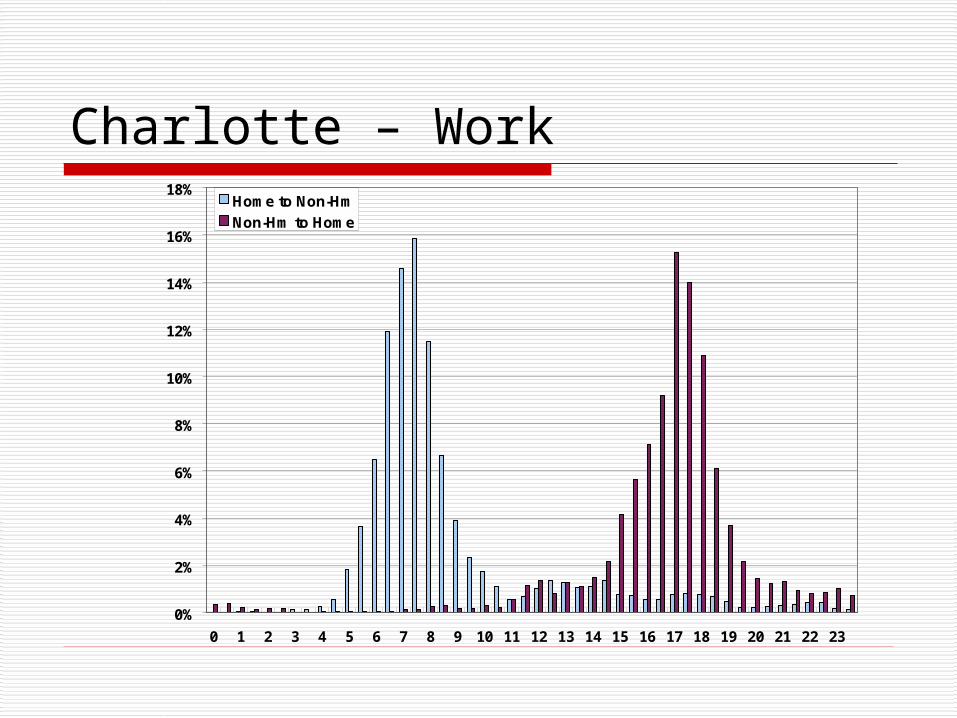
Charlotte – Work
0%
2%
4%
6%
8%
10%
12%
14%
16%
18%
0 1 2 3 4 5 6 7 8 9 10 11 12 13 14 15 16 17 18 19 20 21 22 23
Home to Non-Hm
Non-Hm to Home
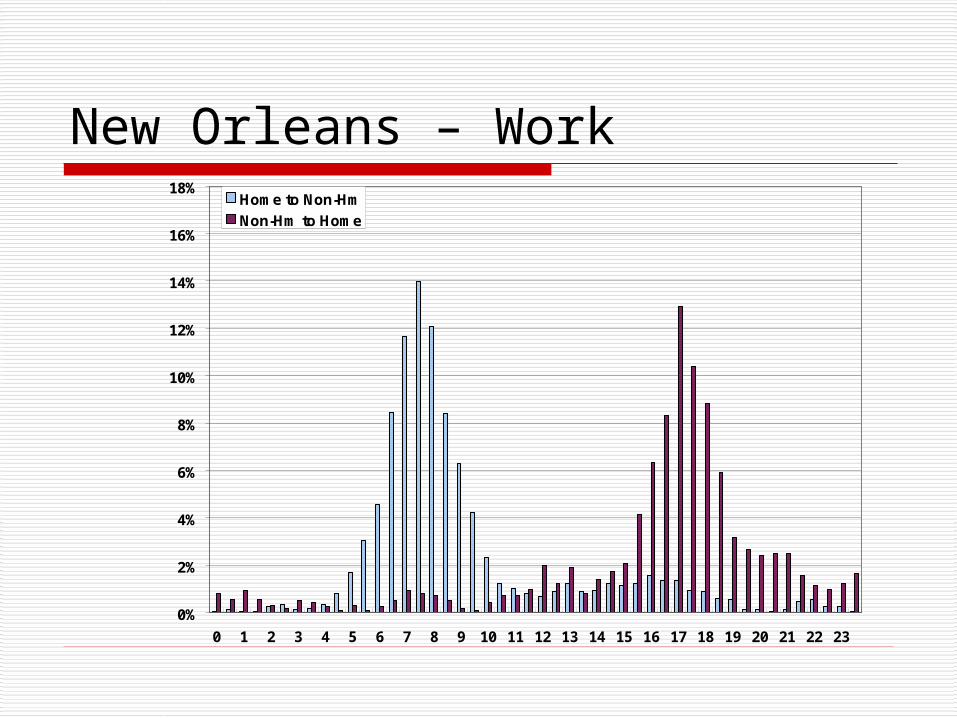
New Orleans – Work
0%
2%
4%
6%
8%
10%
12%
14%
16%
18%
0 1 2 3 4 5 6 7 8 9 10 11 12 13 14 15 16 17 18 19 20 21 22 23
Home to Non-Hm
Non-Hm to Home
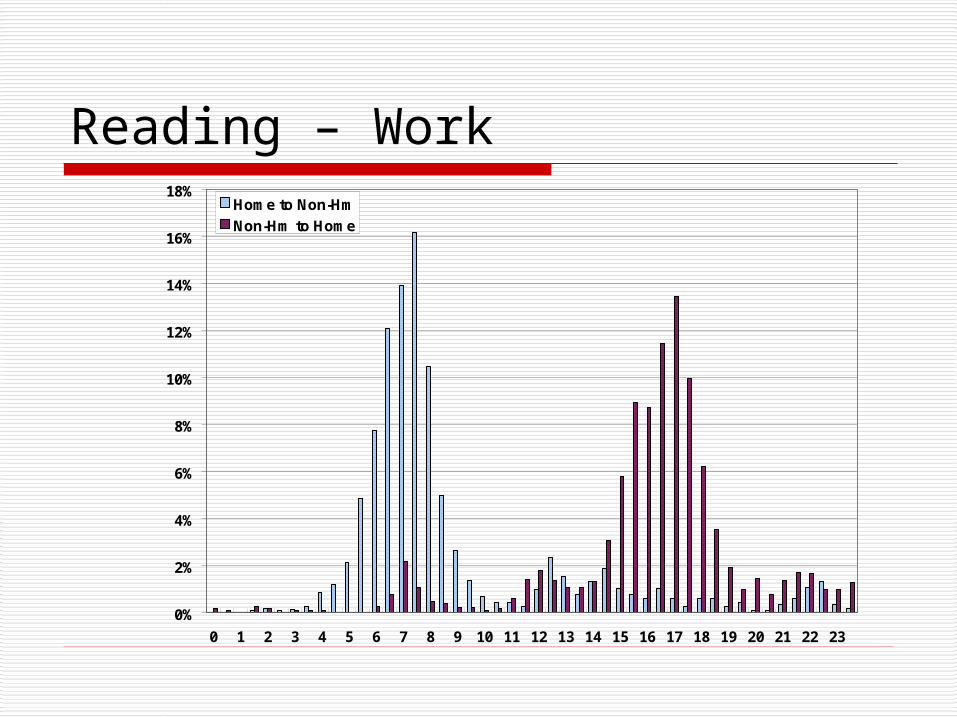
Reading – Work
0%
2%
4%
6%
8%
10%
12%
14%
16%
18%
0 1 2 3 4 5 6 7 8 9 10 11 12 13 14 15 16 17 18 19 20 21 22 23
Home to Non-Hm
Non-Hm to Home
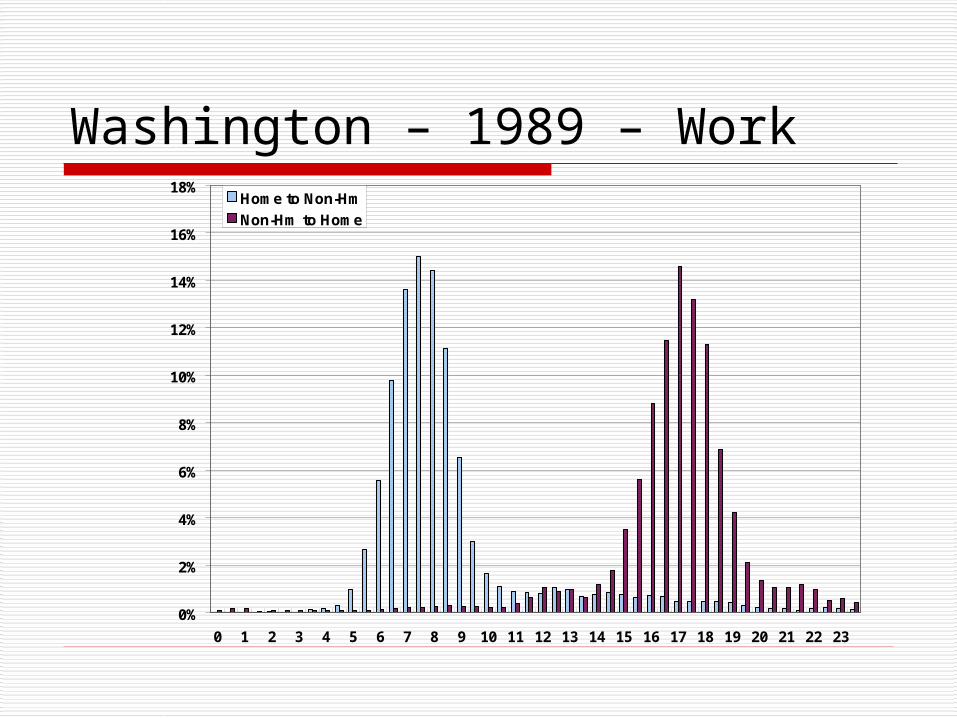
Washington – 1989 – Work
0%
2%
4%
6%
8%
10%
12%
14%
16%
18%
0 1 2 3 4 5 6 7 8 9 10 11 12 13 14 15 16 17 18 19 20 21 22 23
Home to Non-Hm
Non-Hm to Home
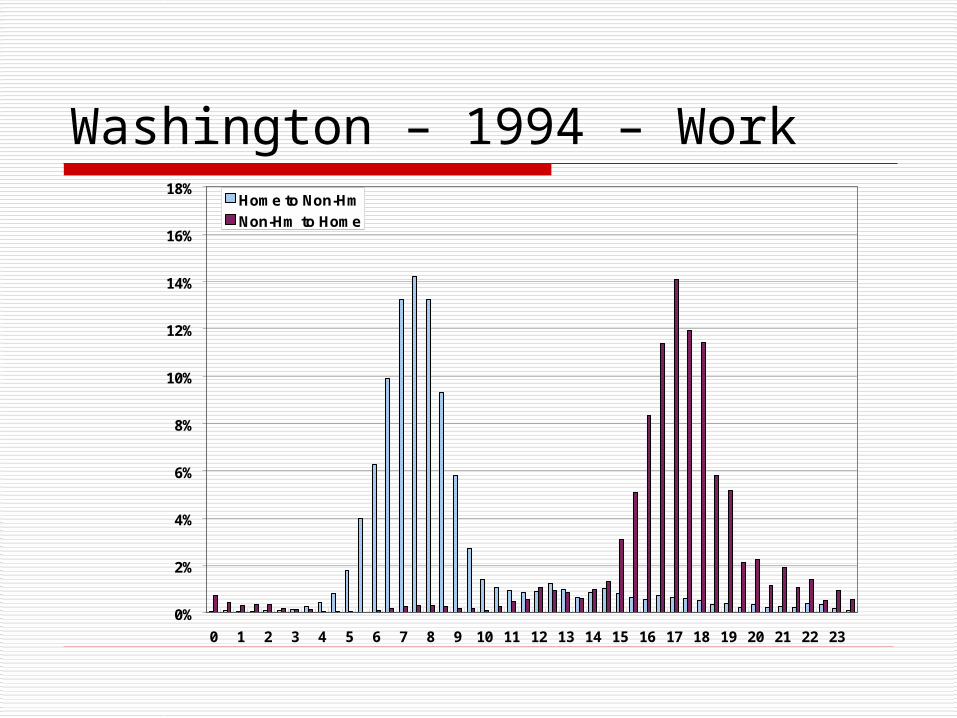
Washington – 1994 – Work
0%
2%
4%
6%
8%
10%
12%
14%
16%
18%
0 1 2 3 4 5 6 7 8 9 10 11 12 13 14 15 16 17 18 19 20 21 22 23
Home to Non-Hm
Non-Hm to Home
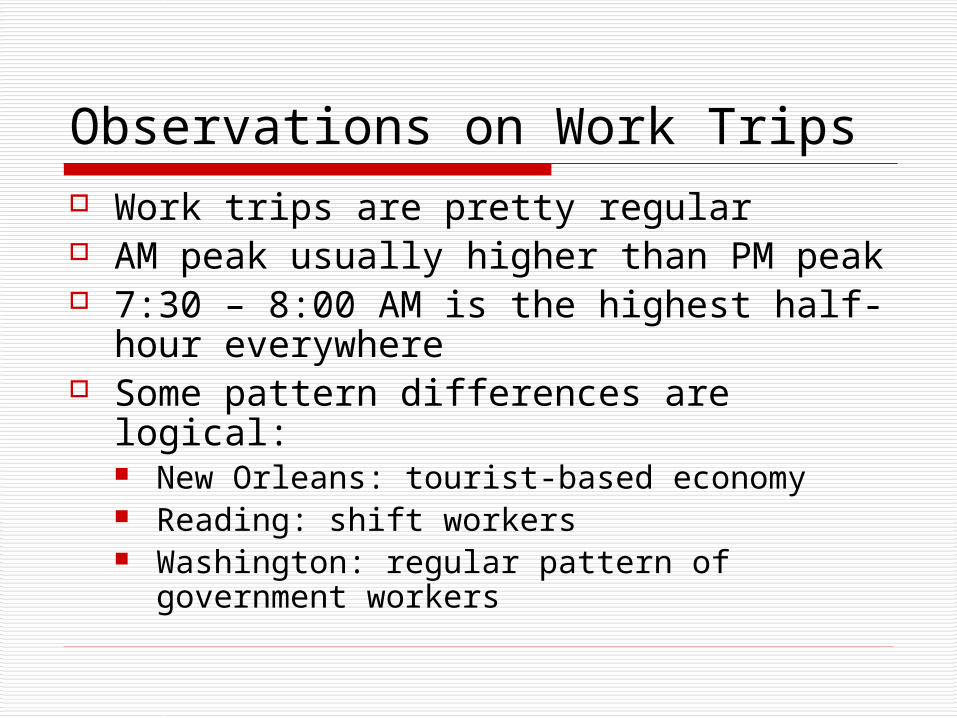
Observations on Work Trips Work trips are pretty regular AM peak usually higher than PM peak 7:30 – 8:00 AM is the highest half-
hour everywhere Some pattern differences are logical:
New Orleans: tourist-based economy Reading: shift workers Washington: regular pattern of
government workers
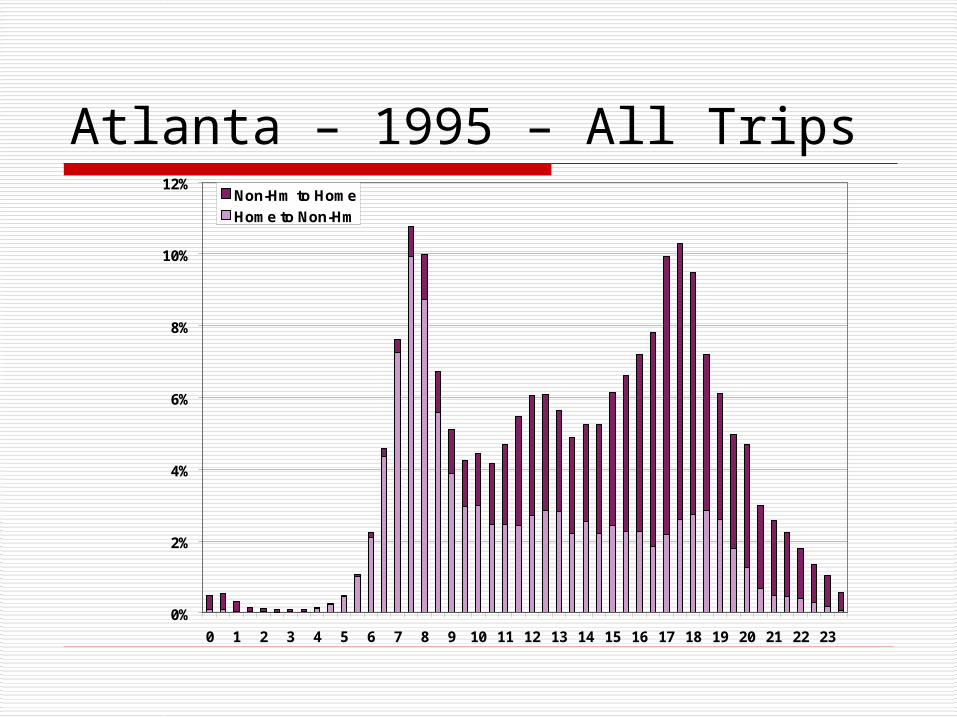
Atlanta – 1995 – All Trips
0%
2%
4%
6%
8%
10%
12%
0 1 2 3 4 5 6 7 8 9 10 11 12 13 14 15 16 17 18 19 20 21 22 23
Non-Hm to Home
Home to Non-Hm

Atlanta – 2002 – All Trips
0%
2%
4%
6%
8%
10%
12%
0 1 2 3 4 5 6 7 8 9 10 11 12 13 14 15 16 17 18 19 20 21 22 23
Non-Hm to Home
Home to Non-Hm
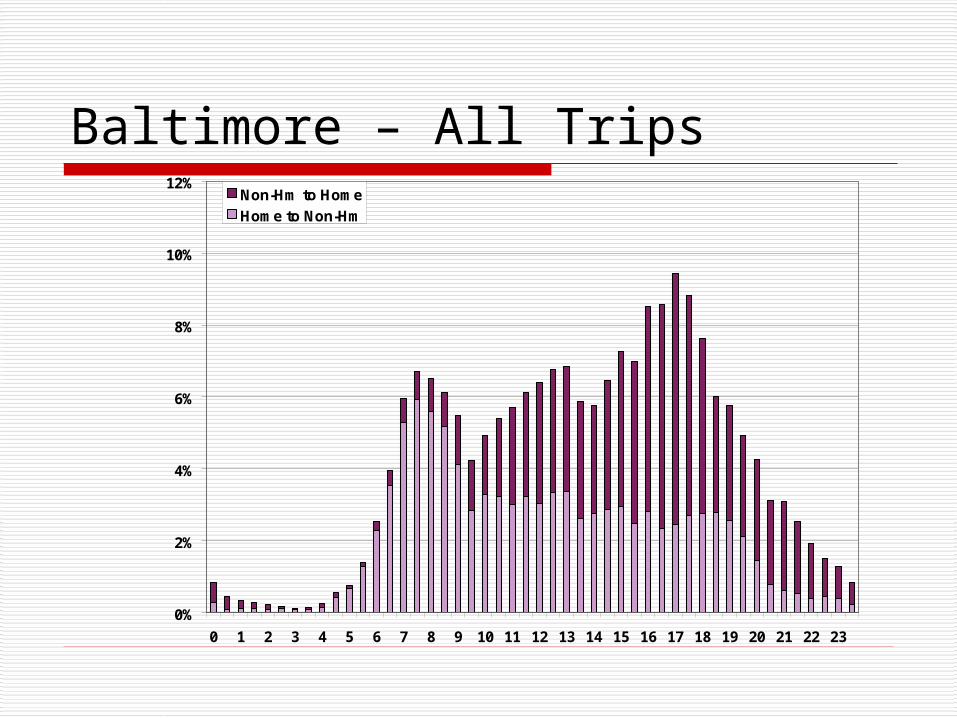
Baltimore – All Trips
0%
2%
4%
6%
8%
10%
12%
0 1 2 3 4 5 6 7 8 9 10 11 12 13 14 15 16 17 18 19 20 21 22 23
Non-Hm to Home
Home to Non-Hm
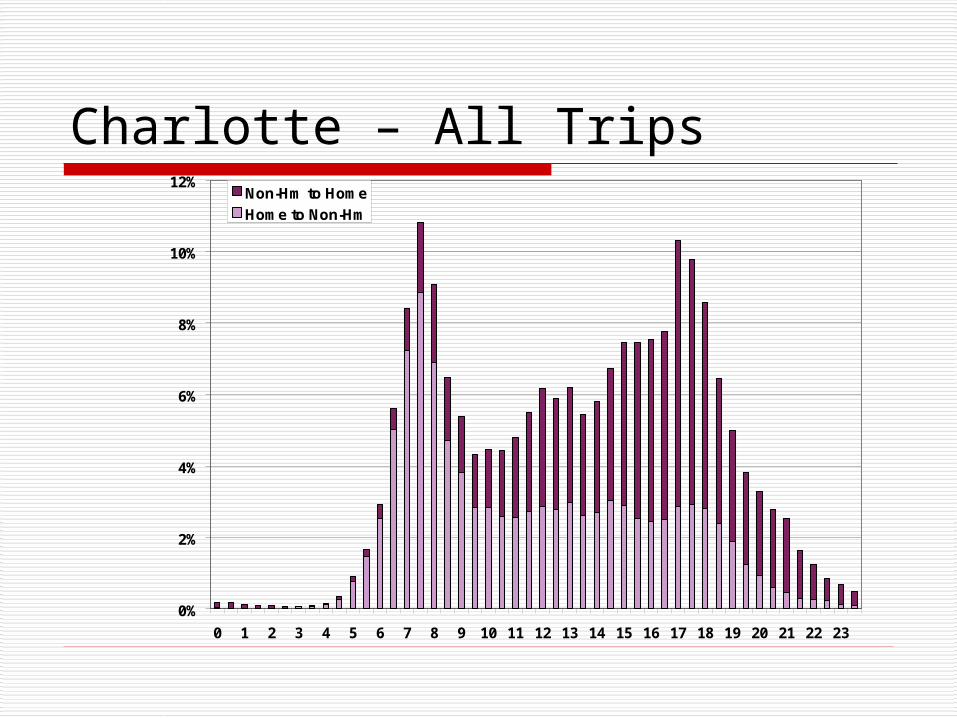
Charlotte – All Trips
0%
2%
4%
6%
8%
10%
12%
0 1 2 3 4 5 6 7 8 9 10 11 12 13 14 15 16 17 18 19 20 21 22 23
Non-Hm to Home
Home to Non-Hm
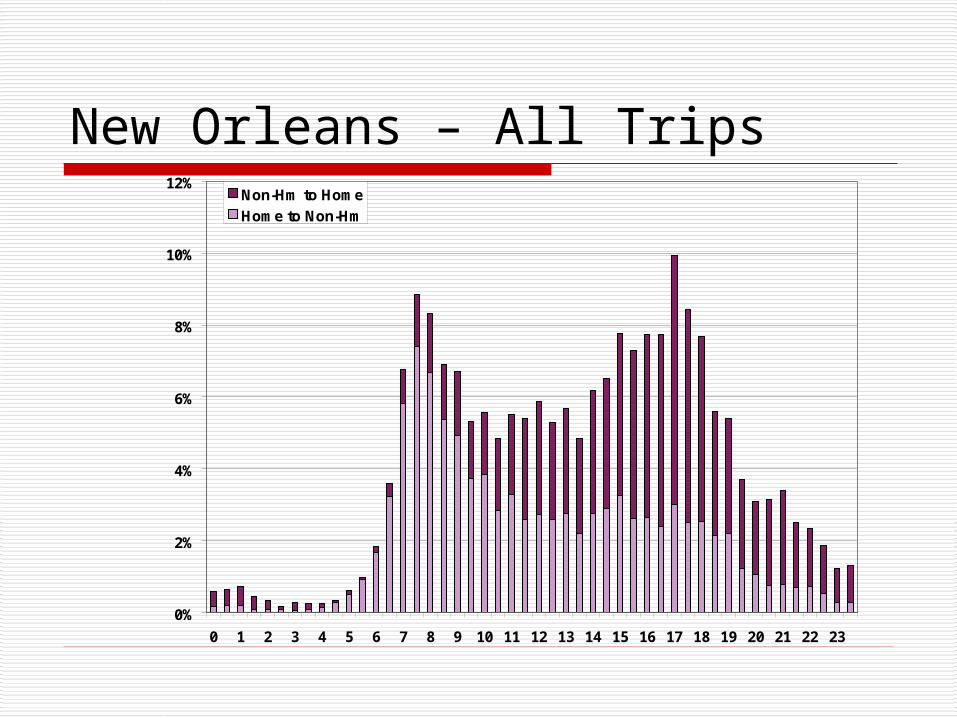
New Orleans – All Trips
0%
2%
4%
6%
8%
10%
12%
0 1 2 3 4 5 6 7 8 9 10 11 12 13 14 15 16 17 18 19 20 21 22 23
Non-Hm to Home
Home to Non-Hm
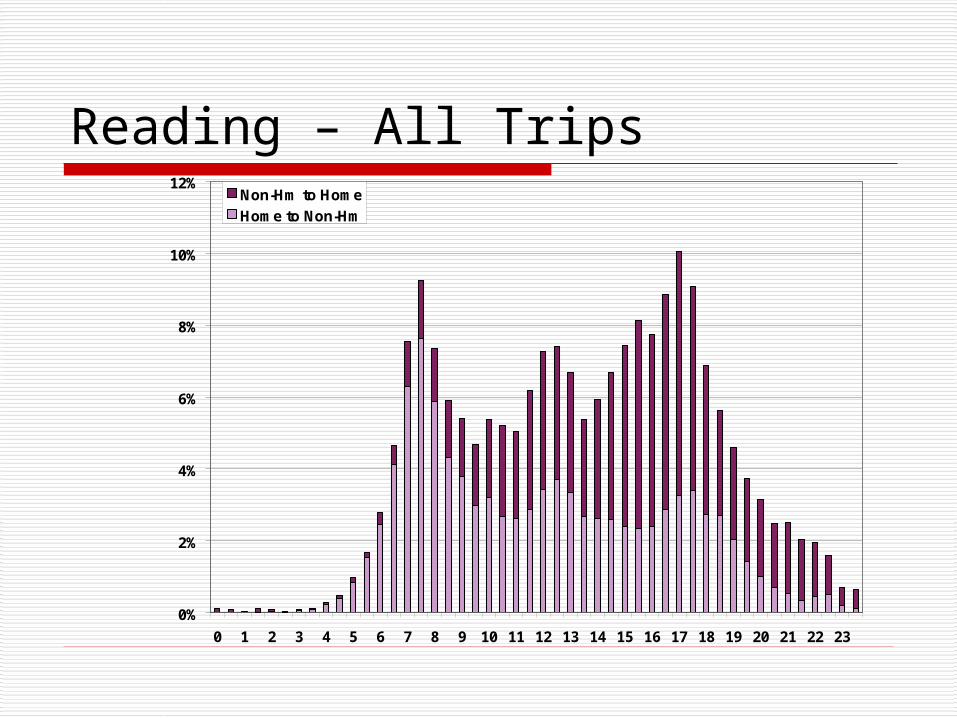
Reading – All Trips
0%
2%
4%
6%
8%
10%
12%
0 1 2 3 4 5 6 7 8 9 10 11 12 13 14 15 16 17 18 19 20 21 22 23
Non-Hm to Home
Home to Non-Hm
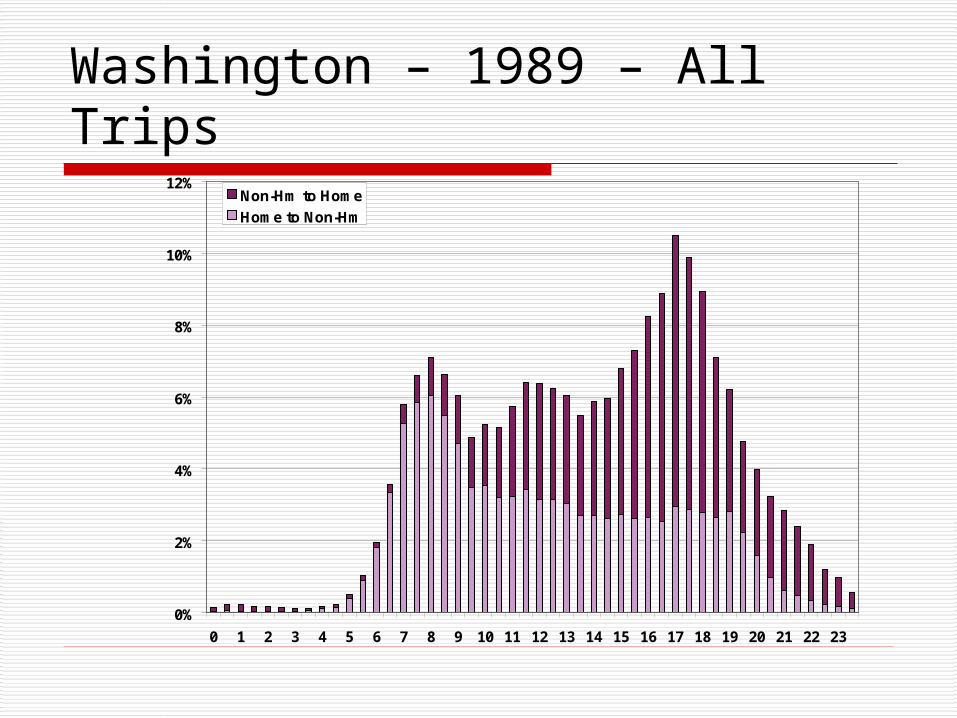
Washington – 1989 – All Trips
0%
2%
4%
6%
8%
10%
12%
0 1 2 3 4 5 6 7 8 9 10 11 12 13 14 15 16 17 18 19 20 21 22 23
Non-Hm to Home
Home to Non-Hm
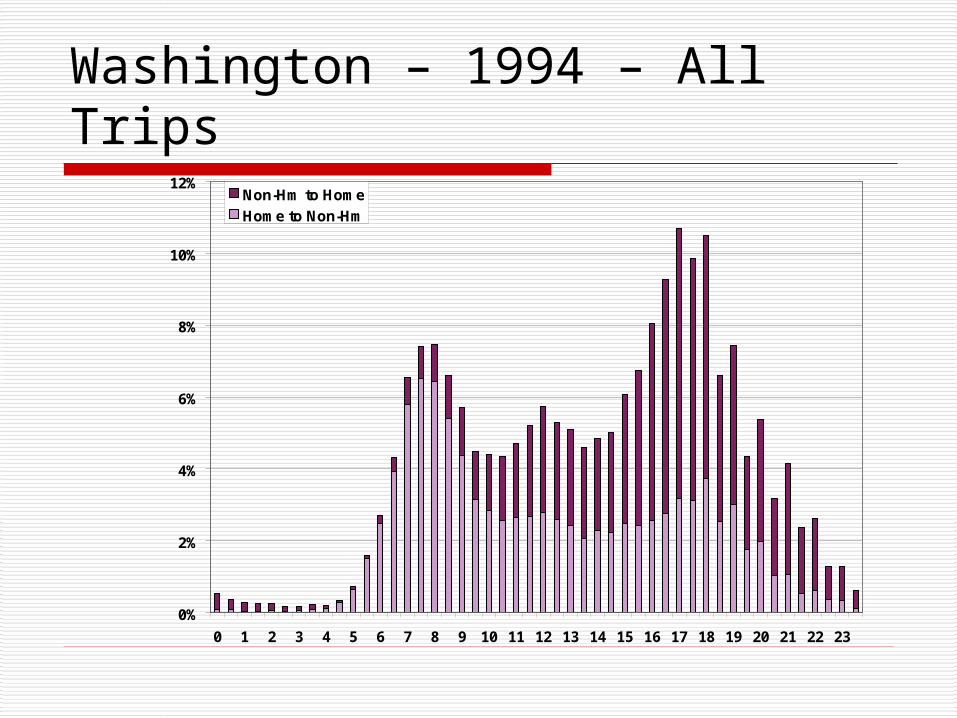
Washington – 1994 – All Trips
0%
2%
4%
6%
8%
10%
12%
0 1 2 3 4 5 6 7 8 9 10 11 12 13 14 15 16 17 18 19 20 21 22 23
Non-Hm to Home
Home to Non-Hm
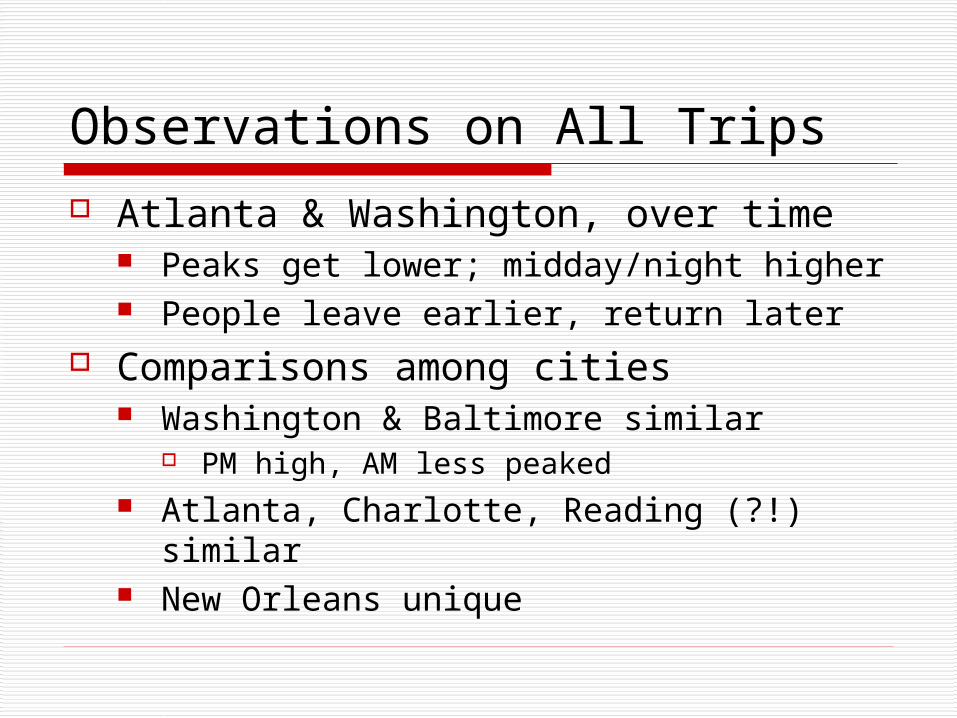
Observations on All Trips
Atlanta & Washington, over time Peaks get lower; midday/night higher People leave earlier, return later
Comparisons among cities Washington & Baltimore similar
PM high, AM less peaked Atlanta, Charlotte, Reading (?!) similar New Orleans unique
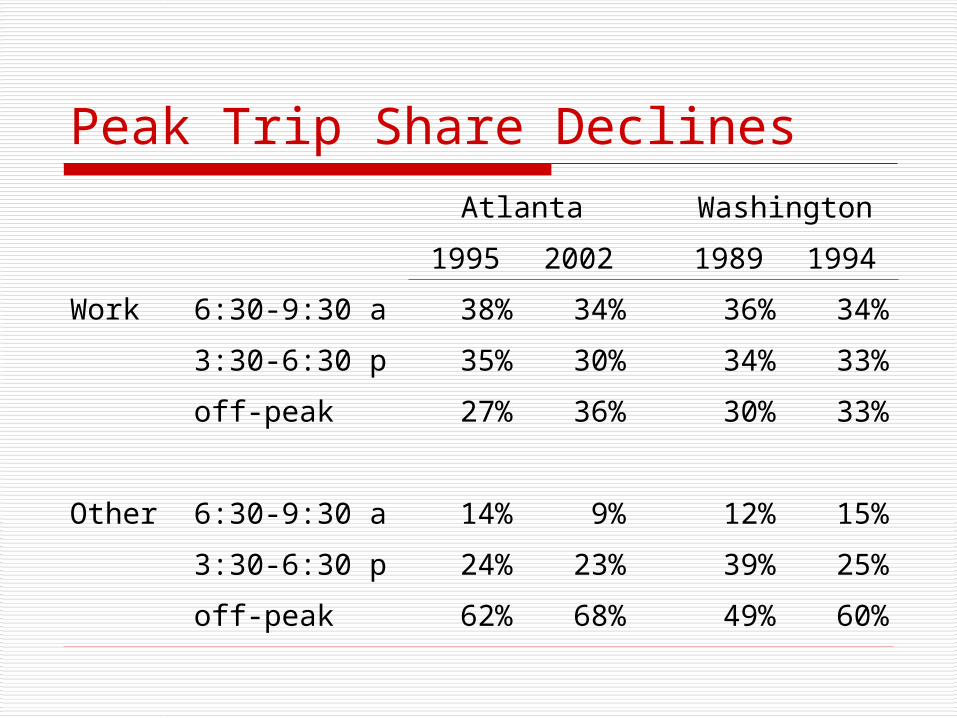
Peak Trip Share DeclinesAtlanta Washington
1995 2002 1989 1994
Work 6:30-9:30 a 38% 34% 36% 34%
3:30-6:30 p 35% 30% 34% 33%
off-peak 27% 36% 30% 33%
Other 6:30-9:30 a 14% 9% 12% 15%
3:30-6:30 p 24% 23% 39% 25%
off-peak 62% 68% 49% 60%
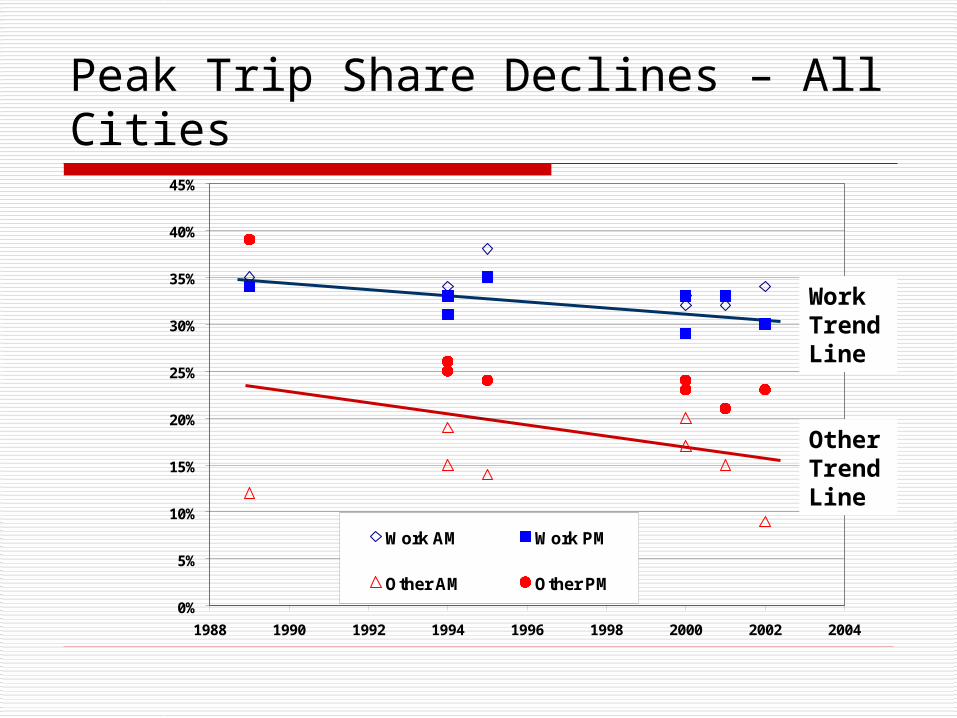
Peak Trip Share Declines – All Cities
0%
5%
10%
15%
20%
25%
30%
35%
40%
45%
1988 1990 1992 1994 1996 1998 2000 2002 2004
Work AM Work PM
Other AM Other PM
Work Trend Line
Other Trend Line
Causes of Peak Spreading
Increased traffic congestion Changing lifestyles More flex-time More part-time workers
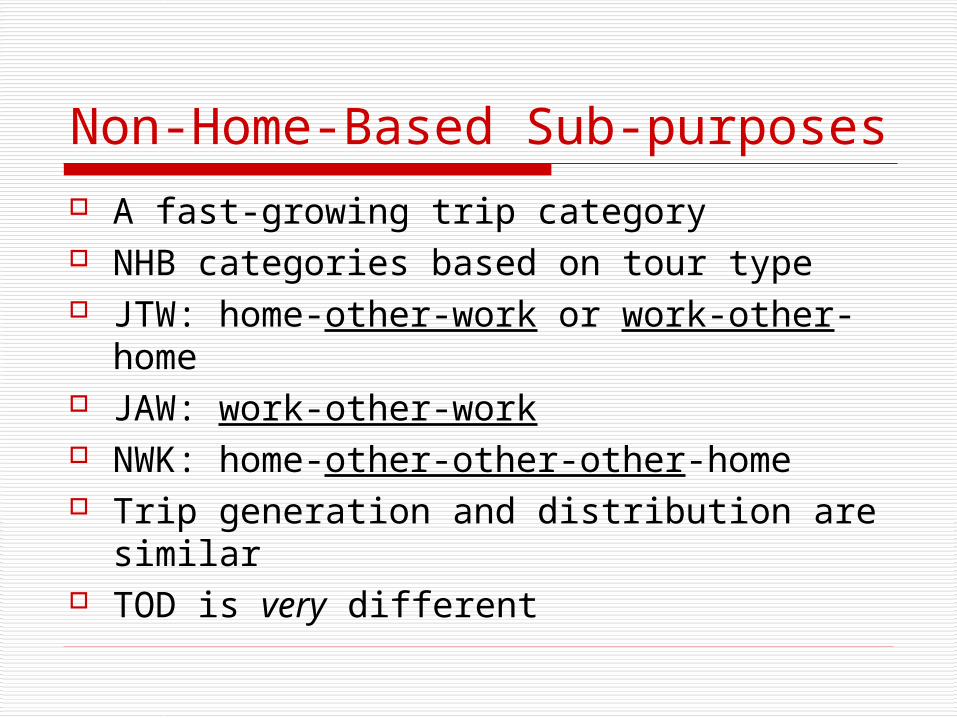
Non-Home-Based Sub-purposes A fast-growing trip category NHB categories based on tour type JTW: home-other-work or work-other-
home JAW: work-other-work NWK: home-other-other-other-home Trip generation and distribution are
similar TOD is very different
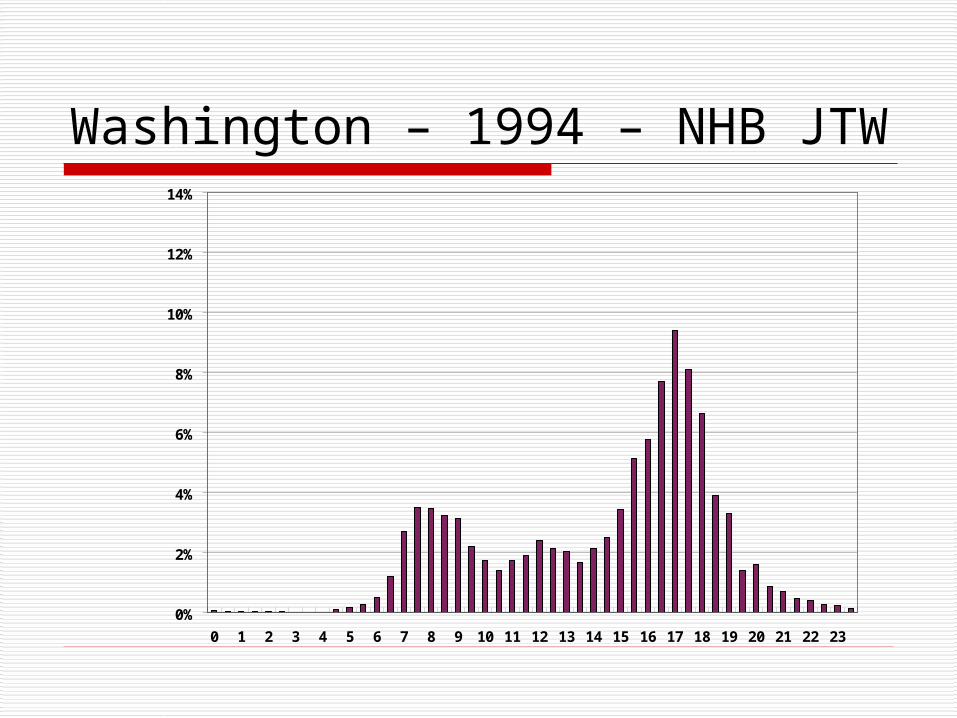
Washington – 1994 – NHB JTW
0%
2%
4%
6%
8%
10%
12%
14%
0 1 2 3 4 5 6 7 8 9 10 11 12 13 14 15 16 17 18 19 20 21 22 23
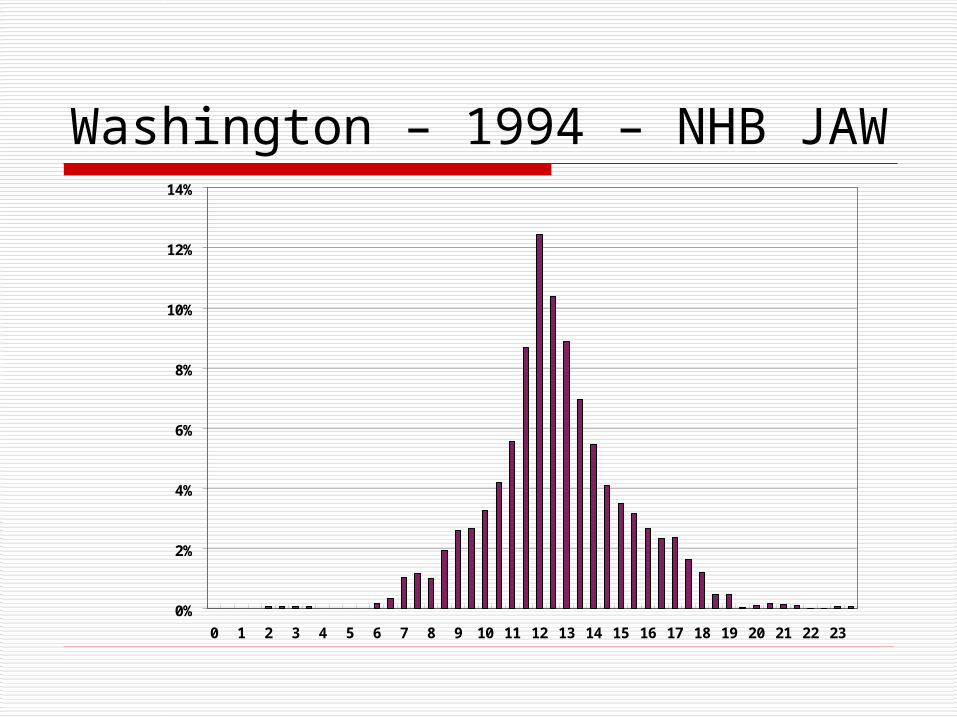
Washington – 1994 – NHB JAW
0%
2%
4%
6%
8%
10%
12%
14%
0 1 2 3 4 5 6 7 8 9 10 11 12 13 14 15 16 17 18 19 20 21 22 23
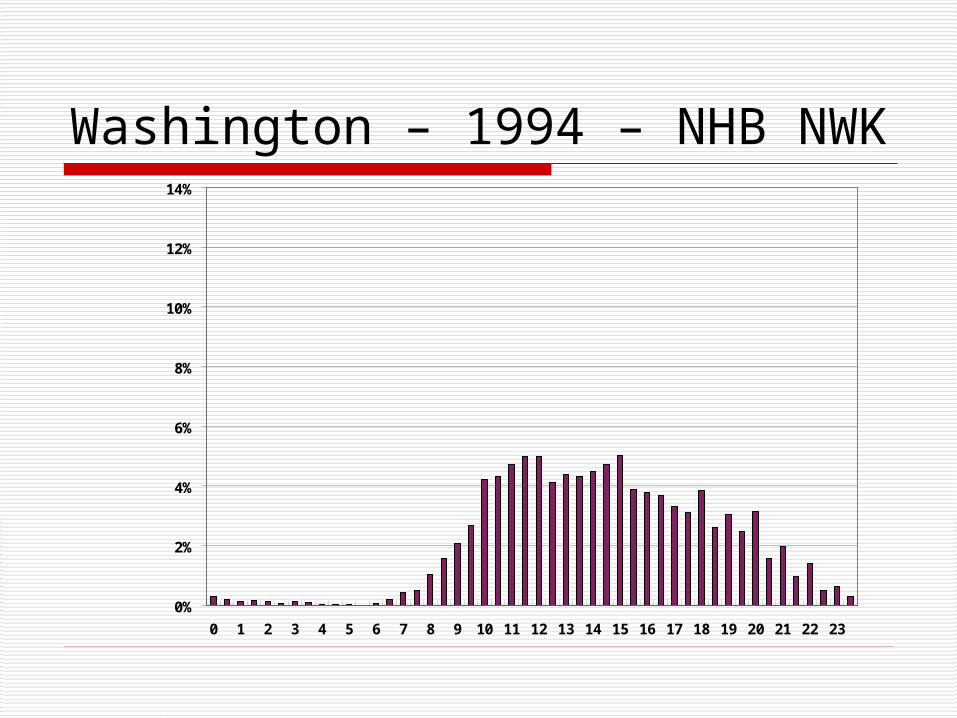
Washington – 1994 – NHB NWK
0%
2%
4%
6%
8%
10%
12%
14%
0 1 2 3 4 5 6 7 8 9 10 11 12 13 14 15 16 17 18 19 20 21 22 23
Validation Compare link volumes to counts by
assignment period This type of TOD model sometimes
overestimates peak period volumes Reduce peak fractions, increase off-
peak fractions until volumes ≈ counts A very necessary step
Difficult to get counts Easy to adjust fractions
Conclusions Work trip patterns are generally consistent Some peak spreading over time
Increased congestion is part of the reason Splitting NHB into sub-purposes is
important for TOD This approach quickly produces a usable
TOD model, but validation is important TOD models are not really transferable

Questions
Please use Microphone