Embed Size (px)
Citation preview
A
Nrapto©
K
1
cbsbwitfidpp
tSthi
f
0d
Materials Science and Engineering A 435–436 (2006) 625–631
Analysis of thermal phenomena in LENSTM deposition
Liang Wang a, Sergio Felicelli b,∗a Center for Advanced Vehicular Systems, Mississippi State University, Mississippi State, MS 39762, United states
b Mechanical Engineering Department, Mississippi State University, Mississippi State, MS 39762, United States
Received 16 May 2006; received in revised form 14 July 2006; accepted 21 July 2006
bstract
A two-dimensional finite element model was developed to calculate the temperature distribution for 316 stainless steel during the Laser Engineeredet Shaping (LENSTM) rapid fabrication process as a function of time and process parameters. Numerical simulations are performed on the upper
egion of a thin plate part, where experimental data indicates that a uniform temperature can be assumed at the base of this region. The temperaturet the base of the modeling region and the effective laser power are determined by matching predicted with previously measured temperature
rofiles surrounding the molten pool. Good agreement is obtained between the calculated and the measured temperature profiles. The model ishen used to investigate the relative importance of physical properties and different mechanisms of heat transfer during the process. The resultsbtained in this work provide important and unavailable information on many thermal aspects of the LENS process.2006 Elsevier B.V. All rights reserved.
n
iuzp8[
svmiIwdttFf
eywords: Laser Engineered Net Shaping; Thermal modeling; Rapid fabricatio
. Introduction
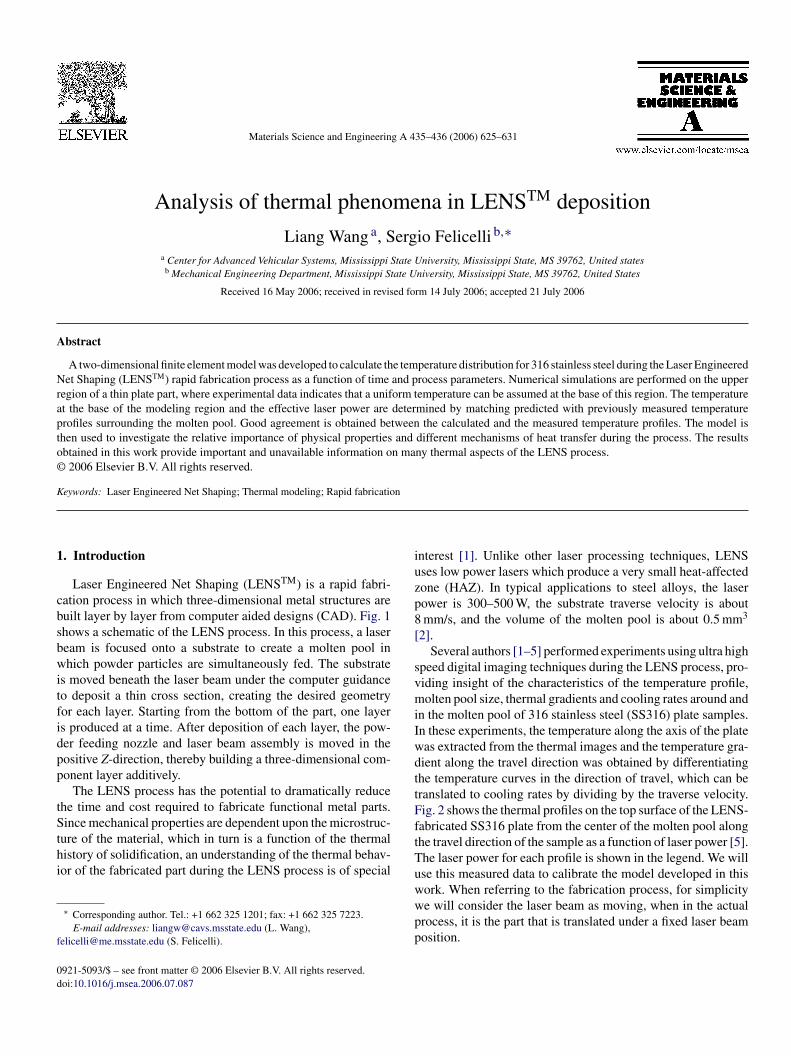
Laser Engineered Net Shaping (LENSTM) is a rapid fabri-ation process in which three-dimensional metal structures areuilt layer by layer from computer aided designs (CAD). Fig. 1hows a schematic of the LENS process. In this process, a laseream is focused onto a substrate to create a molten pool inhich powder particles are simultaneously fed. The substrate
s moved beneath the laser beam under the computer guidanceo deposit a thin cross section, creating the desired geometryor each layer. Starting from the bottom of the part, one layers produced at a time. After deposition of each layer, the pow-er feeding nozzle and laser beam assembly is moved in theositive Z-direction, thereby building a three-dimensional com-onent layer additively.
The LENS process has the potential to dramatically reducehe time and cost required to fabricate functional metal parts.ince mechanical properties are dependent upon the microstruc-
ure of the material, which in turn is a function of the thermalistory of solidification, an understanding of the thermal behav-or of the fabricated part during the LENS process is of special
∗ Corresponding author. Tel.: +1 662 325 1201; fax: +1 662 325 7223.E-mail addresses: [email protected] (L. Wang),
[email protected] (S. Felicelli).
tTuwwpp
921-5093/$ – see front matter © 2006 Elsevier B.V. All rights reserved.oi:10.1016/j.msea.2006.07.087
nterest [1]. Unlike other laser processing techniques, LENSses low power lasers which produce a very small heat-affectedone (HAZ). In typical applications to steel alloys, the laserower is 300–500 W, the substrate traverse velocity is aboutmm/s, and the volume of the molten pool is about 0.5 mm3
2].Several authors [1–5] performed experiments using ultra high
peed digital imaging techniques during the LENS process, pro-iding insight of the characteristics of the temperature profile,olten pool size, thermal gradients and cooling rates around and
n the molten pool of 316 stainless steel (SS316) plate samples.n these experiments, the temperature along the axis of the plateas extracted from the thermal images and the temperature gra-ient along the travel direction was obtained by differentiatinghe temperature curves in the direction of travel, which can beranslated to cooling rates by dividing by the traverse velocity.ig. 2 shows the thermal profiles on the top surface of the LENS-abricated SS316 plate from the center of the molten pool alonghe travel direction of the sample as a function of laser power [5].he laser power for each profile is shown in the legend. We willse this measured data to calibrate the model developed in this
ork. When referring to the fabrication process, for simplicitye will consider the laser beam as moving, when in the actualrocess, it is the part that is translated under a fixed laser beamosition.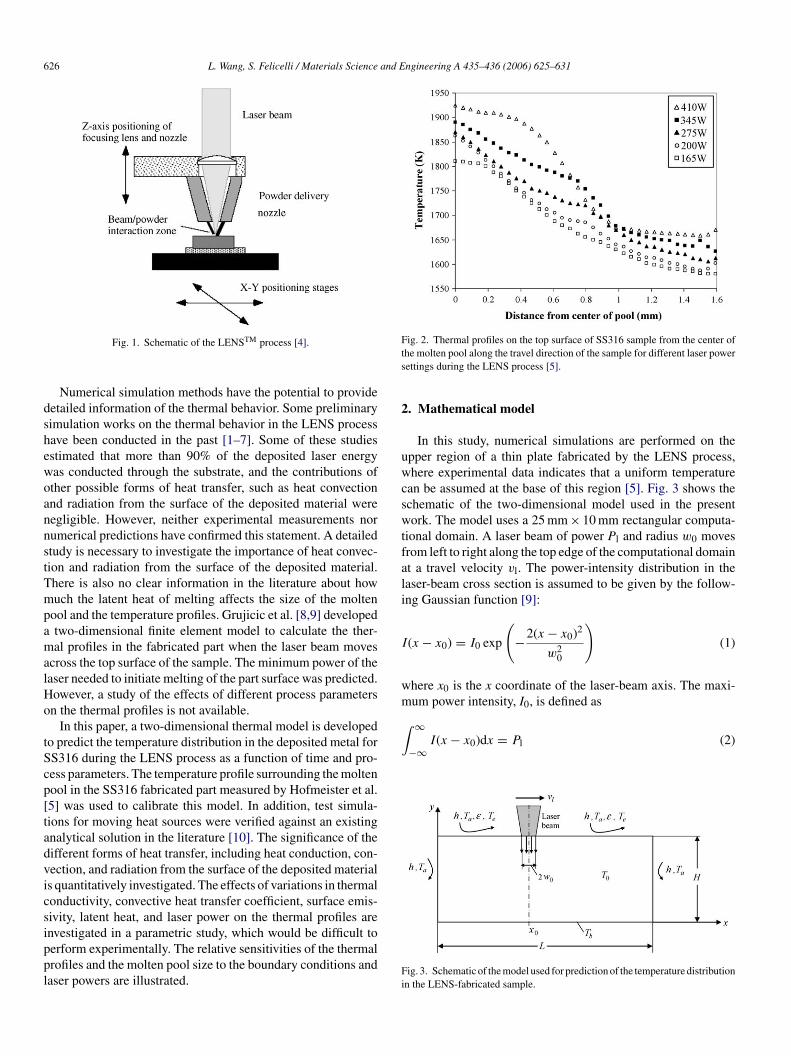
626 L. Wang, S. Felicelli / Materials Science and Engineering A 435–436 (2006) 625–631
dshewoannstTmpamalHo
tScp[tadvicsippl
Fig. 2. Thermal profiles on the top surface of SS316 sample from the center ofts
2
uwcswtfali
I
wm
∫ ∞
−∞I(x − x0)dx = Pl (2)
Fig. 1. Schematic of the LENSTM process [4].
Numerical simulation methods have the potential to provideetailed information of the thermal behavior. Some preliminaryimulation works on the thermal behavior in the LENS processave been conducted in the past [1–7]. Some of these studiesstimated that more than 90% of the deposited laser energyas conducted through the substrate, and the contributions ofther possible forms of heat transfer, such as heat convectionnd radiation from the surface of the deposited material wereegligible. However, neither experimental measurements norumerical predictions have confirmed this statement. A detailedtudy is necessary to investigate the importance of heat convec-ion and radiation from the surface of the deposited material.here is also no clear information in the literature about howuch the latent heat of melting affects the size of the molten
ool and the temperature profiles. Grujicic et al. [8,9] developedtwo-dimensional finite element model to calculate the ther-al profiles in the fabricated part when the laser beam moves
cross the top surface of the sample. The minimum power of theaser needed to initiate melting of the part surface was predicted.owever, a study of the effects of different process parametersn the thermal profiles is not available.
In this paper, a two-dimensional thermal model is developedo predict the temperature distribution in the deposited metal forS316 during the LENS process as a function of time and pro-ess parameters. The temperature profile surrounding the moltenool in the SS316 fabricated part measured by Hofmeister et al.5] was used to calibrate this model. In addition, test simula-ions for moving heat sources were verified against an existingnalytical solution in the literature [10]. The significance of theifferent forms of heat transfer, including heat conduction, con-ection, and radiation from the surface of the deposited materials quantitatively investigated. The effects of variations in thermalonductivity, convective heat transfer coefficient, surface emis-ivity, latent heat, and laser power on the thermal profiles arenvestigated in a parametric study, which would be difficult to
erform experimentally. The relative sensitivities of the thermalrofiles and the molten pool size to the boundary conditions andaser powers are illustrated.Fi
he molten pool along the travel direction of the sample for different laser powerettings during the LENS process [5].
. Mathematical model
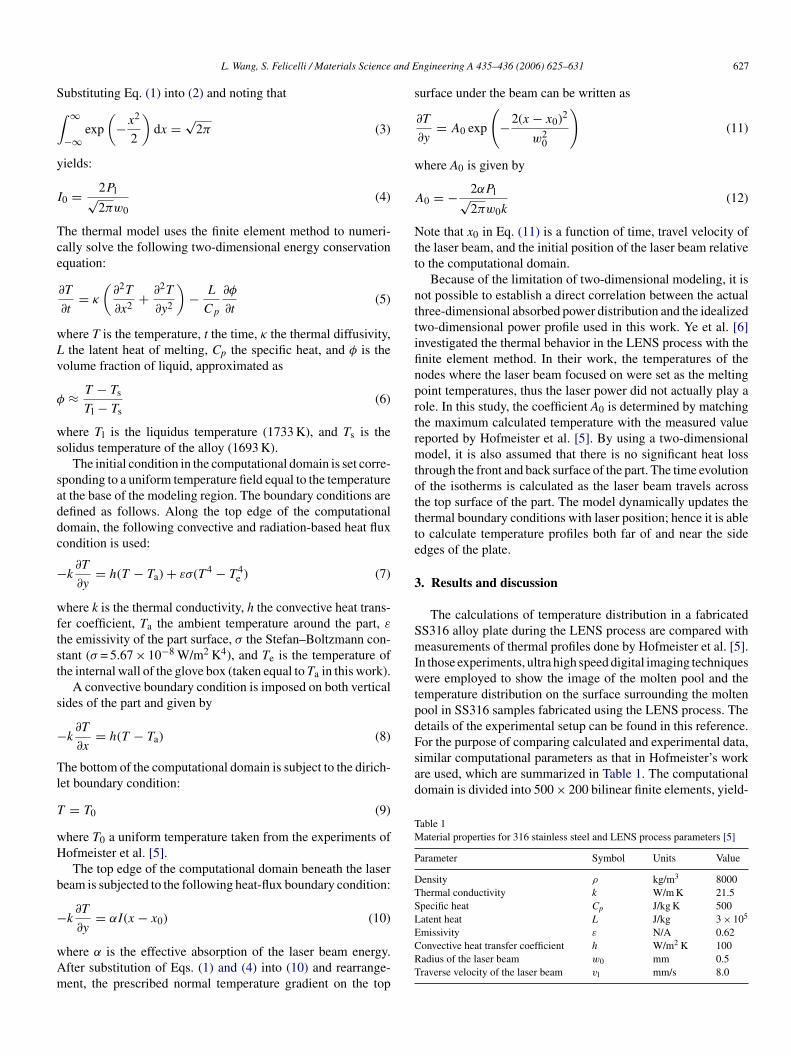
In this study, numerical simulations are performed on thepper region of a thin plate fabricated by the LENS process,here experimental data indicates that a uniform temperature
an be assumed at the base of this region [5]. Fig. 3 shows thechematic of the two-dimensional model used in the presentork. The model uses a 25 mm × 10 mm rectangular computa-
ional domain. A laser beam of power Pl and radius w0 movesrom left to right along the top edge of the computational domaint a travel velocity vl. The power-intensity distribution in theaser-beam cross section is assumed to be given by the follow-ng Gaussian function [9]:
(x − x0) = I0 exp
(−2(x − x0)2
w20
)(1)
here x0 is the x coordinate of the laser-beam axis. The maxi-um power intensity, I0, is defined as
ig. 3. Schematic of the model used for prediction of the temperature distributionn the LENS-fabricated sample.
and E
S∫
y
I
Tce
wLv
φ
ws
saddc
−
wftst
s
−
Tl
T
wH
b
−
wAm
s
w
A
Ntt
nttifinprtrmtottte
3
SmIwtpdFor the purpose of comparing calculated and experimental data,similar computational parameters as that in Hofmeister’s workare used, which are summarized in Table 1. The computationaldomain is divided into 500 × 200 bilinear finite elements, yield-
Table 1Material properties for 316 stainless steel and LENS process parameters [5]
Parameter Symbol Units Value
Density ρ kg/m3 8000Thermal conductivity k W/m K 21.5Specific heat Cp J/kg K 500Latent heat L J/kg 3 × 10⁵
L. Wang, S. Felicelli / Materials Science
ubstituting Eq. (1) into (2) and noting that
∞
−∞exp
(−x2
2
)dx =
√2π (3)
ields:
0 = 2Pl√2πw0
(4)
he thermal model uses the finite element method to numeri-ally solve the following two-dimensional energy conservationquation:
∂T
∂t= κ
(∂2T
∂x2 + ∂2T
∂y2
)− L
Cp
∂φ
∂t(5)
here T is the temperature, t the time, κ the thermal diffusivity,the latent heat of melting, Cp the specific heat, and φ is the
olume fraction of liquid, approximated as
≈ T − Ts
Tl − Ts(6)
here Tl is the liquidus temperature (1733 K), and Ts is theolidus temperature of the alloy (1693 K).
The initial condition in the computational domain is set corre-ponding to a uniform temperature field equal to the temperaturet the base of the modeling region. The boundary conditions areefined as follows. Along the top edge of the computationalomain, the following convective and radiation-based heat fluxondition is used:
k∂T
∂y= h(T − Ta) + εσ(T 4 − T 4
e ) (7)
here k is the thermal conductivity, h the convective heat trans-er coefficient, Ta the ambient temperature around the part, ε
he emissivity of the part surface, σ the Stefan–Boltzmann con-tant (σ = 5.67 × 10⁻⁸ W/m2 K4), and Te is the temperature ofhe internal wall of the glove box (taken equal to Ta in this work).
A convective boundary condition is imposed on both verticalides of the part and given by
k∂T
∂x= h(T − Ta) (8)
he bottom of the computational domain is subject to the dirich-et boundary condition:
= T0 (9)
here T0 a uniform temperature taken from the experiments ofofmeister et al. [5].The top edge of the computational domain beneath the laser
eam is subjected to the following heat-flux boundary condition:
k∂T = αI(x − x0) (10)
∂yhere α is the effective absorption of the laser beam energy.fter substitution of Eqs. (1) and (4) into (10) and rearrange-ent, the prescribed normal temperature gradient on the top
ECRT
ngineering A 435–436 (2006) 625–631 627
urface under the beam can be written as
∂T
∂y= A0 exp
(−2(x − x0)2
w20
)(11)
here A0 is given by
0 = − 2αPl√2πw0k
(12)
ote that x0 in Eq. (11) is a function of time, travel velocity ofhe laser beam, and the initial position of the laser beam relativeo the computational domain.
Because of the limitation of two-dimensional modeling, it isot possible to establish a direct correlation between the actualhree-dimensional absorbed power distribution and the idealizedwo-dimensional power profile used in this work. Ye et al. [6]nvestigated the thermal behavior in the LENS process with thenite element method. In their work, the temperatures of theodes where the laser beam focused on were set as the meltingoint temperatures, thus the laser power did not actually play aole. In this study, the coefficient A0 is determined by matchinghe maximum calculated temperature with the measured valueeported by Hofmeister et al. [5]. By using a two-dimensionalodel, it is also assumed that there is no significant heat loss
hrough the front and back surface of the part. The time evolutionf the isotherms is calculated as the laser beam travels acrosshe top surface of the part. The model dynamically updates thehermal boundary conditions with laser position; hence it is ableo calculate temperature profiles both far of and near the sidedges of the plate.
. Results and discussion
The calculations of temperature distribution in a fabricatedS316 alloy plate during the LENS process are compared witheasurements of thermal profiles done by Hofmeister et al. [5].
n those experiments, ultra high speed digital imaging techniquesere employed to show the image of the molten pool and the
emperature distribution on the surface surrounding the moltenool in SS316 samples fabricated using the LENS process. Theetails of the experimental setup can be found in this reference.
missivity ε N/A 0.62onvective heat transfer coefficient h W/m2 K 100adius of the laser beam w0 mm 0.5raverse velocity of the laser beam vl mm/s 8.0
628 L. Wang, S. Felicelli / Materials Science and E
Fot
ipfi
ttTtutamolbiaif
ds
Fs
sttiflhivtptlttotl
ptraittFiTttectttn
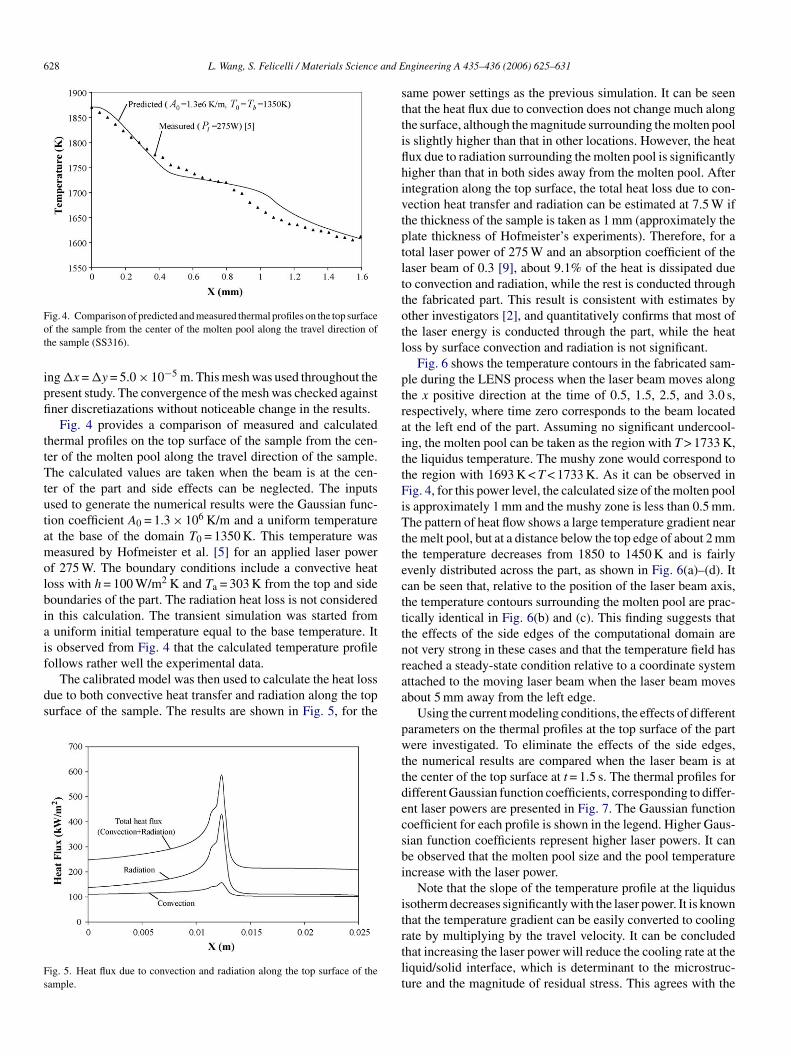
ig. 4. Comparison of predicted and measured thermal profiles on the top surfacef the sample from the center of the molten pool along the travel direction ofhe sample (SS316).
ng x = y = 5.0 × 10⁻⁵ m. This mesh was used throughout theresent study. The convergence of the mesh was checked againstner discretiazations without noticeable change in the results.
Fig. 4 provides a comparison of measured and calculatedhermal profiles on the top surface of the sample from the cen-er of the molten pool along the travel direction of the sample.he calculated values are taken when the beam is at the cen-
er of the part and side effects can be neglected. The inputssed to generate the numerical results were the Gaussian func-ion coefficient A0 = 1.3 × 10⁶ K/m and a uniform temperaturet the base of the domain T0 = 1350 K. This temperature waseasured by Hofmeister et al. [5] for an applied laser power
f 275 W. The boundary conditions include a convective heatoss with h = 100 W/m2 K and Ta = 303 K from the top and sideoundaries of the part. The radiation heat loss is not consideredn this calculation. The transient simulation was started fromuniform initial temperature equal to the base temperature. It
s observed from Fig. 4 that the calculated temperature profile
ollows rather well the experimental data.The calibrated model was then used to calculate the heat lossue to both convective heat transfer and radiation along the topurface of the sample. The results are shown in Fig. 5, for the
ig. 5. Heat flux due to convection and radiation along the top surface of theample.
raa
pwttdecsbi
itrtlt
ngineering A 435–436 (2006) 625–631
ame power settings as the previous simulation. It can be seenhat the heat flux due to convection does not change much alonghe surface, although the magnitude surrounding the molten pools slightly higher than that in other locations. However, the heatux due to radiation surrounding the molten pool is significantlyigher than that in both sides away from the molten pool. Afterntegration along the top surface, the total heat loss due to con-ection heat transfer and radiation can be estimated at 7.5 W ifhe thickness of the sample is taken as 1 mm (approximately thelate thickness of Hofmeister’s experiments). Therefore, for aotal laser power of 275 W and an absorption coefficient of theaser beam of 0.3 [9], about 9.1% of the heat is dissipated dueo convection and radiation, while the rest is conducted throughhe fabricated part. This result is consistent with estimates byther investigators [2], and quantitatively confirms that most ofhe laser energy is conducted through the part, while the heatoss by surface convection and radiation is not significant.
Fig. 6 shows the temperature contours in the fabricated sam-le during the LENS process when the laser beam moves alonghe x positive direction at the time of 0.5, 1.5, 2.5, and 3.0 s,espectively, where time zero corresponds to the beam locatedt the left end of the part. Assuming no significant undercool-ng, the molten pool can be taken as the region with T > 1733 K,he liquidus temperature. The mushy zone would correspond tohe region with 1693 K < T < 1733 K. As it can be observed inig. 4, for this power level, the calculated size of the molten pool
s approximately 1 mm and the mushy zone is less than 0.5 mm.he pattern of heat flow shows a large temperature gradient near
he melt pool, but at a distance below the top edge of about 2 mmhe temperature decreases from 1850 to 1450 K and is fairlyvenly distributed across the part, as shown in Fig. 6(a)–(d). Itan be seen that, relative to the position of the laser beam axis,he temperature contours surrounding the molten pool are prac-ically identical in Fig. 6(b) and (c). This finding suggests thathe effects of the side edges of the computational domain areot very strong in these cases and that the temperature field haseached a steady-state condition relative to a coordinate systemttached to the moving laser beam when the laser beam movesbout 5 mm away from the left edge.
Using the current modeling conditions, the effects of differentarameters on the thermal profiles at the top surface of the partere investigated. To eliminate the effects of the side edges,
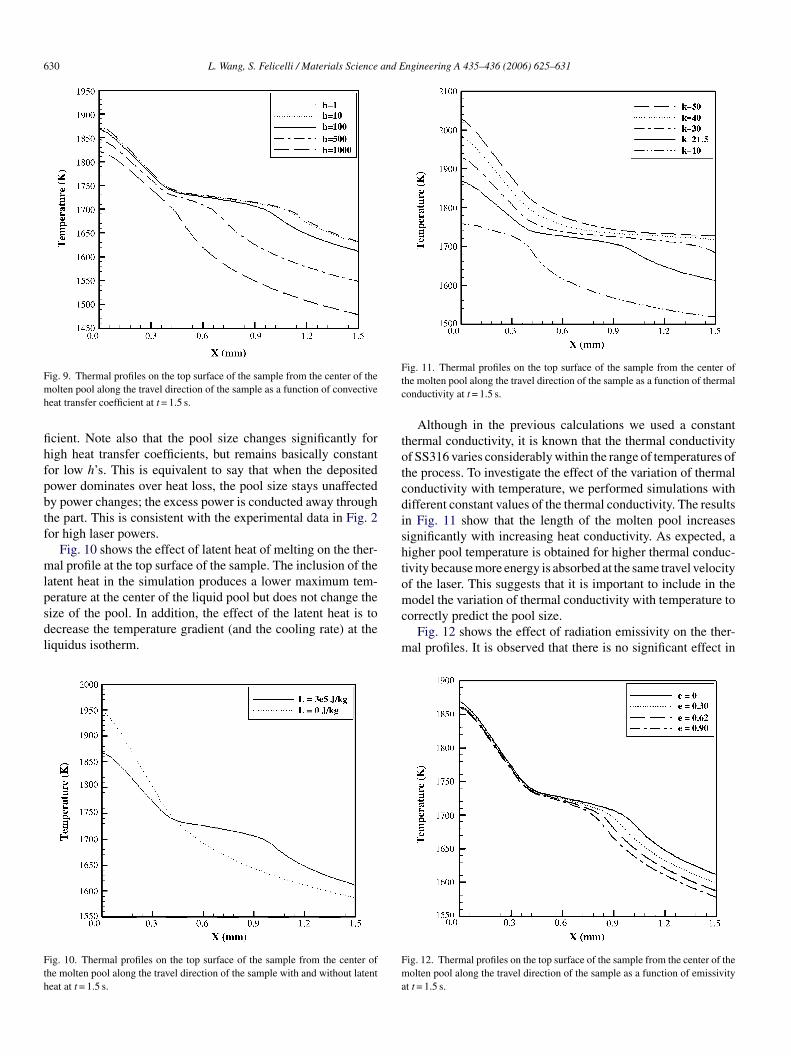
he numerical results are compared when the laser beam is athe center of the top surface at t = 1.5 s. The thermal profiles forifferent Gaussian function coefficients, corresponding to differ-nt laser powers are presented in Fig. 7. The Gaussian functionoefficient for each profile is shown in the legend. Higher Gaus-ian function coefficients represent higher laser powers. It cane observed that the molten pool size and the pool temperaturencrease with the laser power.
Note that the slope of the temperature profile at the liquidussotherm decreases significantly with the laser power. It is knownhat the temperature gradient can be easily converted to cooling
ate by multiplying by the travel velocity. It can be concludedhat increasing the laser power will reduce the cooling rate at theiquid/solid interface, which is determinant to the microstruc-ure and the magnitude of residual stress. This agrees with the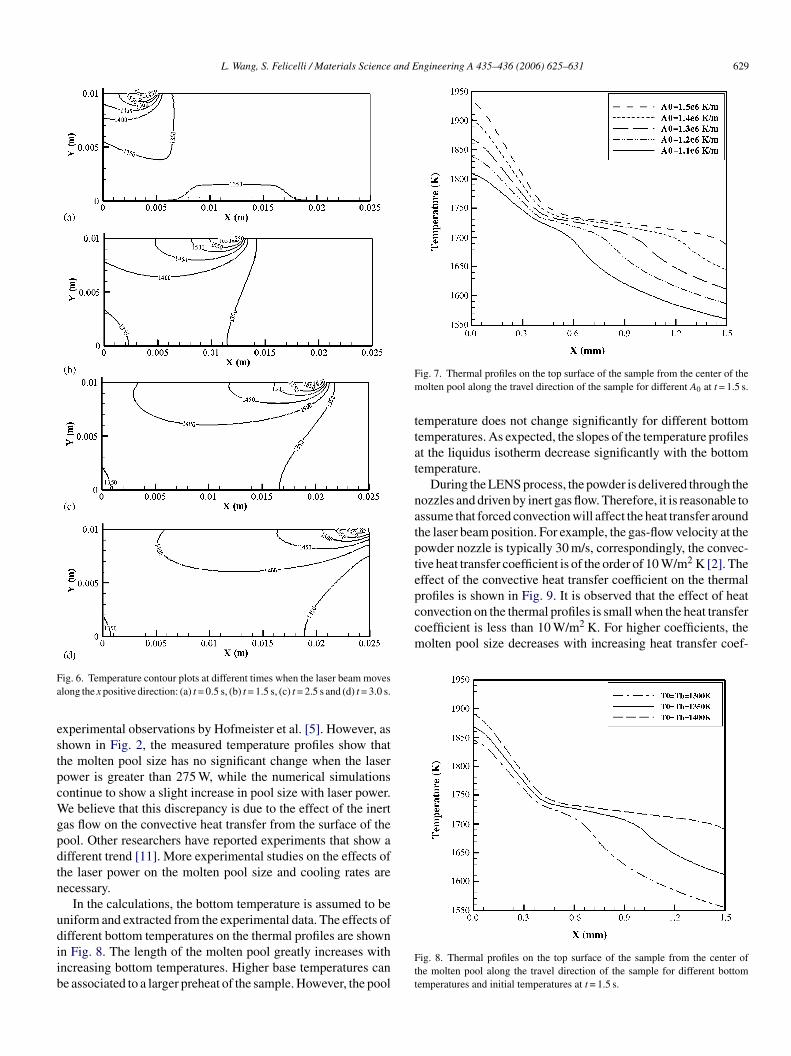
L. Wang, S. Felicelli / Materials Science and Engineering A 435–436 (2006) 625–631 629
Fa
estpcWgpdtn
udiib
Fm
ttat
natptepconvection on the thermal profiles is small when the heat transfercoefficient is less than 10 W/m2 K. For higher coefficients, themolten pool size decreases with increasing heat transfer coef-
ig. 6. Temperature contour plots at different times when the laser beam moveslong the x positive direction: (a) t = 0.5 s, (b) t = 1.5 s, (c) t = 2.5 s and (d) t = 3.0 s.
xperimental observations by Hofmeister et al. [5]. However, ashown in Fig. 2, the measured temperature profiles show thathe molten pool size has no significant change when the laserower is greater than 275 W, while the numerical simulationsontinue to show a slight increase in pool size with laser power.e believe that this discrepancy is due to the effect of the inert
as flow on the convective heat transfer from the surface of theool. Other researchers have reported experiments that show aifferent trend [11]. More experimental studies on the effects ofhe laser power on the molten pool size and cooling rates areecessary.
In the calculations, the bottom temperature is assumed to beniform and extracted from the experimental data. The effects of
ifferent bottom temperatures on the thermal profiles are shownn Fig. 8. The length of the molten pool greatly increases withncreasing bottom temperatures. Higher base temperatures cane associated to a larger preheat of the sample. However, the poolFtt
ig. 7. Thermal profiles on the top surface of the sample from the center of theolten pool along the travel direction of the sample for different A0 at t = 1.5 s.
emperature does not change significantly for different bottomemperatures. As expected, the slopes of the temperature profilest the liquidus isotherm decrease significantly with the bottomemperature.
During the LENS process, the powder is delivered through theozzles and driven by inert gas flow. Therefore, it is reasonable tossume that forced convection will affect the heat transfer aroundhe laser beam position. For example, the gas-flow velocity at theowder nozzle is typically 30 m/s, correspondingly, the convec-ive heat transfer coefficient is of the order of 10 W/m2 K [2]. Theffect of the convective heat transfer coefficient on the thermalrofiles is shown in Fig. 9. It is observed that the effect of heat
ig. 8. Thermal profiles on the top surface of the sample from the center ofhe molten pool along the travel direction of the sample for different bottomemperatures and initial temperatures at t = 1.5 s.
630 L. Wang, S. Felicelli / Materials Science and Engineering A 435–436 (2006) 625–631
Fmh
fihfpbtf
mlpsdl
Fth
Ftc
totcdishtomodel the variation of thermal conductivity with temperature to
ig. 9. Thermal profiles on the top surface of the sample from the center of theolten pool along the travel direction of the sample as a function of convective
eat transfer coefficient at t = 1.5 s.
cient. Note also that the pool size changes significantly forigh heat transfer coefficients, but remains basically constantor low h’s. This is equivalent to say that when the depositedower dominates over heat loss, the pool size stays unaffectedy power changes; the excess power is conducted away throughhe part. This is consistent with the experimental data in Fig. 2or high laser powers.
Fig. 10 shows the effect of latent heat of melting on the ther-al profile at the top surface of the sample. The inclusion of the
atent heat in the simulation produces a lower maximum tem-erature at the center of the liquid pool but does not change the
ize of the pool. In addition, the effect of the latent heat is toecrease the temperature gradient (and the cooling rate) at theiquidus isotherm.ig. 10. Thermal profiles on the top surface of the sample from the center ofhe molten pool along the travel direction of the sample with and without latenteat at t = 1.5 s.
c
m
Fma
ig. 11. Thermal profiles on the top surface of the sample from the center ofhe molten pool along the travel direction of the sample as a function of thermalonductivity at t = 1.5 s.
Although in the previous calculations we used a constanthermal conductivity, it is known that the thermal conductivityf SS316 varies considerably within the range of temperatures ofhe process. To investigate the effect of the variation of thermalonductivity with temperature, we performed simulations withifferent constant values of the thermal conductivity. The resultsn Fig. 11 show that the length of the molten pool increasesignificantly with increasing heat conductivity. As expected, aigher pool temperature is obtained for higher thermal conduc-ivity because more energy is absorbed at the same travel velocityf the laser. This suggests that it is important to include in the
orrectly predict the pool size.Fig. 12 shows the effect of radiation emissivity on the ther-
al profiles. It is observed that there is no significant effect in
ig. 12. Thermal profiles on the top surface of the sample from the center of theolten pool along the travel direction of the sample as a function of emissivity
t t = 1.5 s.
and E
tpfsp
4
cmcieab
rictmwlipp
pttahaAtrc
sfd[
cweptpcioi
ea
vdbtemi
5
tbtdcpsmatbbaHwa
A
T(
R
L. Wang, S. Felicelli / Materials Science
he molten pool area, though there are some differences in therofiles away from the liquid pool, showing higher temperatureor reduced emissivity, as expected. Figs. 9, 11 and 12 are con-istent with the fact that most of the energy escapes from theool by heat conduction through the part.
. Summary of original results
The model developed in this work, although simple in itsonception, has been able to capture several features of the ther-al behavior of LENS-deposited parts, improving on prediction
apability with respect to previous models. When properly cal-brated to an experimental set up, the model confirms knownxperimental trends and delivers previously unknown thermalspects of the process. In the following, we illustrate these pointsy referring to the figures in the text.
Fig. 4 shows that the temperature profile can be predictedeasonably well both within and outside the molten pool. Thenclusion of the latent heat term in Eq. (5) is critical in order toapture the slope changes at the liquidus and solidus tempera-ures. In contrast with previous models, the temperature of the
olten pool is not preset, but calculated. We must observe thate are still ignoring many of the complexities of the real process,
ike solid phase transformations, interface undercooling, kinet-cs effects, marangoni convection, mushy zone solidification,orosity, segregation, etc., which may affect the temperaturerofile.
Fig. 5 gives two important pieces of information. First, itrovides a calculation of the amount of heat loss by convec-ion and radiation along the entire top of the part, includinghe molten pool. Integration of these heat flux profiles allowsquantitative justification of the usual assumption of dominanteat conduction in the process. Second, it reveals a consider-ble radiation loss from the molten pool and surrounding area.lthough this radiation may not be critical to the overall heat
ransfer in the part, it can certainly affect the phenomena occur-ing in the molten pool and the mushy zone, and it should beonsidered in any local pool model.
Fig. 6 provides a quantitative estimation of the edge effects,howing that the temperature profile is affected only within 5 mmrom the edge. It also gives information of the temperature gra-ients away from the pool. Similar profiles were shown in Ref.9] for a Ni-base alloy.
Figs. 7–12 contain the results of a new parametric study whichonvey significant insight in many aspects of LENS, some ofhich were discussed in the previous section. Particularly inter-
sting are the effect of the latent heat (Fig. 10), neglected inrevious models, and the change in temperature profiles withhe heat transfer coefficients (Fig. 9). The latter represents aotentially useful guide for controlling the molten pool size byhanging the gas flow from the powder nozzles. Also noteworthys the result of Fig. 7, which clearly illustrates how the increasef laser power reduces the temperature gradient at the liquidus
sotherm (1733 K) and consequently the cooling rate of the part.Although the foregoing results with this simple model lookncouraging, we must admit that there is still a long way tomodel-controlled LENS. The actual process has many more
[[
ngineering A 435–436 (2006) 625–631 631
ariables that need to be considered, like selection of theeposition pattern, powder flow rates, nozzle angles, idle timeetween deposited layers, etc. To achieve the goal of controllinghe residual stress in LENS-built parts, more comprehensivexperimentally validated models are needed which incorporateicrostructure prediction and microstructure-property relations
n their constitutive equations.
. Conclusions
A finite element thermal model was developed to calculatehe temperature distribution in SS316 plates during fabricationy the LENS process. The model predicts temperature contourshat agree qualitatively and quantitatively well with measuredata. The effects of the plate vertical edges on the temperatureontours were investigated. It was found that for the currentrocess parameters, the temperature contour will reach a steady-tate condition relative to a coordinate system attached to theoving laser beam when the laser beam moves to about 5 mm
way from the part edges. A parametric study shows that theemperature profile in the melt pool is not significantly affectedy small changes in thermal boundary conditions, the reasoneing that about 90% of the deposited laser energy is transportedway from the pool by thermal conduction through the part.owever, the laser power, thermal conductivity and its variationith temperature play an important role in the thermal profiles
nd the molten pool size.
cknowledgements
The authors appreciate the sponsorship of the U.S. ArmyACOM and the Center for Advanced Vehicular SystemsCAVS) of Mississippi State University.
eferences
[1] M.L. Griffith, M.E. Schlienger, L.D. Harwell, M.S. Oliver, M.D. Baldwin,M.T. Ensz, J.E. Smugeresky, M. Essien, J. Brooks, C.V. Robino, W.H.Hofmeister, M.J. Wert, D.V. Nelson, Proceedings of the Solid FreeformFabrication Symposium, The University of Texas at Austin, Austin, TX,1998, pp. 89–97.
[2] W. Hofmeister, M. Griffith, M. Ensz, J. Smugeresky, JOM 53 (2001) 30–34.[3] M.L. Griffith, E. Schlienger, L.D. Harwell, M.S. Oliver, M.D. Bald-
win, M.T. Ensz, J.E. Smugeresky, M. Essien, J. Brooks, C.V. Robino,W.H. Hofmeister, M.J. Wert, D.V. Nelson, J. Mater. Des. 20 (1999) 107–114.
[4] M.L. Griffith, M.T. Ensz, J.D. Puskar, C.V. Robino, J.A. Brooks, J.A.Philliber, J.E. Smugeresky, W.H. Hofmeister, Mater. Res. Soc. 625 (2000)9–20.
[5] W. Hofmeister, M. Wert, J. Smugeresky, J.A. Philliber, M. Griffith, M.T.Ensz, JOM 51 (7) (1999).
[6] R. Ye, Y. Zhou, W. Wei, J.E. Smugeresky, E.J. Lavernia, TMS (2003)369–376.
[7] L. Costa, R. Vilar, T. Reti, A.M. Deus, Acta Mater. 53 (2005) 3987–3999.[8] M. Grujicic, G. Gao, R.S. Figliola, Appl. Surf. Sci. 183 (2001) 43–57.[9] M. Grujicic, Y. Hu, G.M. Fadel, D.M. Keicher, J. Mater. Synth. Process 9
(2002) 223–233.10] D. Rosenthal, Trans. ASME 68 (1946) 849–866.11] A. Vasinonta, J.L. Beuth, M.L. Griffith, Proceedings of the Solid Freeform
Fabrication Symposium, The University of Texas at Austin, Austin, TX,2000.


![MODELLING FLOWS IN ENVIRONMENTAL AND CIVIL ENGINEERING · treated in terms of deposition and erosion under the generic term of sediment transport phenomena [24]. In this case, the](https://img.pdfslide.us/doc/110x75/5f141db53b951f35bd237dae/modelling-flows-in-environmental-and-civil-treated-in-terms-of-deposition-and-erosion.jpg)