Embed Size (px)
Citation preview

Analysis of the South African Energy Policy
Key Drivers
WEBB MEKO
Student number: 677517
Date: August 2015
Wits School of Electrical and Information Engineering

Analysis of the South African Energy Policy Key Drivers Webb Meko - 677517
ii
TABLE OF CONTENTS
ABSTRACT-----------------------------------------------------------------------------------------vii
CHAPTER 1. INTRODUCTION TO THE RESEARCH.......................................... 1
1.1 Introduction ............................................................................................... 1
1.2 Research Questions .................................................................................. 1
1.3 Research Approach .................................................................................. 2
1.4 Literature Survey ....................................................................................... 2
1.5 Findings and Reporting ............................................................................ 3
1.6 Significance of the Study ......................................................................... 3
1.7 Delimitations of the Study ........................................................................ 3
CHAPTER 2. LITERATURE REVIEW ON ENERGY POLICY .............................. 4
2.1 Introduction ............................................................................................... 4
2.2 Development of an Energy Policy............................................................ 6
2.2.1 Process of Formulating the Energy Policy ............................................................. 6
2.2.2 Energy Policy Objectives ....................................................................................... 7
2.2.3 Energy Policy Development Team ......................................................................... 8
2.2.4 Key Energy Factors Analysis ................................................................................. 9
CHAPTER 3. ANALYSIS OF GLOBAL ENERGY POLICIES ............................ 13
3.1 Introduction ............................................................................................. 13
3.2 Global General Policy Observations ..................................................... 16
3.2.1 Analysis of Selected Countries’ Energy Policies .................................................. 17
3.3 Spain and Portugal Observations .......................................................... 21
CHAPTER 4. ANALYSIS OF THE SOUTH AFRICAN ENERGY POLICY ......... 22
4.1 Introduction ............................................................................................. 22
4.2 Process of Energy Formulation ............................................................. 23
4.3 South African Key Energy Stakeholders ............................................... 24
4.4 South African Energy Policy .................................................................. 26

Analysis of the South African Energy Policy Key Drivers Webb Meko - 677517
iii
4.5 South African Energy Resources .......................................................... 27
4.5.1 Overview of Energy Resources............................................................................ 27
4.5.2 Coal ...................................................................................................................... 28
4.5.3 Oil and Gas .......................................................................................................... 30
4.5.4 Uranium ................................................................................................................ 33
4.5.5 Biomass ................................................................................................................ 36
4.5.6 Hydro .................................................................................................................... 38
4.5.7 Wind ..................................................................................................................... 39
4.5.8 Solar ..................................................................................................................... 40
4.6 Energy for Economic Development ....................................................... 42
4.7 South Africa’s Environmental Management ......................................... 46
4.7.1 Emission Reduction ............................................................................................. 47
4.7.2 Renewable Energy Development ........................................................................ 48
4.7.3 Energy Efficiency Management ........................................................................... 51
4.7.4 Schemes in the IDM Programme ......................................................................... 53
4.8 The Integrated Resource Plan 2010 (IRP 2010) .................................... 54
CHAPTER 5. ANALYSIS OF THE SOUTH AFRICAN DRIVERS OF ENERGY POLICY ......................................................................................... 55
5.1 Introduction ............................................................................................. 55
5.2 Current Energy Factors .......................................................................... 56
5.2.1 Climate Change Mitigation ................................................................................... 57
5.2.2 Resource Impact on Energy Policy ...................................................................... 59
5.2.3 Energy and Economic Development .................................................................... 60
5.2.4 Social Impact on Energy Policy Development ..................................................... 61
5.2.5 Summary of Energy Policy Key Drivers ............................................................... 62
CHAPTER 6. CONCLUDING REMARKS ........................................................... 64
REFERENCES ----------------------------------------------------------------------------------- 65

Analysis of the South African Energy Policy Key Drivers Webb Meko - 677517
iv
LIST OF FIGURES
Figure 1.1: Research approach ................................................................................... 2
Figure 2.1: Energy policy development and implementation steps ............................... 5
Figure 2.2: Energy policy formulation process ............................................................. 6
Figure 2.3: Key factors in the energy policy [Source: Researcher’s own] ..................... 9
Figure 3.1: World electricity generation from 1971 to 2012 ........................................ 13
Figure 3:2: World electricity CO2 emissions from 1973 to 2012 ................................. 14
Figure 3.3: Global nameplate installed electricity capacity versus net generation, ..... 16
Figure 3.4: Spain Energy Sources ............................................................................. 17
Figure 3.5: Spain energy mix Source: WEC, 2013 ..................................................... 18
Figure 3.6: Spain forecasted energy mix ................................................................... 18
Figure 3.7: Portugal energy consumption .................................................................. 19
Figure 3.8: Portugal renewable energy resources 2004 ............................................. 19
Figure 3.9: Portugal cumulative wind energy capacity ............................................... 21
Figure 4.1: Energy stakeholders ................................................................................ 24
Figure 4.2: World coal producer ranking .................................................................... 28
Figure 4.3: World coal reserves by bituminous classification ..................................... 29
Figure 4.4: South Africa gas consumption ................................................................. 30
Figure 4.5: Energy stakeholders (highlights the importance of NERSA) .................... 35
Figure 4.6: South Africa hydro power Infrastructure ................................................... 38
Figure 4.7: South African wind resources .................................................................. 39
Figure 4.8: South Africa solar irradiation levels .......................................................... 41
Figure 4.9: Economic transformation framework energy ............................................ 43
Figure 4.10: Economic transformation framework energy ............................................ 44
Figure 4.11: REIPPP economic developments elements ............................................. 45
Figure 4.12: Emission by sector in South Africa ........................................................... 47
Figure 4.13: Demand side management key players ................................................... 52
Figure 5:1: South Africa Planned Energy Mix, 2030 ................................................... 55
Figure 5.2: Challenges in South African energy sectors ............................................ 56
Figure 5:3: Electricity industry CO2 emission forecast ................................................... 58
Figure 5:4: Findings of South African Energy Policy Drivers ...................................... 63

Analysis of the South African Energy Policy Key Drivers Webb Meko - 677517
v
LIST OF TABLES
Table 3.1: Coal power generation ............................................................................. 14
Table 4:1: Global uranium production, 2010 (Uranium Mining in Africa, Governance of
Africa Resources Programme) ................................................................. 33
Table 4:2: Types of biofuel sources .......................................................................... 36
Table 4:3: Summary of energy potential from biomass in South Africa ..................... 37
Table 4.4 Wind classification ................................................................................... 39
Table 4.5: Refit Phase I and II proposed tariffs. ........................................................ 49
Table 4.6: Renewable energy IPP energy allocations ............................................... 50
Table 4.7: IRP 2010 RBS total generating capacity in 2030 ..................................... 54

Analysis of the South African Energy Policy Key Drivers Webb Meko - 677517
vi
LIST OF ABBREVIATIONS USED
CCGT Combined Cycle Gas Turbine
CERs Certified Emission Reductions
CO2 Carbon Dioxide
CSP Concentrating Solar Power
DME Department of Minerals and Energy
DNI Direct normal irradiation
DoE Department of Energy
DMR Department of Mineral Resources
DSM Demand Side Management
DTI Department of Trade and Industry
DWAF Department of Water Affairs
EEDSM Energy Efficiency Demand Side Management
EIA Environmental Impact Assessments
CFB Circulating Fluidised Bed
FGD Flue Gas Desulphurisation
GDP Gross Domestic Product
GHG Greenhouse gases
GJ Gigajoule
GW Gigawatt
GWh Gigawatt hours
IEA International Energy Agency
IPAP Industry Policy Action Plan
IPPs Independent Power Producers
IRP Integrated Resource Plan
LNG Liquefied Natural Gas
LOLP Loss of load probability
LTMS Long-term mitigation scenarios
MTPPP Medium Term Power Purchase Programme
MW Megawatt
MYPD Multi-Year Price Determination
NERSA National Energy Regulator of South Africa;
NOx Nitrogen Oxide

Analysis of the South African Energy Policy Key Drivers Webb Meko - 677517
vii
OCGT Open Cycle Gas Turbine
PPA Power purchase agreement
PV Photovoltaic
REFIT Renewable energy feed-in tariff
SWH Solar water heaters
TJ Tera joule
TWh Tera Watt hours
WASA Wind Atlas for South Africa

Analysis of the South African Energy Policy Key Drivers Webb Meko - 677517
viii
ABSTRACT
The energy landscape is experiencing major changes globally. These changes
are influenced and driven by various factors such as climate change, economic
drivers, development and sustainability of base load energy demand. This has
placed the onus on governments to optimally manage available energy resources.
Have changes in the global energy landscape altered the South African energy
objectives, and have they influenced the factors that drive the country’s Energy
Policy? This research study analyses how the South African energy policy has
developed over time and highlights the key drivers to date.
The findings of research study indicates that the key drivers of South African
Energy policy are reduction in greenhouse gas emissions, economic growth and
realising social development objectives. Policy makers continue to face critical
choices in meeting the energy demand, optimising energy resources, managing
greenhouse gas emissions and realising set economic objectives pursuant to
formulating a policy that caters for the country’s requirements.

Analysis of the South African Energy Policy Key Drivers Webb Meko - 677517
1
CHAPTER 1. INTRODUCTION TO THE RESEARCH
1.1 Introduction
In South Africa, energy policy has been an important feature of the public dialogue in
recent years. There have been debates and varying views around climate change,
the growing power generation capacity deficit, and the development of various
energy technologies to cater for the country’s energy demand.
As demand continues to exceed available supply and reserve margins decrease,
South Africa continue to face the challenge of catering for energy demand. The
South African government is exploring ways to meet the country’s energy
requirements sustainably. How it addresses the country’s energy requirements
hinges on the direction of its energy policy.
1.2 Research Questions
The direction of South African energy policy has evolved over time from an energy
sector dominated by fossil fuel to the planned balanced power mix that promotes the
inclusion of renewable energy sources.
What are the key drivers of the energy policy that have led to the transformation of
South Africa’s energy sector?
Have the following factors influenced the energy policy?
Energy resource availability
Economic growth
Climate change
Social development
Energy import and export options

Analysis of the South African Energy Policy Key Drivers Webb Meko - 677517
2
1.3 Research Approach
The research was conducted and concluded using a three step approach as outlined
in Figure 1.1. The process entailed research design, literature survey and analysis,
and was concluded by reporting on the findings.
Figure 1.1: Research approach
1.4 Literature Survey
This research study seeks to understand and identify the key drivers of the South
African energy policy. To achieve this, related literature was reviewed both in the
South African context and globally.
The literature review included an analysis of the South African energy policy and
other related government policies. Information between policies was then correlated
to determine convergence and similarities. The Integrated Resource Planning 2010
document was also analysed to determine the current policy direction from the
strategic planning perspective.
Further literature survey was conducted to determine energy policy trends globally.
Energy policies of selected countries were reviewed to determine global policy
direction. The global trends were then assessed to determine how they have
influenced South African energy policy and to determine whether they are also key
drivers.

Analysis of the South African Energy Policy Key Drivers Webb Meko - 677517
3
1.5 Findings and Reporting
The third and final step was the analysis of the findings through collating the data
from the surveyed literature to answer the posed research questions. The findings
are presented in this research document
1.6 Significance of the Study
South Africa, as observed in the Integrated Resource Plan 2010 (IRP 2010), has
embarked on a noble yet challenging mission of transforming the energy mix as it
plans to develop an additional renewable energy and nuclear power capacity of 37
GW by year 2030.
This research study assesses and seeks to understand current South African energy
policy and consequently determine its key drivers and how these drivers are likely to
shape the South African power mix in the future
1.7 Delimitations of the Study
The study assesses the energy policy key drivers starting from the development of
the 1998 White Paper on energy. Energy policy developments prior to 1998 were
not assessed.
Due to the relatively small size of oil and gas in South Africa, the focus is primarily on
the energy sector as it relates to power generation for the production of electricity.
Energy resources that are researched are mainly coal, gas, hydro, nuclear, wind,
concentrated solar power, and photovoltaic of installed plant capacity of 50MW and
larger. The study does not assess nor compare the various technologies and energy
resources.

Analysis of the South African Energy Policy Key Drivers Webb Meko - 677517
4
CHAPTER 2. LITERATURE REVIEW ON ENERGY POLICY
2.1 Introduction
A government policy comprises general principles that guide a government or
legislature in the management of public affairs, with key objectives for the welfare
and prosperity of the state and its people [3]. Government policies represent a point
of departure for planning and ultimately determine the course of action for
implementation.
Governments use policies to manage a wide range of state affairs from education,
immigration, land rights, energy, etc. Policies are developed by government
departments and during development may be influenced in various ways by
stakeholders such as political parties, civil groups, community groups, business
community, and non-governmental organisations.
Energy resources are crucial assets and major contributors to many countries’ Gross
Domestic Product (GDP) growth, consequently they are important resources that
must be well managed by any country.
Management of energy resources is normally outlined in the country’s energy policy.
This guiding document outlines how a country plans to manage its energy resources
to ensure that they are secured and sustainable for the beneficial use of its people
[3]. Most governments place the management of energy resources and the
development of the policy under the auspices of an organisation like South Africa's
Department of Energy
Key features of an energy policy include guidelines on energy production, energy
conservation, regulation, legislation, import and export of energy, international
treaties, incentives to investment, emissions guidelines, taxation, and other related
government policies that will impact on the availability and sustainability of energy
resources.

Analysis of the South African Energy Policy Key Drivers Webb Meko - 677517
5
The crucial first step towards the effective management of energy resources is the
development of energy policy. As shown in Figure 2.1, the next step after the energy
policy is developed is to formulate the energy strategic plan. This plan is based on
the direction set out in the policy and outlines how the policy will be realised.
Once the strategic plan is finalised, an execution plan is developed detailing how the
government and other energy stakeholders will interface to implement the developed
plan.
Policy implementation is the final step of the process entailing the construction of the
physical energy infrastructure. Implementation requires the government to have
acquired resources which include the ability to finance, skills and capacity. Due to
external market influences, the strategic plan often requires adjustment during
implementation. Implementation includes government departments, state-owned
institutions and the private sector.
Figure 2.1: Energy policy development and implementation steps

Analysis of the South African Energy Policy Key Drivers Webb Meko - 677517
6
2.2 Development of an Energy Policy
The energy policy is often the responsibility of governments with the designated
department (usually a Ministry of Energy) leading the development. Government's
overarching responsibility is to ensure that policies are integrated and work
collectively towards the advancement of common country objectives
2.2.1 Process of Formulating the Energy Policy
The process of developing an energy policy differs from one country to another, as
does the level of consultation with the public and stakeholders. The process is
government led; outside stakeholders are included to supplement the overall team.
The mapped process as depicted in Figure 2.2 outlines five key steps followed by
most governments in formulating the energy policy. The responsibility of managing
state resources rests with the designated government department mandated for this
task.
Figure 2.2: Energy policy formulation process

Analysis of the South African Energy Policy Key Drivers Webb Meko - 677517
7
2.2.2 Energy Policy Objectives
The first and most critical step is setting out policy objectives. Energy policy
direction influences other sectors, including energy-intensive industries. Therefore
there has to be consistency and alignment of objectives with other related
departments that will be affected by the policy. This takes place primarily through
integrating overall government objectives and in related industries such as transport,
environment and minerals.
Although guiding principles may be identical in the development of the policy, the
objectives may vary vastly depending on challenges and resources specific to the
country. Consequently, energy policy objectives take into consideration internal
country interests’ as well external factors related to the global influence of the
country’s energy sector, such as the following:
Securing and sustaining energy resources.
Economic development.
Managing the environment.
Increasing electricity access.
Managing energy demand.
Energy objectives have to be linked to other objectives of the country, economic
development being a case in point. Accessibility and affordability of electricity has a
direct influence on the level of industrialisation. A country's inability to cater for the
energy demand will adversely affect foreign investment in energy-intensive
industries, as is also the case when the cost of electricity is relatively high and often
unaffordable.
Securing and sustaining energy resources relates to how available resources can be
developed to useful beneficiation of the people. This entails accurately assessing
present and future available energy resources and understanding the demand in
order to determine reserves. Government must then develop alternatives in the
event of a deficit of resources in relation to supply.

Analysis of the South African Energy Policy Key Drivers Webb Meko - 677517
8
2.2.3 Energy Policy Development Team
2.2.3.1 Government departments
As part of its oversight responsibilities, the government department responsible for
energy could have additional portfolios, such as minerals and water. The core team
is drawn mainly from within the designated ministry. However, depending on
capacity and expertise levels, external energy experts and practitioners’ services
may be procured to augment the core team. The inclusion of both government and
external experts creates a diverse team and engenders consideration of a variety of
perspectives. Related government departments whose inputs are critical to the
energy policy include those that will be directly or indirectly impacted. The
departments of water, environment, minerals, and mining usually have vested
interests in the development of the energy policy.
The reduction in greenhouse gas (GHG) emissions is a prime focus area in the
energy sector with regard to environmental impact. Any ministry of environment will
have a vested interest in how this is addressed [2]. The same applies to a
department of water if it does not reside within the same ministry. This department
would be interested in how energy policy addresses water conservation, especially
technologies that require excessive use of water such as coal-fired power plants.
The reduction in greenhouse gas (GHG) emissions is a prime focus area in the
energy sector with regard to environmental impact. The Ministry of Environment will
have vested interest in how this is addressed in the energy policy [2]. The same
applies to the Department of Water if it does not reside within the same ministry.
2.2.3.2 Energy regulator
The energy regulator plays an important role in the energy sector to ensure that the
energy policy objectives are realised within the confines of compliance to regulation.
The regulator is an independent body ensuring oversight and compliance of various
stakeholders including utilities, independent power producers, and distributors of
electricity.

Analysis of the South African Energy Policy Key Drivers Webb Meko - 677517
9
2.2.4 Key Energy Factors Analysis
Factors that drive the energy policy are primarily concerned with catering for energy
demand in a manner that allows for safe, sustainable management of available
energy resources.
This implies that an ad hoc approach to energy demand management is inadequate
as various factors have to be taken into account, including:
Energy resources availability.
Present and future management of energy resources.
Development of power generation, transmission and distribution of electricity.
Import and export of electricity.
Present and future cost of electricity.
Energy impact on the environment.
Energy accessibility.
Economic impact of energy.
Impact of energy on national security and safety.
These key factors can be illustrated as inputs to policy which enables appropriate
plans to be developed leading to implementation as shown in Figure 2.3.
Figure 2.3: Key factors in the energy policy

Analysis of the South African Energy Policy Key Drivers Webb Meko - 677517
10
2.2.4.1 Energy resources
Energy resources are not infinitely available, necessitating stringent management of
present resources and the continued exploration of future options. Therefore
available resources reserves have to be quantified in terms of the future projections
and in relation to the current rate of consumption.
These factors have to be aligned and their potential impact on set objectives
assessed. Available resources such as coal harm the environment and strain or limit
energy resource options available for consideration. Renewable energy sources
such as wind may be inadequate to cater for base load demand and may be
relatively expensive, which would impact on the cost of electricity and, consequently,
the national economy [8]. Inability of available energy resources to cater for a
country’s demand may result in an energy crisis.
2.2.4.2 Environment
Energy is one of the leading greenhouse gas (GHG) emitters. Consequently, the
management of the environment has become a prominent energy policy issue.
Efforts to reduce greenhouse gas emissions have influenced the development of
energy resources that are less harmful to the environment [3] [10].
Several mechanisms, such as a carbon tax, have been mooted to curb the
production of energy from sources that emit GHGs, such as coal [9]. Globally, there
is a drive to equip existing and new coal power plants with emission reduction
devices such as carbon capture and storage, and flue gas desulphurisation (FGD).
The development of renewable energy sources (RES) has also been incentivised
through various programmes and schemes, including, in South Africa, the
Renewable Energy Feed-In Tariff (REFIT) [4] [10]. This has since been replaced
with a competitive bidding scheme.

Analysis of the South African Energy Policy Key Drivers Webb Meko - 677517
11
2.2.4.3 Energy import and export
Countries have varying levels of energy resources. Through integrated electrical
transmission networks, power can be imported or exported between countries.
Countries like France export power to several neighbouring countries and South
Africa has been a net exporter of power in Southern Africa [10].
In the Southern African region, the Southern African Power Pool was formed with the
objective of integrating the regional electrical transmission networks. As a collective
the region had surplus of installed generation capacity, mainly supplied from South
Africa. This implied that there was no need for other countries like Botswana,
Swaziland and Mozambique to build additional power generation capacity.
Therefore part of resource management includes options to procure energy
resources from those countries that have a surplus. However regional integration is
imperative in order to be able to optimise energy imports and exports.
2.2.4.4 Power transmission and distribution
Power generated from available resources has to be transmitted then distributed to
the end user via an electrical grid. This comprises the transmission network, which
transmits electricity from generation power plants via a high voltage electrical
network normally ranging from 132kV to 1000kV. The transmitted power is then
stepped down to a distribution level for consumption by the end user. Distribution
levels also differ per power utility and the voltage can range from 44kV to 11kV at the
medium voltage level and 400V line voltage and 230V phase voltage at the lower
voltage level.
Advanced economies around the globe have been made possible through robust,
secured, and accessible modern energy infrastructure. Grid capacity and availability
is crucial to afford access to electricity for lighting and heating, and enable the
provision of essential services such as health care, education, and water which
translates into better quality of life for all [10].
Analysis of the South African Energy Policy Key Drivers Webb Meko - 677517
12
2.2.4.5 Energy sector liberalisation
Traditionally, many electricity industries are developed and operated within strictly
regulated frameworks through state organs. Regulated frameworks are those in
which most or all activities from generation, transmission to distribution of power are
handled within vertically integrated state-owned utilities [12].
Liberalisation also known as Deregulation of the energy sector refers to the process
of allowing private-sector companies to produce and sell energy [12]. The degree of
liberalisation varies from wholly state-owned to a hybrid of Independent Power
Producers (IPPs) and state-owned utilities, and to the extreme, fully liberalised
privately owned IPPs [12].
The first serious attempt to form a liberalised electricity market was launched by
Chile in 1982. England and Wales pioneered the way with the first market launch in
1990 [12]. Today, there are several countries that have had successfully operating
IPPs for a number of years.
Several factors have driven the liberalisation of the market and encouraged other
countries to follow in the same direction and these include:
Inefficiencies in vertically integrated state owned utilities.
Disproportionate focus on power supply.
Power generation capacity mismatch.
Growing construction cost of new power plants
Poor DSM initiatives.
Various countries have applied different steps to progress through the different
phases of the liberalisation process. In some countries, a first natural step was to
open opportunities for competition between IPPs and incumbent utilities [12].
Other countries introduced the concept of contestability in various steps by giving
electricity consumers the freedom to choose their supplier in different steps over
time, depending on their level of electricity consumption [12].

Analysis of the South African Energy Policy Key Drivers Webb Meko - 677517
13
CHAPTER 3. ANALYSIS OF GLOBAL ENERGY POLICIES
3.1 Introduction
The global energy landscape is in constant flux due to changes in the global
economy as well as advancements in energy technology. As the energy landscape
continues to change, so do the energy policies of most countries. This is in
response to, and keeping pace with, sustaining and securing energy resources while
remaining consistent with international commitments [1].
Over time energy policies have shifted focus and objectives have adjusted in
alignment with international best practice. These changes in energy policy have also
impacted the power generation mix globally. While total generated power has
increased in excess of 300% over the last four decades, as depicted in Figure 3.1,
coal remains the leading source of power generation. As at 2012, coal accounts for
40.4% of world power generation capacity [1].
Nuclear has experienced the largest growth, from 3.3% to 10.9% [1]. Hydropower
contribution declined from 20.9% to 16.2% between 1973 to 2012. However the
sharpest decline is by oil, from 24.8% to 5%.
Source: Energy Information Administration, Annual Energy Outlook 2012 [1]
Figure 3.1: World electricity generation from 1971 to 2012
Analysis of the South African Energy Policy Key Drivers Webb Meko - 677517
14
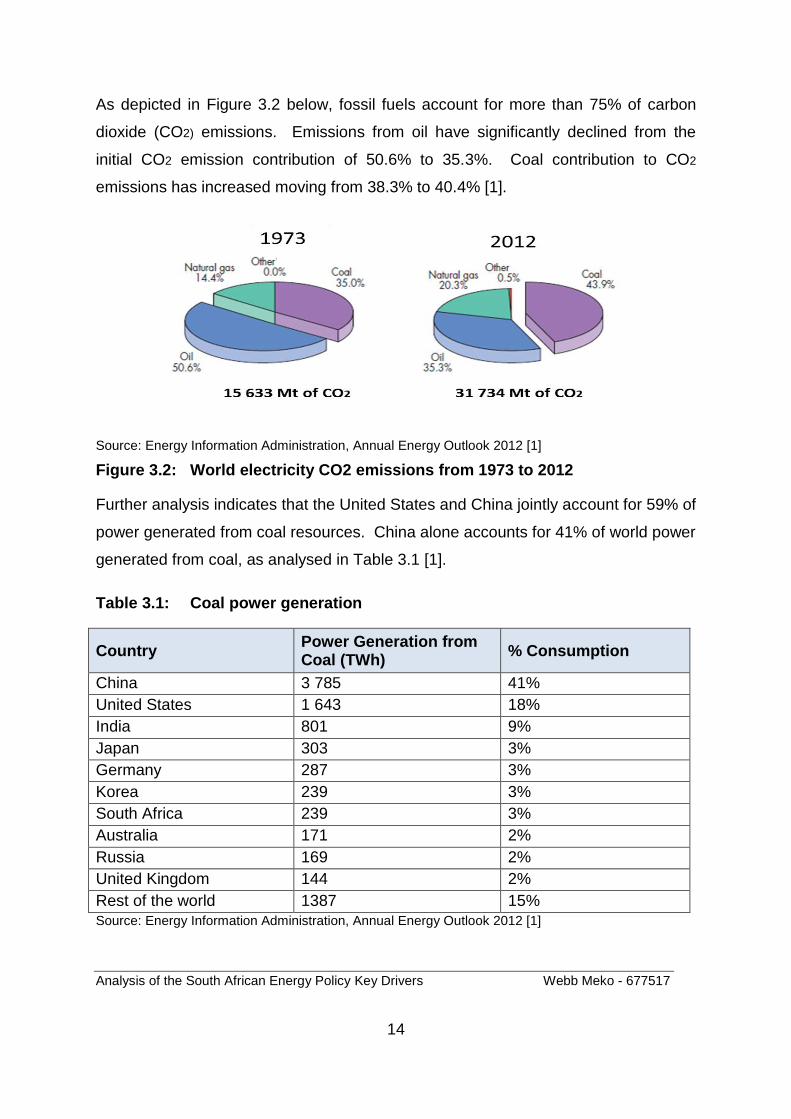
As depicted in Figure 3.2 below, fossil fuels account for more than 75% of carbon
dioxide (CO2) emissions. Emissions from oil have significantly declined from the
initial CO2 emission contribution of 50.6% to 35.3%. Coal contribution to CO2
emissions has increased moving from 38.3% to 40.4% [1].
Source: Energy Information Administration, Annual Energy Outlook 2012 [1]
Figure 3.2: World electricity CO2 emissions from 1973 to 2012
Further analysis indicates that the United States and China jointly account for 59% of
power generated from coal resources. China alone accounts for 41% of world power
generated from coal, as analysed in Table 3.1 [1].
Table 3.1: Coal power generation
Country Power Generation from Coal (TWh)
% Consumption
China 3 785 41%
United States 1 643 18%
India 801 9%
Japan 303 3%
Germany 287 3%
Korea 239 3%
South Africa 239 3%
Australia 171 2%
Russia 169 2%
United Kingdom 144 2%
Rest of the world 1387 15%
Source: Energy Information Administration, Annual Energy Outlook 2012 [1]
Analysis of the South African Energy Policy Key Drivers Webb Meko - 677517
15
Regional CO2 emission analysis indicates a correlation between fuel sources used
for power generation, as reflected in Table 3.1. Chinese emission levels have
increased substantially from 5.8% to 26% during this period. OECD (Organisation of
Economic Co-operation and Development) countries’ emissions have plateaued,
despite an increase in power-generation capacity. This translates into an overall
decline from 66.1% contribution to 38.3% between 1973 and 2012 [1].
The main concern of climate change is global warming, which is based on the
‘greenhouse’ effect. Water vapour, carbon dioxide (CO2), methane CH4, nitrous
oxide (N2O), and ozone (O3) are referred to as greenhouse gases [5]. Despite an
increase in power generation from fossil fuels, OECD countries have demonstrated
reductions in CO2 emissions (a key objective of many countries’ policies) by
employing measures such as energy efficiency and the promotion of renewable
energy sources [5].
The International Energy Agency, which has 28 member countries, has highlighted
milestone changes in the energy policies in the following areas:
General energy policy.
Energy efficiency.
Renewables.
Oil and gas.
Research and development.
Major energy policy changes have been at the forefront in setting out emission
reduction initiatives. Analysed trends show changes in how the power sector has
evolved in the last 10 years in both developed and developing countries.

Analysis of the South African Energy Policy Key Drivers Webb Meko - 677517
16
3.2 Global General Policy Observations
Coal accounts for 36.6% of the world’s installed capacity, and 46% of generated
power, as shown in Figure 3.3. Electricity production from fossil fuels (coal, gas, and
oil) makes up approximately 65% of global power generation [10]. However, in
2012, the net investment in renewable power capacity outpaced that of fossil fuel
generation [10].
Based on higher investments in new renewable power capacity relative to traditional
fossil fuels, the projected global energy mix, as depicted in the Figure 3.3, reflects a
decline in coal.
The global share of generation output from renewable technologies is expected to
rise from approximately 23% in 2010 to around 34% by 2030. Wind and solar are
forecasted to continue dominating the renewables space. Wind (onshore and
offshore) is projected to rise from 5% in 2012 to 17% of installed capacity by 2030.
Source: World Energy Council, World Energy Perspective 2013 [16]
Figure 3.3: Global nameplate installed electricity capacity versus net generation

Analysis of the South African Energy Policy Key Drivers Webb Meko - 677517
17
3.2.1 Analysis of Selected Countries’ Energy Policies
Energy transformation is an approach that has been adopted by most countries and
which has an impact at global level. Transformation is aimed at reducing the
adverse impacts of climate change [1] [8]. Spain and Portugal are currently amongst
countries that have demonstrated the type of radical energy transformation geared
towards addressing climate change and reducing energy production from fossil fuels.
3.2.1.1 Spain Energy Sector Analysis
Spain is the fifth largest energy consumer in Europe and has an installed power
generation capacity of 100 GW against the country’s current peak demand of 44
GW. Strong government support for the development of renewable energy sources
coupled with the sudden and severe economic crisis, has led to this situation of
overcapacity [20].
Spain’s power mix is dominated by fossil fuel, mainly natural gas which contributes
37,2% and renewables account for 24,7%. Renewable Energy Sources are driven
mainly by wind and hydro and respectively contribute12,4% and 9% [1].
Source: World Energy Council, World Energy Perspective 2013 [16]
Figure 3.4: Spain Energy Sources

Analysis of the South African Energy Policy Key Drivers Webb Meko - 677517
18
Spain has grown from just 2% wind and solar power to almost 20% in a period of ten
years. Figure 3.5 demonstrates this growth at the same time as electricity
consumption grew rapidly by 50% from 2000 to 2008 [20]. However, the global
recession caused rapid price induced conservation since 2008. Spain now enjoys
about 35% energy from renewable energy sources. This includes large hydroelectric,
with the rest of Spain’s energy coming from natural gas, coal and nuclear.
Source: World Energy Council, World Energy Perspective 2013 [16]
Figure 3.5: Spain energy mix Source: WEC, 2013
Spain remains on a positive trajectory that seeks to upscale the development of RES
and continue to reduce the use coal as depicted in the Figure 3.6.
Source: World Energy Council, World Energy Perspective 2013 [16]
Figure 3.6: Spain forecasted energy mix

Analysis of the South African Energy Policy Key Drivers Webb Meko - 677517
19
3.2.1.2 Portugal Energy Sector Analysis
Portugal’s energy mix is highly dependent on imported oil and gas, which collectively
account for 69% of the total energy consumption as depicted in Figure 3.7.
Source: Global Wind Energy Council 2011 [4]
Figure 3.7: Portugal energy consumption
In Portugal, the renewable energy power generation is dominated by hydro energy.
In 2004, hydro contributed 9869 GWh (Gigawatt hours) out of a total green electricity
production of 12 214 GWh. With a production of 1 264 GWh, solid biomass was
ranked second highest as a renewable energy source in 2004. However, the overall
trajectory indicates that there was minimal growth of renewables.
Although biogas, PV (photovoltaic) and onshore wind have low penetration levels
they are experiencing considerable growth. Average annual growth rates of these
technologies have been 47%, 62% and 54% respectively between 1997 and 2004.
By 2005, the biogas sector had further doubled its production from 15 GWh in 2004
to 34 GWh in 2005. The onshore wind power sector doubled its capacity from 552
MW in 2004 to 1021 MW in 2005 [6].
Source: World Energy Council, World Energy Perspective 2013 [16]
Figure 3:8: Portugal renewable energy resources 2004

Analysis of the South African Energy Policy Key Drivers Webb Meko - 677517
20
Portugal approved a new National Energy Strategy in 2005, replacing its 2003
strategy [3]. This new strategy redefined major political guidelines and relevant
measures in the energy area. The following principal objectives were outlined in the
National Energy Strategy:
To guarantee security of energy supply, by diversifying primary resources and energy services and promoting energy efficiency.
To stimulate and encourage competition, protecting consumers and promoting corporate competitiveness and efficiency.
To guarantee the environmental adequacy of the energy process as a whole, reducing its environmental impacts on a local, regional and national level.
The major strategic guidelines established to achieve these three objectives
included:
The liberalisation of the electricity, gas and fuel markets.
Creation of a competitive structural framework.
Growth of renewable energy supply; promotion of energy efficiency.
An efficient and environmentally sound public supply of energy.
Reorganisation of the energy sector tax and incentive systems.
Energy perspective, innovation and communication.
Awareness and assessment of national energy strategy.
Portugal has demonstrated bold energy policy transformation over the years, as
seen in the wind and solar energy growth from 2% in 2005 to over 15% by the end of
2009. Portugal implemented a stable feed-in tariff for renewable energy.
Guaranteed feed-in tariffs were applicable for electricity produced from cogeneration,
renewable resources except for large-scale hydropower installations and
endogenous resources. [3]. The Decree-Law 189/88 established the legal basis for
the feed-in of electricity from independent power producers and grid operators are
obliged to purchase any offered renewable electricity from IPPs [20].

Analysis of the South African Energy Policy Key Drivers Webb Meko - 677517
21
The Renewable Energy Feed-in-Tariff (REFIT) assisted in accelerating Portugal’s
renewable energy programme. Portugal is now one of the leading countries in
Europe in terms of wind power penetration of 17,6% of the total energy demand.
The 2011electricity demand was met by over 4GW of wind power capacity as shown
in Figure 3.9.
Wind energy is now the second most developed renewable source, after
hydropower. Portugal adopted a target of achieving 20% of its energy consumption
from renewables by 2020 under its National Renewable Energy Action Plan.
By 2020, Portugal intends to be generating 60% of its electricity from renewable
resources, in order to satisfy 31% of its final energy consumption.
Source: World Energy Council, World Energy Perspective 2013 [16]
Figure 3.9: Portugal cumulative wind energy capacity
3.3 Spain and Portugal Observations
Spain and Portugal have succeeded in formulating energy policies that enabled
transformation of their respective energy portfolios. Portugal has managed to
substantially increasing their renewable energy power generation capacity. Spain
has equally achieved in excess of 35 percent total renewables installed power
generation capacity including large hydro power plants.
South Africa has also set radically emission reduction targets to be reached in 2030.
Are approaches followed by Spain and Portugal in driving energy transformation
through policy change applicable to South Africa?

Analysis of the South African Energy Policy Key Drivers Webb Meko - 677517
22
CHAPTER 4. ANALYSIS OF THE SOUTH AFRICAN ENERGY POLICY
4.1 Introduction
The last energy policy White Paper before the advent of the democratic dispensation
was published in 1986 [6]. The first energy policy White Paper under the democratic
government was published by the Department of Minerals and Energy (DME) in
December 1998
The development of the 1998 White Paper Energy Policy adopted a widely
consultative process, emphasis was placed on transparency and the integration of
the policy process. Prior to the finalisation and publication of the policy, the process
began with wider consultation and transparency in 1994. The 1998 White Paper
outline a set of objectives and the consultative allowed for inputs from various
stakeholders within the energy sector.
Once the Energy policy was finalised a strategic planning document referred to the
IRP 2010 was developed.
The IRP 2010 Revised Balanced Scenario (IRP 2010 RBS) detailed how the energy
policy direction as outlined in the 1998 Energy Policy White Paper would be realised.
The IRP 2010 RBS was developed through wide consultative processes involving
the public, and it indicated the following key considerations [2]:
Reducing carbon emissions.
New technology uncertainties such as costs, operability, lead time to build etc.
Water usage.
Localisation and job creation.
Southern African regional development and integration.
Security of supply.

Analysis of the South African Energy Policy Key Drivers Webb Meko - 677517
23
4.2 Process of Energy Formulation
Based on transparency and inclusiveness, the process for the development of the
South African energy policy drew on the greatest possibly variety of inputs. The
process was begun in 1994 by a team of multi-disciplinary experts that delivered an
Energy Discussion Document also referred to as the Green Paper [6].
The Energy Policy Discussion Document was followed by public consultation with
the objective of gathering public views. This document was then released for public
written comment in 1995 and a number of workshops were held to gather public
written information [6].
In 1995, a team of individuals was selected on the basis of the level of their expertise
to focus on specific energy issues. The contributions of these selected individuals
were then edited by an editorial committee to produce a draft White Paper [6].
The approach adopted followed the following key steps
Recognition of the problem
Identification of underlying causes
Identification of solutions
Implementation of solutions
Monitor and evaluate solutions effects
International influence has redefined the role governments as international
multilateral lending agents continue funding the development of energy
infrastructure. These international pressures and opportunities impact on South
Africa’s energy sector, and eventually, the local economy. Government has also
recognised and factored the influence of the international world, into the formulation
on the energy policy. In addition, as a member of the Southern African Development
Community (SADC), South Africa had to take regional energy matters into account in
formulating the policy.

Analysis of the South African Energy Policy Key Drivers Webb Meko - 677517
24
4.3 South African Key Energy Stakeholders
The energy sector includes a number of stakeholders comprising governmental and
non-government entities. These stakeholders have varying levels of influence on
policy direction. The energy sector is then governed through the interaction of
government, regulatory, and industry stakeholders, as depicted in Figure 4.1.
Figure 4.1: Energy stakeholders
Power industry players include the state-owned utility Eskom, which accounts for
more than 90% of the country’s power generation capacity. Most redistributors are
municipalities that buy electricity from Eskom and resell to the end consumer.
Presently most Independent Power Producers (IPPs) are in the renewable energy
space. The process of energy policy development is overseen by the DoE in
consultation with relevant stakeholders to ensure inclusivity.
Government oversight is mainly undertaken by the Department of Energy,
Department of Public Enterprise (DPE), and the National Treasury. Energy sector
regulation and licensing is the responsibility of the National Energy Regulator of
South Africa (NERSA).

Analysis of the South African Energy Policy Key Drivers Webb Meko - 677517
25
NERSA plays a critical role in supporting that government energy objectives are met.
This is largely achieved through regulating the three key industries which are
petroleum, electricity and piped-gas through a set of distinct regulatory functions.
Electricity consists of four departments, piped-gas consists of two departments, and
petroleum pipelines consist of two departments.
NERSA is a regulatory authority which has the following seven divisions:
Electricity Regulation.
Piped-gas regulation
Petroleum Pipelines Regulation.
Human Resources.
Finance and Administration.
Corporate Services.
Special Support.
The energy industry in South Africa has significantly expanded in recent years. The
industry is experiencing several particular challenges, including the introduction of
IPPs, and security of supply.
NERSA performs an important role in supporting the Renewable Energy
Independent Power Producers Programme (REIPPP). The primary role is oversight
in facilitating the inclusion of private players in the energy market and also
addressing the challenge of supply shortage by endorsing the right tariffs for IPPs to
enable them to bring onto the grid the required power.
Challenges of climate change and emissions regulation have also put additional
pressure on energy regulation. These challenges have upped the stakes on how the
National Energy Regulator of South Africa (NERSA) creates customer value and
develops its people while upholding the interest of South African society as a whole.
Analysis of the South African Energy Policy Key Drivers Webb Meko - 677517
26
4.4 South African Energy Policy
Current South African energy policy stems from an Energy Policy Discussion
Document, informally referred to as the Green Paper, initiated in 1995 to gather
public views and inputs on the country’s energy sector. The Energy Policy White
Paper was finalised and released in 1998 taking into account written inputs from the
discussion document.
Since the issuing of the White Paper on Energy Policy in 1986, South Africa has
undergone various changes. The advent of a democratically elected government
implied a new energy resource management vision inclusive of all South African
citizens. The new democratically elected government formally launched the Energy
Policy White Paper process in 1994 to replace the 1986 White Paper on energy
policy
During the development of the 1998 Energy White Paper the following objectives
were prioritised:
Increasing access to affordable energy services.
Improving energy governance.
Stimulating economic development.
Managing energy related environmental impacts.
Securing supply through diversity.
The Integrated Resource Plan 2010 (IRP 2010), which is a strategic planning
document outlining how objectives set out in the policy would be met, was developed
and published in 2012.
The policy adopted by parliament in 1998 was implemented with varying degrees of
success and many challenges, including delays in meeting national demand
requirements resulting in supply deficit and, ultimately, loading shedding. Some of
the successes include increased access to electricity to levels above 80%, making
South Africa the leading country in sub-Saharan Africa in this regard.

Analysis of the South African Energy Policy Key Drivers Webb Meko - 677517
27
4.5 South African Energy Resources
4.5.1 Overview of Energy Resources
South Africa power has historically been fossil fuel dominated with approximately
70% of the power generated through coal-fired power plants. This has been
influenced largely by the availability of rich coal reserves, water scarcity, low natural
gas and low oil reserves [5].
Energy is a key driver of South Africa's economy; consequently, energy intensity is
used as a measure of gross domestic product (GDP). This is due to the country's
economic structure, dominated by large-scale, energy-intensive primary mineral
beneficiation plants and mining industries
Primary energy sources in South Africa are coal, crude oil, gas, hydro, nuclear,
petroleum products, renewables and waste. Coal, as the major indigenous energy
resource, is relied on for the generation of the country's electricity and a significant
proportion of liquid fuels [14]. More than 90% of South Africa’s electricity is
generated from the burning of coal. Based on rich coal reserves the energy sector
developed to have the largest installed capacity in Africa and became a net exporter
of electricity in Southern Africa.
South Africa has good solar and wind resources, although the deployment of
renewable energy technologies has been slow to take off. Eskom, South Africa’s
state-owned power utility has 27 operational power stations with 40.7 GW installed
generation capacity. Additional power generation capacity is derived from hydro
power imports resulting in a total capacity of about 43.5 GW supplying the country’s
peak demand of approximately 36 GW.
South Africa is a water-scarce country with limited hydro resources. Hydro power is
imported from Mozambique from Cahora-Bassa hydro power station. Oil and gas
resources are also limited energy resources, South Africa is a net importer of these
resources. In 2009 renewable energy sources were recorded as the lowest energy
supply due the slow pace of development [14].
Analysis of the South African Energy Policy Key Drivers Webb Meko - 677517
28
4.5.2 Coal
Conventional energy sources based on coal, natural gas, and oil have been the main
providers of base load energy globally and remain key economic drivers in many
countries. This applies to South Africa with a power generation capacity dominated
by fossil fuels [1]. In South Africa, more than 90% of power generation is from coal-
fired power plants [2].
Coal plays an important role in the South African economy and is the primary energy
source for power generation. It is also used for producing a substantial proportion of
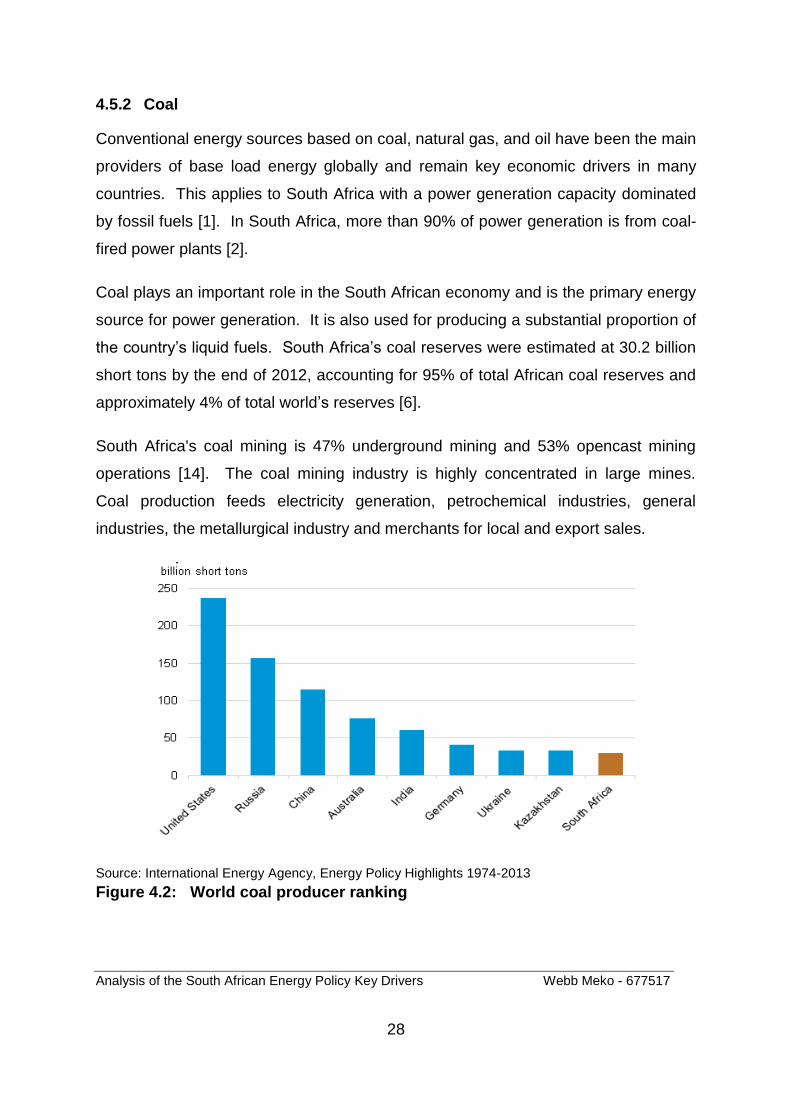
the country’s liquid fuels. South Africa’s coal reserves were estimated at 30.2 billion
short tons by the end of 2012, accounting for 95% of total African coal reserves and
approximately 4% of total world’s reserves [6].
South Africa's coal mining is 47% underground mining and 53% opencast mining
operations [14]. The coal mining industry is highly concentrated in large mines.
Coal production feeds electricity generation, petrochemical industries, general
industries, the metallurgical industry and merchants for local and export sales.
Source: International Energy Agency, Energy Policy Highlights 1974-2013
Figure 4.2: World coal producer ranking

Analysis of the South African Energy Policy Key Drivers Webb Meko - 677517
29
Coal production increased from 220 million tons in 2002 to 253 million tons in 2011.
This is a 14.7% increase in coal production (extraction) over 10 years. The total
volume of coal sold increased by 8.6% over 10 years, from 227 million tons in 2002
to 247 million tons in 2011.
As observed in figure 4.3, South Africa’s coal is bituminous anthracite, which has a
relatively high calorific value.
Source: International Energy Agency, Energy Policy Highlights 1974-2013
Figure 4:3: World coal reserves by bituminous classification
In 2011, South African mines produced 252 756 845 tons of coal and 29% of
produced coal was exported to Europe and China through the Richards Bay coal
terminal, making South Africa the sixth largest coal exporting country in the world.
The estimated number of years to depletion for proven coal reserves, as at 2011,
was 119 years. In 2002, there were 147 years left to depletion, decreasing to 119
years in 2011, which is a 19% decrease over the past 10 years [8]. Given current
coal reserves, South Africa will continue to include coal in the power generation
energy mix as a critical component to the base load capacity.

Analysis of the South African Energy Policy Key Drivers Webb Meko - 677517
30
4.5.3 Oil and Gas
South Africa has very low natural gas reserves, currently there are no economically
viable inland gas fields. In consequence of limited oil fields in the country, the bulk of
crude oil is imported from the Middle East (Saudi Arabia, Iran, Kuwait, Yemen, Qatar
and Iraq) and Africa (Nigeria, Egypt and Angola). Small oil and gas reserves are
situated off the south coast of Mossel Bay [5].
Namibia and Mozambique have commercially viable gas reserves. With the latest
results of ongoing exploration in Mozambique, prospects of more reserves are
promising. The discovery of additional gas in Mozambique has resulted in an
increase in imports into South Africa as observed in the Figure 4.4.
The Kudu gas fields are situated off the Namibian coast and have reserves of about
1.5 trillion cubic feet (tcf). Angola has two inland fields at Pande and Temane, with
combined reserves of approximately 3 tcf. These present additional options for gas
imports into South Africa.
Source: Energy Information Administration, Annual Energy Outlook 2012 [1]
Figure 4.4: South Africa natural gas consumption

Analysis of the South African Energy Policy Key Drivers Webb Meko - 677517
31
4.5.3.1 Shale gas
Shale gas is hydrocarbon gas extracted from shale, as opposed to conventional
reservoir rocks such as sandstone or limestone, or from other unconventional
reservoir rocks, such as coal or tight (very low permeability) sandstone [15].
The composition of shale gas is not materially different from other forms of natural
gas. It is primarily composed of methane (80% or more) mixed with varying amounts
of other gases, including carbon dioxide (CO2), oxygen (O2), nitrogen (N2), hydrogen
sulphide (H2S) and other hydrocarbons such as ethane (C2H6) and propane (C3H8)
[6].
Shale gas resources are typically found between 1 500 and 4 000 metres beneath
the surface and are exploited by wells with long horizontal sections in the shale
beds. Shale gas production requires hydraulic fracturing (“fracking”) to access the
gas [15].
Fracking is a process that entails the drilling of wells to access the shale rocks. After
the wells on a pad are drilled, cased and cemented, a device perforates the
horizontal part of the production pipe to make small holes in the casing, exposing the
wellbore to the shale [15]. Then a mixture of water (90%), sand (9.5%) and
chemicals (0.5%) is pumped into the well under high pressure to create micro-
fractures in the shale and free the natural gas or oil. Sand keeps the fractures open
after the pressure is released. The chemicals are mainly agents to reduce friction
and prevent corrosion. The water volumes per well are estimated between 7.5 and
15 million litres of water [15].
In the United State of America (USA), hydraulic fracturing has been used in the oil
and natural gas industry since the 1940s, producing more than 600 tcf of natural gas
and 7 billion barrels of oil. The USA has pioneered and improved hydraulic fracking
and, used with modern horizontal drilling technology, fracking has unlocked vast
shale reserves in the USA [15].
Analysis of the South African Energy Policy Key Drivers Webb Meko - 677517
32
In South Africa shale gas was discovered in the Karoo basin of the Northern Cape.
The Department of Mineral Resources (DMR) estimates that approximately 30 trillion
cubic feet (tcf) shale gas can be produced [17].
However, in South Africa there have been uncertainties and government concerns
with the development of shale gas primarily pivoting on fracking on the following
issues:
The need to use large volumes of carrier fluid (usually water).
The potential pollution of water resources resulting from surface spills or underground leakage.
The treatment and disposal of waste fluids.
The potential ‘footprint’ of any development.
Socio-economic impacts.
The use of large volumes of water, together with chemical additives raised concerns
over the environmental and social implications of hydraulic fracking. South Africa is
a water scarce country, and the Karoo region has very low annual rainfall and high
evaporation, making it extremely dry. Some aquifers in the Karoo Basin are
especially vulnerable to contamination [17].
Based on these concerns, the Department of Mineral Resources (DMR) issued a
moratorium on exploration licences in February 2011 and convened a working group
to study shale gas exploration in the Karoo within the South African context. The
present study considers the impact of shale gas exploitation on land use, water use
and air pollution. Commissioned by the Ministry of Minerals, this group put forward
recommendations that should allow further exploration, with the exception of physical
drilling. The moratorium was lifted in August 2012, making South Africa the first
country ever to end a ban on fracking. Though several companies have technical
cooperation permits, drilling is still prohibited in the Karoo.
Shale gas could be a game changer in the South Africa’s energy landscape and part
of the answer to reducing dependency on coal as a base load energy source.

Analysis of the South African Energy Policy Key Drivers Webb Meko - 677517
33
4.5.4 Uranium
South Africa is ranked among the top 20 countries in terms of uranium deposits, as
detailed in the Table 4.1.
Table 4.1: Global uranium production, 2010 (Uranium Mining in Africa, Governance of Africa Resources Programme)
Country Production (tu) Percentage of total
Kazakhstan 17803 33
Canada 9783 18
Australia 5900 11
Namibia 4496 8
Niger 4198 7.8
Russia 3562 6
Uzbekistan 2400 4
United States 1660 3
Ukraine 850 1.5
China 827 1.5
Malawi 670 1.2
South Africa 583 1
India 400 0.7
Czech Republic 254 0.4
Brazil 148 0.2
Romania 77 0.1
Pakistan 45 0.08
France 7 0.01
Africa Total 9947 18
World Total 53663 100
Source: International Energy Agency, Africa Energy Outlook. 2013.

Analysis of the South African Energy Policy Key Drivers Webb Meko - 677517
34
The implementation of the Nuclear Energy Policy of 2008 is a key mission of the
Department of Energy. The policy provides a framework within which prospecting,
mining, milling, and use of nuclear materials, as well as the development and
utilisation of nuclear energy for peaceful purposes, takes place.
South Africa’s existing nuclear power generation capacity is 1800MW produced from
the Koeberg power plant built in 1984 in the Western Cape. Nuclear power accounts
for approximately 6% of the country’s installed capacity. The government, through
Eskom, announced early in 2006 that it was considering building another
conventional nuclear plant, possibly at Koeberg, to strengthen the network in the
Western Cape.
Early in 2007, the Eskom board approved a plan to increase power generation
capacity, including the construction of new nuclear power plant. The environmental
impact assessment (EIA) process initiated in 2006 confirmed the selection of three
possible sites for the next nuclear power units namely Thyspunt, Bantamsklip, and
Duynefontein.
This new programme was planned to start with 4GW capacity utilising the
pressurised water reactor (PWR) technology and the construction was planned to
start in 2010, the first unit to be commissioned in 2016. The commercial process
commenced in 2007, and Areva's EPR and Westinghouse AP1000 were short-listed
bidders.
However, in December 2008, Eskom announced that it would not proceed with either
of the bids from Areva or Westinghouse due to lack of finance, and the government
confirmed delays of several years.
Subsequently, however, the government resuscitated the nuclear programme, which
is now led by the Department of Energy (DoE) and the National Treasury. The
procurement strategy has now included the signing of a memorandum of
understanding with Russia. The new planned capacity as reflected in the IRP 2010
is now a total of 9,6GW.

Analysis of the South African Energy Policy Key Drivers Webb Meko - 677517
35
Developments in nuclear power generation have been mainly driven by the plan to
bring on additional capacity, which started in around 2006, as depicted in Figure 4.5.
South African national imperatives include localisation, advanced manufacturing
capability, skills development, and job creation. The choice of a specific model also
hinges on the following:
The financial and strategic decisions as to structuring the power station assets.
The extent of government support which will inform whether the structuring model will more closely resemble a Sovereign or Utility model.
The extent of a partner's financial involvement will inform whether the sovereign or
utility financing model will be employed. As it stands, the construction of a nuclear
fleet is currently an expensive option to be pursued solely by the South African
government without involving the private sector.
Figure 4.5: Timeline of nuclear programme development in South Africa up until 2014

Analysis of the South African Energy Policy Key Drivers Webb Meko - 677517
36
4.5.5 Biomass
The harnessing of energy from biological mass is classified under renewable energy
sources as it releases no additional carbon dioxide (CO2) to the atmosphere because
it absorbs the same amount of carbon in growing as it releases when consumed.
The various types of biofuels are indicated in the following table 4.2.
Table 4:2: Types of biofuel sources
Woody Biomass Fuels
Agricultural Residues Waste Fuels
Whole Tree Chips Tops & Limbs Forest Thinnings Sawdust & Bark Urban Wood Waste Railroad Ties Recycled Pallets Furniture Factory Wastes
Corn Stover Wheat Straw Rice Straw Rice Hulls Oat Hulls Rice Hulls Bagasse Orchard Prunings
Municipal Solid Waste Refuse Derived Fuel Tire-Derived Fuel Dried Sewage Sludge Paper Sludge and Waste Landfill Retrieved Solid Waste Landfill Gas Digester Gas
Energy Crops Manures and Agricultural Biofuels and Biomass
Switchgrass Hybrid Poplar Banagrass Arondo Donax Miscanthus
By-Products Cow Manure Chicken and Turkey Litter Hog Waste Wet Distiller’s Grains Dry Distiller’s Grains Lignin
Ethanol Biodiesel Crude Palm Oil White Pellets Torrefied Chips Black Pellets
The main sources of biomass in South Africa are fuel-wood found largely in the rural
domestic sector, bagasse in the sugar industry, and pulp and paper waste in the
commercial forestry industry for in-house heat and electricity generation. Much of
South Africa’s existing biomass involves inefficient household use based on
questionably sustainable harvesting, primarily from natural woodlands (60%)
although also from plantation off-take and woodlots [5].

Analysis of the South African Energy Policy Key Drivers Webb Meko - 677517
37
One of the most attractive and easily implemented biomass energy technologies is
co-firing with coal in existing coal-fired boilers. Co-firing refers to the process where
biomass fuel and coal are combusted simultaneously in a boiler. In biomass co-
firing, biomass can substitute for up to 20% of the coal used in the boiler. When it is
used as a supplemental fuel in an existing coal boiler, biomass can provide the
following benefits:
Lower fuel costs.
Reductions in sulphur oxide, nitrogen oxide.
GHG emissions reduction.
According to the Department of Water Affairs and Forestry (DWAF), the key biomass
resources that play a role in terms of renewable commercial plantations and the
wood industry are woodlots, trees in the urban environment, woodlands and
indigenous forests, and trees cultivated as fuel crops.
The National Biofuels Industrial Strategy initially focused on a short-term five-year
pilot programme to achieve a 2% penetration of biofuels in the national liquid fuel
supply, or 400 million litres per year - to be based on local agricultural and
manufacturing production capacity [6]. The table below shows a summary of the
South African biomass resources.
Table 4:3: Summary of energy potential from biomass in South Africa
Industry Biomass NCV (MJ/t) Mass (1000t) Energy Content
Power Potential (GWh/yr)
Sugar Field Residue Bagasse
684 7117
5336 6136
10.21 12.12
2553 3031
Forestry Softwood Hardwood
13016 11820
1588 1555
5.74 5.11
1650 1073
Saw Mill Chips Dust Bark
10316 10611 10135
1433 730 443
4.11 2.15 1.25
1162 608 353
Pulp & Paper Black liquor Sludge Bark
6243 5777 7975
5206 234 35
9.03 .038 0.76
2257 94 191
Total 7958 23006 50.86 12972
Source: Capacity Building Project in Energy Efficiency and Renewable Energy (CaBEERE) 2004

Analysis of the South African Energy Policy Key Drivers Webb Meko - 677517
38
4.5.6 Hydro
South Africa has relatively few rivers that have sufficient capacity to produce large
scale hydro power generation. The Orange (Gariep) River is the largest river in
South Africa and it is 2100 km long with a catchment area of more than 1 million
square kilometre (km²). The Orange River rises in the Lesotho Highlands, flows
through South Africa and drains into the South Atlantic Ocean.
Hydro power generation is mainly developed by Eskom, which has the following
hydro power stations in the generation fleet, as depicted in Figure 4.6.
Gariep – 360MW.
Vanderkloof – 240MW.
Drakensberg – 1000MW.
Palmiet – 400MW.
Ingula - 1332 MW expected to be completed in 2017
Gariep and Vanderkloof Power Stations, are located on the Orange River. Ingula
pump storage is the most recent hydro scheme developed by Eskom that will have
an installed capacity of 1332MW and is located in Kwa-Zulu Natal.
Source: Eskom Peaking
Figure 4:6: South Africa hydro power Infrastructure
Analysis of the South African Energy Policy Key Drivers Webb Meko - 677517
39
4.5.7 Wind
Wind has been used as an energy source for centuries, by means of the windmill.
Wind power generation was developed in 1927 when wind turbines were used to
produce electricity. Utility scale with an approximately 100kW (kilowatt) connected to
6.3kV (kilovolt) was enhanced in the 1940s [5].
The amount of energy that can be extracted from the wind depends on its speed and
density. The higher the wind speed, the more energy can be harnessed to generate
electricity on a large scale. Wind is therefore classified mainly based on speed, as
indicated in table 4.4
Table 4.4 Wind classification
Wind Class/Turbulence
Annual average wind speed at 80m hub-height (m/s)
Class I High wind 10,0
Class II Medium wind 8,5
Class III Medium wind 7,5
Class IV Medium wind 6,0
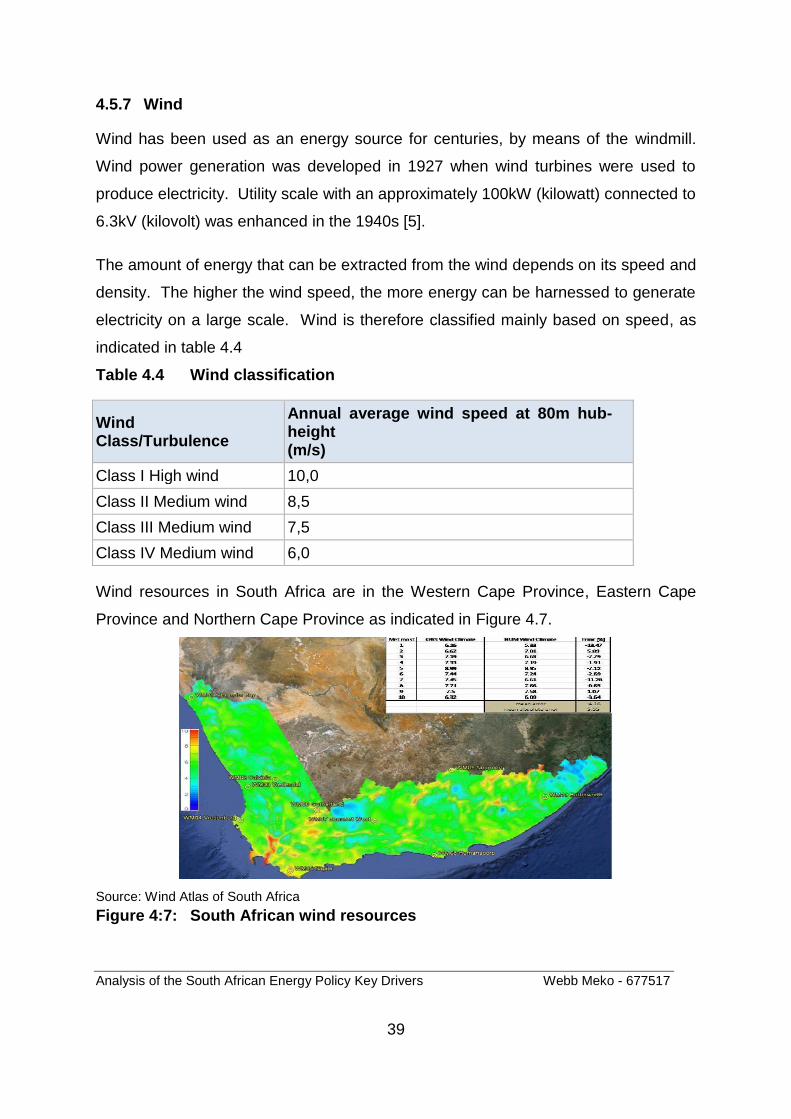
Wind resources in South Africa are in the Western Cape Province, Eastern Cape
Province and Northern Cape Province as indicated in Figure 4.7.
Source: Wind Atlas of South Africa
Figure 4:7: South African wind resources

Analysis of the South African Energy Policy Key Drivers Webb Meko - 677517
40
4.5.8 Solar
Solar energy is the most readily accessible energy resource in South Africa. The
solar irradiation levels in the Northern Cape province of South Africa are classified
among the highest in the world, recorded at an average of 2 200 kWh/m²/year.
Solar Photovoltaic (PV) power generation solutions can be widely applied across
South Africa, even outside the Northern Cape, where irradiation levels are relatively
lower.
Solar PV provides interesting solutions as cost per kW installed continues to decline
rapidly thanks to technological developments and an improving learning rate
globally. This has also been in observed in the reduction of the PV tariff in the
REIPP programme as bid windows progress.
These applications could include PV solutions for rural areas that can enhance
energy access through micro grid solutions. In the DoE Integrated Demand
Management (IDM) programme, solar water geysers have been rolled out to reduce
power demand from the grid.
Solar PV rooftop solutions, however, have not been developed to a scale that could
be included in South Africa energy mix. There are isolated, small scale initiatives
that are being pursued by some municipalities such as City Power and Tshwane in
Gauteng.
Solar also presents an interesting solution when applied to existing coal power
plants. Hybrid PV and coal power generation systems present an opportunity to
reduce carbon emissions from existing coal power plants in South Africa. However,
this solution is not part of the IRP 2010 emission reduction strategy. The physical
size of a PV plant to make a significant impact on a 2000MW to 3000MW coal
station is a significant constraint to this proposal. It may be better to place large PV
plants (greater than 50MW) closer to load centres to also save on system losses.
The Northern Cape could support an estimated capacity of between 50GW to 1 000

Analysis of the South African Energy Policy Key Drivers Webb Meko - 677517
41
GW of solar energy capacity. These solar irradiation levels allow for different
technologies to be developed, ranging from central receivers, fresnel lenses and
parabolic troughs. Concentrated solar power technologies offer interesting
opportunities and when combined with thermal storage the supply could cover an
average of 12 hours daily.
Availability of water is important for the development of concentrated solar power
(CSP) plants as they require water, mainly for cooling. Figure 4.8 shows that high
radiation levels in South Africa are in water-strained areas such as the Karoo, which
poses challenges to the development of CSP power facilities
Despite these high radiation levels, the current allocation of CSP technologies in the
IRP 2010 is only 1 GW. This allocation is low in relation to estimated resource
available and clearly does not take advantage of the existing high irradiation levels in
the Northern Cape.
Source: SolarGIS GeoModel Solar
Figure 4:8: South Africa solar irradiation levels

Analysis of the South African Energy Policy Key Drivers Webb Meko - 677517
42
4.6 Energy for Economic Development
In globalised and automated economies, energy is playing an increasingly important
role as one of the drivers of economic prosperity. A reliable and affordable supply of
electricity is essential for competitiveness in global industrial product markets and a
necessary ingredient in the daily workings of modern societies [1].
Since 1994, the South African government’s challenge has been to address
effectively inequalities and, in particular, economic disparities. The key challenges
include high unemployment, skills shortages, and limited industrial capacity.
Pursuant to addressing these challenges, the government embarked on a
comprehensive programme to provide a legislative and policy framework to
transform the economy.
New laws have been introduced, including measures to overcome economic
distortions. The objective is to provide new economic opportunities that will bring
more South Africans into the mainstream economy. Government spend is one of the
mechanisms that may assist in bringing economic transformation. To realise
economic transformation, government has set the following objectives:
Industrialisation.
Localisation.
Skills development.
Job creation
Community development.
The benefits to the South African economic transformation include:
Reduced cost of doing business.
Investment in plant and technology
Greater export potential.
Reduced unemployment and poverty.
Larger and more skilled workforce.
Improved quality of life for all.
Government has utilised a number of policy instruments, to achieve its economic

Analysis of the South African Energy Policy Key Drivers Webb Meko - 677517
43
transformation objectives, as depicted in Figure 4.9. These include legislation and
regulation, preferential procurement, institutional support, financial and other
incentive schemes such as:
National Industrial Participation Programme (NIPP)
Competitive Supplier Development Programme (CSDP)
Industrial Policy Action Plan (IPAP).
National Growth Plan NGP
National Development Plan (NDP)
Broad-Based Black Economic Empowerment (B-BBEE)
Preferential Procurement Policy Framework Act (PPPFA)
Figure 4:9: Economic transformation framework energy
Programmes outlined in the economic transformation framework need
intergovernmental co-ordination and integration to effectively promote broad-based
economic empowerment. This includes the introduction of procurement levers by
State Owned Companies (SOCs), employment equity, sub-contracting, and
management development through which SOCs will contribute towards achieving
desired economic transformation objectives.

Analysis of the South African Energy Policy Key Drivers Webb Meko - 677517
44
Driven by the DTI, the economic transformation framework shown in Figure 4.10
focuses on industrialisation, localisation, job creation and skills development. To
effectively apply this framework, all government departments and State Owned
Companies (SOCs) should align infrastructure development with the overall
economic growth and transformation objectives.
Figure 4:10: Economic transformation framework energy
Government’s most effective economic transformation lever is through procurement
spend, achieved through SOCs such as Eskom, Transnet, SAA, PetroSA, etc. The
deployment of a range of new procurement policy levers, driven by various state
organs, has yielded positive results towards local economy development.
In the energy sector, Eskom's build programme spend was forecast to run into the
hundreds of billions of rand, which presented an opportunity for economic
development.
The Eskom procurement process for the construction of Medupi and Kusile coal
power plants adopted a multi-package approach and stipulated the economic
development criteria to drive local companies’ participation. International companies
had to comply with local content requirements, job creation, skills development and
training. Training requirements are directed towards the development of scarce
skills such as engineers, technicians and artisans.

Analysis of the South African Energy Policy Key Drivers Webb Meko - 677517
45
The same approach was adopted by the DoE in the REIPP programme as it
embarked on developing an additional 3 275 MW of renewable capacity through
IPPs. The evaluation criteria were broadly divided into price and economic
development, as shown in Figure 4.11. The pricing had a set of qualification criteria
and a weighting of 70%. Although the economic development weighting was 30% of
the overall bid evaluation criteria, the IPPs had to meet the following minimum
thresholds:
Job creation.
Local content.
Ownership.
Socio-economic development.
The DoE's economic development initiatives are aligned with the government
agenda of economic transformation and contribute towards addressing challenges
such as unemployment and the shortage of skilled labour in South Africa.
These requirements are also included in the base-load IPP programme, consistent
with South African national economic development objectives.
Figure 4:11: REIPPP economic developments elements

Analysis of the South African Energy Policy Key Drivers Webb Meko - 677517
46
4.7 South Africa’s Environmental Management
Climate change is one of the major challenges affecting global society. The main
concern of climate change is global warming, which is based on a ‘greenhouse’
effect. The earth has a natural temperature control system in which certain
atmospheric gases are critical. Greenhouse gases trap some of the heat radiated by
the earth, which results in global warming [14].
In 1997 the Kyoto Protocol was adopted at a meeting of the United Nations
Framework Convention on Climate Change (UNFCCC) in Kyoto, Japan. The Kyoto
Protocol marked a major step towards committing to GHG emission reduction
targets. At the time, targets for industrialised countries were to reduce their
combined greenhouse gas emissions by at least 5% compared to 1990 levels during
the period 2008 to 2012. Commitments confirmed by respective countries were
endorsed in 1998 once the Protocol had been ratified by 39 of the 40 largest
industrial countries.
Commitment and decisive effective action is required to reach global commitment in
order to limit future warming to below 2 °C. In addressing climate change, countries
need to balance their development priorities with efforts to reduce the resource,
energy, and carbon intensity of their economies. South Africa is ranked among the
top 20 countries measured by absolute carbon dioxide (CO2) emissions, with
emissions per capita in the region of 10 metric tons per annum. The South African
government believes that serious measures have to be taken to reduce its GHG
emissions.
South Africa hosted the 17th Conference of the Parties (COP 17) of the United
Nations Framework Convention on Climate Change (UNFCCC) in 2011. During this
conference, the country reaffirmed its commitment to voluntarily reduce its GHG
emissions to below the business-as-usual trajectory by 34% by 2020, and 42% by
2025. This would be subject to the availability of appropriate financial, technological,
and capacity-building support.

Analysis of the South African Energy Policy Key Drivers Webb Meko - 677517
47
4.7.1 Emission Reduction
The substantial contribution of the energy sector to total emissions stems from power
generation by coal-fired power plants. The South African energy sector is the
biggest single contributor of GHG emissions as it provides more than 70% of primary
energy and more than 85% of the electricity in South Africa (see Figure 4.15).
Source: Statistics South Africa
Figure 4.12: Emission by sector in South Africa
South Africa’s emissions are managed mainly by the following three departments:
Department of Environment.
Department of Energy
Treasury (carbon taxes and pricing).
These departments' policies are coherently targeting GHG emission reduction. The
National Treasury developed a Carbon Tax Policy Paper issued for public
consultation in May 2013, with the objective to transition to a low carbon economy
[9].
National Treasury believes that carbon pricing will encourage a shift in production
patterns towards low-carbon and more energy-efficient technologies. The policy also
strives for conventional energy sources such as coal to be equipped with such
measures as carbon capture and storage technologies, and flue-gas
desulphurization (FGD) to avert cost hikes imposed by the carbon taxes [9].

Analysis of the South African Energy Policy Key Drivers Webb Meko - 677517
48
4.7.2 Renewable Energy Development
In response to the call for emission reductions, NERSA was tasked by Government
to develop a renewable energy programme within the country. In building up the
renewable energy programme, NERSA developed and launched the South African
Renewable Energy Feed-In Tariff programme. At inception, this programme’s focus
was on wind, photovoltaic solar, concentrated solar power, land-fill gas, and small
hydro plants.
NERSA adopted the concept of Levelized Cost of Electricity (LCOE) to pre-
determine tariffs that would be payable for different technologies. LCOE enables a
comparison of power plants of different technologies and applicable cost structures.
The basic premise is that the model calculates the sum of all accumulated costs for
building and operating a plant and comparing this figure to the sum of the annual
energy produced. This then yields the so-called LCOE tariff in rand per kWh [19].
The calculation of the average LCOE is done on the basis of the net present value
method, which calculates expenses for investment and payment streams from
earnings and expenditures during the plant’s lifetime based on discounting from a
shared reference date. The cash values of all expenditures are divided by the cash
values of energy produced [19].
NERSA highlighted the following the key principles for REFIT:
Guaranteed access to the national grid.
Guaranteed purchase price for a fixed duration.
An obligation to purchase power generated.
Burden sharing of the additional cost throughout electricity consumers.
A dynamic mechanism that reflects market, economic and political developments.
For new projects as a result of learning effects and cost reductions.
The potential to set a cap on the maximum available subsidy per year.
A willing seller, willing buyer approach still applies.
A draft document of Phase 1 of the REFIT was presented for public comment in July

Analysis of the South African Energy Policy Key Drivers Webb Meko - 677517
49
2009. The Consultation Paper introduced tariffs in respect of a further five
renewable energy technologies [11].
Phase 2 revised the concentrated solar power trough without storage at R 3.14/kWh,
solid biomass at R 1.18/kWh; biogas at R 0.96/kWh; photovoltaic systems at R
3.96/kWh; and concentrated solar power (central tower) with six hours storage at R
2.31/kWh as shown in Table 4.5 [11].
Table 4.5: Refit Phase I and II proposed tariffs.
REFIT Phase Technology R/kWh
Phase I
CSP 2,10
Wind 1,25
Small hydro 0,94
Landfill gas 0,90
Phase II
CSP trough without storage 3,14
Large-scale grid-connected PV (≥ 1MW) 3,94
Biomass solid 1,18
Biogas 0,96
CSP tower with 6 hours per day storage 2,31
Source: NERSA, REFIT PHASE II
However, the REFIT program developed by NERSA was terminated before it was
formally launched in the market. A new programme referred to as the Renewable
Energy Independent Power Producers Programme (REIPPP) was then launched by
the Department of Energy. The tariffs that were set out in REFIT developed by
NERSA were no longer applicable in the REIPPP as it called for a competitive
bidding process.
The REIPPP was equally aimed at allowing local developer participation. The
objective was to create an environment conducive for Independent Power Producers
(IPPs) to invest in the South African energy sector whilst addressing social and
economic development challenges in the country.

Analysis of the South African Energy Policy Key Drivers Webb Meko - 677517
50
The REIPPP procurement inception allocated 3725 MW total renewable energy
capacity to IPPs. Specific technologies considered for selection under this REIPPP
included onshore wind, concentrated solar power, solar photovoltaic (PV), biomass,
biogas, landfill gas and small hydro equal to and above 10MW apportioned, as
indicated in Table 4.6.
Table 4.6: Renewable energy IPP energy allocations
Technology Proposed Amount (MW) Percentage allocation (%)
Onshore wind 1850 49.7
Concentrated Solar Power 200 5.3
Solar Photovoltaic 1450 38.9
Biomass 12,5 0.3
Biogas 12,5 0.7
Landfill gas 25 2
Small hydro (<10MW) 75 2.8
Small Project IPP1850 Total threshold 100
Total 3725
Source: Department of Energy, REIPPP
The DoE policy stance with regard to the development of renewable power
generation is a competitive bidding process, as outlined in the REIPP programme.
Under this approach IPPs will sell generated power into the national grid; NERSA will
be involved in tariff determination and facilitate the process between Eskom and
IPPs.
The REIPPP was clustered into procurement rounds with MW allocation for each of
the rounds according to technology. In 2014, there were four rounds of open bids,
with successful IPPs obtaining preferred bid status and reaching financial close.
.

Analysis of the South African Energy Policy Key Drivers Webb Meko - 677517
51
4.7.3 Energy Efficiency Management
The1998 White Paper on Energy Policy asserts that government will create an
energy efficiency consciousness and encourage energy efficiency in commerce and
industry [6]. Government will establish energy efficiency norms and standards for
commercial buildings and industrial equipment, and publish voluntary guidelines for
the thermal performance of housing. A domestic appliance-labelling programme
may also be introduced. Publicity campaigns will be undertaken to ensure that
appliance purchasers are aware of the purpose of appliance labels [6].
Informed by the 1998 Energy Policy White Paper, the DME formulated the Energy
Efficiency Strategy for South Africa that was approved in 2005 and gazetted on 26
June 2009. This strategy was primarily developed to promote energy saving, reduce
the negative impact of energy use on the environment, reduce energy costs to the
economy, contribute towards sustainable development, and achieve a national
energy policy. Initially the target for improved energy efficiency in South Africa set at
12% energy saving by 2015 [6].
The Strategic Vision was to encourage sustainable energy sector development and
energy use through efficient practices, thereby minimising the undesirable impacts of
energy use upon health and the environment and contributing towards secure and
affordable energy for all [17].
Power utility schemes often combine a requirement to meet energy efficiency with
the use of market-based instruments to enable utilities to trade savings obligations
and to allow competition in the delivery of energy services towards savings targets.
Over time, these schemes can deliver sustained energy savings, which result in
significantly lower energy intensities among the targeted end-users than non-
targeted ones.

Analysis of the South African Energy Policy Key Drivers Webb Meko - 677517
52
The DoE channelled the energy efficiency programme through Eskom as the
national power utility and to a limited extent through municipalities. Eskom launched
an Integrated Demand Management (IDM) programme. This programme employed
various schemes to achieve energy savings as depicted in the following Figure 4.13.
Source: Eskom, Integrated Demand side Management
Figure 4:13: Demand side management key players
The Demand Side Management programmes consist of various energy efficient commodities such as compact fluorescent lights, solar water heaters, and heat pumps.
Compact Fluorescent Light bulbs: Compact Fluorescent Light bulbs (CFLs) are
energy efficient bulbs that can replace an incandescent or traditional light bulb.
Showerheads: Energy efficient showerhead technology is based on the principle of
mixing water with oxygen through the accelerator fin to increase the velocity of the
water flow using the latest laminar flow technology. Laminar technology uses up to
50% less water than a regular free flow shower head, thus saving energy.
Light-emitting diodes (LEDs): LEDs are solid-state devices that convert electric
energy directly into light of a single colour, bringing several advantages including
high efficiency, durability and with superior life over other lamps.

Analysis of the South African Energy Policy Key Drivers Webb Meko - 677517
53
4.7.4 Schemes in the IDM Programme
Schemes in the IDM Programme include the following:
ESCO model: a programme which primarily targets the industrial sector by catering
for unique requirements to save energy, driven by an agreement between Energy
Services Companies ( ESCO), Eskom, and customers for a three year period.
Performance contracting: a programme which aims to purchase bulk verified
energy savings across multiple sites and technologies by contracting with a single
project developer or ESCOs.
Standard offer: a programme which focuses on replacing inefficient technologies
within the commercial sector by using a suite of pre-approved energy efficient
products. Payment for verified savings is made at a fixed kWh rate over a three year
period.
Residential mass roll out: a programme which focuses on rolling out a mixed bag
of technologies targeting the reduction of energy usage within households.
CFL: mass roll out: a programme designed to issue free energy efficient lamps to
households; compact fluorescents lamps CFLs are purchased directly by Eskom and
rolled out through an appointed project management company.
Standard rebate: a programme which primarily targets the installation of solar water
heaters and heat pumps by offering a rebate payment to the customer. Rebates are
capped by size band.
Standard product: a programme which offers opportunities to replace commonly
used inefficient technologies with energy.
Demand reduction: a programme which industrial consumers can register for
directly with Eskom as an ESCO, and the load is managed by paying for customers
as an incentive for hourly load reduction.

Analysis of the South African Energy Policy Key Drivers Webb Meko - 677517
54
4.8 The Integrated Resource Plan 2010 (IRP 2010)
The current iteration of the Integrated Resource Plan (IRP) for South Africa, initiated
by the Department of Energy (DoE) after the first round of public participation in June
2010, led to the Revised Balanced Scenario (RBS). The IRP 2010 RBS has
committed to a total installed capacity of 85GW, as outlined in the table below, new
power generation capacity will include a nuclear fleet of 9.6 GW, coal of 6.3 GW,
wind of 11.8 GW, and gas of 11 GW.
Table 4:7: IRP 2010 RBS total generating capacity in 2030
Energy Sources Total generating capacity in 2030
Capacity added (including committed)
From 2010 to 2030
New (uncommitted) capacity options
From 2010 to 2030
MW % MW % MW %
Coal 41074 48,2 16386 31,4 6253 16,3
OCGT 9170 10,8 6770 13,0 5750 15,0
CCGT 1896 2,2 1896 3,6 1896 5,0
Pumped Storage 2912 3,4 1332 2,5 0 0,0
Nuclear 11400 13,4 9600 18,4 9600 25,1
Hydro 5499 6,5 3399 6,5 3349 8,8
Wind 11800 13,8 11800 22,6 11000 28,8
Solar CSP, PV 600 0,7 600 1,1 400 1,0
Other 890 1,0 465 0,8 0 0,0
Total 85241 52248 38248 Source: IRP 2010
The IRP 2010 RBS places emphasis on GHG emission reduction by providing for
renewable energy generation amounting to 42% of new additional capacity and
representing 65% of the overall carbon neutral capacity of total additional new power
generation capacity [1]. This includes the development of gas as an alternative to
coal and bringing open-cycle gas turbine (OCGT) power generated capacity of 9170
MW, including Eskom’s existing Ankerlig capacity, and closed-cycle gas turbine
capacity of 1896 MW. Partial liberalisation of the market was introduced with an
allocated 3750 MW to be procured from IPPs in the REIPPP.

Analysis of the South African Energy Policy Key Drivers Webb Meko - 677517
55
CHAPTER 5. ANALYSIS OF THE SOUTH AFRICAN DRIVERS OF ENERGY POLICY
5.1 Introduction
Assessment of the 1998 White Paper on Energy Policy reflects certain salient factors
that are key drivers of the South African energy policy. In addition, analysis of IRP
2010 RBS (as reflected in Figure 5.1) shows a forecast of 42 GW of additional power
generation capacity by 2030. Also featuring prominently is the radical transformation
of the power mix, with significant reduction of coal power generation and a
substantial increase in renewables and nuclear.
This major deviation from traditional fossil fuel equally reflects a fundamental shift in
energy policy direction. Additional coal power generation accounts for 6.3GW in
comparison to 17.8GW of renewable energy and 9.6GW of nuclear and imported
hydro of 2.6GW.
This change in approach in the South African energy policy sets out a long-term
vision of power mix that is directed towards reducing the country’s carbon footprint.
Source: IRP 2010
Figure 5.1: South Africa Planned Energy Mix, 2030

Analysis of the South African Energy Policy Key Drivers Webb Meko - 677517
56
5.2 Current Energy Factors
Currently, South Africa’s energy sector is facing severe power generation capacity
constraints, which has resulted in load shedding. This is a clear indication that
additional base load capacity is required urgently to cater for the country’s current
demand.
As reflected in Figure 5.2, the energy policy has taken into account the present
status of the energy sector challenges in South Africa. These challenges include:
Ageing energy infrastructure that is not able to cater for current demand,
Increase in energy demand
GHG emission controls,
Market liberalisation,
Optimisation of energy resources,
Economic growth, and
Global and regional influence.
Figure 5.2: Challenges in South African energy sectors

Analysis of the South African Energy Policy Key Drivers Webb Meko - 677517
57
5.2.1 Climate Change Mitigation
The radical transformation of the power mix that seeks to revise coal power
generation down from current 84% to 48% by 2030 suggests greater emphasis on
GHG emission reduction.
Coal currently provides a base-load energy solution for South Africa accounting for
approximately 32GW. Given South Africa's power demand trajectory, coal-fired
power generation has to be substituted with an equivalent base-load power capacity.
The solution seems to rely on a nuclear fleet bringing an additional 9.6GW capacity
and OCGT and CCGT accounting for approximately 11GW. Imported hydro capacity
of 2.9GW from neighbouring countries in the region is also part of the additional
future power generation capacity.
The decision to build an additional 9.6GW of nuclear capacity addresses the base
load requirements. However, further delays in the development of the nuclear
programme may compel the construction of another major coal-fired power plant in
order to cater for the country’s power demand.
Addressing GHG emissions is prominently articulated in the IRP 2010 and is also
consistent with the clearly articulated policy objectives of the National Treasury and
Department of Environmental Affairs
The efforts of the South African government to reduce the country's carbon footprint
are consistent and integrated. Consequently, climate change is identified as a key
driver of the South African energy policy.

Analysis of the South African Energy Policy Key Drivers Webb Meko - 677517
58
Further initiatives to address the environment and specifically reduction of GHG as
outlined in IRP 2010 RBS include:
Emission Limit.
Carbon Tax.
Regional Development.
Enhanced DSM.
Energy demand side management is one of the considerations and its impact on
future generation options in the IRP 2010. The IDM programme and government
energy saving incentives through Eskom delivered limited success. The mass roll
out of solar water geysers was characterised by tender irregularities and faulty
installations. The energy savings still remain one of the mechanisms to address
emission reductions but it requires a new approach to be successful.
Although carbon tax is not yet implemented, government is of a view that it is a
policy stance that will effectively address carbon emission challenges in South
Africa. Treasury has expressed the need for a carbon tax to be priced into the cost
of energy.
A carbon tax is expected to drive the cost of carbon intensive energy sources
sufficiently to deter their use. However as depicted in Figure 5.3, carbon taxes will
only curb carbon emission in the long term.
Source: Integrated Resource Plan 2010
Figure 5:3: Electricity industry CO2 emission forecast

Analysis of the South African Energy Policy Key Drivers Webb Meko - 677517
59
5.2.2 Resource Impact on Energy Policy
Coal should not be dismissed as an energy resource. Instead there should be
investment in research and development to explore cleaner alternatives.
Technologies to reduce emissions from coal, such as carbon capture and flue gas
desulphurisation equipment, should be made mandatory.
Biomass co-firing is one of the proven technologies that can be employed to reduce
the existing power generation fleet’s carbon foot-print. Biomass co-firing can be
applied to existing coal-fired boilers, which currently account for above 30GW. This
could significantly contribute towards CO2 emission reduction.
Energy resource management and optimisation is not adequately addressed in the
South African energy policy. Great emphasis has been placed on emission
reduction, as can be seen with the inclusion in the energy mix of energy resources
not immediately available within South Africa such gas and hydro. The development
of hydro and gas is heavily reliant on the resources of neighbouring countries like
Mozambique and the Democratic Republic of Congo
Resources earmarked for development such as nuclear are relatively expensive
compared to coal. This implies that the price of electricity will be very costly to the
end user in the medium term. This equally indicates disproportionate emphasis on
GHG emission reduction without balancing this factor against other available energy
resources.
Further observations relate to the limited capacity allocated to concentrated solar
power such as the central tower technology. The REIPPP has disadvantaged CSP
technology by emphasising low tariffs more strongly because of the sharply declining
cost of solar PV. This approach does not take advantage of the good solar
resources available in the Northern Cape

Analysis of the South African Energy Policy Key Drivers Webb Meko - 677517
60
5.2.3 Energy and Economic Development
Economic development is an important consideration of energy policy, especially
with regard to new energy infrastructure planning. The Medupi and Kusile
construction procurement strategy has enabled the participation of local firms in the
energy sector, which has benefited the South African economy.
International companies that traditionally offer full Engineering Procurement and
Construction (EPC) turnkey solutions are primarily concerned with return on
investment and during the construction of new power plant will allocate resources
accordingly. Consequently EPCs deploy the most cost-effective resources, including
labour, from outside South Africa.
In IRP 2010, a localisation benefit rating has been given to each scenario portfolio to
indicate the extent to which it supports localisation of specific technologies and
supporting industries [2].
This objective has been consistently applied in the REIPPP programme, which
contains mandatory economic development compliance criteria. The threshold was
initially set at attainably low levels and has increased gradually as the programme
progresses.
The energy policy is aligned to the procurement processes of the South African
government's economic transformation agenda. A key motivation for the economic
development criteria is to direct investment towards enhancing supply capacity and
capability within the engineering industry and the energy sector through local skills
development.

Analysis of the South African Energy Policy Key Drivers Webb Meko - 677517
61
5.2.4 Social Impact on Energy Policy Development
Energy, together with machinery, land, natural resources, and human capital, is a
necessary input in the productive base of the economy [17]. Around the world,
increasing urbanisation has often enabled increasing household access to modern
energy.
However, in most countries in Africa, access to modern energy is lagging behind.
Sub-Saharan Africa has more people living without access to electricity than any
other region in the world. There are more than 620 million people, and nearly half of
the global total that do not have access to electricity [18]. It is also the only region in
the world where the number of people living without electricity is increasing.
Rapid population growth is outpacing the many positive efforts to increase access to
electricity [18]. In 37 Sub-Saharan countries the number of people without electricity
has increased since 2000 while the regional total rose by approximately 100 million
people [18].
South Africa has the highest electrification rate in sub-Saharan Africa. At present,
approximately 11% of South African households lack access to electricity and a
further 4% rely on illegal access or obtain access informally from one household to
another [17].
A conscious policy decision, championed through Eskom, to increase access to
electricity has delivered good results. Statically, South Africa is the only country in
the Sub-Saharan Africa has in excess of 80% access to electricity. South African
energy policy focus on increasing access to electricity and has achieved excellent
results.
However, more innovative ways to address rural household access to electricity
should be considered. Micro grids should be encouraged through IPPs as this will
increase access to electricity in those areas where it is not feasible through main grid
expansion.

Analysis of the South African Energy Policy Key Drivers Webb Meko - 677517
62
5.2.5 Summary of Energy Policy Key Drivers
What are the key drivers to the South African energy policy? They are identified as
the following:
Climate change.
Economic growth.
Social development.
The reduction of the coal power generation to 42% of the total installed capacity
demonstrates that emission reduction is a key government objectives. Greenhouse
gas emission reduction is identified as one of the key drivers of the South African
Energy Policy consistently applied across government departments.
Economic growth through government and state owned companies is also reliant on
infrastructure procurement strategy. This applies across all government sectors and
in energy this has been leveraged in REIPPP through mandatory economic
development requirements. This is also applied in the base load coal programme.
Social development through modern energy infrastructure is an objective set at the
dawn of the democratic era. South Africa is the only country in Sub-Saharan Africa
that has more than 80% access to electricity to its citizens. This has enabled
development of other social systems such education and rural development.

Analysis of the South African Energy Policy Key Drivers Webb Meko - 677517
63
Issues that the energy policy does not adequately address:
Energy resource management.
Energy efficiency and demand side management
The energy policy has attempted to transform the existing fossil-intensive power mix
by advancing energy sources such as nuclear that are relatively expensive as
previously indicated. This has meant abandoning huge coal reserves that have
powered the economy of South Africa hitherto.
Energy efficiency programmes have not realised initially set targets as outlined in the
Energy Policy White Paper. Managing the demand is an area that should receive
increased focus. DoE should lead this initiative as opposed to assigning this to
Eskom. A DoE led program will allow for the municipalities and relevant state organs
to act in a coherent and integrated manner in implementing energy efficiency
programmes
Market liberalisation has not been fully realised, with IPPs only allocated 3750MW in
the renewable space. Efforts to liberalise the energy sector are continuing with the
expectation of a further 2400 MW power generation capacity to be allocated to the
base-load coal programme. Fundamental restructuring of the electricity industry
however remains a hindrance to fully introducing IPPs, while Eskom remains the
only entity that can purchase electricity from IPPs.
Figure 5:4: Findings of South African Energy Policy Drivers

Analysis of the South African Energy Policy Key Drivers Webb Meko - 677517
64
CHAPTER 6. CONCLUDING REMARKS
Initiatives taken by the South African government to tackle critical energy-related
problems hold the key to the outlook of energy landscape up to 2030. Policy makers
face critical choices in the integration of energy demand and management,
environmental and GHG emission reduction and economic objectives to formulate a
balanced energy policy.
Renewable energy integration is more challenging for weak interconnected systems.
This is applicable in South Africa, with an electrical grid configured to transmit power
generated in Mpumalanga to the economic hub of Gauteng province. This will be a
hindering factor until such time as transmission grid capacity is strengthened to cater
for renewable energy power generation in Eastern Cape, Western Cape and
Northern Cape provinces.
Shale gas potential in the Northern Cape and gas reserves in Mozambique offer
interesting opportunities to create a regional integrated gas market that could reduce
reliance on coal. However, the development of this integrated gas market will
require bold decisions at a governmental level, especially pertaining to such fraught
topics as hydraulic fracking. Despite concerted efforts to significantly reduce current
high levels of coal-generated power, coal will remain the dominant energy source in
South Africa. New innovative means of cleaner energy production through coal
should be explored. Investment in research and development is crucial to optimise
the use of coal as an energy resource.
Will the energy policy key drivers as pursued in the current policy be changed as the
energy landscape changes globally? The IRP 2010 provides a good starting point
for South African energy to transform the fuel mix and costs of generation. The
potential implications for the affordability of energy and environmental management
raise concerns that energy policy makers have to address while keeping abreast with
global energy developments.

Analysis of the South African Energy Policy Key Drivers Webb Meko - 677517
65
REFERENCES
[1] Annual Energy Outlook, U.S Energy Information Administration, 2012.
[2] Integrated Resource Plan 2010, Department of Energy, 2011.
[3] Re-Shaping an Effective and Efficient European Renewable Energy Market.
www.reshapingres- policy.eu, Accessed, 21 October 2014.
[4] Annual Market Update, Global Wind Report, GWEC, 2011.
[5] A. Marquard, “The Origins and development of South African Energy Policy”,
Doctoral Thesis, University of Cape Town, 2006.
[6] 1998 White Paper on the Energy Policy, Department of Minerals and Energy
of the Republic of South Africa, 1998.
[7] E. Tyler, Aligning South African Energy and Climate Change Mitigation Policy.
Cape Town: University of Cape Town, 2009.
[8] Energy Policy Highlights 1974-2014, International Energy Agency, OECD/IEA,
2013.
[9] Carbon Tax Policy Paper for Public Comment, National Treasury, 2013.
[10] Key World Energy Statistics 2014, International Energy Agency OECD/IEA,
2014.
[11] Energy Refit Public Participation, National Energy Regulator of South Africa,
2010.
[12] Lessons from Liberalised Electricity Markets, International Energy Agency,
2011.
[14] Environmental; Economic Accounts, Compendium Report Number: 04-05,
Statistics South Africa, 2014.
[15] Hydraulic Fracturing, Unlocking America’s Natural Gas Resources, American
Petroleum Institute, 2014.
[16] World Energy Perspective Cost of Energy Technologies, World Energy
Council, 2013.
[17] National Energy Efficiency Strategy of the Republic of South Africa,
Department of Minerals Resources, Government Gazette No. 323342, 26
June 2009.
[18] K. Heer, J. Lewis, and J.A. Harmin, ‘Promoting Renewable Energy Sources in
Portugal: Possible Implications for China, 2007.
[19] Lazard Levelized Cost of Energy Analysis Version 8, September 2014.