Embed Size (px)
Citation preview
IDT Report
TRAI 1
Analysis of the Network Performance of the Telecom Service
Providers in Mumbai and Delhi
Background
1. TRAI is regularly monitoring the performance of Telecom Service Providers (TSP) against the
benchmarks for the various Quality of Service (QoS) parameters laid down by the Authority. TSPs submit
Performance Monitoring Reports to TRAI every quarter.
2. TRAI also undertakes audit and assessment of Quality of Service through independent agencies
to verify the Quality of Service claimed. The Audit agencies conduct sample ‘Drive tests’ across various
cities all over the country as part of audit and assessment of the TSPs’ performance. The audit reports of
these agencies are published on the website of TRAI.
3. In view of complaints on call drops and other network issues, on behalf of TRAI, an independent
Drive Test (IDT)was conducted by M/s TUV SUD on
a. 23rd
and 24th
June 2015 covering various locations in South and Central Mumbai. The
performance of Idea, Airtel, Vodafone, Reliance (GSM), Aircel& Tata(GSM) was
monitored;
b. 9th
to 11th
July 2015 covering various locations in South Delhi, Central Delhi and West
Delhi. The performance of Idea, Airtel, Vodafone, Reliance (GSM), Aircel & Tata(CDMA)
was monitored.
4. A team from the TRAI HQ was present for these Drive tests during these days. For the purpose
of these tests, only 2GBTS were covered.
5. The test results obtained from these drive tests are presented to explain the network condition
in terms of Radio Frequency (RF)Coverage; Rx Quality; Accessibility; Retainability; and Carrier to
Interference ratio. Of these parameters, performance benchmarks have been prescribed by TRAI or the
Licensor for RF Coverage; Rx Quality; Accessibility and Retainability. However, for a comprehensive
examination of the network quality, the parameters relating to Carrier over Interference have also been
added.
What is a Drive Test?
6. Drive Test is a test performed to evaluate the performance of various cellular networks on
predetermined parameters. A Drive test is performance oriented and therefore technology neutral.
7. A Drive test is conducted by driving a vehicle at a steady speed over the selected route. The
vehicle carries the testing equipment which measures the key performance indicators (KPI)by
repeatedly making calls, establishing the call, recording the quality of connection, measuring dropped
calls, etc. in accordance with the predetermined parameters.
IDT Report
TRAI 2
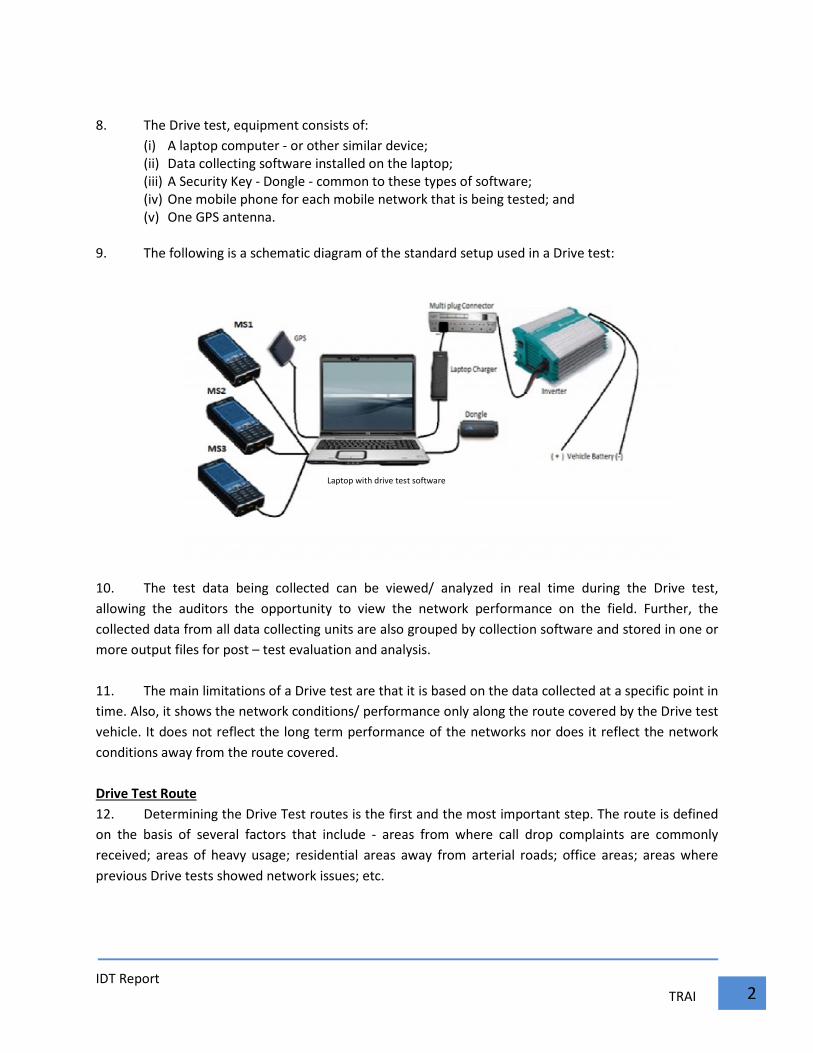
8. The Drive test, equipment consists of:
(i) A laptop computer - or other similar device;
(ii) Data collecting software installed on the laptop;
(iii) A Security Key - Dongle - common to these types of software;
(iv) One mobile phone for each mobile network that is being tested; and
(v) One GPS antenna.
9. The following is a schematic diagram of the standard setup used in a Drive test:
10. The test data being collected can be viewed/ analyzed in real time during the Drive test,
allowing the auditors the opportunity to view the network performance on the field. Further, the
collected data from all data collecting units are also grouped by collection software and stored in one or
more output files for post – test evaluation and analysis.
11. The main limitations of a Drive test are that it is based on the data collected at a specific point in
time. Also, it shows the network conditions/ performance only along the route covered by the Drive test
vehicle. It does not reflect the long term performance of the networks nor does it reflect the network
conditions away from the route covered.
Drive Test Route
12. Determining the Drive Test routes is the first and the most important step. The route is defined
on the basis of several factors that include - areas from where call drop complaints are commonly
received; areas of heavy usage; residential areas away from arterial roads; office areas; areas where
previous Drive tests showed network issues; etc.
Laptop with drive test software
IDT Report
TRAI 3
RF DRIVE TEST IN MUMBAI
23rd
AND 24th
June 2015
IDT Report
Target Network: 1. The target networks for the IDT
(GSM).
Mumbai Circle
Population
Area
Population Density
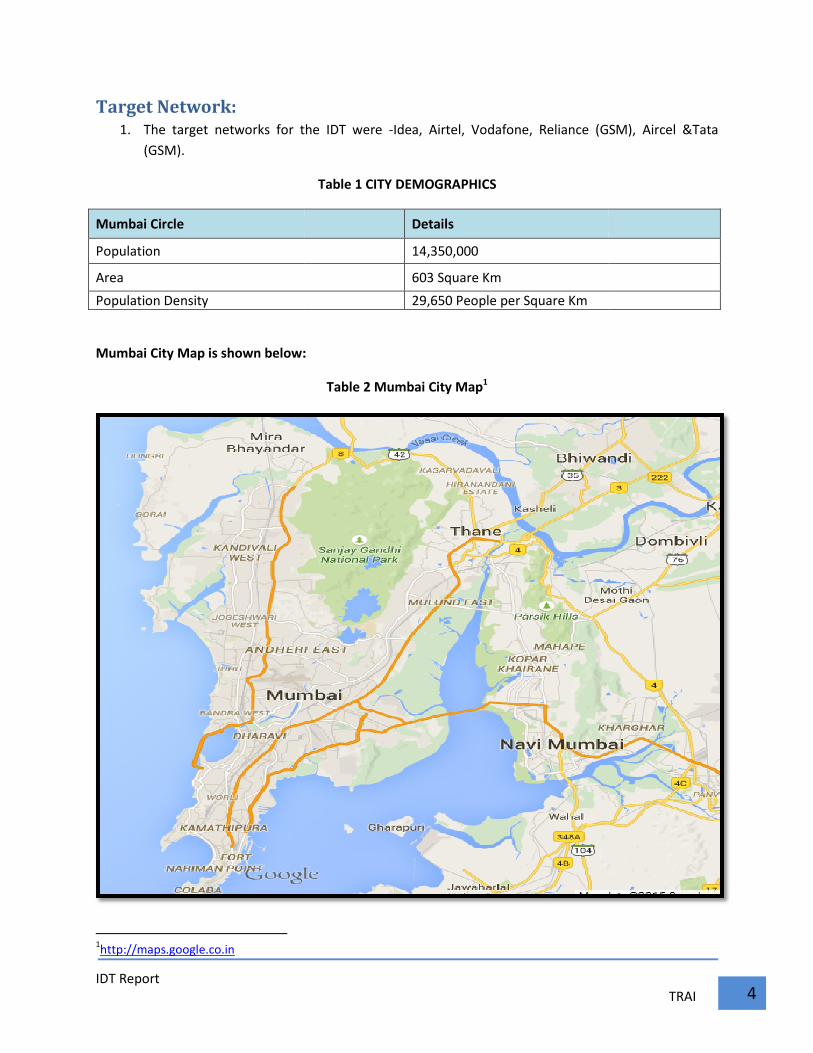
Mumbai City Map is shown below:
1http://maps.google.co.in
s for the IDT were -Idea, Airtel, Vodafone, Reliance (GSM), Aircel &
Table 1 CITY DEMOGRAPHICS
Details
14,350,000
603 Square Km
29,650 People per Square Km
:
Table 2 Mumbai City Map1
TRAI 4
Reliance (GSM), Aircel &Tata
IDT Report
TRAI 5
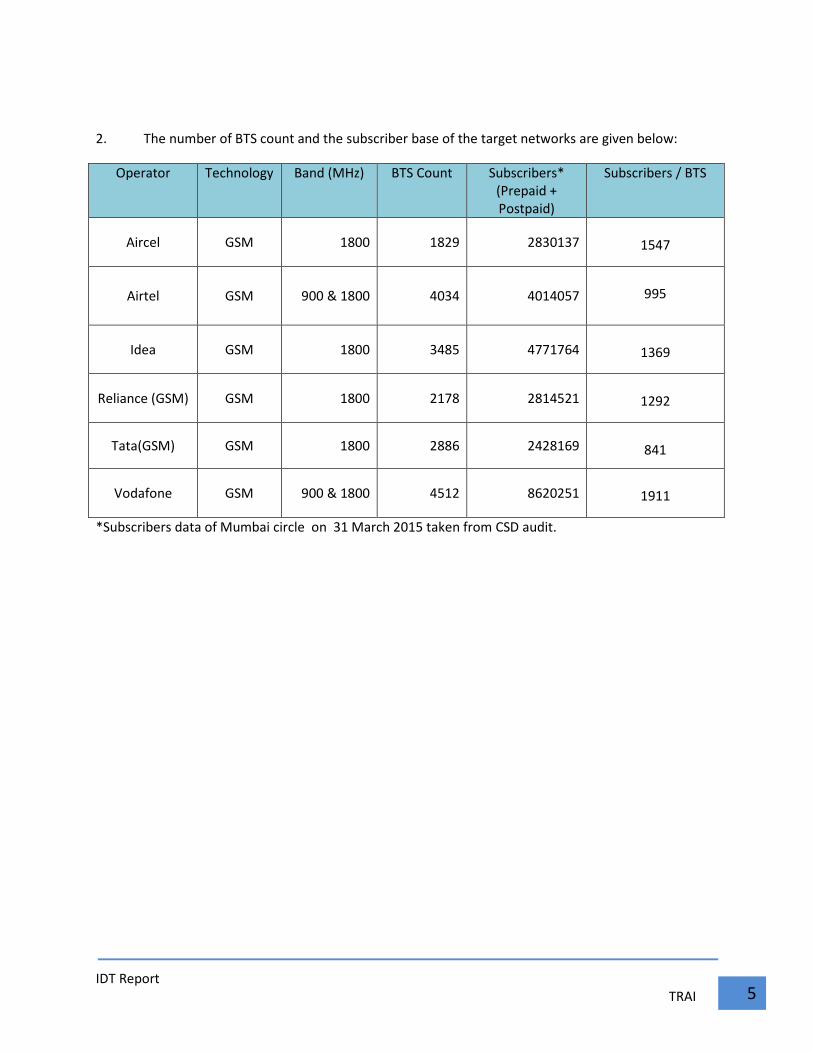
2. The number of BTS count and the subscriber base of the target networks are given below:
Operator Technology Band (MHz) BTS Count Subscribers*
(Prepaid +
Postpaid)
Subscribers / BTS
Aircel GSM 1800 1829 2830137
1547
Airtel GSM 900 & 1800 4034 4014057
995
Idea GSM 1800 3485 4771764
1369
Reliance (GSM) GSM 1800 2178 2814521
1292
Tata(GSM) GSM 1800 2886 2428169
841
Vodafone GSM 900 & 1800 4512 8620251
1911
*Subscribers data of Mumbai circle on 31 March 2015 taken from CSD audit.
IDT Report
Drive Test Route
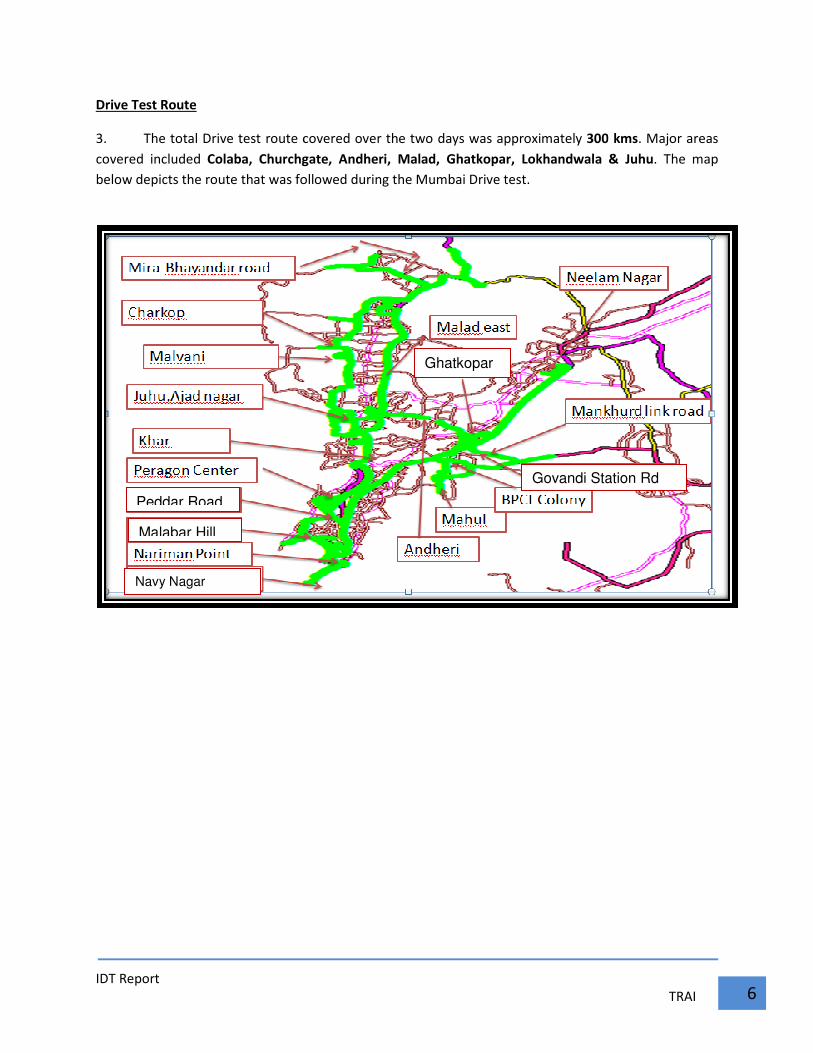
3. The total Drive test route covered over the two days was approximately
covered included Colaba, Churchgate,
below depicts the route that was followed during the Mumbai Drive test
Peddar Road
Navy Nagar
Malabar Hill
The total Drive test route covered over the two days was approximately 300 kms
a, Churchgate, Andheri, Malad, Ghatkopar, Lokhandwala
below depicts the route that was followed during the Mumbai Drive test.
Ghatkopar
Govandi Sta
TRAI 6
300 kms. Major areas
& Juhu. The map
Govandi Station Rd
IDT Report
TRAI 7
Drive Test Schedule
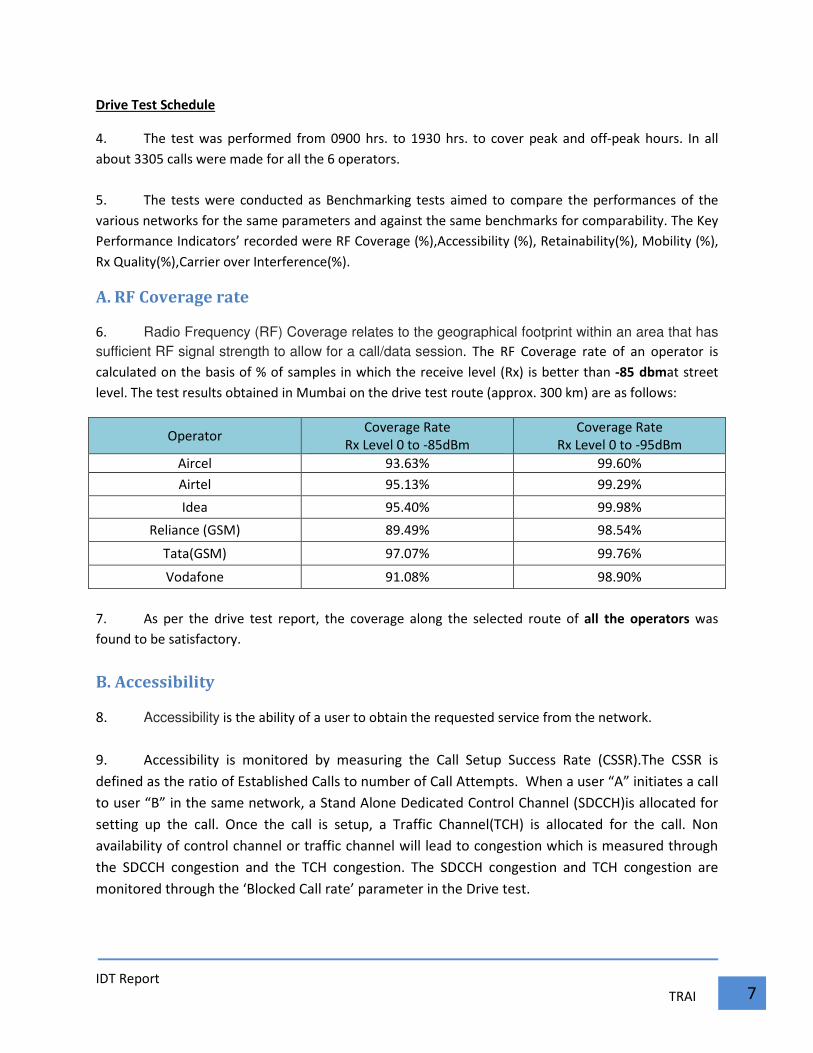
4. The test was performed from 0900 hrs. to 1930 hrs. to cover peak and off-peak hours. In all
about 3305 calls were made for all the 6 operators.
5. The tests were conducted as Benchmarking tests aimed to compare the performances of the
various networks for the same parameters and against the same benchmarks for comparability. The Key
Performance Indicators’ recorded were RF Coverage (%),Accessibility (%), Retainability(%), Mobility (%),
Rx Quality(%),Carrier over Interference(%).
A. RF Coverage rate
6. Radio Frequency (RF) Coverage relates to the geographical footprint within an area that has
sufficient RF signal strength to allow for a call/data session. The RF Coverage rate of an operator is
calculated on the basis of % of samples in which the receive level (Rx) is better than -85 dbmat street
level. The test results obtained in Mumbai on the drive test route (approx. 300 km) are as follows:
Operator Coverage Rate
Rx Level 0 to -85dBm
Coverage Rate
Rx Level 0 to -95dBm
Aircel 93.63% 99.60%
Airtel 95.13% 99.29%
Idea 95.40% 99.98%
Reliance (GSM) 89.49% 98.54%
Tata(GSM) 97.07% 99.76%
Vodafone 91.08% 98.90%
7. As per the drive test report, the coverage along the selected route of all the operators was
found to be satisfactory.
B. Accessibility
8. Accessibility is the ability of a user to obtain the requested service from the network.
9. Accessibility is monitored by measuring the Call Setup Success Rate (CSSR).The CSSR is
defined as the ratio of Established Calls to number of Call Attempts. When a user “A” initiates a call
to user “B” in the same network, a Stand Alone Dedicated Control Channel (SDCCH)is allocated for
setting up the call. Once the call is setup, a Traffic Channel(TCH) is allocated for the call. Non
availability of control channel or traffic channel will lead to congestion which is measured through
the SDCCH congestion and the TCH congestion. The SDCCH congestion and TCH congestion are
monitored through the ‘Blocked Call rate’ parameter in the Drive test.
IDT Report
TRAI 8
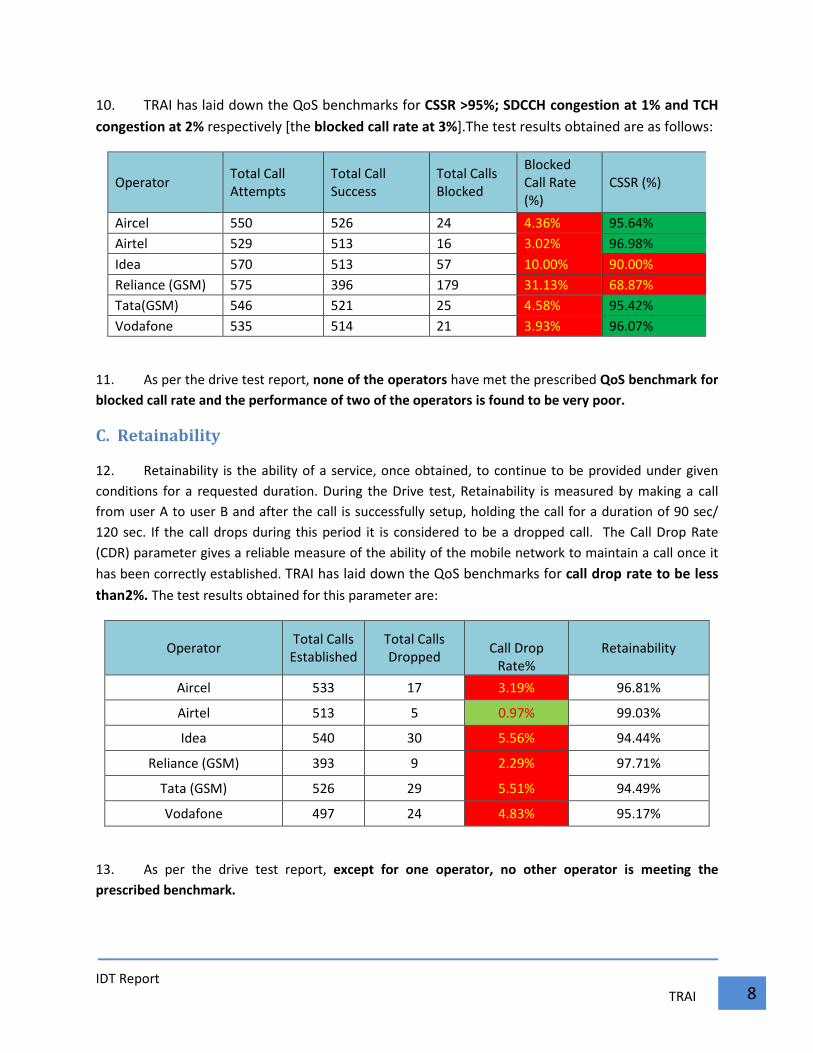
10. TRAI has laid down the QoS benchmarks for CSSR >95%; SDCCH congestion at 1% and TCH
congestion at 2% respectively [the blocked call rate at 3%].The test results obtained are as follows:
Operator Total Call
Attempts
Total Call
Success
Total Calls
Blocked
Blocked
Call Rate
(%)
CSSR (%)
Aircel 550 526 24 4.36% 95.64%
Airtel 529 513 16 3.02% 96.98%
Idea 570 513 57 10.00% 90.00%
Reliance (GSM) 575 396 179 31.13% 68.87%
Tata(GSM) 546 521 25 4.58% 95.42%
Vodafone 535 514 21 3.93% 96.07%
11. As per the drive test report, none of the operators have met the prescribed QoS benchmark for
blocked call rate and the performance of two of the operators is found to be very poor.
C. Retainability
12. Retainability is the ability of a service, once obtained, to continue to be provided under given
conditions for a requested duration. During the Drive test, Retainability is measured by making a call
from user A to user B and after the call is successfully setup, holding the call for a duration of 90 sec/
120 sec. If the call drops during this period it is considered to be a dropped call. The Call Drop Rate
(CDR) parameter gives a reliable measure of the ability of the mobile network to maintain a call once it
has been correctly established. TRAI has laid down the QoS benchmarks for call drop rate to be less
than2%. The test results obtained for this parameter are:
Operator Total Calls
Established
Total Calls
Dropped
Call Drop
Rate%
Retainability
Aircel 533 17 3.19% 96.81%
Airtel 513 5 0.97% 99.03%
Idea 540 30 5.56% 94.44%
Reliance (GSM) 393 9 2.29% 97.71%
Tata (GSM) 526 29 5.51% 94.49%
Vodafone 497 24 4.83% 95.17%
13. As per the drive test report, except for one operator, no other operator is meeting the
prescribed benchmark.
IDT Report
TRAI 9
14. The specific reason for a call drop in a particular case cannot be determined during the drive test
or from the test results themselves. The common reasons attributed for call drops are given below.
a. Spectrum related issues such as limited spectrum or unavailability of spectrum;
b. Coverage gaps;
c. Inadequate capacity in a BTS;
d. Interference issues caused by illegal repeaters, private wide band repeaters, and other
wireless devices;
e. Equipment failure, transmission media fluctuations/ disruptions.
D. Mobility
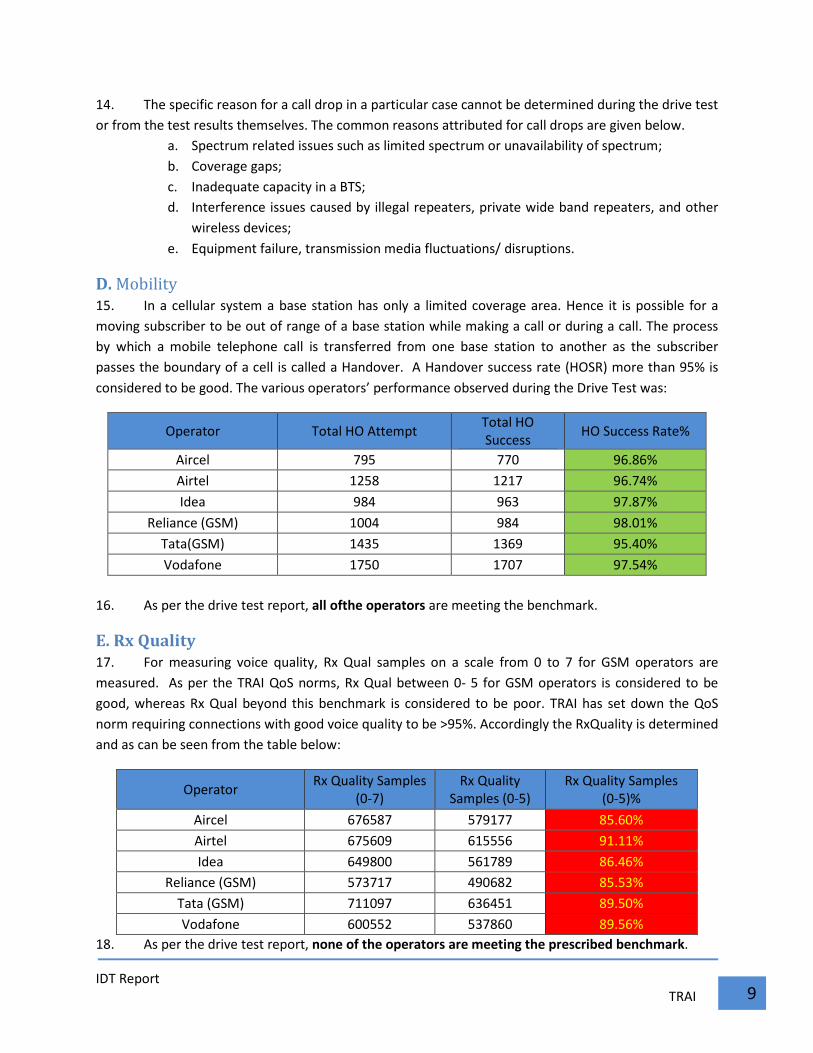
15. In a cellular system a base station has only a limited coverage area. Hence it is possible for a
moving subscriber to be out of range of a base station while making a call or during a call. The process
by which a mobile telephone call is transferred from one base station to another as the subscriber
passes the boundary of a cell is called a Handover. A Handover success rate (HOSR) more than 95% is
considered to be good. The various operators’ performance observed during the Drive Test was:
Operator Total HO Attempt Total HO
Success HO Success Rate%
Aircel 795 770 96.86%
Airtel 1258 1217 96.74%
Idea 984 963 97.87%
Reliance (GSM) 1004 984 98.01%
Tata(GSM) 1435 1369 95.40%
Vodafone 1750 1707 97.54%
16. As per the drive test report, all ofthe operators are meeting the benchmark.
E. Rx Quality
17. For measuring voice quality, Rx Qual samples on a scale from 0 to 7 for GSM operators are
measured. As per the TRAI QoS norms, Rx Qual between 0- 5 for GSM operators is considered to be
good, whereas Rx Qual beyond this benchmark is considered to be poor. TRAI has set down the QoS
norm requiring connections with good voice quality to be >95%. Accordingly the RxQuality is determined
and as can be seen from the table below:
Operator Rx Quality Samples
(0-7)
Rx Quality
Samples (0-5)
Rx Quality Samples
(0-5)%
Aircel 676587 579177 85.60%
Airtel 675609 615556 91.11%
Idea 649800 561789 86.46%
Reliance (GSM) 573717 490682 85.53%
Tata (GSM) 711097 636451 89.50%
Vodafone 600552 537860 89.56%
18. As per the drive test report, none of the operators are meeting the prescribed benchmark.
IDT Report
TRAI 10
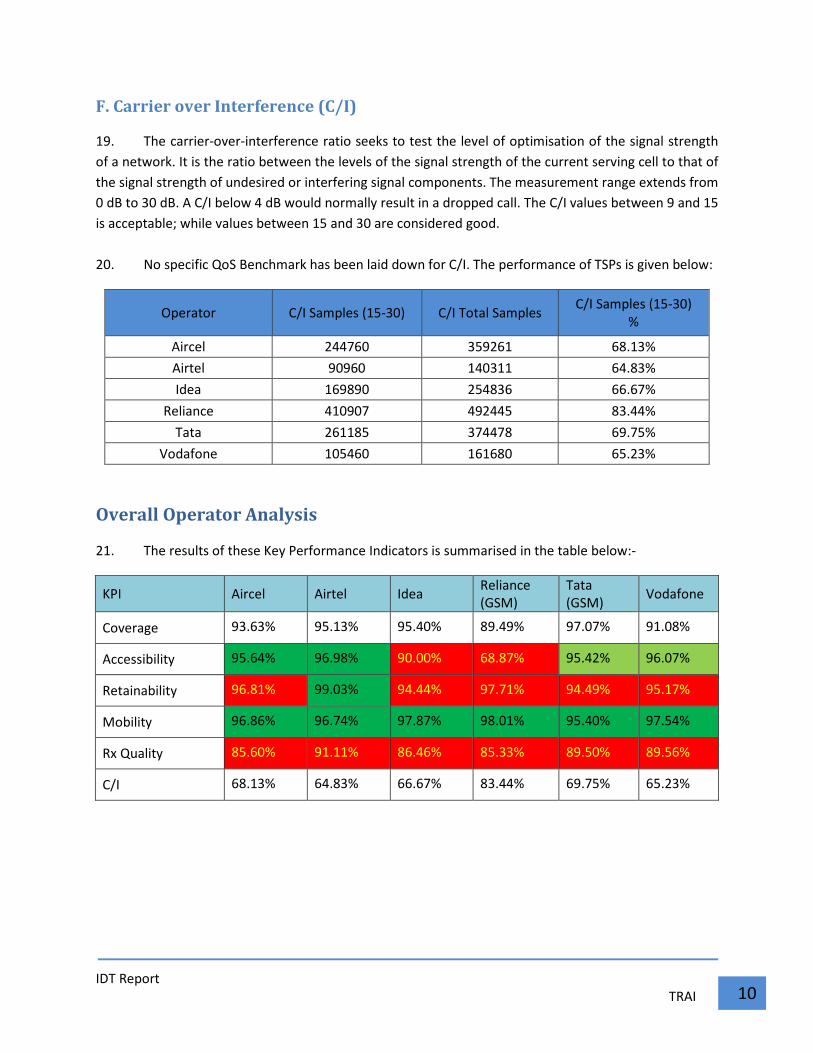
F. Carrier over Interference (C/I)
19. The carrier-over-interference ratio seeks to test the level of optimisation of the signal strength
of a network. It is the ratio between the levels of the signal strength of the current serving cell to that of
the signal strength of undesired or interfering signal components. The measurement range extends from
0 dB to 30 dB. A C/I below 4 dB would normally result in a dropped call. The C/I values between 9 and 15
is acceptable; while values between 15 and 30 are considered good.
20. No specific QoS Benchmark has been laid down for C/I. The performance of TSPs is given below:
Operator C/I Samples (15-30) C/I Total Samples C/I Samples (15-30)
%
Aircel 244760 359261 68.13%
Airtel 90960 140311 64.83%
Idea 169890 254836 66.67%
Reliance 410907 492445 83.44%
Tata 261185 374478 69.75%
Vodafone 105460 161680 65.23%
Overall Operator Analysis
21. The results of these Key Performance Indicators is summarised in the table below:-
KPI Aircel Airtel Idea Reliance
(GSM)
Tata
(GSM) Vodafone
Coverage 93.63% 95.13% 95.40% 89.49% 97.07% 91.08%
Accessibility 95.64% 96.98% 90.00% 68.87% 95.42% 96.07%
Retainability 96.81% 99.03% 94.44% 97.71% 94.49% 95.17%
Mobility 96.86% 96.74% 97.87% 98.01% 95.40% 97.54%
Rx Quality 85.60% 91.11% 86.46% 85.33% 89.50% 89.56%
C/I 68.13% 64.83% 66.67% 83.44% 69.75% 65.23%
IDT Report
TRAI 11
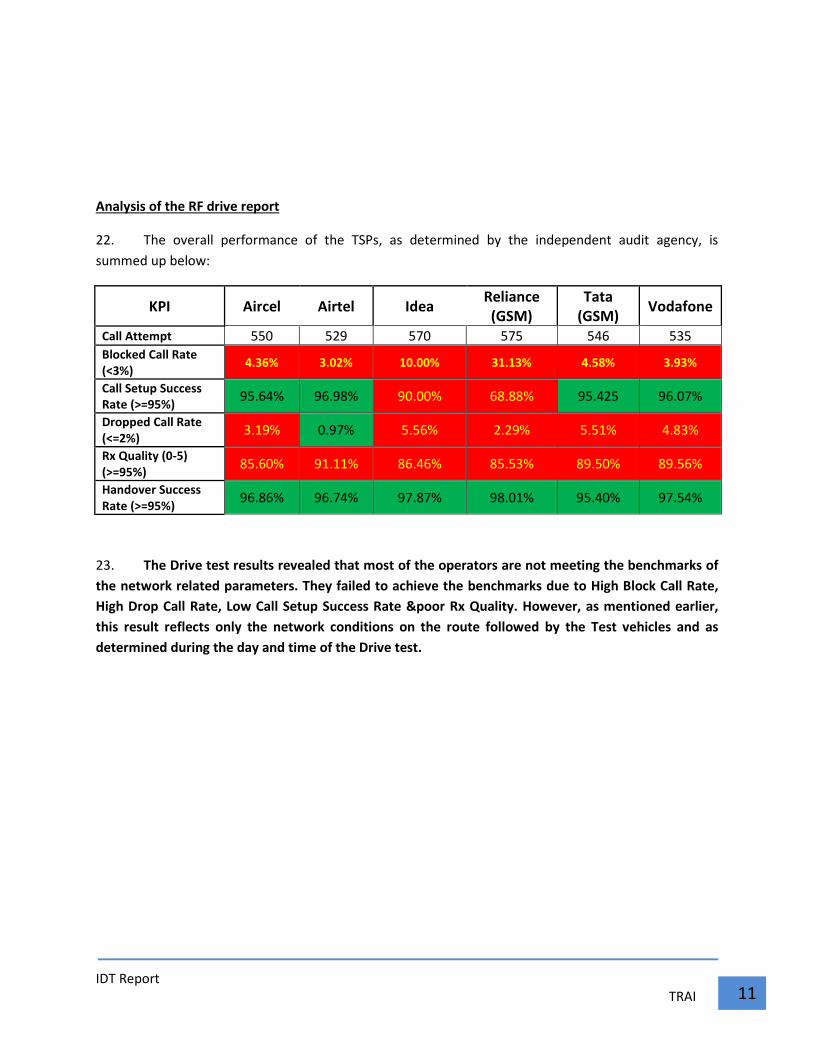
Analysis of the RF drive report
22. The overall performance of the TSPs, as determined by the independent audit agency, is
summed up below:
KPI Aircel Airtel Idea Reliance
(GSM)
Tata
(GSM) Vodafone
Call Attempt 550 529 570 575 546 535
Blocked Call Rate
(<3%) 4.36% 3.02% 10.00% 31.13% 4.58% 3.93%
Call Setup Success
Rate (>=95%) 95.64% 96.98% 90.00% 68.88% 95.425 96.07%
Dropped Call Rate
(<=2%) 3.19% 0.97% 5.56% 2.29% 5.51% 4.83%
Rx Quality (0-5)
(>=95%) 85.60% 91.11% 86.46% 85.53% 89.50% 89.56%
Handover Success
Rate (>=95%) 96.86% 96.74% 97.87% 98.01% 95.40% 97.54%
23. The Drive test results revealed that most of the operators are not meeting the benchmarks of
the network related parameters. They failed to achieve the benchmarks due to High Block Call Rate,
High Drop Call Rate, Low Call Setup Success Rate &poor Rx Quality. However, as mentioned earlier,
this result reflects only the network conditions on the route followed by the Test vehicles and as
determined during the day and time of the Drive test.
IDT Report
TRAI 12
RF DRIVE TEST IN NEW DELHI
9th
to 11th
July 2015
IDT Report
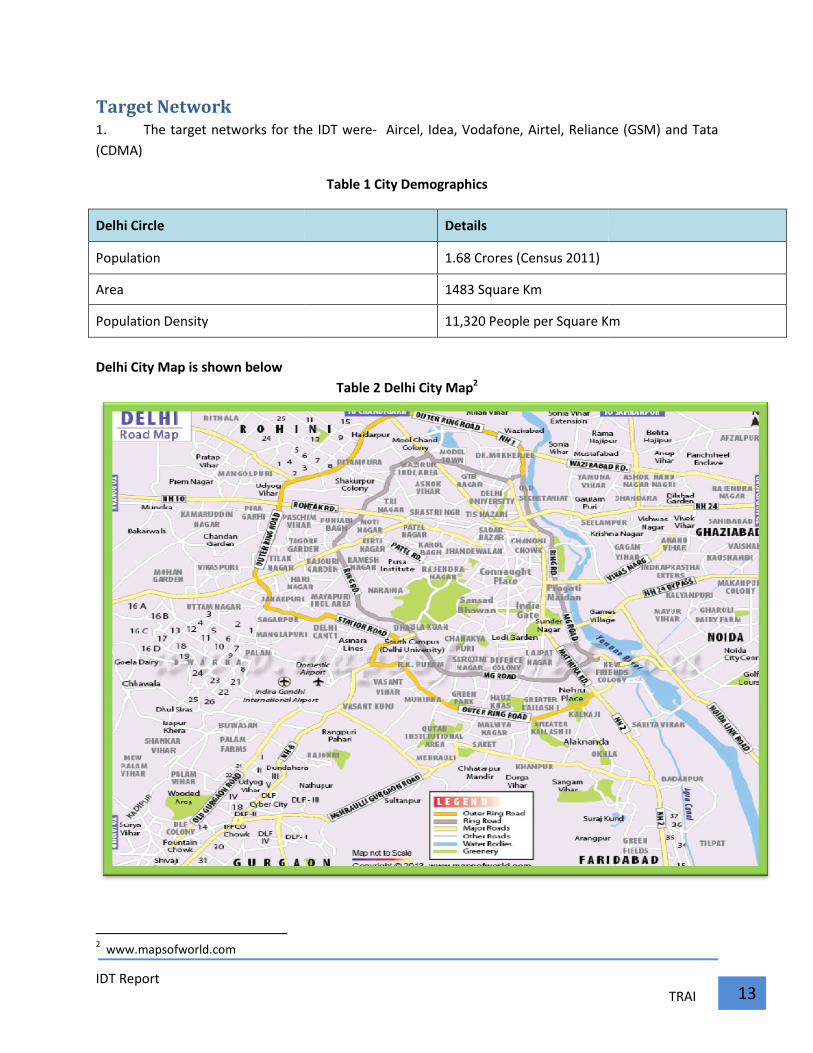
Target Network 1. The target networks for the IDT
(CDMA)
Delhi Circle
Population
Area
Population Density
Delhi City Map is shown below
2 www.mapsofworld.com
for the IDT were- Aircel, Idea, Vodafone, Airtel, Reliance (GSM) and Tata
Table 1 City Demographics
Details
1.68 Crores (Census 2011)
1483 Square Km
11,320 People per Square Km
Table 2 Delhi City Map2
TRAI 13
Reliance (GSM) and Tata
11,320 People per Square Km
IDT Report
TRAI 14
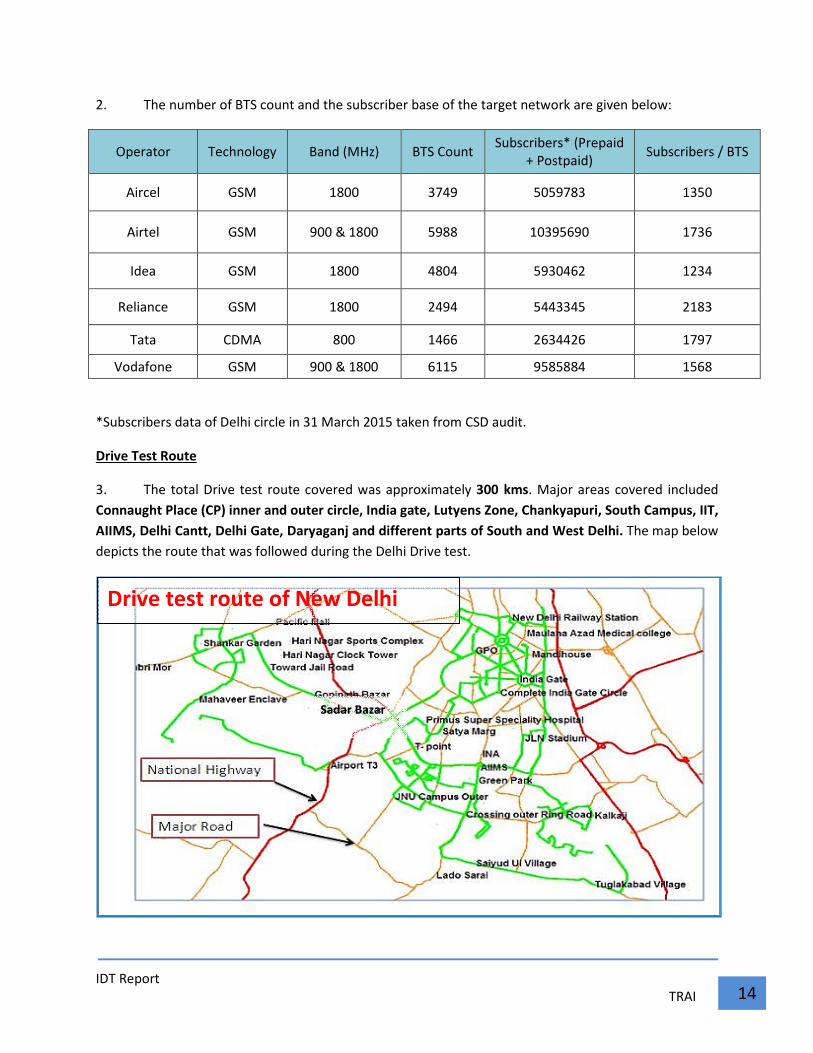
2. The number of BTS count and the subscriber base of the target network are given below:
Operator Technology Band (MHz) BTS Count Subscribers* (Prepaid
+ Postpaid) Subscribers / BTS
Aircel GSM 1800 3749 5059783 1350
Airtel GSM 900 & 1800 5988 10395690 1736
Idea GSM 1800 4804 5930462 1234
Reliance GSM 1800 2494 5443345 2183
Tata CDMA 800 1466 2634426 1797
Vodafone GSM 900 & 1800 6115 9585884 1568
*Subscribers data of Delhi circle in 31 March 2015 taken from CSD audit.
Drive Test Route
3. The total Drive test route covered was approximately 300 kms. Major areas covered included
Connaught Place (CP) inner and outer circle, India gate, Lutyens Zone, Chankyapuri, South Campus, IIT,
AIIMS, Delhi Cantt, Delhi Gate, Daryaganj and different parts of South and West Delhi. The map below
depicts the route that was followed during the Delhi Drive test.
Drive test route of New Delhi
Sadar Bazar
IDT Report
TRAI 15
Drive Test Schedule
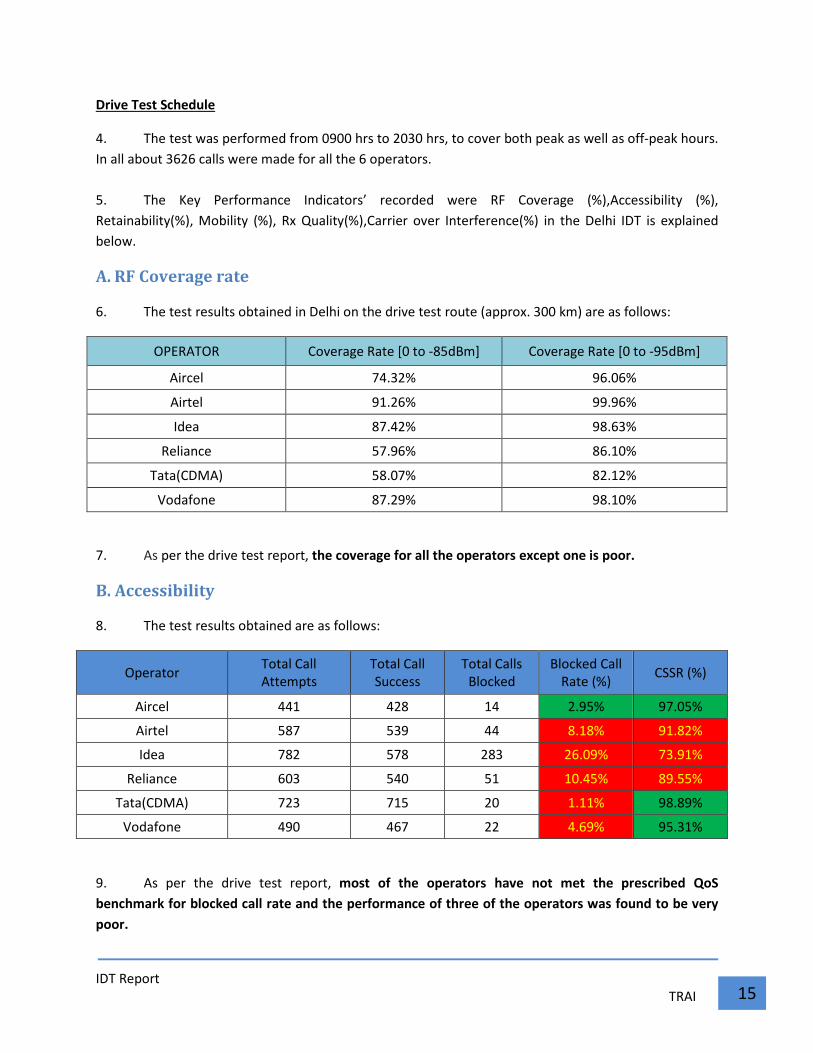
4. The test was performed from 0900 hrs to 2030 hrs, to cover both peak as well as off-peak hours.
In all about 3626 calls were made for all the 6 operators.
5. The Key Performance Indicators’ recorded were RF Coverage (%),Accessibility (%),
Retainability(%), Mobility (%), Rx Quality(%),Carrier over Interference(%) in the Delhi IDT is explained
below.
A. RF Coverage rate
6. The test results obtained in Delhi on the drive test route (approx. 300 km) are as follows:
OPERATOR Coverage Rate [0 to -85dBm] Coverage Rate [0 to -95dBm]
Aircel 74.32% 96.06%
Airtel 91.26% 99.96%
Idea 87.42% 98.63%
Reliance 57.96% 86.10%
Tata(CDMA) 58.07% 82.12%
Vodafone 87.29% 98.10%
7. As per the drive test report, the coverage for all the operators except one is poor.
B. Accessibility
8. The test results obtained are as follows:
Operator Total Call
Attempts
Total Call
Success
Total Calls
Blocked
Blocked Call
Rate (%) CSSR (%)
Aircel 441 428 14 2.95% 97.05%
Airtel 587 539 44 8.18% 91.82%
Idea 782 578 283 26.09% 73.91%
Reliance 603 540 51 10.45% 89.55%
Tata(CDMA) 723 715 20 1.11% 98.89%
Vodafone 490 467 22 4.69% 95.31%
9. As per the drive test report, most of the operators have not met the prescribed QoS
benchmark for blocked call rate and the performance of three of the operators was found to be very
poor.
IDT Report
TRAI 16
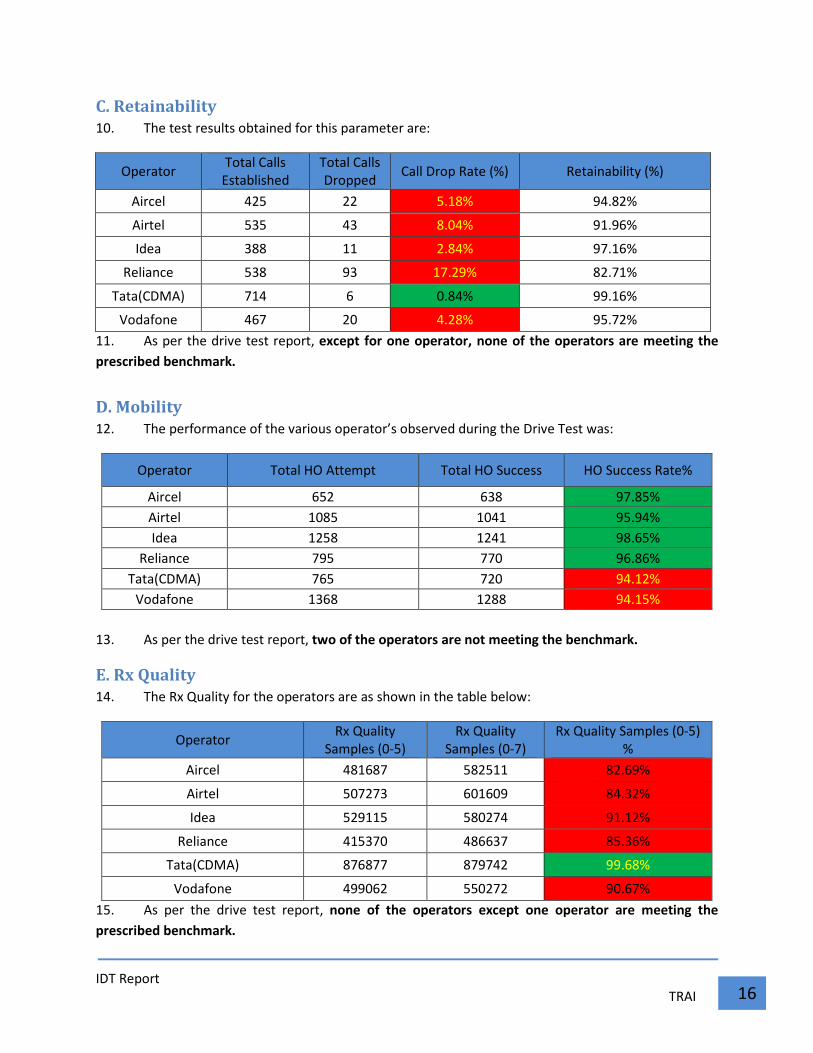
C. Retainability
10. The test results obtained for this parameter are:
Operator Total Calls
Established
Total Calls
Dropped Call Drop Rate (%) Retainability (%)
Aircel 425 22 5.18% 94.82%
Airtel 535 43 8.04% 91.96%
Idea 388 11 2.84% 97.16%
Reliance 538 93 17.29% 82.71%
Tata(CDMA) 714 6 0.84% 99.16%
Vodafone 467 20 4.28% 95.72%
11. As per the drive test report, except for one operator, none of the operators are meeting the
prescribed benchmark.
D. Mobility
12. The performance of the various operator’s observed during the Drive Test was:
Operator Total HO Attempt Total HO Success HO Success Rate%
Aircel 652 638 97.85%
Airtel 1085 1041 95.94%
Idea 1258 1241 98.65%
Reliance 795 770 96.86%
Tata(CDMA) 765 720 94.12%
Vodafone 1368 1288 94.15%
13. As per the drive test report, two of the operators are not meeting the benchmark.
E. Rx Quality
14. The Rx Quality for the operators are as shown in the table below:
Operator Rx Quality
Samples (0-5)
Rx Quality
Samples (0-7)
Rx Quality Samples (0-5)
%
Aircel 481687 582511 82.69%
Airtel 507273 601609 84.32%
Idea 529115 580274 91.12%
Reliance 415370 486637 85.36%
Tata(CDMA) 876877 879742 99.68%
Vodafone 499062 550272 90.67%
15. As per the drive test report, none of the operators except one operator are meeting the
prescribed benchmark.
IDT Report
TRAI 17
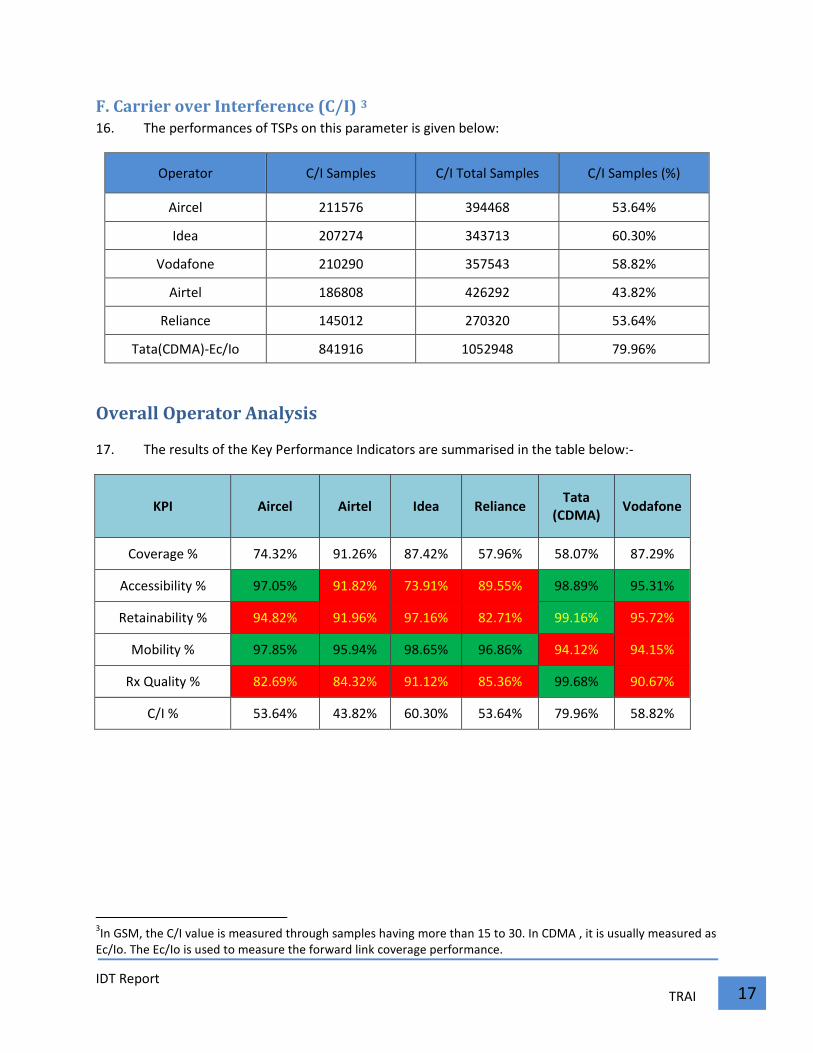
F. Carrier over Interference (C/I) 3
16. The performances of TSPs on this parameter is given below:
Operator C/I Samples C/I Total Samples C/I Samples (%)
Aircel 211576 394468 53.64%
Idea 207274 343713 60.30%
Vodafone 210290 357543 58.82%
Airtel 186808 426292 43.82%
Reliance 145012 270320 53.64%
Tata(CDMA)-Ec/Io 841916 1052948 79.96%
Overall Operator Analysis
17. The results of the Key Performance Indicators are summarised in the table below:-
KPI Aircel Airtel Idea Reliance Tata
(CDMA) Vodafone
Coverage % 74.32% 91.26% 87.42% 57.96% 58.07% 87.29%
Accessibility % 97.05% 91.82% 73.91% 89.55% 98.89% 95.31%
Retainability % 94.82% 91.96% 97.16% 82.71% 99.16% 95.72%
Mobility % 97.85% 95.94% 98.65% 96.86% 94.12% 94.15%
Rx Quality % 82.69% 84.32% 91.12% 85.36% 99.68% 90.67%
C/I % 53.64% 43.82% 60.30% 53.64% 79.96% 58.82%
3In GSM, the C/I value is measured through samples having more than 15 to 30. In CDMA , it is usually measured as
Ec/Io. The Ec/Io is used to measure the forward link coverage performance.
IDT Report
TRAI 18
Analysis of the RF drive report
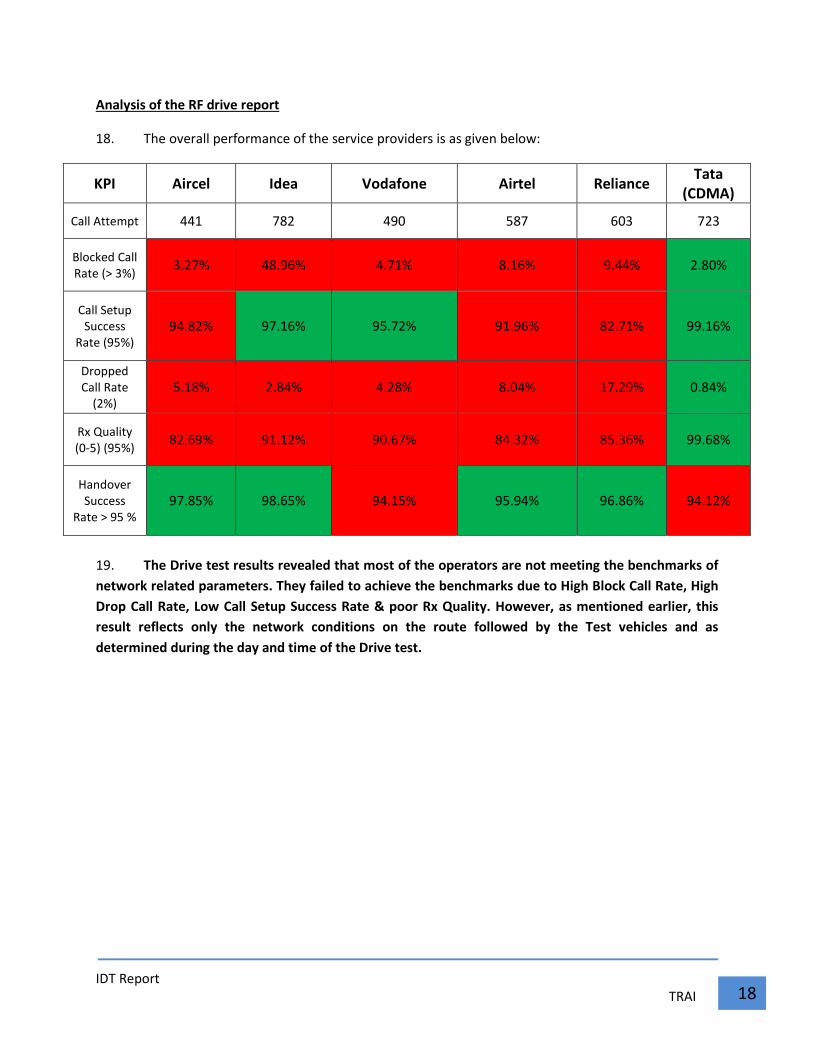
18. The overall performance of the service providers is as given below:
KPI Aircel Idea Vodafone Airtel Reliance Tata
(CDMA)
Call Attempt 441 782 490 587 603 723
Blocked Call
Rate (> 3%) 3.27% 48.96% 4.71% 8.16% 9.44% 2.80%
Call Setup
Success
Rate (95%)
94.82% 97.16% 95.72% 91.96% 82.71% 99.16%
Dropped
Call Rate
(2%)
5.18% 2.84% 4.28% 8.04% 17.29% 0.84%
Rx Quality
(0-5) (95%) 82.69% 91.12% 90.67% 84.32% 85.36% 99.68%
Handover
Success
Rate > 95 %
97.85% 98.65% 94.15% 95.94% 96.86% 94.12%
19. The Drive test results revealed that most of the operators are not meeting the benchmarks of
network related parameters. They failed to achieve the benchmarks due to High Block Call Rate, High
Drop Call Rate, Low Call Setup Success Rate & poor Rx Quality. However, as mentioned earlier, this
result reflects only the network conditions on the route followed by the Test vehicles and as
determined during the day and time of the Drive test.
IDT Report
TRAI 19
SUMMARY
IDT Report
TRAI 20
1. The issue of call drop is regularly taken up by TRAI with the Chief Technology Officers (CTOs) of
all the TSPs and certain measures including network optimization discussed. They have been advised to
undertake their own Drive tests to effectively optimize their networks. Given the adverse impact of call
drops on the consumers, the TSPs were advised to take initiatives and improve their performance,
including exploring suitable compensation for call drops.
2. The TSPs have claimed that following are the main reasons contributing to frequent call drops:
a. Spectrum related issues such as limited spectrum; delay in allocation of spectrum;
reduction in 2G frequency band after the spectrum auction; and major changeover of
frequencies within and across the 900 MHz and 1800 MHz bands on the live networks
for some TSPs.
b. Poor coverage due to non-availability of sites for BTS in some areas; sealing of existing
sites; forced closure of existing sites by local bodies. During the last six months around
801 sites (Details at Annexure “A”)in Mumbai and 523 sites (Details at Annexure “B”)in
Delhi were shut-down due to various reasons (sealing of sites by municipal authorities,
RWA,EMF related issues, owner issues).The closure of each site impacts three to four
neighbouring sites which could result in increased call drops at such locations.
c. EMF radiation issues causing fear in the minds of general public.
d. Interference issues caused by illegal repeaters, private wide band repeaters, and other
wireless devices installed by individuals.
3. During the last one and half years the independent auditors appointed by TRAI have conducted
around 400 RF drive tests, each covering about 300 route Kms, totalling in excess of about 1.2 lakh route
Kms. Thus, all the states of the country have been covered by at least one RF Drive Test. Based on these
tests the TSPs are being/ have been instructed to take necessary action to improve coverage/quality in
the identified affected areas.
4. TRAI is evaluating the need for a consultation paper on ‘Regulatory Framework on Call Drops’,
based on available information and facts, discussions with TSPs, independent RF drive tests,
international best practices and other related issues.
--------------------