Embed Size (px)
Citation preview

RICERCA DI SISTEMA ELETTRICO
Analysis of the LBE-Water Interaction in the LIFUS 5 Facility to support the investigation of an SGTR Event in LFRs
A. Ciampichetti, D. Bernardi, N. Forgione
Report RdS/2010/102
Agenzia Nazionale per le Nuove Tecnologie, l’Energia e lo Sviluppo Economico Sostenibile

ANALYSIS OF THE LBE-WATER INTERACTION IN THE LIFUS 5 FACILITY TO SUPPORT THE
INVESTIGATION OF AN SGTR EVENT IN LFRS
A. Ciampichetti ENEA, D. Bernardi ENEA, N. Forgione ENEA
Settembre 2010
Report Ricerca di Sistema Elettrico
Accordo di Programma Ministero dello Sviluppo Economico – ENEA
Area: Produzione e fonti energetiche
Tema: Nuovo Nucleare da Fissione
Responsabile Tema: Stefano Monti, ENEA
~ Ricerca Sistema Elettrico
Sigla di identificazione
NNFISS - LP3 - 005
Distrib.
L
Pago
1
di
28
Titolo
ANALYSIS OF THE LBE-WATER INTERACTION IN THE LlFUS 5 FACILlTY
TO SUPPORT THE INVESTIGATION OF A SGTR EVENT IN LFRs
Descrittori Tipologia del documento: Rapporto Tecnico
Collocazione contrattuale: Accordo di programma ENEA-MSE: tema di ricerca "Nuovo nucleare da fissione"
Argomenti trattati: Tecnologia dei metalli liquidi Reattori nucleari veloci Generation IV Reactors Analisi incidentale
Sommario The main purpose of this experimental and computational study is to obtain an assessment of the
physical effects following energetic interaction between lead-bismuth eutectic alloy (LBE) and water;
this phenomenon is of great relevance in the analysis of a SGTR (Steam Generator Tube Rupture)
accident in a Lead-cooled Fast Reactor (LFR) as ELSY and far the qualification of the models
developed far the SIMMER code.
The experiment named ELSY-2, perfarmed with the facility LlFUS 5, was analysed with SIMMER code
using both the 20 and 3D versions. The calculation models employed in the simulations were realized
on the basis of the facility's real technical specifications. In particular, the calculated pressure time
trend inside the reaction vessel of LlFUS 5 facility resulted as being in quite good agreement with the
experimental data, although both versions of the code tended to overestimate the pressure in the first
staoe of the transient.
Note
Note: Rapporto Congiunto ENEA - CIRTEN (DIMNP - Università di Pisa)
Autori: Davide Bernardi 1 , Andrea Ciampichetti1
, Nicola Forgione2 , Francesco Poli2
1) ENEA, Unità Tecnica Ingegneria Sperimentale (UTIS), eRE Brasimone
2) Dipartimento Ingegneria Meccanica, Nucleare e della Produzione (DIMNP), Università di Pisa
Copia n. In carico a:
2 NOME
FIRMA
1 NOME
FIRMA
o EMISSIONE ~f /01/1Dr--_NO_M~E---tf-'"" le ,;t FIRMA
_A_._C_ia_m..c...p_ic_he-,-tt"TTi +-Il-N~-tll ,~ll+-a_r_a~ttt-ft1i rplt-+~"S,-"_M_o_n_ti--+-l cc ~'<.V>p . (_ ff. l/~ lVV"'o ~ J},..1 DJ r
REV. DESCRIZIONE DATA REDAZibNE CONVALIDA

Ricerca Sistema Elettrico
Sigla di identificazione
NNFISS – LP3 - 005
Rev.
0
Distrib.
L
Pag. di
2 28
2
Index
Introduction ............................................................................................................... 3
I) ELSY steam generator and the SGTR event ....................................................... 4
II) Configuration of LIFUS 5 facility ......................................................................... 8
III) Operating conditions and experimental results ............................................. 11
IV) Post test analysis .............................................................................................. 16
V) Suggestions for plant modifications ................................................................ 25
VI) Conclusions ...................................................................................................... 27
References .............................................................................................................. 28
Ricerca Sistema Elettrico
Sigla di identificazione
NNFISS – LP3 - 005
Rev.
0
Distrib.
L
Pag. di
3 28
3
Introduction
Among the six nuclear reactor types selected by the Generation IV International Forum
(GIF), the Lead-cooled Fast Reactor (LFR) represents one of the most promising concepts in
terms of safety, economics and sustainability.
The preliminary configuration of the ELSY (European Lead-cooled SYstem) reactor [1-2]
foresees the adoption of Steam Generator Units (SGU) placed inside the reactor vessel in
direct contact with molten lead. Because of the high pressure foreseen for the secondary
water circuit and of the large number of pipes housed in the SGU, the probability of a tube
rupture can not be considered negligible. Therefore, one of the most important safety issues
to address in the design stage is the possibility of mitigating the consequences of a Steam
Generator Tube Rupture (SGTR) accident [3-4] and reducing the risk of the primary tank
pressurization due to water-lead interaction. To satisfy this requirement, various full passive
mechanisms were envisaged [2]. Among these, a particular passive safety concept has been
conceived and it will be presented in the next section. To test the validity of this solution and
assess the effects of such kind of accidental situation, a study of the lead/water interaction in
conditions representative of a SGTR event under ELSY operating conditions was performed
within the frame of the ELSY project [5]. In this frame, an experimental test was conducted
on the dedicated facility LIFUS 5 at the ENEA Brasimone Research Centre with a supporting
modelling activity carried out at the University of Pisa. The experiment has been conducted
by injecting water at the pressure of 185 bar and with a temperature of 300 °C into a volume
of 80 l of Lead Bismuth Eutectic (LBE) kept at atmospheric pressure and at a temperature of
400 °C.
The aim of the experiment was both to assess the possible consequences related to the
SGTR incidental event and also to provide data for the validation of the numerical models
that will be used to simulate this accident scenario on a reactor scale. The set of geometric
and operating conditions selected for the experiment was chosen on the basis of the steam
generator’s design and of a pre-test analysis performed with the SIMMER code [6]. In this
report, the experimental results are presented along with their comparison with the data
obtained by a post-test computational analysis perfomed using both 2D and 3D versions of
the SIMMER code.

Ricerca Sistema Elettrico
Sigla di identificazione
NNFISS – LP3 - 005
Rev.
0
Distrib.
L
Pag. di
4 28
4
I) ELSY steam generator and the SGTR event
The preliminary configuration of ELSY reactor [1-2] foresees the adoption of 8 Steam
Generator Units (SGU) each of them characterized by a spiral-wound tube bundle arranged
in the bottom-closed, annular space formed by a vertical outer and an inner shell (see Fig. 1).
The inlet and outlet ends of each tube are connected to the feed water header and the steam
header, respectively, both arranged above the reactor roof.
Figure 1 Sketch of the Primary Pump - Steam Generator Unit assembly [2]

Ricerca Sistema Elettrico
Sigla di identificazione
NNFISS – LP3 - 005
Rev.
0
Distrib.
L
Pag. di
5 28
5
The spiral-wound tubes are disposed so as to form flat layers perpendicular to the SGU
axis with two spirals per layer. These layers are then placed one above the other at equally
spaced distances (see Fig. 2).
The primary coolant is forced by an axial pump located inside the internal SGU vertical
tube to radially flow through the perforated inner shell, pass the tube spirals and exit from the
outer shell. The feed water in the tube circulates from the outer spiral to the inner spiral, so
that the thermal configuration is almost equivalent to a pure counter-current scheme.
The main geometrical features and operating conditions foreseen for each ELSY SGU are
summarized in Tables 1 and 2, respectively.
An important characteristic of the system is the possibility of mitigating the consequences
of a Steam Generator Tube Rupture (SGTR) accident [3-4] and reducing the risk of the
primary tank pressurization.
To satisfy this requirement, various full passive mechanisms are envisaged [2].
Among these, the possibility of installing a check valve close to the steam header and a
self-actuated valve close to the feed water header on each tube of the SGU is under
evaluation, aiming at isolating the excess flow (see Fig. 2). By means of these valves,
reverse steam flow is prevented and any leaking tube promptly isolated.
Figure 2 Scheme of the tubes-headers connection [2]

Ricerca Sistema Elettrico
Sigla di identificazione
NNFISS – LP3 - 005
Rev.
0
Distrib.
L
Pag. di
6 28
6
Beyond that, a special full passive mechanism is conceived in order to assure that the
flow of any feed water/steam-liquid metal mixture resulting from an eventual tube rupture be
automatically redirected upwards towards the cover gas plenum located at the top of the
SGU, therefore eliminating the risk of potentially disruptive pressure surges in the reactor
vessel (see Fig. 3).
The technological solution proposed in the preliminary design to achieve this goal foresees
the adoption of two perforated cylindrical plates positioned inside the annulus space nearby
the inner and the outer shells respectively and held a few millimetres apart from them by
suitable spacers. These spacers are designed so as to collapse if given overpressure due to
a SGTR accident takes place inside the annulus volume. In such a case, the SGU shells and
their companion plates are crushed against each other and since the holes of the
corresponding perforations are staggered and the bottom end of the annulus is closed, there
will be no other way out for the mixture but the upwards path towards the top cover gas
plenum, which acts to damp the pressure surge. This assures that the mixture flow coming
from an eventual tube rupture be automatically discharged outside the steam generator
volume, reducing the risk of potentially disruptive pressure surges in the reactor vessel.
As can be inferred from the description above, the SGU is not hermetic: therefore, in order
to experimentally simulate the possibility of discharging the water-steam/liquid metal mixture
coming from a SGTR accident outside towards the cover gas of the primary system, some
modifications to the previous configuration of the LIFUS 5 facility were introduced (see the
next Section).
Outer diameter of the pump impeller (mm) 1100
Inner diameter of the SGU inner shell (mm) 1120
Outer diameter of the SGU inner shell (mm) 1220
Inner diameter of the inner shell companion plate (mm) 1230
Outer diameter of the inner shell companion plate (mm) 1240
Porosity of the inner shells (%) 30
Inner diameter of the outer shell companion plate (mm) 2420
Outer diameter of the outer shell companion plate (mm) 2430
Inner diameter of the SGU outer shell (mm) 2440
Outer diameter of the SGU outer shell (mm) 2540
Porosity of the outer shells (%) 15
Number of tubes 218
Length of the tubes (m) 55

Ricerca Sistema Elettrico
Sigla di identificazione
NNFISS – LP3 - 005
Rev.
0
Distrib.
L
Pag. di
7 28
7
Number of tubes per layer 2
O.D. of the tubes (mm) 22,22
Thickness of the tubes (mm) 2,5
Radial pitch (mm) 24
Axial pitch (mm) 24
Height (coil only) (mm) 2620
Table 1 Preliminary geometric characteristics of the SGU-Primary Pump assembly [2]
Thermal duty (MW) 187.5
Lead inlet temperature (°C) 480
Lead outlet temperature (°C) 400
Water inlet temperature (°C) 335
Steam outlet temperature (°C) 470,8
Water flow (kg/s) 114,7
Water pressure in the collectors (MPa) 20,2
Water pressure at SGU inlet (MPa) 19,1
Steam outlet pressure (MPa) 18
Primary pressure loss in the bundle (MPa) 0,02
Table 2 Basic operating conditions foreseen for the ELSY SGU [2]
1) Radial coolant flow pattern is interrupted by the inner companion shells radial displacement
because of the spacers failure.Flow directed upwards towards the cover gas
plenum
Figure 3 Upwards flow in case of SGTR accident [2]

Ricerca Sistema Elettrico
Sigla di identificazione
NNFISS – LP3 - 005
Rev.
0
Distrib.
L
Pag. di
8 28
8
II) Configuration of LIFUS 5 facility
A detailed description of the previous LIFUS 5 configuration is reported in [5, 7]. Considering
the design of the ELSY SGU, and in particular the fact that in case of a SGTR event the
water-vapour/liquid metal mixture can be discharged outside towards the cover gas of the
primary system, the decision to modify the layout of the facility was reached with the aim of
reproducing the system’s behaviour closely. In particular, the reaction vessel S1 was directly
connected to the discharge vessel S3 and the expansion vessel S5 was eliminated. In order
to accomplish this task, the flange of S1 was modified and a new discharge line constructed.
Moreover, the expansion tubes connecting S1 to S5 were used to introduce pressure
transducers also in the upper part of the reaction vessel where cover gas volume is foreseen
for the present experiment.
The discharge line was designed considering a tube of 88.9x7.62 mm and a thermo-
mechanical analysis with ANSYS code was performed taking into account different scenarios
of temperature and pressure inside S1 and S3 vessels.
The final design of the discharge line consists of a 3” schedule 80 tube (outer diameter 88.9
mm, thickness 7.62 mm) made of AISI 316L, two welding neck flanges and three 90° elbows.
During the preparation of the plant in view of the experiment, the storage tank (S4) used for
melting the liquid metal and filling the reaction vessel S1 with an electromechanical pump
was replaced with a different tank. Now the filling procedure is performed pressurising the
storage tank.
The new P&I diagram of LIFUS 5 is reported in Fig. 4.
Figure 4 New LIFUS 5 layout

Ricerca Sistema Elettrico
Sigla di identificazione
NNFISS – LP3 - 005
Rev.
0
Distrib.
L
Pag. di
9 28
9
The pressure transducers on S1 are positioned in such a manner that they can monitor the
pressure evolutions in both LBE phase and gas phase. An updated detailed scheme of their
positioning is shown in Fig. 5 (the PT arrangement shown in Fig.1 refers to the previous
configuration and must not be considered here). The transducers PT1, PT4, PT6 and PT7
are placed at mid height on S1 lateral walls in LBE phase, while the transducers PT3 and
PT5 are disposed on the S1 top flange in argon phase. In addition to the PTs visible in Fig. 5,
another pressure transducer (PT2) is positioned on the water injection tube. The
thermocouples placed on the S1 tube bundle are disposed in the same manner as they were
arranged in the previous experiments [7]. Their positioning is reported in Fig. 6. An additional
thermocouple was placed inside the discharge tube just above the top flange of S1, so
allowing the detection of the eventual passage of LBE/vapour mixture during the test.
Figure 5 Pressure transducers positioning

Ricerca Sistema Elettrico
Sigla di identificazione
NNFISS – LP3 - 005
Rev.
0
Distrib.
L
Pag. di
10 28
10
Figure 6 Thermocouples positioning
Ricerca Sistema Elettrico
Sigla di identificazione
NNFISS – LP3 - 005
Rev.
0
Distrib.
L
Pag. di
11 28
11
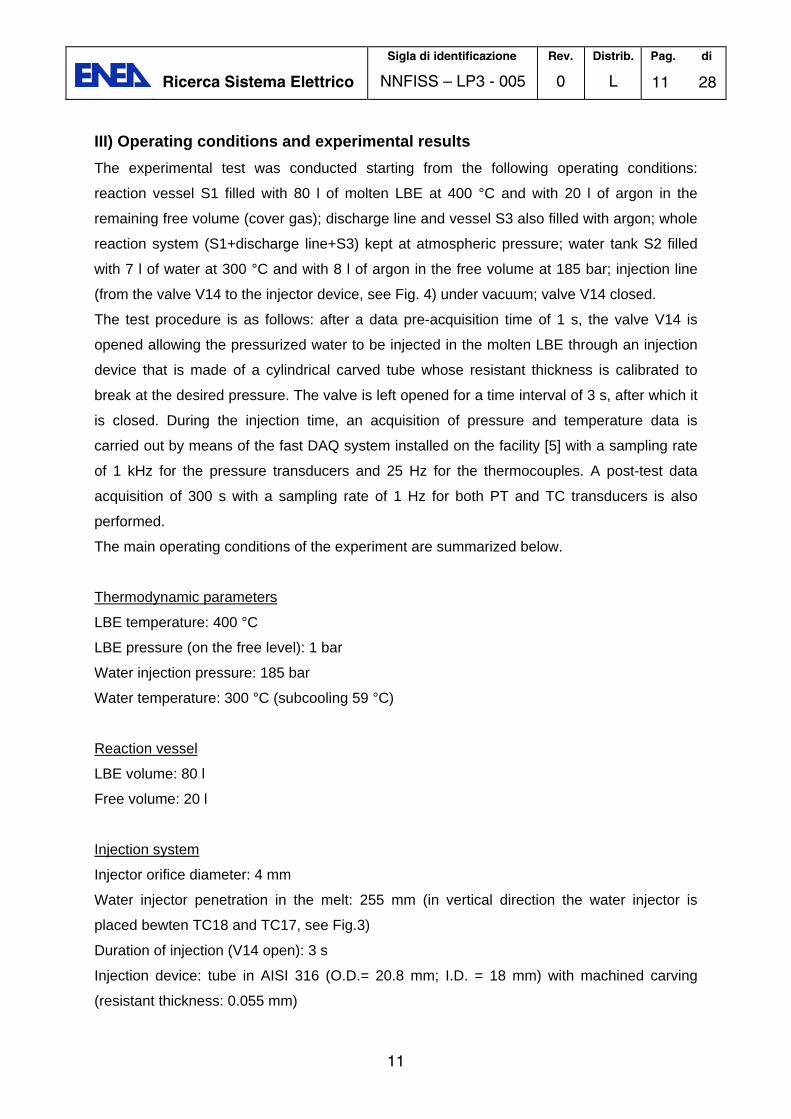
III) Operating conditions and experimental results
The experimental test was conducted starting from the following operating conditions:
reaction vessel S1 filled with 80 l of molten LBE at 400 °C and with 20 l of argon in the
remaining free volume (cover gas); discharge line and vessel S3 also filled with argon; whole
reaction system (S1+discharge line+S3) kept at atmospheric pressure; water tank S2 filled
with 7 l of water at 300 °C and with 8 l of argon in the free volume at 185 bar; injection line
(from the valve V14 to the injector device, see Fig. 4) under vacuum; valve V14 closed.
The test procedure is as follows: after a data pre-acquisition time of 1 s, the valve V14 is
opened allowing the pressurized water to be injected in the molten LBE through an injection
device that is made of a cylindrical carved tube whose resistant thickness is calibrated to
break at the desired pressure. The valve is left opened for a time interval of 3 s, after which it
is closed. During the injection time, an acquisition of pressure and temperature data is
carried out by means of the fast DAQ system installed on the facility [5] with a sampling rate
of 1 kHz for the pressure transducers and 25 Hz for the thermocouples. A post-test data
acquisition of 300 s with a sampling rate of 1 Hz for both PT and TC transducers is also
performed.
The main operating conditions of the experiment are summarized below.
Thermodynamic parameters
LBE temperature: 400 °C
LBE pressure (on the free level): 1 bar
Water injection pressure: 185 bar
Water temperature: 300 °C (subcooling 59 °C)
Reaction vessel
LBE volume: 80 l
Free volume: 20 l
Injection system
Injector orifice diameter: 4 mm
Water injector penetration in the melt: 255 mm (in vertical direction the water injector is
placed bewten TC18 and TC17, see Fig.3)
Duration of injection (V14 open): 3 s
Injection device: tube in AISI 316 (O.D.= 20.8 mm; I.D. = 18 mm) with machined carving
(resistant thickness: 0.055 mm)

Ricerca Sistema Elettrico
Sigla di identificazione
NNFISS – LP3 - 005
Rev.
0
Distrib.
L
Pag. di
12 28
12
DAQ system
Pre-acquisition time: 1 s
Fast acquisition time: 3 s
Sample frequency: 1 kHz for PTs; 25 Hz for TCs
Post-test acquisition time: 300 s with sampling frequency of 1 Hz for both PTs and TCs
A leak test in argon at 124 bar and 350 °C had been performed before the experiment to
assess the sealing of the interaction system (S1). The test showed a leakage rate of 0.03
bar/min.
The pressure evolution detected by the transducers installed on the vessel S1 is shown in
Fig. 7 with the exception of transducer PT1 that failed during the test. It is useful to point out
that t = 1000 ms in the graphs of the experimental results presented in this section
corresponds to the opening signal given to V14 valve, while the first second is the pre-
acquisition time. In Figs. 8 and 9, pressure behaviour in the LBE and gas phases are also
reported separately for the sake of clarity. It can be noted that in the initial stage, after a
sharp peak, pressure in the LBE rises until it reaches values of approximately 2.4 MPa in
about 0.5 s from the starting of water injection inside S1. Then, a depressurisation is
observed with small peaks close to 1 MPa. After the completion of the injection time a final
pressure value of about 0.5 MPa was achieved.
In argon phase the pressure transducers PT3 and PT5 detect the same behaviour but with
more pronounced oscillations (Fig.9). However, the first sharp pressure peak, that is due to
the water jet impact against the liquid metal at the beginning of the injection, was detected
only in LBE where reached a value of 3.4 MPa.
Fig. 10 shows the temperature histories detected by the thermocouples TC18, TC17 and
TC16 placed respectively at the bottom, middle and top of tube n. 3 of the bundle. The
instant of injection can be clearly identified as the point where the temperature of the
thermocouple TC16 and 17 rapidly dropped from its initial value (400 °C) to some 200 °C
lower. TC18 detects a slower and reduced temperature decrease because it was placed at
the bottom of the tube bundle while the water injector is placed above.

Ricerca Sistema Elettrico
Sigla di identificazione
NNFISS – LP3 - 005
Rev.
0
Distrib.
L
Pag. di
13 28
13
0
5
10
15
20
25
30
35
40
0 1000 2000 3000 4000 5000 6000
Time [ms]
Pre
ssu
re [
bar
]
PT3
PT4
PT5
PT6
PT7
Figure 7 Experimental pressure behaviours in S1
0
5
10
15
20
25
30
35
40
0 1000 2000 3000 4000 5000 6000
Time [ms]
Pre
ssu
re [
bar
]
PT4
PT6
PT7
Figure 8 Experimental pressure behaviours in LBE

Ricerca Sistema Elettrico
Sigla di identificazione
NNFISS – LP3 - 005
Rev.
0
Distrib.
L
Pag. di
14 28
14
0
5
10
15
20
25
30
0 1000 2000 3000 4000 5000 6000
Time [ms]
Pre
ssu
re [
bar
] PT3PT5
Figure 9 Experimental pressure behaviours in the cover gas
0
50
100
150
200
250
300
350
400
450
0 1000 2000 3000 4000 5000 6000 7000 8000 9000 10000
Time [ms]
Tem
per
atu
re [
°C]
TC16TC17TC18
Figure 10 Experimental temperature behaviour at different heights as detected by TC16, TC17 and TC18 in the tube n.3 of the bundle (refer to Fig. 6)
Ricerca Sistema Elettrico
Sigla di identificazione
NNFISS – LP3 - 005
Rev.
0
Distrib.
L
Pag. di
15 28
15
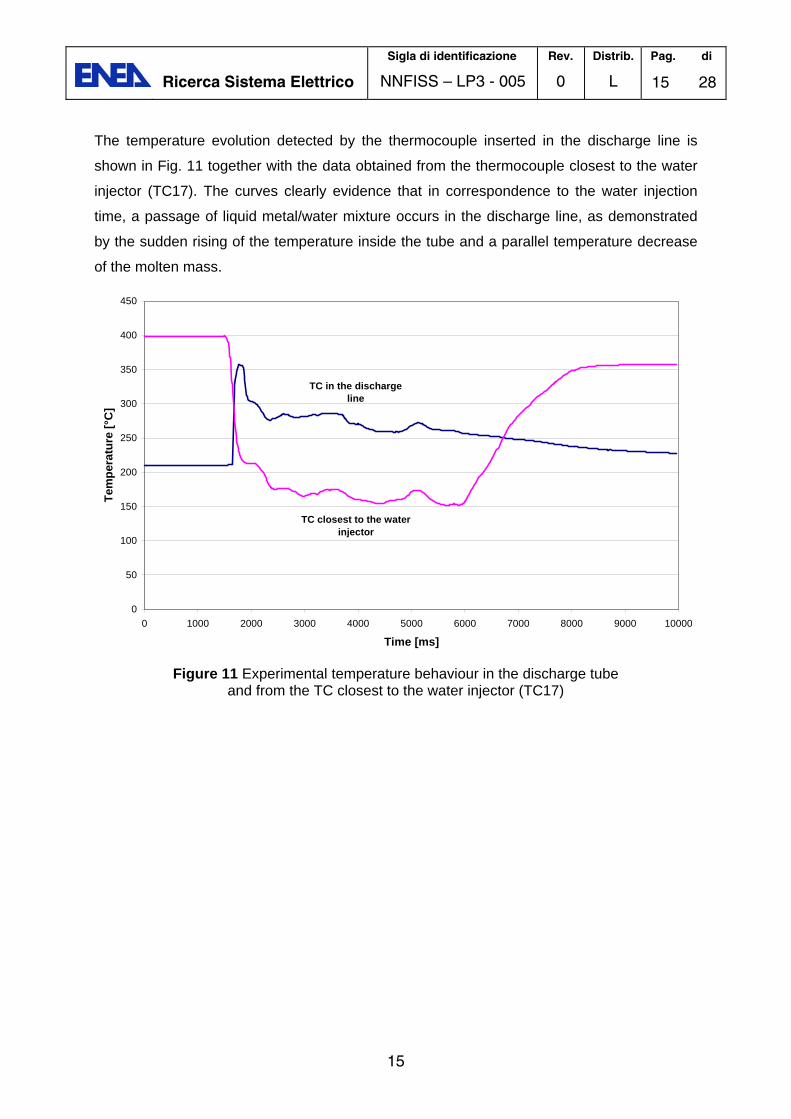
The temperature evolution detected by the thermocouple inserted in the discharge line is
shown in Fig. 11 together with the data obtained from the thermocouple closest to the water
injector (TC17). The curves clearly evidence that in correspondence to the water injection
time, a passage of liquid metal/water mixture occurs in the discharge line, as demonstrated
by the sudden rising of the temperature inside the tube and a parallel temperature decrease
of the molten mass.
0
50
100
150
200
250
300
350
400
450
0 1000 2000 3000 4000 5000 6000 7000 8000 9000 10000
Time [ms]
Tem
per
atu
re [
°C]
TC in the discharge line
TC closest to the water injector
Figure 11 Experimental temperature behaviour in the discharge tube and from the TC closest to the water injector (TC17)

Ricerca Sistema Elettrico
Sigla di identificazione
NNFISS – LP3 - 005
Rev.
0
Distrib.
L
Pag. di
16 28
16
IV) Post test analysis
Computational domains
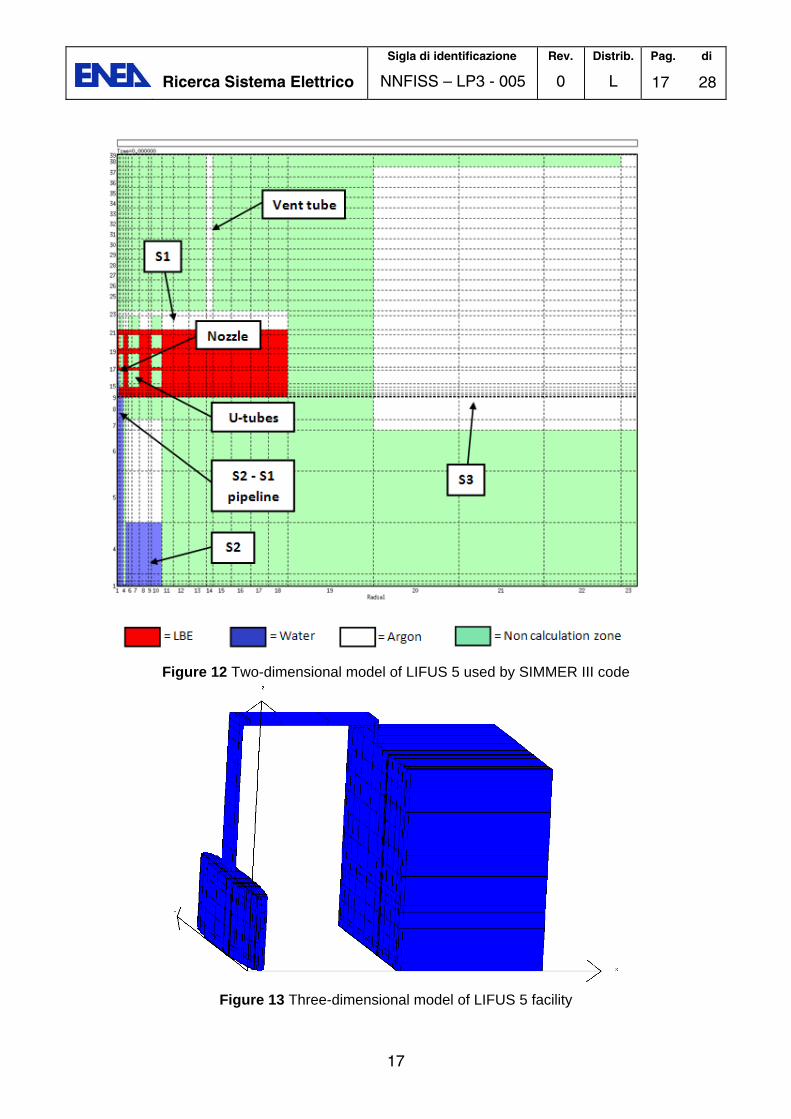
Concerning the simulation performed with SIMMER III code, the whole experimental facility
(including the discharge tube and the expansion vessel S3) was simulated by means of an
equivalent axial-symmetric domain. Because of the quite complicated geometry of LIFUS 5
test section it was necessary to introduce many simplifying assumptions. In particular, the
presence of the tubes bundle was modeled with twelve circular rings conserving the real
volume of the U-tubes. Moreover, the water injector, in order to simplify the geometric model,
was placed in a coaxial position with vessel S1, while the vent tube was positioned in a
location similar to the real one.
Nevertheless, the main conditions that were respected in the development of the model are:
- the volume of LBE in the reaction vessel S1 and the volume of argon in the safety vessel
S3;
- the volume of the water vessel S2;
- the flow area of the injector pipe and of the vent tube connecting the reaction and the
expansion vessels;
- the height of the main components of the facility to keep the real hydraulic heads of
liquid.
In Fig. 12 an image of the SIMMER III two-dimensional model used for ELSY-2 test is shown.
In Figs. 13 to 16 some images of the 3D model of LIFUS 5, developed with SIMMER IV, are
reported. In Fig. 13, e.g., a 3D picture of the facility, with the presence of the reaction vessel
S1, the expansion vessel S3 and the connecting pipeline, can be observed. With this version
of the code, although there are some advantages in modelling the facility, such as the
capability of conserving the correct distance and relative position of the injector and the vent
tube, there are different problems. In particular, the constraints on the maximum number of
calculus cells doesn’t allow to make a too refined nodalization such as the one used with the
2D version of SIMMER code. Moreover, S2 vessel was not modeled in the 3D domain so as
to avoid increasing the computational cost; it was substituted with a constant pressure
boundary condition. As can be observed in Fig. 14, the cross section of the reaction vessel
S1 was approximated by a series of rectangular cells, looking to conserve the value of the
average radius of the reaction vessel S1.
The presence of the tubes bundle, shown in Fig. 16, was modelled with a parallelepiped of
the same height of the U-tubes placed above the water injector.
Ricerca Sistema Elettrico
Sigla di identificazione
NNFISS – LP3 - 005
Rev.
0
Distrib.
L
Pag. di
17 28
17
Figure 12 Two-dimensional model of LIFUS 5 used by SIMMER III code
Figure 13 Three-dimensional model of LIFUS 5 facility

Ricerca Sistema Elettrico
Sigla di identificazione
NNFISS – LP3 - 005
Rev.
0
Distrib.
L
Pag. di
18 28
18
used for the simulation with SIMMER IV code
Figure 14 Three-dimensional model of LIFUS 5 facility (horizontal section of S1 vessel)
Figure 15 Three-dimensional model of LIFUS 5 facility (longitudinal section of the apparatus)
S1 Vessel
Vent Pipe
S3 Vessel

Ricerca Sistema Elettrico
Sigla di identificazione
NNFISS – LP3 - 005
Rev.
0
Distrib.
L
Pag. di
19 28
19
Figure 16 Three-dimensional model of LIFUS 5 facility (vertical section of S1 vessel)
Obtained results
The calculated pressure and temperature values are related to mesh cells placed as close as
possible to the real position of the transducers and thermocouples present in the facility
(see Figs. 5 and 6).
Fig. 17 reports the locations where data of pressure, temperature and mass flow calculated
by SIMMER III code are compared with the available experimental values.
As can be seen from Fig. 18.a, in the LBE region the pressure time trend calculated by
SIMMER III is quite similar to the experimental one, except for the overestimation of the
pressurization peak. The first phase of the transient is well simulated although the initial
pressure peak due to the impulsive load is underestimated by the code (see Fig. 18.b).
The pressure trend calculated by SIMMER IV further overestimates the experimental one in
the overall transient, but the first pressure peak approaches the experimental one better (see
Fig. 18). Besides, in the first transient phase it shows smaller fluctuations than the
experimental data.
U-Tubes

Ricerca Sistema Elettrico
Sigla di identificazione
NNFISS – LP3 - 005
Rev.
0
Distrib.
L
Pag. di
20 28
20
Figure 17 Two-dimensional domain with the position of temperature (green),
pressure (yellow) and mass flow rate (cyan) monitoring cells
a) full transient b) first phase of the transient
Figure 18 Pressure time trends for simulated and experimental data in PT7 location
PT7
PT3
PT6
PT2
TC16
TC17
TC4
TC5
TC6TC18
TC14

Ricerca Sistema Elettrico
Sigla di identificazione
NNFISS – LP3 - 005
Rev.
0
Distrib.
L
Pag. di
21 28
21
The pressure time evolution measured by PT3 transducer, placed in the cover gas region, is
shown in Fig. 19. Both versions of the code were not able to predict the oscillatory behavior
observed experimentally. Moreover, SIMMER III simulation shows a very high pressure peak
at 0.05 s that in the experimental data is just appreciable. Probably this pressure peak can
be associated to perturbations that are amplified by numerical ways. Such as the previous
results, the numerical data obtained by 2D model present an overestimation of the maximum
value of the pressure and a delay in the first part of the depressurization phase, while the
second phase of the transient better approaches the experimental data.
Data resulting from three-dimensional simulation are, in the first half period of the simulation,
qualitatively in agreement with experimental ones, although once again showing an
overestimation of the pressurization peak present at about 0.4-0.5 s. In the depressurization
phase there was a large overestimation of pressure values.
a) full transient b) first phase of the transient
Figure 19 Pressure time trends for simulated and experimental data in PT3 location
Observing the pressure trends in the injection pipe, shown in Fig. 20, it is possible to see an
important difference from the data obtained from SIMMER IV simulation respect to the
others. In fact, for the 3D simulation this pressure was practically constant at about 185 bar
during all the transient, because as previously mentioned the S2 vessel was not modeled in
the domain. The experimental and the SIMMER III data are very similar except for a
difference in the slope: the calculated trend of pressure is characterized by a greater rate of
reduction. Furthermore, it should be noted that experimental pressure does not start at
nominal value of 185 bar but at a lower value, this could be due to a water leak in the
injection pipe.

Ricerca Sistema Elettrico
Sigla di identificazione
NNFISS – LP3 - 005
Rev.
0
Distrib.
L
Pag. di
22 28
22
Figure 20 Pressure time trends for simulated and experimental data in PT2 location
The Fig. 21 represents the temperature time trends detected in the S1 region close to the
injector. In the first instants the temperature calculated in the 2D simulation is quite similar to
experimental data, but after about 0.5 s the calculated data tends to overestimate the
experimental one and to provide big perturbations that are un-noticeable in experimental
data.
Figure 21 Temperature time trends for simulated and experimental data
in the bottom location (TC17)

Ricerca Sistema Elettrico
Sigla di identificazione
NNFISS – LP3 - 005
Rev.
0
Distrib.
L
Pag. di
23 28
23
Moving to the top of the vessel, in the cover-gas, the differences between calculated and
experimental trends were smaller but still present. Fig. 22 shows that the simulated trends
underestimates the experimental data, they had substantially the same average trend but
with perturbations of not negligible entity.
Figure 22 Temperature time trends for simulated and experimental data
in the top location (TC4)
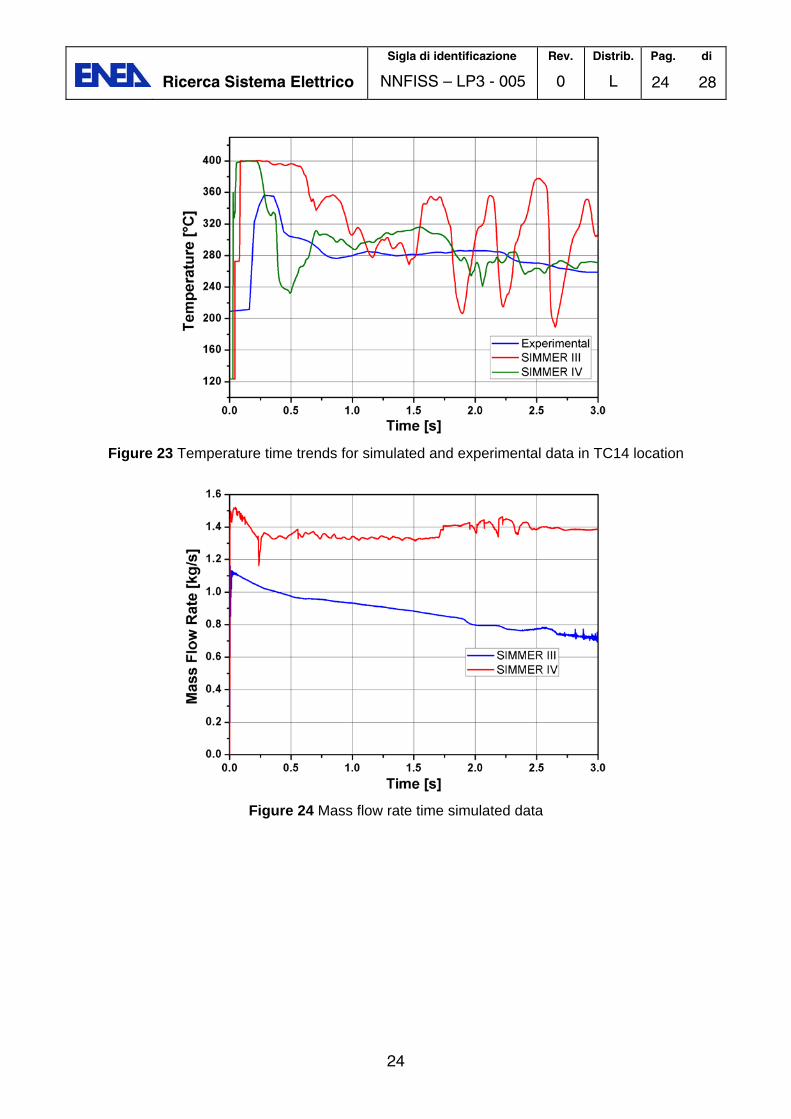
Another important place where temperature is detected is the vent tube where the
temperature has a sharp rise when LBE passes through going to in the expansion tank S3. In
Fig. 23 it is evident that, in the first part of the transient, SIMMER simulations predict an
instataneus start of the transition of LBE in the S3, while the experimental data showed that
the transition start is delayed by about 0.2 s.
Experimental data on the total amount of injected water was not available due to a problem
in the injection line. Fig. 24 represents the calculated time trend of the water injection mass
flow rate. It is possible to see, for the 2D model, that the mass flow rate starts from a value of
1.1 kg/s and linearly decreases to 0.7 kg/s after 3 s, while the result obtained from SIMMER
IV shows a quite constant flow rate of 1.4 kg/s during all the transient.
Regarding the amount of LBE moved to S3 expansion tank, experimental data says that
123 kg ended up in the vessel, while the simulated data provides a quantity of about
330 kg. This overestimation could be considered in agreement with what was observed for
the rapid LBE transition from S1 to S3 predicted by the code.
Ricerca Sistema Elettrico
Sigla di identificazione
NNFISS – LP3 - 005
Rev.
0
Distrib.
L
Pag. di
24 28
24
Figure 23 Temperature time trends for simulated and experimental data in TC14 location
Figure 24 Mass flow rate time simulated data

Ricerca Sistema Elettrico
Sigla di identificazione
NNFISS – LP3 - 005
Rev.
0
Distrib.
L
Pag. di
25 28
25
V) Suggestions for plant modifications
The development of the experimental activity foresees refurbishment of the LIFUS 5 facility in
order to:
operate under more controlled and easy-to-simulate conditions
repeating experimental tests with higher frequencies than in the past
In order to pursue these objectives different actions will be taken:
Upgrade of the test section: in particular the elimination of the discharge tube (to have
a 2-D axisymmetric geometry and a reduced reaction volume), the removal of the
tube bundle (to achieve 2-D axialsymmetric configuration) and the use of a new
sealing system for the flange of S1 (to reduce the time between successive tests).
Design of a new water injection system: water injection and LBE filling/draining will be
both performed through the same axial penetration at the bottom of the vessel (to
achieve 2-D axialsymmetric configuration), pyrotechnic valves to trigger and stop the
injection will be adopted (to have a precise control of the injection pressure and time).
Set-up of the instrumentation and development of a new control and data acquisition
system. In particular the instrumentation will include:
A much greater number of TCs for fast acquisition (about 75 vs 20 currently
present). A new arrangement of these TCs has been chosen and is reported
in Fig.25;
Fast pressure tranducers (much likely the same 8 that are presently installed);
Strain gauges on the inner vessel walls of vessel S1 (to be qualified);
A level transducer in the water vessel for precise measurement of the water
injected;
An ultrasound flow rate transducer placed on the water line (to be qualified).

Ricerca Sistema Elettrico
Sigla di identificazione
NNFISS – LP3 - 005
Rev.
0
Distrib.
L
Pag. di
26 28
26
Figure 25 Arrangement of the TCs for fast acquisition
Ricerca Sistema Elettrico
Sigla di identificazione
NNFISS – LP3 - 005
Rev.
0
Distrib.
L
Pag. di
27 28
27
VI) Conclusions
Test ELSY-2 was performed injecting water at 185 bar in the reaction vessel of LIFUS 5
containing LBE at 400 °C. The experimental results showed a first sharp pressure peak,
detected only in the liquid metal and due to the impact of the water jet against the LBE, and a
subsequent pressurisation of the reaction vessel up to 2.4 MPa. This value was reached in
about 0.5 s from the starting of water injection inside S1.
The post-test analysis of the experiment, performed for the validation of the numerical
models developed for SIMMER III and SIMMER IV codes, has evidenced different interesting
results:
The pressure time evolution in the reaction vessel S1 is in quite good agreement with
the experimental data recorded. However, both versions of the code tend to
overestimate the first stage of the transient, while in the depressurization phase the 2D
code produces a trend that approaches better the experimental one.
SIMMER IV code shows its capacity to predict the pressure peak at the beginning of the
test, following to the impact of the water jet towards the liquid metal surface.
Both versions of the code tend to underestimate the cooling of LBE measured by the
thermocouples placed at the bottom of the reaction vessel and to overestimate the
temperature assessed by the thermocouples placed at the top of the vessel.
The experimental and modelling activities have suggested several plant modifications that
will be carried out before to perform the next experiments.

Ricerca Sistema Elettrico
Sigla di identificazione
NNFISS – LP3 - 005
Rev.
0
Distrib.
L
Pag. di
28 28
28
References
[1] L. Cinotti et al., The potential of LFR and ELSY Project, Proceedings of ICAPP 2007,
Nice, France, May 13-18, 2007
[2] L. Cinotti, Reactor Assembly preliminary Configuration, Del Fungo Giera Energia,
Technical Report, ELSY project - ELSY DOC 08 049, 26-04-200
[3] Truc-Nam Dinh, Multiphase flow phenomena of Steam Generator Tube Rupture in a
Lead-Cooled Reactor System: a scooping analysis, Proceedings of ICAPP 2007, Nice,
France, May 13-18, 2007
[4] S. Wang, M. Flad et al., Evaluation of a Steam Generator Tube Rupture Accident in an
Accelerator Driven System with lead cooling, International Symposium on Innovative
Nuclear Energy System, INES-2, November 26-30 2006, Yokohama, Japan
[5] A. Ciampichetti, Task 6.3 of ELSY project: SGTR at high pressure - Deliverable D37
(Chapters: Scope of the work and Description of Lifus 5 facility)
[6] D. Bernardi, A. Ciampichetti, N. Forgione, Test parameters definition for SGTR
experiments, Technical Report – Doc 57, Task 6.3 of ELSY project
[7] A. Ciampichetti, D. Pellini, P. Agostini, G. Benamati, N. Forgione, F. Oriolo, Experimental
and computational investigation of LBE–water interaction in LIFUS 5 facility, Nuc. Eng.
Des. 239 (2009) 2468-2478