Embed Size (px)
Citation preview

AD-A234 482
GL-TR-88-0111ENVIRONMENTAL RESEARCH PAPERS, NO. 1002
Analysis of the IRAS Low Resolution Spectra
IRENE LITTLE-MARENIN
1 April 1988
4c0 Approved for public release; distribution unlimited
OPTICAL PHYSICS DIVISION PROJECT 7670
AIR FORCE GEOPHYSICS LABORATORYHANSCOM AFB, MA 01731
.. ,

"This technical report has been reviewed and is approved for publication"
FOR THE COMMANDER
(Si grr'ture C ignature)STEPMAN D. PRICE, Chief R. EARL GOOD, Acti'ng DirectorCelestial Backgrounds Branch Optical Physics Division
This document has been reviewed by the ESD public Affairs Office (PA) andis releasale to the National Technical Information Service (NTIS).
Qualified requestors may obtain additional copies from the DefenseTechnical Information Center. All others should apply to the NationalTechnical Information Service.
If your address has changed, or if you wish to be removed from the mailinglist, or if the addressee is no longer employed by your organization,please notify AFGL/DAA, Hanscom AFB, MA 01731. This will assist us inmaintaining a current mailing list.
Do not return copies of this report unless contractual obligations ornotices on a specific document requires that it be returned.
LI

UNCLASSIFIEDSECURITY CLASSiFICATION Or- THIS PAGE
Form ApprovedREPORT DOCUMENTATION PAGE OMB No,07C4-0188
Ia. REPORT SECURITY CLASSIFICATION 1b, RESTRICTIVE MARKINGSUNCLASSIFIED_________________
_____
2a. SECURITY CLASSIFICATION AUTHORITY 3. DISTRIBUTION /AVAILABILITY OF REPORT
2b. ECLSSIICAIONDOWNRA~NG CHEULEApproved for Public Release;2b. ECLSSIICATON DOWORACNG CHEULEDistribution unlimited
4. PERFORMING ORGANIZATION REPORT NUMBER(S) S MONITORING ORGANIZATION REPORT NUMBER 5)
AFGL-TR-88-0l111_ERP, No. 1002 _ _____
6a. NAME OF PERFORMING ORGANIZATION 6b. OFFICE SYMBOL 7a, NAME OF MONITORING ORGANIZATIONAir Force (if applicable)
-Geophysics Laboratory OPC___________ ____________
6c. ADDRESS (City, State, and ZIP Code) 7b. ADDRESS (City, State, and ZIP Code)
Hlanscom AFB3Massachisettcs- 91431-5000
8a. NAME OF FUNDING /SPONSORING 8b. OFFICE SYMBOL 9. PROCUREMENT INSTRUMENT IDENTIFICATION NUMBERORGANIZATION (if applicable)
P-. ADDRESS (City, State, and ZIP Code) 10. SOURCE OF FUNDING NUMBERSPROGRAM IPROJECT ITASK WORK( UNITELEMENT NO. NO. NO ACCESSION NO
11. TITLE (include Security Classification)620F 7 0061
Analysis of the HRAS Low Resolution Spcctra12. PERSONAL AUTHOR(S)
Irene Little-Marenin13a. TYPE OF REPORT 13b. TIME COVERED 14. DATE OF REPORT (Year, Month, Day) 5.PAGE COUNT
In-house -IFROM _ TO _ 1988 April 1 - 1716. SUPPLEMENTARY NOTATION
17. COSATI CODES 18. SUBJECT TERMS (Continue on reverse if necessary and identify by block number)FIELD GROUP ISUB-GROUP
03 01~z Infrared Astronomy, Stellar Spectra03 02 -1
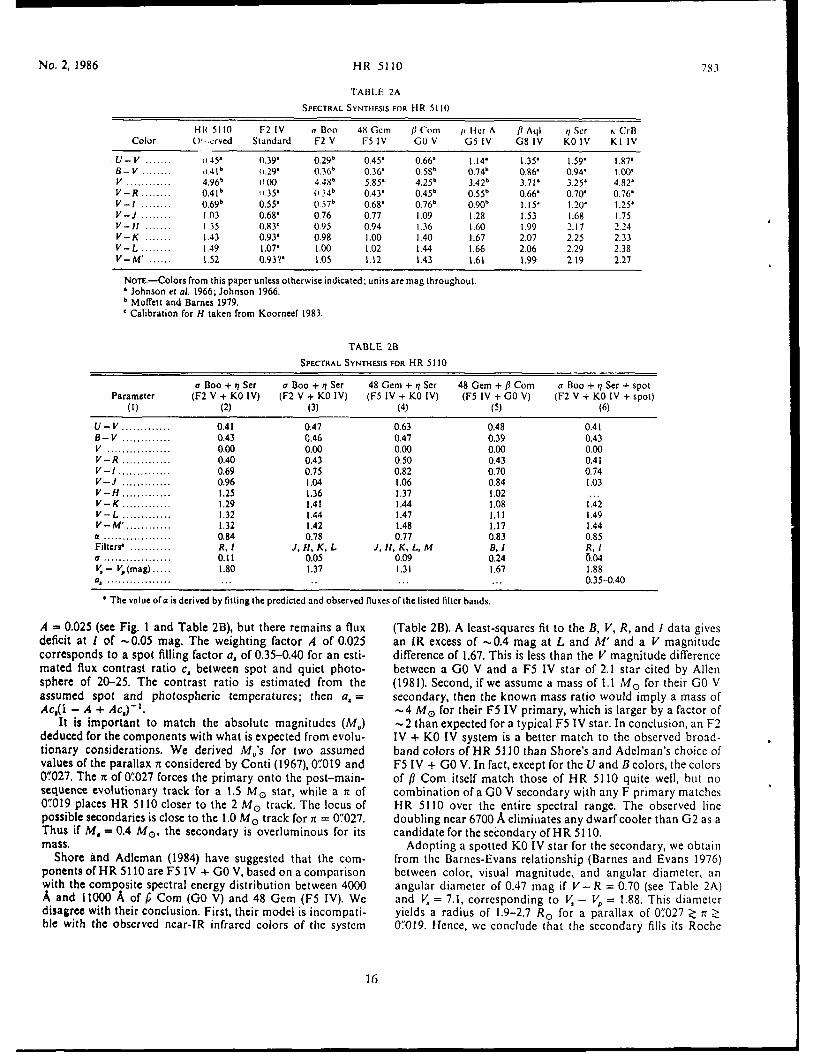
19. ABSTRACT (Continue on reverse if necessary and identify by block number)
Analysis of the IRAS low resolution spectra show that the 8-22/.Lm spectral range show a variety of emissionfeatures. T'he strongest features in spectra of M stars are the 10 and 18j.Am silicate emission features. In additiona three-component feature with peaks at 10, 11 and 13.1 tzm and a weak, broad 9-15j.4m feature is present in manyM variable stars. Most carbon stars show the 11.2 /.m SiC emission feature as well as, in some cases, an unidenti-fied 8-9 4rm emission feature. T SS and SIC star^. show a rarge of emission features "',hose peaks ran~e from10 to 11.2 jAm. The excess emission above the underlying photospheric continuum in the 8-22 Im region for SMira variables shows a sharp increase for period greater than about 370 days.
20. DISTRIBUTION /AVAILABILITY OF.-ABSTRACT 21, ABSTRACT SECURITY CLASSIFICATION
MUCLASSIFIEDILJNLIMITIEO 0 SAME AS RPT. (617 377-455 OPCfi22a. 22b -~~TELEPHONE (include Are. Code) 2c FIESMO
DD Form 1473, JUN 86 Previous editioins a.rc, obsoletec. SFCIIPITY CLASIFICATI'IJ OF THIS PACE
U'NCLASSIFIED

Acknowledgements
I would like to thank the Air Force Office of Scientific Research for providing the University ResidentResearch Program, the Air Force Geophysics Laboratory/Optical Physics Division, Celestial BackgroundsBranch for their hospitality and Wellesley College for allowing me to be re-assigned to the Air Force in orderto pursue this research opportunity. I specially would like to thank Len Marcotte for writing the 3riginalcomputer program to obtain the LRS spectra and Charles Wilton for modifying the program while working forme in the 1985 USAF-UES Summer Graduate Research Program. My special thanks are reserved for StephanPrice for making me welcome and providing support and to Paul LeVan for many interesting conversations.My collaborations with my colleagues at Wellesley College are gratefully acknowledged. Wendy Hagen Bauermade it possible to publish our technetium survey and Priscilla J. Benson introduced me to the intricacies ofradio astronomy. Most important, my collaborations with my husband Stephen J. Little over the years hasgreatly increased my understanding of the fundamental issues involved in our research projects.
~v*~TAB
A Aiii t! " e rt(;-______.

Contents
1. RESEARCH 1
1.1 M Stars 21.2 Carbon Stars 41.3 MS, S, and SC Stars 5
2. OTHER WORK 6
2.1 Other Research 62.2 Summer Students 72.3 Conferences 7
3. PUBLICATIONS 8
REFERENCES
APPENDIXES
A. ULTRAVIOLET, OPTICAL, INFRARED, AND MICROWAVE OBSERVATIONS 11OF HR 5110 (AP J COPYRIGHT)
B. CARBON STARS WITH SILICATE DUST IN THEIR CIRCUMSTELLAR 25SHELLS (AP J. COPYRIGHT NOTICE - SHE WORKED HERE ON ANAFOSR GRANT)
C. A WATER MASER ASSOCIATED WITH EU ANDROMEDAE: A CARBON 33STAR NEAR AN OXYGEN-RICH CIRCUMSTELLAR SHELL(AP J COPYRIGHT - BENSON WORKED AT WELLESLEY COLL.,WHILE LITTLE-MARENIN WORKED HERE)
D. NEW CARBON STARS IDENTIFIED FROM LOW-RESOLUTION IRAS 39SPECTRA (A.J. COPYRIGHT - MIT ITIPT F AUTHORS)
E. A SEARCH FOR TECHNETIUM (TC II) IN BARIUM STARS (A.J. 47COPYRIGHT - LITTLE WORKED AT BENTLEY)
V

F. ADDITIONAL LATE-TYPE STARS WITH TECHNETIUM (A.J. 53COPYRIGHT - ALL 3 GOT NSF OR AFGL MONEY)
G. MASERS ASSOCIATED WITH TWO CARBON STARS: V778 CYGNI 71AND EU ANDROMEDAE (ACCEPTED BY AP J FOR PUBLICATION15 JUL 88; TWO NON-GOVERNMENT AUTHORS)
H. EMISSION FEATURES IN IRAS LRS SPECTRA OF MS, S, AND SC 97STARS (SUBMITTED TO AP J; LITTLE IS AT BENTLEY COLL)
PAPERS PUBLISHED AS PART OF A CONFERENCE PROCEEDING 135(SPRINGER-VERLAG PROBABLE COPYRIGHT) CONF.TITLE: COOL STARS, STELLAR SYSTEMS, AND THE SUN
J. SUMMER SCHOOL ON INTERSTELLAR PROCESSES: ABSTRACTS 147OF CONTRIBUTED PAPERS (NASA PUB)
K. CONFERENCE DIGEST: SECOND HAYSTACK OBSERVATORY MEETING, 153PAPER ENTITLED WATER MASERS AROUND TWO SHORT PERIODMIRAS: R. CETI AND RZ SCORPII. LITTLE-MARENIN, BENSONAND DICKINSON
L. EMISSION FEATURES IN IRAS LRS SPECTRA OF MS, S. AND SC STARS, 159(PROC 5TH CAMBRIDGE WORKSHOP ON COOL STARS, STELLAR SYSTEMSAND THE SUN, SPRINGER VERLAG PROBABLE COPYRIGHT)
M. NEW LATE-TYPE STARS WITH TECHNETIUM, AND MISSING LRS 169SPECTRA OF IRAS C AND S STARS, PUB AS POSTER PAPERABSTRACTS IN BULL. AAAS.
vi

Analysis of the IRAS Low Resolution Spectra
I have analyzed the emission characteristics in the low resolution spectra of cool celestial sources. This
study concentrated on the emission characteristics of dust grain features that are produced in the circumstellar
dust shells (CDS) of stars in the late stages of their evolution and on the determination of the amount of infra-
red excess produced by the CDS. I found that the spectra show a variety of emission features, most of whichwere previously not known.
1. RESEARCH
The Infrared Astronomical Satellite, IRAS, surveyed the sky in four wavelength bands centered on 12, 25,
60 and 100 Am. Spectra of sources brighter than about 8 Jy in the 8-22 Am region were also obtained by the Low
Resolution spectrometer (LRS). Emission features from silicate dust grains at 10 and 18jim and of silicon
carbide dust grains at 11.2 1m are found in this spectral range. The LRS simultaneously scanned two overlap-
ping wave;ength ranges, one extending from 8-13.4 Am and the other from 11-22.6 Am. The resolution (A A / A)
of the spectrometer varied with wavelength from about 15 at the short wavelength end to about 60 at the long
wavelengths. The two wavelength halves in general do not agree at 12 Am unless a linear baseline is subtracted
from the usable portion of the spectrum.The IRAS science team characterized the LRS spectra according to the shape of the energy distribution and
type of emission and absorption features observed in the 8-22 Am region. 1 Typical spectra from oxygen-rich
(Received for Publication 25 March 1988)
1IRAS Science Working Group. 1986,Atlas of Low Resolution Spectra, Astr. Ap., (Suppl.), 65,607.
1
stars that have silicate dust grain emission features extending from about 8 -14 Am with a maximum around 10
Am are characterized as 2n where n= I to 9 measures the strength of the IO m emission. Many, bht not all, 2nspectra also show the broad 1 8 Am emission feature due to the bending mode of silicates. Spectra of carbon-richobjects have SIC dust grain emission features between about 10 to 14 .m with a maximum around 11.2 /um. Theyare characterized as 4n where n= 1 to 9 measures the strength of the SiC feature. No other emission featuresdue to dust grains were recognized in the LRS characterization since no others were known at that time. Spectracharacterized as In supposedly indicate a blue featureless continuum where n= I to 9 is twice the spectralindex in the 8-22Am region. Hence, stars whose spectra show only a photospheric continuum (T > 3000K) arecharacterized as 18. The Explanatory Supplement to the IRAS Catalogs and Atlases, 1984, Chapter 92 has acomplete discussion of the 10 different characterization classes.
During the late stages of stellar evolution, asymptotic giant branch (AGB) stars produce energ-, in hydro-gen and helium burning shells. Thermal instabilities that develop in these stars can dredge up material from thenuclear processed regions, changing the surface compositions of the stars. In this evolutionary phase, starsevolve along the spectral sequence from M -> MS -> S -> (SC) -> C stars as classified by the optical appear-ance of their spectra. These changes are accompanied by light variability and increased mass loss with theconsequence that the stars can develop extensive cirucumstellar dust shells. My research has focused on the typeof emission features observed in the LRS spectra of the various spectral classes observed during the AGB phaseand on the amount of infrared excess produced by the CDS. First, I will discuss the M stars and their emissionfeatures, second the C stars, and third the intermediate evolutionary stages: the MS, S and SC stars.
1.1 M Stars
Non -variable M stars have not yet reached the thermal instability phase of their evolution and, for the mostpart, their LRS spectra show only a featureless photospheric continuum indicating the absence of CDS. On theother hand, most of the variable M stars show both an infrared excess and dust grain emission features in the 8-22 Mm region.
Roughly 35 percent of the variable M stars are characterized as 2n, that is, they have LRS spectra with sili-cate emission features; about 45 percent are In with the rest having a variety of other characterizations. I willfirst discuss the 2n spectra. To study the emission features I assume that the 8-22 Am emission is produced by a)the stellar photosphere, b) a continuum emission from the dust grains and c) a strongly wavelength dependentterm due to the dust grains. Representing the first two terms with a black body energy distributions and sub-tracting it from the observed spectrum, we are left with the remaining strongly wavelength dependent emissionfeature term. The 10Am silicate emission feature among the 2n stars shows variations from star to star. Howev-er, I find that the variable stars can be divided into three groups characterized by similar spectral shapes. The 10
Mm feature of semiregular (SRa,b,c) and irregular Lb variables extends from 8.4 gm to - 14,um with a peak at10±0.05 Am. The FWHM (Full Width Half Maximum) is 2.1±0.15 Mm, but the feature is asymmetric with theratio of the width of the short wavelength (rising) branch to the long wavelength (falling) branch of 0.6:1.5 athalf intensity. The average silicate excess of Mira variables extends from 8-14 Am with a peak at 9.75 Am and aFWHM of 2.3 Mm. The feature ic also asymmetric but on the average has a less steeply rising branch than the
2Explanatory Supplement to the IRAS Catalogs and Atlases, 1984, Ed. C.A Beichman, G. Neugcbaucr, H.J.Habing, r.E. Clegg, T.J. Chester. Washington, DC: US Govt. Print. Office,
2

other long period variables (LPVs). However, the 10 Am Mira feature shows much greater variation from star tostar tin. that of the other LPVs. The shape of the Mira feature ranges from one identical to the SRs and Lbs to
a much broader one which extends from < 8Am to - 14Am with a corresponding shift in the peak emission
from 10 to 9 .6 Am and an increase in FWHM from 2.1 to 2.4 Mm. in general the greater the contrast, CT, (de-fined as the percent of emission above the underlying continuum at the wavelength of peak emission) the shorter
the beginning wavelength of the rising branch. The above results were presented at the Summer School on
Interstellar Processes held July 2-7, 1986 (Little-Marenin, Little and Price 1986).
Almost two thirds of the spectra of stars with weak emission features (those characterized as 21 and 22)
irrespective of the variability type show a new type of emission feature with 3 components and emission peaks at
10, 11 and 13 .1 Mm and extending from about 8.8 to 15 Mm. In M stars the 10 Am peak is always strongest but the
intensity of the other components varies greatly from star to star. A long wavelength feature that peaks at 19
Mm, distinctly different from the 18 MAm bending mode feature of silicates, is also present. The dust grain or sizedistribution of dust grains or other mechanism that produces this emission has not yet been identified. It is not
known how or if the feature is related to silicate dust (Little-Marenin and Price 1986). 3
We decided to investigate the variables characterized as 1.n (implying a featureless continuum) in greater
detail since almost half of the Mira variables are characterized as in. Mass loss in Mira variables is expected to
be high and hence circumstellar dustshell emission either as dust grain features or continuum dust emission
should be observable. Of the In stars only those characterized as 18 or 17, with very few exceptions, show a
featureless continuum that can be marched with temperatures hotter than about 1500 K representative of the
photospheric emission in the LRS. This unexpectedly includes about 2 percent of the Miras. Roughly half ofthe spectra that are characterized as 13, 14, 15 and 16 with S/N's larger than 10 show a relatively cool (500-800
K) featureless continuum most likely due to continuum (black body) emission from the dust grains in the CDS.
The other half of the LRS spectra show various types of weak, broad emission features. Some of these resemble
the 3-component feature discussed previously while others show a broad 9-15 Am feature with a poorly defined
peak around 11.4 m and FWHM - 4-4.5 Mm. It is too broad to be due to SiC and has the wrong wavelengthdependence to be associated with the usual silicate emission. It appears that the weak i.n and weak 2n (21, 22)
features can be described as consisting of three components with peaks at roughly 10, 11 and 1 3M.m. The contri-
bution of the three components to the observed feature of any one star varies so that we observe a continuous
range of spectral shapes from the 10Am silicate feature for which the 11 and 13 Am contribution is small, to the3-component feature with a larger contribution at 11 and 13MAm, to the 9-15 Mm feature for which the 1 0 Am
component is weaker than 11 m component. The weak 2n spectra have a larger percentage of 3-component
features than the n spectra, otherwise there does not appear to be a significant difference between stars charac-
terized as 13, 14, 15 and 16 or 21 and 22. If any, or all, of these features are produced by silicates is not yet
known. Part of the research on the l.n spectra was obtained by Todd Strohmayer while on the 1987 USAF-UES
Graduate Student Summer Support Program at AFGL.
The 8-22 Mm excess, defined as the percent of emission above an assumed photospheric continuum ofT=2500 K ranges from 0 percent to about 300 percent. How the 8 -2 2 gAm excess relates to the period of light
variability and mass loss rate for these stars is presently being investigated.
3 Little-Marenin, I.R. and Price, S.D. 1986, "The Shapes of the Circumstellar Silicate Feature," SummerSchool on Interstellar Processes, Grand Teton National Park, July 2-7, 1986, NASA Technical Memorandum88342, pp. 137-138.
3

1.2 Carbon Stars
The LRS spectra of carbon stars show a much smaller variety in the emission features than do the M stars.I have only been able to identify two, possibly three, different emission features. The SiC feature is remarkablyuniform among the C star. independent of the strength of the feature, unlike the 10im silicate feature amongthe M stars. The maximum of the feature is found at 11.15 ± 0. lm with a FWHM of 1.6 ± 0.15 Am. 4
The SiC feature is uniform enough so that it can be used as a classification criterion. We have therefore,
classified 176 stars as C stars from their LRS spectra (Little-Marenin, Ramsay, Stephenson, Little and Price
1987). 5 Many, but not all C stars with enhanced 13 C, have spectra in which the emission feature is shifted toabout 11.6 ,m. A second fairly symmetrical emission feature, unknown before the LRS spectra became avail-
able, extends from about 8-10,4m with an emission peak at 8.64m and a FWHM of about 1.3,4m. The int,nsityof the feature varies greatly from star to star, at times being more intense than the SiC feature. No obvious
correlations exists between photospheric abundances, such as the C/O, N/C or 12C/ 13C ratios determined byLambert et al (1986),6 and the strength of the 8.6gAm feature except that stars with larger CIO ratios (>1.04)appear to show the stronger 8.6gm features. The 8.6gm feature is not related to the presence of an s-processelement since both stars with large s-process enhancements and no s-process enhancements, such as Y CVn,show the feature. A few C stars appear to have additional continuum emission in the 14-22 Am region due to
amorphous carbon.
Besides emission features, the LRS spectra of C stars also show photospheric absorption due C211 2 and
HCN around 14,m. The short wavelength edge of the feature is difficult to define since it is blended with theSiC emission. The strength of the absorption shows a positive correlation with the photospheric C/O ratio.
Other absorption bands of these two molecules have been observed around 3.1 Am and 7.. m in C star spectra.The excess 8-22 Am emission in carbon stars is small, ranging from 0 percent to a maximum of about 30
percent. These values are much smaller than the ranges of 8-22 Am excesses observed in M stars. Even for Cstar Miras the typical value of the 8-22gm excess is only about 15 percent. The excess is primarily due to thedust emission from SiC. Amorphous carbon contributes only a few percent in a few stars. No C star Miras are
known which are without an infrared excess of SiC emission feature. The relationship between the 8-22Am ex-ccss, period of light variability, and mass loss rates is being currently investigated.
Most unexpected was the discovery of three C stars with strong 10 and 18gm silicate emission features intheir LRS spectra (Little-Marenin 1986).7 An additional four C stars were added to the list by Willems (1987).8
The presence of oxygen-rich material near the C stars is confirmed by the detection of the 22 GHz water maser
4 Little-Marenin, I.R., and Wilton, C., 1986, "Analysis of IRAS Low Resolution Spectra (LRS) of Carbonand M Variable Stars," Cool Stars, Stellar Systems and the Sun, Lecture Notes in Physics No. 254, eds. M.Zcilik and D.M. Gibson, (Springer-Verlag:Berlin), p. 420-422.
5 Little-Marenin, I.R., Ramsay, M.E., Stephenson, C.B., Little, S.J. and Price, S.D. 1987, "New CarbonStars Classified from IRS Low Resolution Spectra," Artron. J., 93, 663-668.
6 Lambert, D.L., Gustafsson, B., Ericksson K., and Hinkle, K.H. 1986,Astrophys. J. SuppL, 62, 373.
7 Littlc-Marenin, I.R. 9186, "Carbon Stars with Silicate Dust in Their Circumstellar Shells," Ap. J. (Let-tcrs), 307, L15-LI9.
8 Willems, F.J. 1987, (Ph.D thesis, University of Amsterdam).
4

emission line from two of the C stars, EU And 9 and V778 Cyg. )X The positinal agreement between the
water maser and the optical counterpart to V778 Cyg was recently tightened to 0.5" ty Deguchi et al (1988).12
Also, the location of the C stars in IRAS color-color plots places them among the oxygen-rich M stars with
moderately :hick circumstellar dust shells. We interpret these C stars as being part of a binary system with a C
and an M star compon 'nt. The circumstellar dust shell around the M star produces the I0 and 18 Am silicate
dust grain emission features and the water maser emission line while absorbing the visible light of the M star sothat in the visible and near infrared region only the C star comrnent is visible. We do not believe in the inter-
pretation of Wiilems (1987) that the observations can be explaitied as the transition of an M into a C star, since
the transit time of material through the CDS from which the maser and the silicate emission arises is only on the
order of 50 years and the stars were classified as C stars more than 40 years ago
1.3 NIS, S and SC Stars
Stellar evolution theory predicts, and observations confirm, that stars evolve from M->MS->S->(SC)->C
stars during the late stages of AGB evolution. Helium shell flashing occurs at this stage of stellar evolution and
the products of helium burning, primar,iy 12 C and s-process elements, aie mixed with the outer envelope during
the third dredge-up. The C:O ratio changes progressively from about 0.4 in M stars to about 1.1 in C stars and s-
process elements are enhanced from their solar value in M stars to about 100 times the solar value in C stars.
Since stars develop CDS during their AGB phase of evolution, we searched for s natures of the changing
photospheric compositioi, in the dust grain emission features observed in the LRS spectra of these evolving
stars.We found that !he typical emission feature of strong S stars (those with the greater amounts of s-process
enhancements) show dust grain emission extending from about 9 to 14Am, with a peak between 10.3-11 gm anda FWHM of 2.4 .m. This feature resembles neither the silicate, the 3-component or broad 9-15gzm feature
observed in M stars nor the SiC feature observed in C stars. The exact carrier of this feature is not yet known,
,ut we suspect that it may be due to a silicate dust grain combined with an s-process element such as Zr, Ba or
La. A second possibility is that the 10.8gum S star feature is produced by both silicate and SiC dust grains since it
is possible to mi.aic the observed emission by co-adding the silicate and SiC emission features, as suggested by
9 Bcnson, P.J. and Little-Marenin, I.R. 1987, "A Water Maser Associated with EU Andromedae. ACarbon Star Near an Oxygen-Rich Circumstcllar Shell," Ap. J. (Letterc), 316, L37-L40.
l(Little-Marenin, I.R., Benson, P.J., and Little, S.J. 1987, "Water Masers Associated with Two Carbonstars: EU Andromedae and V778 Cygni," Cool Stars, Stellar Systems and the Sun, Fifth Cambridge Workshop,1987, July 7-10, Boulder, CO, cds J.L. Linsky and R. Stencel (Heidelberg: Springer Verlag) p. 396.
11 Littlc-Marcnin, I.R., Benson, P.J., and Dickinson, D.F. 1988 "Masers Associated with Two Carbon
Stars: V778 Cygni and EU Andromedac" (in press, the Astrophysical Journal, 1988, July 15).
12 Dcguchi, S., Kawabc, R., Ukita, N., Nakada, Y., Onaka, T., zumiura, H., and Okamura, S., "PositionConfirmation of Water Maser Emission from V778 Cygni, a Carbon Star," 1988, Ap. J., 325, 795.
5

Little, Little-Marenin and Price (1987). 13 recommend that stars classified as M stars which show the 10.8gm
feature in their LRS spectra should be ie-examined to see if the 10.8g m feature can be used as a classificationcriteria for S star :n the mid-infrared.
The emission features of the S stars are in general quite weak, having an average contrast of about 27
percent. This may be the result of two effects: a) the circumstellar dust shells of these stars may have less mate-
rial in them and hence not many dust grains arc available, and/or b) since the C:O ratio in S stars is closer to
unity than in M stars, less oxygen is available to form oxygen-bearing grains such as silicates. Support for hy-
pothesis (a) is given by the fact that 8-22gAm emission excess shows a positive correlation with the mass loss rateof S ,,tars implying that less material in the CDS produces fewer dust grains. The importance of hypothesis (b)
can not be established until tile exact carrier of the 10. 8 gJm feature has been identified.MS stars are a transition phase between M and S stars and their LRS spectra show a variety of dust grain
emission features ranging from spectra with the typical 10gm silicate feature, to the 3-component feature, :o thel,,.8gm S :,tar feature. We interpret this to mcan that the changing photospheric composition in MS stars pro-
duces dif'rcnt dust grain features in the 8-22gum region depending on the exact abundances observed in the
CDS.
SC stars are the transition phase bct',een S and C stars. These stars are rare and only a few of them were
bright enough to obtain their LRS spectra. Their spectra show emission features that range from the 10.8bgm S
star feature to the 11.2 gm SiC feature, again implying that the changing photospheric composition of these
transition objects produces dust grain features representative of the changing C:O ratio.
The 8-22grm excess observed in MS, S, and SC stars correlates with their period of light variability. Specifi-
cally the excess shows a marked increase for P>370 days implying that the amount of material able to emit in the
8-22gunm region increases markedly for the long r period stars. 14
2 0'HllER WORK
2.1 Other Research
During my two years at AFGL I was able to iinish and publish a 10 year survey of technetium (Tc) in late-
tvpc stars. Technetium has no stable isotopes and theory predicts that it is produced and mixed to the surface of
stirs n their late AGB phase of evolution. Its presence allows us to delineate those stars in which helium shell
flashing has recently occurred and is still occurring. We found that only M Miras with P>300 days show Tc in
their atmosphere (Little, Little-Marenin and Bauer 1987).15 We are presently investigating if these stars have
larger mass loss rates and stronger silicate emissiom, features in thei, LRS. In a related project we were able to
13 L.ittle, S.J., Littlc-Marcnin, I.R., and Price, S.D. 1987, "Emission Features in IRAS LRS Spectra of MS,S and SC Stars," Cool Star., Stellar Systems and the Sun, Fifth Cambridge Workshop 1987. July 7-10, Boulder,CO, eds J.L. Linsky and R. Stencel (tlcidclberg:Springer Verlag) p. 377.
I 11.ittle-Marenin, I.R. and Little, S.J. 1988 "Emission Features in IRAS LRS Spectra of MS, S and SC
Stars," (,ubmitt,:d to the ikstrophysical Journal).
1 51ittl, ,.., Little-,Iarenin. I.R., and Bauer, W.H. 1987, "Additional Late Type Stars with
Technetium," Aistron. J., 94, 981-995.
6

show that ionized Tc (Tc II) is not observed in the ultraviolet spectra of barium stars obtained with the Ultravio.
let Explores Satellite (IUE). Hence barium stars are not in their AGB phase of evolution and their observed s-
process enhancements are most probably related to the binary nature of these stars (Little-Marenin and Little
1987).16
In order to understand the nature of the C stars with silicate and water maser emission features in their
spectra, wt have been monitoring the water maser emission from EU And and V778 Cyg and about 10 other
long period variable stars since March of 1987 at the 37 m Haystack Radio telescope in Westford, MA. As part
of this project we have discovered the first two short period Mira variables that are associated with water maser
emission (Little-Marenin, Benson and Dickinson 1987).17
2.2 Summer Students
During the summer of 1986 Mary Elizabeth Ramsay, a Wellesley College undergraduate, was working with
me on a Dana Foundation Fellowship from Wellesley college on the analysis of objects characterized as 4n but
not previously classified as carbon stars. We were able to classify 176 new carbon stars on the basis of their SiC
feature. Also, we have shown that approximately 80 out of 540 4n stars were incorrectly characterized as having
an SiC emission feature (Little-Marenin, Ramsay, Stephenson, Little and Price 1987). 5
During the summer of 1987 Todd Strohmayer, a graduate student at the University of Rochester, was
working with me under the USAF-UES Summer Graduate Research program. He analyzed the .n spectra and I
have summarized many of his results. He also developed programs to calculate the color correction factor forthe 12, 25 60 and 100 m IRAS bands and modified Fortran programs to calculate the combined emission from
the photoshere and their circumstellar dust shells assuming the shell is optically thin.
2.3 Conferences
During my tenure at AFGL/OPC I attended the following conferences and presented our research results:
1) The 168th meeting of the American Astronomical Society held 22-26 June 1986 in Ames, Iowa (three
papers).18, 19, 20
16 Little-Marenin, I.R. and Little, S.J. 1987, "A Search for Technetium (Tcll) in Barium Stars," Astron.J., 93, 1539-1541.
17Little-Marenin, I.R., Benson, P.J., and Dickinson, D.F. 1987, "Water Masers Around Two Short PeriodMiras: R Ceti and RZ Scorpii," Interstellar Matter, Second Haystack Observatory Conference, 1987, June 10-12(in press).
18 Little-Marenin, I.R., Stephenson, C.B., and Little, S.J. 1986, "New Carbon Stars Classifie'1 from IRASLow' Resolution Spectra," Bull. Am. Astron. Soc., 18, 669.
19 Little, S.J., Little-Marenin, I.R., Hagen, W., and Lewis, L. 1986, "New Late-Type Stars with Techneti-um," Bull. Am. Astron. Soc., 18, 669.
2 0 Culver, R.B., Little-Marenin, I.R., Little, S.J., and Craine, E.R. 1986, "Missing LRS Spectra of IRAS Cand S Stars," Bull. Am. Astron. Soc., 18, 669.
7

2) The Summer School on INTERSTELLAR PROCESSES held 3-7 July 1986 at Grand Tcton National
Park, Wyoming.3
3) The Second Haystack Obscivatorv meet:.;g on INTERSTELLAR MATTER held in Honor of Alan H.
Barrett on 10-12 June 1987 at MIT, Cambridge, MA. 17
4) The Fifth Cambridge Workshop on COOL STARS, STELLAR SYSTEMS AND THE SUN, held 7-11
July 1987 at Boulder, CO. 10 , 13
3. PUBLICATIONS
The following is a list of publications produced or published during my two years of tenure at AFGL.
PAPERS PUBLISHED, ACCEPTED OR SUBMITTED FOR PUBLICATION TO REFERREED JOURNALS
Little-Marenin, I.R., Simon, T., Ayres, T.R., Cohen, N.L., Feldman, P., Linsky, J.L., Little, S.J., and Lyons,
R. 1986, "Ultraviolet, Optical Infrared, and Microwave Observations of HR 5110," Ap. J., 303, 780-790.
Little-Marenin, I.R. 1986, "Carbon Stars with Silicate Dust in Their Circumstellar Shells," Ap. J. (Letters),
307, L15-L19.
Little-Marenin, I.R., Ramsay, M.E., Stephenson, C.B., Little, S.J. and Price, S.D. 1987, "New Carbon Stars
Classified from IRAS Low Resolution Spectra," Astron. J., 93, 663-668.
Benson, P.J. and Little-Marenin, I.R. 1987, "A Water Maser Associated with EU Andromedac: A Carbon
Star Near an Oxygen-Rich Circumstellar Shell," Ap. J. (Letters), 316, L37-L40.Little-Marenin, I.R. and Little, S.J. 1987, "A Search for Technetium (Toil) in Barium Stars," Astron. J., 93,
1539-1541.
Little, S.J., Little-Marenin, I.R., and Bauer, W.H. 1987, "Additional Late Type Stars with Technetium,"
Astron. J., 94, 981-995.
Little-Marenin, I.R., Benson, P.J., and Dickinson, D.F. 1988, "Masers Associated with two Carbon Stars:V778 Cygni and EU Andromedac," (in press the Astrophysical Journal, 1988, July 15).
Litle-Marenin, I.R. and Little, S.J. 1988, "Emission Features in IRAS LRS Spectra of MS, S and SC Stars,"(submitted to the Astrophysical Journal).
PAPERS GIVEN AT CONFERENCES AND PUBLISHED AS CONFERENCE PROCEEDINGS
Little-Marenin, I.R., and Wilton, C., 1986, "Analysis of IRAS Low Resolution Spectra (LRS) of Carbon
and M Variable Stars," Cool Stars, Stellar Systems and the Sun, Lecture Notes in Physics No. 254, eds. M. Zeilik
and D.M. Gibson, (Springer-Verlag: Berlin), p. 420-422.
Little, S.J. and Little-Marenin, I.R. 1986, "An Analysis of IRAS Low-Resolution Spectra of S Stars," CoolStars, Stellar Systems and the Sun, Lecture Notes in Physics, eds. M. Zeilik and D.M. Gibson, (Springcr-Verlag:
Berlin), p. 423-425.Little-Marenin, I.R., Linsky, J.L., and Simon, T. 1986, "HR 5110: An Algol System with RS CVn Character-
istics," Cool Stars, Stellar Systems and the Sun, Lecture Notes in Physics, No. 254, eds. M. Zeilik and D.M.
Gibson, (Springer-Verlag: Berlin), p. 247-249.
Little-Marenin, I.R. and Price, S.D. 1986, "The Shapes of the Circumstellar Silicate Feature," Summer
School on Interstellar Processes, Grand Teton National Park, July 2-7, 1986, NASA Technical Memorandum
8

88342, p. 137-138.
Little-Marenin, I.R., Benson, P.J., and Dickinson, D.F. 1987, "Water Masers Around Two Short PeriodMiras: R Ceti and RZ Scorpii," Interstellar Matter, Second Haystack Observatory Conference, 1987, June 10-12
(in press).
Little-Marenin, I.R., Benson, P.J., and Little, S.J. 1987, "Water Masers Associated with Two Carbon Stars:EU Andromedae and V778 Cygni," Cool Stars, Stellar Systems and the Sun, Fifth Cambridge Workshop, 1987,
July 7-10, Boulder, CO, eds J.L. Linsky and R. Stencel (Heidelberg: Springer Verlag) p. 396.
Little, S.J., Little-Marenin, I.R., and Price, S.D. 1987, "Emission Features in IRAS LRS Spectra of MS, Sand SC Stars," Cool Stars, Stellar Systems and the Sun, Fifth Cambridge Workshop 1987, July 7-10, Boulder, CO,
eds J.L. Linsky and R. Stencel (Heidelberg: Springer Verlag) p. 377.
PAPERS PRESENTED AT MEETINGS WITH PUBLISHED ABSTRACTS
Little-Marenin, I.R., Stephenson, C.B., and Little, S.J. 1986, "New Carbon stars Classified from IRAS LowResolution Spectra," Bull. Am. Astron. Soc., 18, 669.
Little, S.J., Little-Marenin, I.R., Hagen, W. and Lewis, L. 1986, "New Late-Type Stars with Technetium,"
Bull. Am. Astron. Soc., 18, 669.
Culver, R.B., Little-Marenin, I.R., Little, S.J., and Craine, E.R. 1986, "Missing LRS Spectra of IRAS C and
S Stars," Bull. Am. Astron. Soc., 18, 669.
9

Appendix A
Ultraviolet, Optical, Infrared, and MicrowaveObservations of HR 5110
Il

The U.S. Government Is authorized to reproCuce and sell this report.T-iit ASTRCIPH'IS/CALJOU'RNAL. 303:?80-790. 1986 April 15 PermlIslom f-- furtner reproduction by others must be obtained from
Tut' f Asre i %p-, c V,'l n c,32
. h 986 L; A the copyright owner.
ULTRAV' -)LET, OPTICAL, INFRARED, AND MICROWAVE OBSERVATIONS OF HR 5110
1. R. Lirr i)- MI Altii.NlNJoint Institute for Laboratory Astrophysics, University of Colorado and National Bureau of Standards
TitODOR E SION2 3
institute for Astronomy, Uniersity of Hawaii
T. R. AYIRES 2
Laboratory for Atmospheric and Space Physics, University of Colorado
N. L. CoHENDepartment of Earth and Planetary Sciences, MiT; Astronomy Department, Cornell University; Astronomy Department, Harvard Unisersit)
P. A FE.lMANHerzberg Institute of Astroph)sics, National Research Council of Canada
J. L. LINSKY2 .
4
Joint Institute for Laboratory Astrophysics, National Bureau of Standards and University of Colorado
S. J. LTTLr.Department of Natural Sciences, Bentley College
AND
R. LYONSDavid Dunlap Observatory, University of TorontoReceived 1985 June 10; accepted 1985 October /0
ABSTRACTHR 5110 is a close binary system (P = 2' 6) which is viewed nearly pole-on (i = 13'). A comparison of the
characteristics of Algol and RS CVn systems to those of HR 5110 shows that HR 5110 can also be consideredan Algol system. Because the primary star is relatively cool (F2 IV) and there is no apparent emission from anaccretion disk, we are able to detect in JUE spectra the emission of an active chromosphere and transitionregion of the cooler (KO IV) secondar.. HR 5110 is important because it is the only known Algol system forwhich the properties of the secondary star can be studied in detail. Velocity shifts of the ultraviolet emissionlines relative to the absorption lines formed in the F2 IV star photosphere, which are measured in a short-wavelength high-dispersion spectrum obtained near quadrature, show unambiguously that the active chromo-sphere and transition region are locatcd on the KO IV star and not the F2 IV or an accretion disk around theF2 IVstar. The surface fluxes of the UV emission lines of the K star are similar to those of active RS CVnbinaries (HR 1099, UX Ani). The line fluxes appear to vary with orbital phase and are interpreted as emissionfrom an active region on the K star moving across the line of sight. Two large radio flares were detected, butcoordinated observations of th," second flare in the UV and at the Ca it and Ha lines showed no detectableeffect of the flarc in these spectral regions 26 hr after the Ilare onset, during a time of continuing activity atradio wavelengths. VLBI observations during one of these flares indicated that half the emission came from aregion more than 4 times the binary separation. The visual and near-infrared broad-band colors of HR 5110are best matched with an F2 IV primary and a spotted KO IV secondary.Stuhject heading.s: stars: binaries ---- stars: individual - - stars: radio radiation - ultraviolet: spectra
I. INTRODUCTION the cooler component. This intense activity is also observed inThe short-period spectroscopic binary HR 5110 (HD UV spectra taken with the International Ultraviolet Explorer
118216 = BH CVn)presents a unique opportunity to study the (IUE) satellite in strong emission lines of ions from Mg Itsimilarities and differences between Algol and RS CVn variable through N v; these lines are diagnostic of chromospheric and,tatrs. RS CVn binaries arc detached systems having orbital transition region (TR) plasmas ranging in tcmpcrature fromand rotational periods generally less than 20 days and mass about 10' K to 2 x 101 K. This enhanced activity is thought tortiios close to unity (Hall 1981). They were first recognized as a be dLtC to the rapid rotation of the cooler component (Ayres(separate) class of objects distinct from Algols and other close and Linsky 1980; Dupree 1981). Evidence for dark starspotsbtttarics by Hall (1976) and are noted for unusually strong Ca i oit RS CVn stars is found in the wavelike distortion of theirH and K emission, which arises in the active chromosphere of optical light curves (Eaton and Hall 1979; Rodon6 1983). They
are also strong coronal X-ray emitters (Walter and Bowyer1981) and undergo large radio and UV flares (Feldman et al.ILL.', Research Fellow 1983- 1984. on leave from Wellestey College~ 1978).
Guest Observer, InterationalrUltraciolet Explorer. A n nd aeGuest Observer, Kitt Peak National Observatory. Algol binaries, on the other hand, are semidetachedStiltMcmnhcr. Quantum Phyic. t)iviion. National Btureauo rStlmnstards systerns whose mass ratios average about 0.2. Their more
780
13

HR 5110 781
evolved but less massive member fills its Roche lobe. The pointed out, RS CVn stars appear to evolve from ordinarygeneral properties of 101 eclipsing Algol systems are sum- nonemission close binaries that develop their characteristicsmarized by Giuricin, Mardirossian, and Mezzetti (1982). Over when the more massive star enters the Hertzsprung gap. With50% of the primary spectra are early A but do range from B time, this primary swells and may fill its Roche lobe as itthrough K. Relatively little is known about the secondaries evolves across the H-R diagram. The second major distinctionexcept that the spectral classes in over two-thirds of the between Algol and RS CVn binaries is the fact that in RS CVnsystems range from late G to early K. Spectra of the second- systems we are able to observe chromospheric and TR emis-aries can be obtained during primary eclipse but emission from sion produced by the rapidly rotating, cooler, larger corn-accretion disks or gas streams often dominates the stellar flux ponent. Spin-orbit synchronization does not allow these stars(Plavec 1983; Plavec, Weiland, and Koch 1982). These eclipse to dissipate their rotational angular momentum as they crossspectra show strong emission lines of C iv, N v, C it, Si iv-i, the Hertzsprung gap for the first time as is seen in single starsAl it-in, and Fe In and are qualitatively similar to spectra of RS (Simon 1984).CVn stars (except for the lack of He ii emission). This emission The secondaries of short-period Algol systems are also inhas been attributed to accretion disks around the hotter stars synchronous orbits and should, like RS CVn binaries, exhibitbased primarily on the decreasing strengths of the emission cnhanced chromospheric and TR emission. This emission islines as the system proceeds toward totality during primary best studied in the UV with IUE. However, in Algols, the UVeclipse (Plavec 1983; Plavec, Weiland, and Koch 1982). Plavec spectrum is usually dominated by either the hot primary, anargues that the absence of observed He n emission in Algol accretion source, or hot gas streams. Only when the primary issystems is consistent with a recombination spectrum formed at relatively cool and has a faint accretion disk, will we be able tol0' K. In the case of AW Peg, Ha emission from the cooler K study UV emission from an Algol secondary. This is the situ-component has been attributed to an extended chromosphere ation we observe for the nearby HR 5110 system but for no(Plavec and Polidan 1976). Algols are soft X-ray sources with other known bright Algol system. According to Conti's (1957)the emission appearing to come from a corona around the analysis HR 5110 consists of an F2 IV primary and an evolvedcooler component, but at flux levels 3 times lower (for a given late-type secondary in a nearly pole-on (i = 130) circular orbitrotation period) than RS CVn systems (White and Marshall (Lucy and Sweeney 1971) with a period of 2.61 days, a mean1983). Algols show sporadic radio outbursts (Hjcllming, scparation of 0.05 AU (about 10 RO), and a mass ratio of 0.28.Webster, and Balick 1972) with characteristics similar to RS If we assume a mass of 1.5 Mc for the F2 IV star, then the massCVn binaries. The radio emission is probably associated with of the secondary is 0.43 M o . Based on the separation of thethe secondary (Gibson 1980; Feldman and Kwok 1979). VLBI components and the estimated spectral and luminosity class ofobservations by Mutel et al. (1985) when HR 5110 was quite the secondary (as long as it is not a dwarf), the secondary fillsactive indicated a source with angular diameter 0"0010 its Roche lobe of 2.6 RD. Hence mass loss or transfer is the(FWHM), which is about twice the inferred angular diameter likely reason for making the current secondary the less massiveof the secondary (see below). component. From the statistics of Algol systems we find that F
The most relevant characteristics of Algols and RS CVn star primaries have early K secondaries with a mass in thesystems are summarized in Table 1. The principal distinction range 0.2-0.4 M o as is found for HR 5110, This system wasbetween the two systems appears to be that the secondaries of included by Hall (1976) in his list of RS CVn binaries based onAlgols fill their Roche lobe whereas the RS CVn secondaries the fact that strong Ca it emission is associated with the Kare detached. Many of the other differences may be outgrowths secondary (Conti 1967), but it can also be described as an Algolof this: in Algols, mass flow through the inner Lagrangian system as a comparison of the characteristics of Table 1 show.point produces the observed gas streams and accretion disks Hence HR 5110 gives us the unusual opportunity of studyingaround the primary; eventually mass transfer to the less an Algol system in a nearby pole-on configuration. (Manyevolved component makes it the more massive member of the noncclipsing Algols should exist, but they are difficult tosystem (by a factor of 5 on the average) and produces under- detect.) HR 5110 does show a slight periodic photometricmassive K subgiant secondaries. As Popper and Ulrich (1977) variation of 0.01 mag but no pronounced photometric wave
TABLE I
COMPA'ISON or RS CANIs VENATICO U BINARIES,At cnf. SYSTSISls. AND) HR 5110
Parameter RS CVn Algol HR 5110
Mass ratio (secondary/primary) ..................... ' 1.0 t 0.2 0.28Secondary fills Roche lobe ........................... No Yes YesTypical inclination ororbit (degrees) ............... . - 60 -90 13Evidence for mass streams ........................... No Yes M aybeEvidence for accretion disks ......................... No Yes NoEvidence for active regions .......................... Yes No YesPhotometric wave ................................... Yes No NoTypical spectral type ofsecondary stars ............. KO IV Early K KO IVTypical mass of secondary (MO) ................... . 1 0.2-0.4 0.42Typical spectral type of primary stars ............... G V Early A F2 IVF laring ............................................... Y es Y es Y esRadio, X-ray emission .............................. Yes Yes YesCa it H + K emission ................................ Yes No YesUV surface fluxes .................................... High High High
14

782 LITTLE-MARENIN ET AL. Vol. 303
(Hall et al. 1978). Since the decrease in magnitude coincides flux of the primary and secondary, respectively. The factor a iswith conjunction at phase 0.0 (cooler star in front), Dorren and given by a = r(r + I)- ', where r is the ratio of the brightness inGuinan (1980) interpreted the variability as a reflection effect the V band of the primary to the secondary. The value of a, orrather than rotational modulation due to dark starspots. equivalently r, is not known a priori but is calculated from
The ultraviolet spectrum (1200-2000 A) of HR 5110 spectral fitting. The value of a is obtained from a least-squaresobserved ,'ith JUE shows the strong emission lines typical of fit to the observed fluxfof HR 5110, starting from the assumedRS CVn binaries (interpreted as coming from chromospheres colors and hence normalized fluxes f, and f, at each wave-and TR around the cooler secondary) (Simon, Linsky, and length. That is, we takeSchiffer 1980a, b); but the spectrum also resembles spectraobserved during the p,-mary eclipse of Algol (W Serpentis) a '(f = f,)fl -fl)'systems (interpreted as coming from accretion disks around thehotter primary) (Plavc 1983; Plavec, Weiland, and Koch1982). Hence it is essential to pinpoint the location of the UV where the sum is carried out over filter bands other than V. Inemission of HR 5110 in order to interpret the system correctly. practice we usually summed over (1) R and I, or (2) J, H, K,HR 5110 is also a soft X-ray source with an X-ray luminosity and L in order to derive a best fit to these particular wave-of 1.3 x 10³' ergs cm- 2 s-' (Walter and Bowyer 1981), which length regions. Tables 2A and 2B summarize the derived colorsis more typical of the higher X-ray luminosity of RS CVn stars for HR 5110, for several primaries and secondaries, and for therather than Algols (White and Marshall 1983). HR 5110 has most relevant models. For each model we list the value of aalso been detected as a flaring and nonflaring radio source. A (and the filters used for its derivation), the standard deviation arecent reanalysis of the orbit (Bonsack and Simon 1983; Lyons, of the fit, and the V magnitude difference between the second-Bolton, and Fraquelli 1984) indicates a slight period change ary and primary, , - Vp.and/or a phase shift of about 0.1 phase relative to the previous Our final models were calculated with a Boo (F2 V) asanalysis of Conti (1967). We found a similar shift in analyzing primary. Its IR photometry is better established than that ofCa ni K line region from CCD spectral data kindly made avail- the standard F2 IV star of Johnson et al. (1966) and the fit toable to us by F. Walter. the IR region is most critical for determining the characteristics
of the secondary. As can be seen (Table 2A), o Boo is photo-II. iNFRARED OBSRVATION,;S metrically similar to an F2 IV star. The best fit to the photo-
An interpretation of HR 5110 depends critically on knowing metry of HR 5110 is obtained for an F2 IV (a Boo) + KO IVthe spectral type and luminosity class of the two stars in the model. Fitting the R and I colors gives an IR excess of -0.2system. Line surface fluxes (to be compared to RS CVn mag at both L and M'. On the other hand, fitting the J-Lbinaries) can be calculated if the sizes of the components (as colors produces a deficit of -0.05-0.1 mag at I, which seemsestimated from the spectral information) are known. The large considering the small statistical errors of the photometry.primary was classified as F2 IV by Slettebak (1955) and F5 III Figure 1 shows the residuals (0-C) of these models as openby Cowley (1976). From the visual colors of the system, Conti circles (to fit R and I) and as triangles (to fit J-L). The range(1967) estimated that the secondary is an evolved K star and of residuals produced by combining different secondaries (GSthat the difference in V magnitude between the components is IV, G8 IV, KI IV, as listed in Table 2B) with a Boo as primary2.5 mag. Dickens and Penny (1971) determined 0(=5040/ is indicated by the hatched areas. The J-L colors cannot beT) = 0.76 and log g = 3.8 from fitting model atmospheres to fitted with a G5 IV secondary. Using an F5 IV or F5 IIIthe continuum energy distribution of HR 5110. Their surface primary gave the same general trends except that the residualsgravity would be more in line with a luminosity classification were larger. The result of our spectral synthesis is in agree-of IV or III-IV rather than Cowley's luminosity classification. ment with the statistics found for Algol systems by Guirici-,
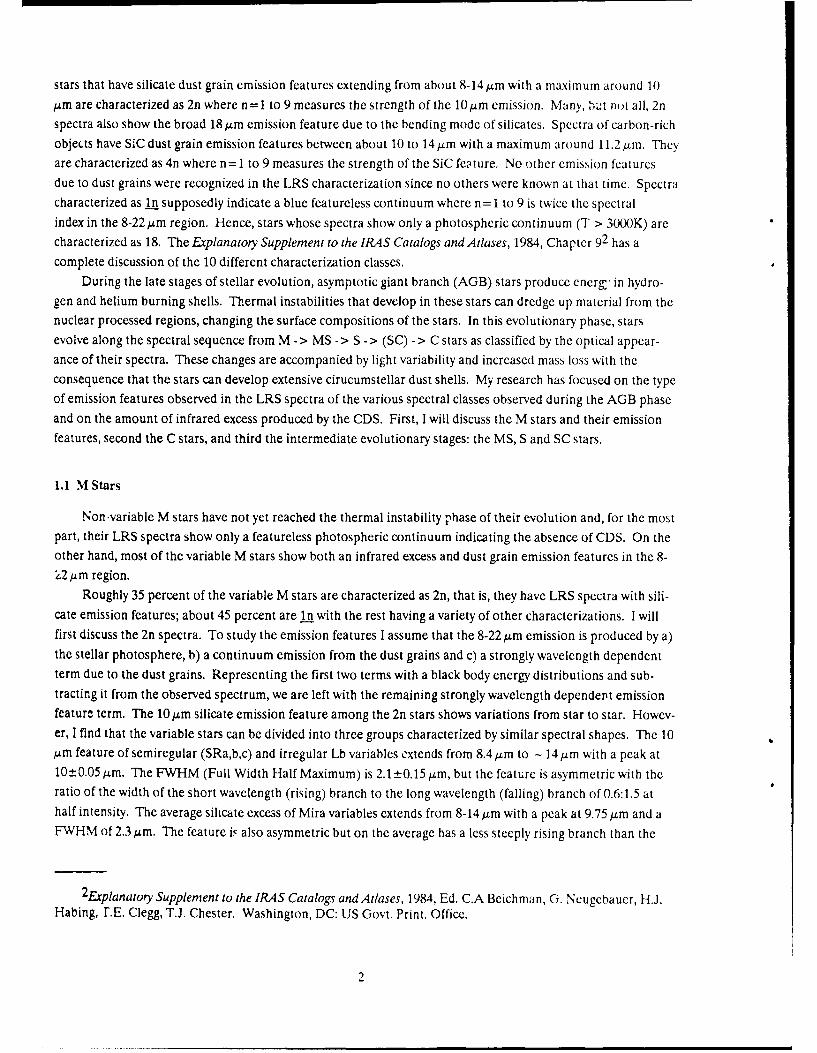
To estimate the spectral type and luminosity class of the Mardirossian, and Mezzetti (1983): every F primary has a Ksecondary we obtained near-infrared JHKLM photometry of secondary.HR 5110 on the 1.3 m telescope of the Kitt Peak National According to our first solution (col. [2] of Table 2B), HRObservatory in 1980 February and June and also 1981 May. 5110 has an IR excess which could be due to intrasystemHR 5110 was measured with respect to the standard stars used material. To interpret the IR excess, we assume an absoluteby Castor and Simon (1983), on magnitude scales whose zero flux calibration and plot this excess against ).. The excess frompoints were defined by the primary standard a Lyrae. There J to M' is fairly well matched with a blackbody curve of 3100was no clear evidence, even at the longest wavelength, for any K and therefore is too hot to be produced by dust and has thephotometric wave above observational uncertainties (e.g., wrong wavelength dependence to be produced by free-free+0.03 mag at M). An infrared photometric wave has been emission. We believe the IR excess can be explained if theobserved by M. Zeilik (private communication). We have colors of the secondary itself are composite because it is heavilyderived a best fit of the combined colors for different types of spotted. Assuming a weighting factor A for the spot coverageprimaries (F2 V, F2 IV, F5 IV, F5 111, GO V) and secondaries on the secondary, and a temperature of about 3100 K for the(G5 IV, G8 IV, KO IV, K1 IV) to the observed colors of HR spots (Vogt 1983), we recalculated the combined flux f of the5110. Our photometry is listed in Table 2A. system for an F2 IV primary and spotted KO IV secondary
Line doubling is present at Li i 6707 A (M. Tripicco and F. from f= af, + (1 - a)[(l - A)fAq + Af,], where f,,.,, is theFckcl, private -communication), so the model derived from normalized flux of the quiet photosphere and the spotted areafitting the colors should give a reasonable small V magnitude of the secondary, respectively. Forfq we used the colors corre-difference for the primary and secondary components, i.e., V, sponding to KO IV and for.,, we used the average of the colors- V, < 2.5 mag. Following Conti (1967, eq. [2]) we calculate of the M3 III and M5 V standard stars (Johnson et al. 1966).the flux f (normalized to V) o'f the system at any wavelength However, the colors of the M filter are not very reliable. Theaccording to f= af,, + (I - a)1, where f,,, is the normalized best fit to the observed flux for a = 0.85 is produced with
15
No. 2, 1986 HR 5110 783
TABLE 2A
SPECTRAL SYNTHESIS FOR HR 5110
HIR 5110 F2 IV a Boo 48 Gem it Corn it Her A fP Aqli q Ser K' CrBColor (),..rved Standard F2 V F5 IV GO V G5 IV G8 IV KO IV KI IV
U -V ....... u 45* 0.39' 0.29b 0.45' 0.66' 1.14' 1.35' 1.59' 1.87'
B- V ........ 0..40 129' 0 .36b 0.36' 0.58 0.74b 0.86' 0.94' 1.001V ............ 4.96 b o00 4.48' 5.85' 4 .2 5b 3,42 b 3.71" 3.25' 4.82'V-R ........ 0.41l
b 1051 014' 0.43' 0 .4 5 b 0 .55 b 0.66' 0.70 0.76'
V-I ........ 0.69b 0.55' 0.57 b 0.68' 0 .7 6b 0 .90 b 1.15, 1.20' 1.25'
V-j ........ 1.03 0.68' 0.76 0.77 1.09 1.28 1.53 1.68 1.75V-Il ....... 1.35 0.83' 0.95 0.94 1.36 1.60 1.99 2.17 2.24V-K ....... 1.43 0.93' 0.98 1.00 1.40 1.67 2.07 2.25 2.33V-L ........ 1.49 1.07' 1.00 1.02 1.44 1.66 2.06 2.29 2.38V- M' ...... 1.52 0.93?' 1.05 1.12 1.43 1.61 1.99 2.19 2.27
NoTE.-Colors from this paper unless otherwise indicated; units are mag throughout.' Johnson et al. 1966; Johnson 1966.b Moffett and Barnes 1979.
Calibration for H taken from Koorneef 1983.
TABLE 2BSPECTRAL SYNTHESIS FOR HR 5110
a Boo + n/Ser a Boo + n Ser 48 Gem + I Ser 48 Gem + P Com a Boo + t Ser+ spotParameter (F2 V + KO IV) (F2 V + KO IV) (F5 IV + KO IV) (F5 IV + GO V) (F2 V + KO IV + spot)
(1) (2) (3) (4) (5) (6)
U-V ............. 0.41 0.47 0.63 0.48 0.41B - V ............. 0.43 0.46 0.47 0.39 0.43V ................. 0.00 0.00 0.00 0.00 0.00V -R ............. 0.40 0.43 0.50 0.43 0.41V-I .............. 0.69 0.75 0.82 0.70 0.74V-J ............. 0.96 1.04 1.06 0.84 1.03V -H ............. 1.25 1.36 1.37 1.02V-K ............. 1.29 1.41 1.44 1.08 1.42V-L ............. 1.32 1.44 1.47 1.11 1.49V -M 1 ............ 1.32 1.42 1.48 1.17 1.44a .................. 0.84 0.78 0.77 0.83 0.85Filters ........... R,i J, H, K. L J, H, K, L, M B, I R,la0 .... 0 11 0.05 0.09 0.24 0.04V- V, (mag) ..... 1.80 1.37 1.31 1.67 1.88a .................. .. ... ... 0.35-0.40
The value of at is derived by fitting the predicted and observed fluxes of the listed filter bands.
A 0.025 (see Fig. I and Table 2B), but there remains a flux (Table 2B). A least-squares fit to the B, V, R, and I data givesdeficit at I of -0.05 mag. The weighting factor A of 0.025 an IR excess of -0.4 mag at L and M' and a V magnitudecorresponds to a spot filling factor a, of 0.35-0.40 for an esti- difference of 1.67. This is less than the V magnitude differencemated flux contrast ratio c, between spot and quiet photo- between a GO V and a F5 IV star of 2.1 star cited by Allensphere of 20-25. The contrast ratio is estimated from the (1981). Second, if we assume a mass of 1.1 M o for their GO Vassumed spot and photospheric temperatures; then a, = secondary, then the known mass ratio would imply a mass ofAc,(i - A + Ac,) - . -4 Mc, for their F5 IV primary, which is larger by a factor of
It is important to match the absolute magnitudes (M.) -2 than expected for a typical F5 IV star. In conclusion, an F2deduced for the components with what is expected from evolu- IV + KO IV system is a better match to the observed broad-tionary considerations. We derived M.'s for two assumed band colors of HR 5110 than Shore's and Adelman's choice ofvalues of the parallax n considered by Conti (1967), 0'019 and F5 IV + GO V. In fact, except for the U and B colors, the colors0',027. The t of 07027 forces the primary onto the post-main- of P Com itself match those of HR 5110 quite well, but nosequence evolutionary track for a 1.5 M o star, while a n of combination of a GO V secondary with any F primary matches0"019 places HR 5110 closer to the 2 Mc> track. The locus of HR 5110 over the entire spectral range. The observed linepossible secondaries is close to the 1.0 M o track for n = 0"027. doubling near 6700 A eliminates any dwarf cooler than G2 as aThus if M, = 0.4 M0, the secondary is overluminous for its candidate for the secondary of HR 5110.mass. Adopting a spotted KO IV star for the secondary, we obtain
Shore and Adleman (1984) have suggested that the com- from the Barnes-Evans relationship (Barnes and Evans 1976)ponents of HR 5110 are F5 IV + GO V, based on a comparison between color, visual magnitude, and angular diameter, anwith the composite spectral energy distribution between 4000 angular diameter of 0.47 mag if V- R = 0.70 (see Table 2A)A and 11000 A of f Corn (GO V) and 48 Gem (F5 IV). We and I, = 7.1, corresponding to V, - VP = 1.88. This diameterdisagree with their conclusion. First, their model is incompati- yields a radius of 1.9-2.7 Ro for a parallax of 0' 027 > t Zble with the observed near-IR infrared colors of the system 0.019. Hence, we conclude that the secondary fills its Roche
16

784 LITTLE-MARENIN ET AL. Vol. 303
0.2- aRl = 0.84
F2IV+ K0IVar Boo + 7 Ser
0.1-07 c . . ("JH KL = 0
E0 F21V+ KOIV
(SPOTTED)aRRI = 0.85
-0.1 A - 0.025
-0.2-
U 8 V R I J H K L M'
0.4 0.6 0.8 1.0 1.5 2.0 3.0 4.0 5.0
X (m)Fio. I.-The residuals (observed - computed colors) of HR 5110 as compared to an F2 IV + KO IV syicm. Open circles show the fit if the R and I colors are
matched; triangles show the fit to J, H, K. and L colors, and filled circles show the fit f.r an F2 IV + spotted KO IV secondary with a filling factor a, - 0.25. Thehatched areas indicate the range in residuals for F2 IV + (G5 IV or G8 IV ur K IV secondary).
lobe radius of 2.6 R o calculated from the mass ratio and the cm = 0.17 AU = 40 Ro for an assumed distance of 45 pc)separation of the stars, as originally suggested by Conti (1967). which was characterized by a brightness temperature T 1 > 3
x 10" K. This source region is at least 4 times the separationttn. RADIO OBSERVATIONS of the components and accordingly, at this stage in the evolu-
HR 5110 was detected during two major radio flaring tion of the flare, gyrosynchrotron emission comes from aevents, and also detected by VLBI techniques. The first major region which is not limited to the confines of either stellarflare was observed from the Algonquin Observatory (Feldman component or to the binary as a whole. During a smaller flare1979) on 1979 May 29 (8:26 UT) with a measured flux at 10.46 (1982 December 19) Lestrade et al. (1984) detected a source ofGHz of 425 mJy. Flaring continued over the next 2 days at the maximum size 1.4 mas using a four-element Mark III VLBI200-350 mJy level. The second flare (Feldman 1981) was network at 8.4 GHz, and during another smaller flare (1983similar to the first. On 1981 April 4 the system was observed at July 26/27) Mutel et al. (1985) detected a source of size 1.0 masa flux level of 240 mJy. A larger outburst at the 350-410 mJy using a six-element Mark I11 VLBI network at 5.0 GHz. Inlevel occurred on 1981 April 5 starting at 6:30 UT and lasted these cases the flare region was comparable to or smaller thanfor about 4 hr. Flaring continued at the 150-200 mJy level for the size of the binary system and T9 z 2 x 10¹⁰ K. Thesethe next several days (Feldman 1983). These radio outbursts VLBI observations of three flares on HR 5110 are consistentare probably due to gyrosynchrotron emission from mildly with the hypothesis that the flux tubes responsible for the flarerelativistic electrons (Owen, Jones, and Gibson 1976; Lestrade emission expand and the electrons lose energy with time.et al. 1984). Figure 2 shows the radio light curve for the secondflare together with the times of coordinated VLBI, JUE, Ca Ia,and Hof observations. While these other observations were After being notified by P. Feldman of the occurrence of themade 1-2 days after the major outburst, radio activity contin- 1981 April flare, we obtained 6.5 A mm - I (taken at DAO) andued at the time of these observations. 8 A mm -I (taken at DDO) spectra of the Ca ir region starting
On 1981 April 6 we observed HR 5110 at 5.0 GHz (6 cm) in about 21 hr and 47 hr, respectively, after the onset of the majorleft-hand circular polarization using the Mark III VLBI radio burst and continuing for the next two weeks at DDO.System with 56 MHz bandwidth. The stations used were the The Ca It emission at this later (plateau) stage of the flare doesOVRO 130 foot (40 m) and the NRAO 140 foot (43 m) tele- not show any evidence of flare induced activity. The intensityscopes. At 03:50 UT we obtained a 10 minute correlated scan of the Ca it emission at other times is known to vary by a factorfor HR 5110, followed by a 3 minute scan on the unresolved of 3-4 (Conti 1967) and was confirmed by visual inspection of(D. Shaffer, private communication) VLBI calibration source other spectra kindly loaned to us by P. Conti. Whether or not0552 + 398. Reductions of this one-baseline VLBI "snapshot" these variations are accompanied by other (unobserved) radioindicate that the fringe-visibility amplitude was 0.53 + 0.05 at flares is unknown. Ha spectra obtained at DDO at 16 Afringe spacing of 3.7 mas. This implies that during the later mm -1 starting at about 5 UT on April 7 and continuing for(plateau) phase of the outburst about half of the radio emission the next two weeks, also showed normal, variable, weak emis-arose from a region greater than 3.7 mas in size (= 2.7 x 10¹² sion in the Ha profile. The Ha emission is variable in both
17

No. 2, 1986 HR 5110 785
400- H R5110" 350 10460 M z Coil(DAD) Coil (000)
E LILWR H
300 VB (IUEI-250- S---S PHwP"--
Z 200-W I'-- RADIO FLUX
150-X
D 100-_JLL. 50
0 ,ii 1( 1l I ii ii ii iii 1111~ IiI llitI
06 12 18 0 06 12 18 0 06 12 18 0 06 121981 APRIL 4 APRIL 5 APRIL 6 APRIL 7
TIME (UT)FIo, 2.-The radio light curve of HR 5110 during and immediately following the 1981 April 5 flare (Feldman 1983). The time line of spectroscopy of the Ca t
region at DAO and DDO. of the Ha region at DDO, of the UV region with UE. and the time of the VLBI observation are indicated during the later " plateauphase of the flare.
mean wavelength and intensity but does not appear to be well associated with the first flare was reported by Simon, Linsky,correlated in velocity with either binary component or to show and Schiffer (1980b). A search through the UE archivesany effect from flaring. The emission may be due to permanent yielded two additional spectra presumably taken when theintrasystem material (Fraquelli 1981; Bopp 1983), but the large system was quiescent. The observational data for the four SWPmass motions deduced from Ha observations in Algol-type low-dispersion spectrum (1200-2000 A at -6 A resolution,systems are not evident in HR 5110. the five LWR high-dispersion spectra (2000-3200 A at - 0.2 A
In conclusion, we find no increase in emission in Ha, Ca n H resolution) and one SWP high-dispersion spectrum (1200-2000and K, and the UV (see § V) from enhanced chromospheric A at -,0.2 A resolution) are summarized in Table 3. The phasesand TR activity about 20 hr after the onset of a major radio were calculated from an ephemeris having an epoch of JDoutburst, although the radio emission was still greatly 2,445,079.478 and period of 2.61328 days, obtained from theenhanced. reanalysis of the orbit by Lyons, Bolton and Fraquelli (1984);
we have adjusted the epoch so that an orbital phase of 0.0v. IUE OBISERVATtONS corresponds to conjunction (KO star in front) rather than to
We obtained UE spectra during the latter (plateau) phases quadraturc (with the secondary at maximum velocity ofof both radio outbursts, roughly 56 hr after the first major approach) as in their analysis.event and 26 hr after the second. We also observed HR 5110 in The spectra were calibrated in absolute flux units at Earth1980 February and in 1983 August. An analysis of the data using standard 1UE calibration factors. The latest Intensity
TABLE 31UE OnsEt.VATIONAL DATA , oK HR 5110
Orbital ExposureTime (UT) Phase' Time
Image Number Dispersion Date (hr/minutes/s) 0 (minutes) Commentb
SWP 5415 ..... Low 1979 May 31 15:56:21 0.56 30 ILWR 4652 ..... High 1979 May 31 17:47:25 0.58 10 1LWR 6333 ..... High 1979 Dec 7 17:17:32 0.67 15SWP 7344 ..... Low 1979 Dec 7 17:49:40 0.68 35LWR 6838 ..... High 1980 Feb I 5:31:01 0.52 10SWP7834 ..... Low 1980 Feb 1 5:53:48 0.53 25LWR 10297 .... High 1981 Apr 6 11:40:31 0.17 10 2SWP.3668 .... Low 1981 Apr 6 11:06:07 0.16 25 2SWP 13669 .... High 1981 Apr 6 17:53:33 0.27 378 2LWP 16548 .... High 1983 Aug 8 8:36:00 0.91 10
Based on ephemeris JD - 2,445,079.478 + 2.61328 4, where 4 - 0.0 corresponds to conjunction with the KOIV star in front.
, COMMENTS.-.(I) Flare: 1979 May 29, 8:26 UT. (2) Flare: 1981 Apr 5, 6:30 UT.
18

786 LITTLE-MARENIN ET AL. Vol. 303
TABLE 4
INTEGRATED EMissioN-LiNE FLUX FOR HR 5110 AT EARTI (X 10-i ergs CM- 2 s-')
N v 0i C i Si Iv C Iv Heit Continuum' Mgit kImage Number Phase .1240 )1305 ).1335 A1400 A1549 )1640 1560-1630 A A2796 Comments
SW P 13668 ......... 0.16 0.32 0.69 0.87 0.79 1.87 0.57 0.19 ... FlareLW R 10297 ...... ... 0.17 ... ... ... ... ... ... ... 13.0 Flare
LW R 6838 .......... 0.52 ... ... ... ... ... ... .. 17.1SWP 7834 .......... 0.53 0.75 1.75 1.67 1.23 2.63 .30 0.20 ...SW P 5415 .......... 0.56 0.35 1.61 1.53 1.15 2.56 1.17 0.25 ... FlareLW R 4652 .......... 0.58 ... ... ... 15.3 FlareLW R 6333 ..... 1.. 0,67 .. ... ... ... ... ... ... 13.7
SWP 7344 .......... 0.68 0.30 0.81 0.83 0.61 1.23 0.66 0.19 ..LW R 16548 ......... 0.91 ... ... ... ... ... 12.4
SWP 7834 0.53 2.3 2.5 1.9 1.6 1.4 2.3 1.09 To show fluxSWP 13668 0.16 2. variation atLWR 6838 ... C.52 differentLWR 10297 0.17 phases
I Average continuum flux level in units of 10 - ergs cm- 2 s -.
Transfer Function was applied to SWP 5415 with computerprograms at the IUE Regional Data Analysis Facility at the FLARE FLAREUniversity of Colorado. The SWP spectra are saturated long-ward of 1700 A due to the rapidly rising photospheric contin-uum of the F2 IV primary. We measured the integrated flux atEarth ofthe emission lines ofN v, C iv, Si 1v, He it, C i1, and 0 1 M0 Itin the low-dispersion spectra. The integrated flux of the Mg iMlines was also measured in the LWR high-dispersion spectra.No other emission lines could be identified in the LWR 6- "spectra. The Fe it (multiplet UVI) lines near 2600 A as well as
Si i (1804 A), Si 1 (1903 A), and C 111 (1909 A) appear inabsorption, indicating that the F primary dominates the spec-trum in these regions. We also measured the mean continuum .nZlevel of the primary between 1560 A and 1620 A. These fluxes '.
are summarized in Table 4 and are plotted as a function of timein Figure 3. E
The fluxes vary by about a factor of 2 in unison during this ,time interval, but maximum flux in the lines does not uniquely ,correspond to the times of flares unless an unobserved flare Z i12
also occurred on 1980 February 1. Although the continuum -0
was brighter after the first flare than at other times, the contin- i- situuum was not enhanced after the second flare, when the IUE 01observations were made a day closer to the peak of the radio Woutburst. t Henl
Figure 4 compares the two SWP spectra taken after thesetwo flares. The increase in brightness of the continuum in SWP5415 is clearly evident. Since the continuum arises from the Fstar, it is likely that this new emission also arises from the Dprimary. It is unclear why excess emission is visible after the -Jfirst flare but not after the second. Since the two spectra were U_,
taken at different phases, the excess may be unrelated to the Wflare mechanism. We conclude that the radio flares producedno discernible effect on the intensity of the lines and that thechanges we observe are normal variations in the activity of the W CONTINUUMi-
system. A similar conclusion was reached by Simon, Linsky, zand Schiffer (1980b) from their earlier analysis of the dataassociated with the first flare.
By contrast, IUE spectra of a flare on UX Ari also taken 26hr after the initial detection of radio flaring showed a factor of -13 I I5.5 enhancement of the UV line strengths (Simon, Linsky, and 10 1979 1980 1981 1982 1983Schiffer 1980a). Simon, Linsky, and Schiffer suggested that themechanism for producing flares in these two systems might be TIME (YEARS)
ueite dfr Maoducignet field nnhiltion ofyte rig b FIG. 3-The integrated UV emission line flux received at Earth from HRquite different. Magnetic field annihilation of interacting 510 as a function oftime. The occurrences ofthe two radio flares are indicatedcoronal loops may be the energy source for the UX Ari flare, with arrows. The continuum flux is the average flux measured in the regionwhereas the flare on HR 5110 may be produced by mass trans- 1560-1620 A.
19

o. 2, 1986 HR 5110 787
CIV
<4.0 HR S1 10 i
U3.0
L SWPS4IS
C1T S6 HRS
X SW.P13668D 1.0 NV26 HRS
__ P O ST-FLARE
0.0 - - - -L AI
1200 1300 1400 IS00 1600 1700
Wave Iength (A)
FIG. 4.-A comparison of short-wavelength, low-dispersion spectra of HR 5110 taken within 56 hr after the 1979 flare (SWP 5415 plotted as a histogram) ondvithin 26 hr after the 1981 flare (SWP 13668). The much higher level ofthe continuum after the 1979 flare is clearly visible.
er from the secondary to the primary star through the inner no platinum lamp spectrum was taken for wavelength cali-Lagrangian point. The expected asymmetry of the ultraviolet bration at the time, we determined the shift in wavelength ofines due to mass motions was not observed in HR 5110 during the emission lines relative to the photospheric absorption lines:he second flare, but this flare occurred near quadrature when of the F star by aligning the absorption lines of HR 5110 withnass flow through the inner Lagrangian point would be pri- those of Procyon (F5 IV-V). The two photospheric spectranarily across our line of sight. match very well. Measuring next the wavelengths of the emis-
sion lines of HR 5110 relative to those of Procyon as a tcm-VI. DISCUSSION plate, we determined an average velocity difference of
u) Modulation of the U V Emission + 40 + 10 km s '. At phase 0.27 the difference in radial veloc-ity between the secondary and primary in HR 5110 is about
Unless an unobserved flare occurred in 1981 February, our +45 km s-', in agreement with the velocity of the emissionUE data do appear to show correlations with phase (Fig. 5) lines. We therefore conclude that the TR and chromosphericAith maximum flux occurring near phase of 0.5, i.e., when we plasmas observed in the UV are located on the secondary star.)bserved the side of the secondary star that faces the F star in The measured absolute velocity shifts of the emission lines,his nearly pole-on system. This result is very tentative as it is corrected for orbital motion of Earth and the spacecraft gave)ased on four sets of spectra taken over a time period of 4 yr. similar results. Hence this analysis shows unambiguously thatrhe fluxes in all the lines vary in unison by roughly a factor of the active chromosphere and TR phenomena in HR 5110 are! except for the Mg i1 k lines which varies by a factor of located on the cooler KO IV star and are not associated withibout 1.3. the F star or with an accretion disk around the F star as in
To understand and model the variations in the emission Algol systems. No emission lines are at the velocity of the F:orrectly we must determine which star has the activity associ- star.tted with it. Conti (1967) showed that the radial velocity varia- Ayres, Marstad, and Linsky (1981) estimated the differenceions of the Ca i emission are out of phase with those of the F in the flux in the UV emission lines between a "moderatelytar. This emission therefore defines the orbit of the secondary active" Sun and a quiet Sun to be about a factor of 2. We;tar. To establish from which star the upper chromospheric and interpret the variation in intensity of the lines of HR 5110 asiR emission originate, we analyzed a high-dispersion short- being due to the rotation of a near equatorial (< + 13') mag-Navelength spectrum SWP 13669 taken near quadrature cen- netic active region (plage) into and out of our line of sight. Theered on phase 0.27. Although this spectrum is underexposed latest Mg it spectrum (LWP 16548 obtained at phase 0.91);hortward of 1600 A, it does show the He it, C iv, C it lines and, gives a flux slightly lower than that observed three years earliermery weakly, the 0 t and Si tv lines in emission. Since the at phase 0.67. This point would not add significantly to Figureibsolute wavelength calibration of the spectrum is uncertain S and has not been included. Complete phase coverage during)wing to possible thermal flexing of the spectrograph one or more cycles would be needed to develop a definitiveLeckrone 1980; Turnrose, Thompson and Bohlin 1982) and model of the active longitude and latitude. The reflection effect
20

7S8 LITTLE-MARENIN ET AL. Vol. 303
I l (lall et a/. 1978)/increases the photospheric temperaturc on theFLARE FLARE side of tl.e K star that is facing the F star but sFould not
increase the amount of flux emitted by the chromospheric andTR lines.
" "'[he variation of the UV continuum presents an enigma. Itshows a 40% increase at phase 0.56 after the first flare relativeto phase 0.17 or 0.67, but no increase after the second flare.
0 C10 Only a moderate increase of about 15% was observed at phase0.52 when the emission lines reached peak brightness. Thusmore data are needed in order to disentangle possible phase-
c U7 from flare-related variations of the continuum.The behavior of the Mg it h and k emission lines is more
difficult to interpret. Figure 6 shows the Mg u t and k emission"A line profiles arranged in order of increasing phase. The shape of
,,, both Mg n lines changes dramatically with phase from emis-
-12 , sion primarily on the red side (red asymmetry) at phase 0.17 too0 emission primarily on the blue side (blue asymmetry) at phases
n cue 0.66 and 0.67. We interpret this as the effect of the relative
×/ motion of the stellar Mg it emission line across a stationary01 interstellar absorption line. Similar changes have been seen in
s / the Mig it profiles of Capella (Ayres, Schiffer, and Linsky 1983).0 He afUJ The velocities of the HR 5110 emission peaks relative to the<interstellar feature are roughly in agreement with an orbital
velocity variation of 50 km s-' expected for the secondarybctecn phase 0.17 and 0.67 (the velocity variation predicted
| N7 from Conti's orbit is about 70 km s- ). Therefore, like the Ca tlines, the Mg it emission appears to be formed on the second-ary star. The Mg it flux varies by a factor of 1.3 between phasesclose to quadratu-e and conjunction. On the other hand, thevelocity variation of the center of emission (the midpoint at
CONTINUUM (I1560-1620) FWHM) relative to the interstellar line is only about 15 + 10
I I I I I I km s-', i.e., about one-third of the variation of the emission0 1 0 2 0.5 o4 05 0.6 0 7 peak, but in the same sense as the peak variations. We interpret
PHASE this as an interaction of three phenomena: (a) the orbital varia-Fv; 5 -The integrated emission-line fluxes of various lines received at tion of about 70 km s-' of a relatively narrow Mg iI emission
I-d.th from HR 5110 as a function of phase. All lines (except Mg ii) vary in peak arising from the secondary star, (b) the orbital variation.aison b, roughly the same factor Aith maximum emission occurring at phase of about 18 km s' of a broader Mg iI emission peak arising
HR 51 103.20-7
TY) PHASE=0.67
U
0 [PHASE=O .S8
0
LL
-400 -200 0 200 400 600 800 1000
Veloc i ty (krn/sec)I if, 6 lhc Mg ii h and k profiles at difTereni phases, The profiles iavc been aligned on lie interstellar absorption feature of Mg ii k. Each proile except for
0,.tc 1I 17 has becn shifted vertically by 6 x 10- 2 flux unhw
21

. 2, 1986 HR 5110 789
)m the primary, and (c) the interstellar absorption feature Our observations of HR 5110 has given us the uniqueth which these two emission peaks are blended. The width of opportunity of studying the chromosphere and TP of the see-
Mg it emi-ion from the primary star must be roughly 3 ondary of an Algol system. We have shown that the behavioraes the width the secondary's line in order not to produce we observe is similar to that of rapidly rotating spotted RSasymmetry .., the base of the blended line protile near quad- CVn systems and hence must be determined primarily by the
ture. The analysis of the Mg :a lines is further complicated by large rotational velocity of the KO star and dynamo actionc fact that the widths of the lines (defined as the full width at rather than being related to an accretion disk. Whether otherree-fourths maximum flux) \ary from 1.4 A at quadrature to secondaries of Algol systems have magnetic active regions is
A near conjunctic This cannot be due to the orbital veloc- not yet known, since the UV spectra of the few systems thatvariation, since that would produce the greatest width at have been observed during primary eclipsL; (cooler star in front)
iadraturc. A possible interpretation is that this larger width is appear to be dominated by an accretion disk around theused by streaming of material from the secondary to the primary.imrary star through the inner Lagrangian point. At quadra- We have analyzed the SWP 17707 spectrum of one otherre this flow would be primarily across our line of sight and Algol system, AS Eri, which has a period (2.67 days), secondarynce would produce no additional broadening, whereas near (KG), and mass ratio (0.11) similar to those of HR 5110. Thenjunction the motion is partly along the line of sight. The radiation of the hot A3 primary dominates the 1200-2000 Ainimum velocity along the line of sight inferred from the region, making the detection of any chromospheric emissioncic !,c in width is about 05 kml s I, which corresponds to a from the secondary of AS Eri impossible. The absence of aream velocity of 300 km s - (assuming i = 13'). The lines strong C iv absorption line in this spectrum may indicate thaten near conjunction are fairly symnetric implying that the AS Eri lacks a high temperature accretion region (Peters andream has a relatively large angular size. Polidan 1984). Unfortunately, this system undergoes only a
partial eclipse, and it would be difficult to distinguish theb) Activity Levels effects of an active chromosphere from mass transfer processes.
Table 5 lists the average surface line fluxes for the quiet Sun, A search through the Giuricin, Mardirossian, and MezzettiR 5110, UX Ani, and HR 1099 on the assumption that all the (1983) list of Algol systems revealed only three additionalix in the binaries originates on their cooler components. UX short-period Algol systems composed of an F primary and Kri (P = 6d4; KC IV + G5 \v) and HR 1099 (P = 2 .8 ; KG secondary, QY Aql, AL Gem, and RT UMi. All three are tooI + G5 IV) are both known as very active RS CVn binaries faint to be studied with JUE. Until more bright Algol systemsr which several major radio and UV flares have been like HR 5110 are discovered, it appears to be "is only one to)served. The surface fluxes for HlR 5i 10 and the two R3 CVn which this type of analysis can be applied and for which we arears are comparable and are about 100 times larger than the able to establish the probable presence of active regions and)rresponding fluxes for the quiet Sun, except chromospheric active chromospheres and TRs on the secondary.Ig it which is enhanced by only a factor of - 10. It seemslausible to attribute the large surface fluxes for the secondary V11. SUMMARY
ar in the HR 5110 system, like those for UX Ar and HR The broad-bandcolorsofHR 5110arebest matched with an)99, to rapid rotation. From the data presented by Vilhu and F2 IV primary and a spotted KO IV secondary. This system isucinski (1983, their Table 3), we estimate that for stars with important because it is a nearly pole-on close binary in which)tation periods of -3 days the difference in UV line flux the less massive but more evolved K secondary fills its Roche:twcen an F8 star (0 Dra) and a K star (HR 1099) is about a lobe, and the system can be observed in the ultraviolet. HRctor of 10. This difference at a given rotational velocity in the 5110 can be classified as an Algol system since it shows manyrength ofchromospheric and TR emission must be related to of the common characteristics with Algols as Table I illus-iother parameter, e.g., the shallower depth of the convection trates. Many systems like this should exist, but they are easilync in the F stars, and hence it is not surprising that in HR detected only when i 90' through eclipse observations.
[ 10 we find no evidence of emission from an active TR associ- Through precisely measured wavelength shifts of the UV emis-:ed with the F2 TV primary (at the 10%-20% level). This is sion lines of HR 5110 relative to the photospheric absorption-spite the fact that the radii of both components are nearly lines on a high-dispersion short-wavelength JUE spectrum, weie same so that their --ttational velocities are nearly identical can uniquely assign the ' tive chromosphere and TR to theyen synchronous rotation. cooler component. This emission is most likely associated with
TABLE 5
INTEGRATED LINE SURFACE FLUXES OF TIlE SECONDARY COMPONENTS OF HR 5110 AND
Two RS CANIS VENATICORUM STARS ( x 105 ergs cm- 2
s- )
['(A;, I,
f(A.) N v O1 C it Si Iv C IV Hell Mg lI kStar, State Phase x 10 ) 1240 ;1305 133 5 .1400 1549 ,. 1640 A2796
HR 5110,. .............. 0 68-0.52 7.85 1.2-3.1 3.4-7.3 3.5-6.9 2.5-5.1 5.1-10.9 2.7-5.4 52-71H$ 1099' quicsccnti ..... 073 32 21 6.1 3.0 9.7... 110UX Ari ,quiescent ..... 0.61 4 6 [9 4 4' 44 2.5 6.5 3.5 68'Sun"quile ........ .... 00086 004 0.046 0.025 0.058 0.031 6.8
- I-A;) (4 125 10")',J]i (A;). where f/, is Ihe ,,Iclliar ngul.ir dlia icter ill tis
b Simon and Lmnsky I980.
Sireon, J.inLky. and Schirter 1980h.Q U Id SLJ:1 u rfta c fn iixc (ro A ) rc , und 1.11- 1-y 1'm )
22

790 LITTLE-MARENIN ET AL.
a plage facing the primary star. T]t is system also flares at radio while at DAO. We wish to thank lli staff of thle UE 1 Oh.scrta-wavelengths, but any effets produced in othcr parts of the torY for their help in acquiring the stellar spectra and the stafl'spectrum are short-lived, since within 21 hr after a flare no kespecially T. Armitage) of the JUE Regional Data Analysiseffects were detected either in the UV or optical region. As in Facility at the University of Colorado, operatcd under grantother Algol systems, mass transfer from the primary to the NAG5-26409, for their help with the data reductions, Thissecondary through the inner Lagrangian point may be work is supported in part through grants NAG5-82 to thcoccurring as indicated hy the incrcai~ed width of the Mg it lines I Iniersity of Coloiado and grant NAG5- 146 to the Ui'ci sitnear phase 0.5. Large amounts of iiiirasystem material do not of Hawaii. 1. L.-M. wishes to thank JILA for t' generousappear to be present, however, as only Very wecak H.' emission support, helpful discussions and good fellowship given to heris observed and the infrared excess is too hot to be dust, during her year as a Visiting Fellow. N. L. C. acknowledges thle
support of a Visiting Scholarship at MIT. Mark III analysis ofWe wish to acknowledge many fruitful discussions wvith F. the Haystack Observatory and VLBI observing at OVRO and
Walter as well as the use of his Ca it data to check the ephemn- NRAO were supported by the National Science Foundation.eris of this system and the help of C. Aikman and P. M assey
REFERENCESAllen. C. W, 198l1, Astrophyvsical Quantitiies (3d ed.; Loiidon: Athlone). Johnson, H. L. 1966, Ann. Rev. Asir. Ap., 4, 193.A '%res. T. R., and Linsky. J. L. 1980, Ap. J., 235, 76. Johnson, H. L., M~itchell, R. I., Iriate, B., and \Vi~iewski, W. Z. 1966, Conim.A) res, T. R., Marstad, N. C., and Linsky, J1. L. 198 1, Ap. J.. 247, 545. Lsitar Planei. Lab., 4.,99.Ayres, T. R., Sctiiffer, F. H., lt, and Linsky, 3. L. 1983, Ap. J., 272.,223. Koornecl. J. 1983, AIsir. Ap., 128, 84.Barnes. T. G., and Evans, D. S. 1976_%1I.NR.A.S., 174.489. Lcckrone, D. S. 1980, NAISA IVE Newsleiier, No. to, p. 25.Bonsack, W. K., and Simon, T. 1983, in IAU Symposium 102, Solar and Stellar Lesirade, J1., Muaid, R. L., Presion, R. A., Scheid, J. A., and Phillips, R. B 1984,
Magnetic Fields, ed. J. 0. Sienflo (Dordrechti: Reidel). p. 35. Aj'. J., 279, 184.Bopp, B. WV. 1983, in IAU Colloquiumi 71, Activity in Red Dwarf Stars, ed P. B. Lucy, L. B., and Sweeney, M. A. 1971, A.J., 76.,544.
Byrne and M. Rodon6 (Dordrecht: Reidel), p. 363. Lyons, R. W., Bolton, C. T., and Fraquetli, D. A. 1984, preprint.Casior, J., and Simon, T. 1983, Ap. J., 265, 84. Mofftti, T. J., and Barnes, T. G., Ill. 1979, Pub. A.S.P., 91, 180.Conii, P. S. 1967. Ap. J., 149, 629. Muit, R. L., Lastradle, J. F., Preston, R. A., and Phillips, R. B. 1985, Ap. J., 289,Cc wley, A. P. 1976. Pub. A.SP., 88, 95. 262.Dickens, R. J., and Penny, A. J. 197 1, AIN .R.A .5., 153, 287. Owen, F. N.. Jones, T. W., and Gibson, D. MI. 1976, Ap. J., 210, L27.Dorren, ji. D., and Guinan, E. F. 1980, A.J., 85, 1082. Peters, G.. and Polidan, R. S. 1984, Ap. J., 283, 745.Dupree, A. K. 1981. in Solar Phenomena in Stars and Stellar Systems, ed. R. Plavec, NI. . 1983. Ap. J.. 275, 251.
Bonneii and A. K. Dupree (Dordrecht: Reidel), p. 407. Plavec, M. J., and Polidan, R. S. 1976, in lAU Symposium 73, Structure andEaton, J. A., and Hall, D. S. 1979, Ap. J., 227,907. Evolution of Close Binary Systems, ed. P. Eggleton, S. Milton, and J. WhelsnFeldman, P. A. 1979,/IAU Circular, 3366. (Dordrecht: Reidet), p. 298.- 198 1,/A U Circular, 359 1. Plavec, MI. J., Weiland, J. L., and Koch, R. H. 1982, Ap. J., 256, 206.- 1983. in lAUd Colloquium 71, Activity in Red-Dwarf Stars, ed. P. B. Popper, D. M., and Ulrich, R. K. 1977, Ap. J., 212, LI 31.
Byrne and M. Rodon6 (Dordrecht: keidel), p. 429. Rodon6, M. 1983, Adv. Space Res., 2,225.Feldman, P. A.. and Kwok, S 1979, Workshop on Radio Stars lOtiawa: Shore. S. N., and Adlcman, S.3J. 1984, ,4p. J. Suppl., 54, 15 1.
National Research Council ofCanada). p. 4 1. Simon, T. 1984, Ap. J., 279, 738.Feldman. P. A., Taylor, A. R., Gregory. P. C., Seaquisi. E. R.. Balonek. T. J,. Simon, T., and Linsky, J. L. 1980, Ap. J., 241, 759.
and Cohen, N. L. 1978, A.J.. 83.,147 1. SimonT., Linsky, J. L..and Schiffer, F. H1.. 1l1. 1980a, Ap. J., 239.911.Fraquelli. D. A. 198], Ph.D. Ihesis, University of Toronto. -- -. 1980b, in The Uniterse at Ultraviolet W'avelengths. ed. R. D. ChapmanGibson, D, M. 1980, in lA U Symposium 88, Close Binary Stars: Ohseri ations (NASA CP-2171), p. 435.and Interpretation, ed. M. J. Plavec, D. MI. Popper, and R. K Ulrich Sleiiehak, A. 1955, Ap. J., 121, 653.(Dordrecht: Reidel), p. 31. Turnrose. B. E., Thompson, R., and Bohlin, R. 1982, NASA IUE ,Veitslerter,
Giuricin. G., Mardirossian, F., and Mezzenti, NI. 1983, Ap. J. Suppl., 52.,35. No. 18, p. 2 1.Hill. D. S. 1976, in Mfultiple Periodic: Variahles, ed. W. S. Fitch lDordrcli Villmu, 0.,and Rtiiki, S. MI. 1983,Avtr. Aj,. 127,5.
Reidell, p. 287. Vogt, S. S. 1983, in /AVL. Collo quium 7/, Act fray in Red. mI)wa Stars, ed. 11. t11an 1981, in Solar Phenomiena in Stars and Stellar Systems, ed. R. Bonnet Byrn~e and M. Rodlon6 (Dordrecht: Reidellp. 137.
ndA. K. Dupree (Dordrechi: Reidell. p. 43 1. Waltcr, F. M., and Bowyer, S. 198 1, Api ., 245, 67 1.[Hall, D. S.,et al. 1978, ntf. Bull. Var. Stars, No. 1459. White, N. E., and Miarshall, F. E. 1983, Ap. J. (Letters), 268, LI 117.Hjellming, R. NI.. Webster, E., and Balick, B. 1972, Ap. J. (Letters). 178, LI 39.
T. R. AYRES: Center for Astrophysics and Space Physics, Campus Box 39 1, University of Colorado, Boulder, CO 80309
N. L. COHEN: Boston Research Group, Suite 2714, 1 Longfellow Place, Boston, MA 02114
P. A. FELDMAN: Herzberg Institute of Astrophysics, National Research Council of Canada, 100 Sussex Drive, Ottawa ON,K I A 0R6, Canada
J. L. LINSKY: Joint Institute for Laboratory Astrophysics. Campus Box 440, University of Colorado, Boulder, CO 80309
S. J, LITTLE: Department of Natural Sciences, Bentley College, Waltham, MA 02154
I. R. LITTLE.-N4ARF.NIN: Astronomy Department, Wellesley College, Wellesley, MA 02181
R. LYONS: David Dunlap Observatory, University of Toronto, Box 360, Richmond Hill ON, L,4C 4Y6, Canada
THErODORE SIMON: Institute for Astronomy, University of Hawaii, 2680 Woodlawn Drive, Honolulu, I 96822
23

Appendix B
Carbon Stars with Silicate Dust in Their Circumstellar Shells
25

The U.S. Government is authorized to reproduce and eIi this report.
Permission for further reproduction bY others must be obtained rom
Till ArRoPHYSICAL JOURNAL, 307:L5-L19, 1986 August 1 the copyright owner.
I';s6 Tlw .Ancrt-an A.tronocail Smilcty All rngh- rescrved Printcd in U.:;A
CARBON STARS WITH SILICATE DUST IN THEIR CIRCUMSTELLAR SHELLS
IRENE R. LI'-ILE-MARENINWhitin Obicrvatory, Wettesley College: and Air Force Geophysics Laboratory, Hanscom AFB, Mass,'
Received 1986 March 10, accepted 1986 Mo , 14
ABSTRACT
Almost all carbon stars having LRS spectra obtained with IRAS are surrounded by circumstellar dust shellsusually characterized by a very uniform 11.15 jm SiC grain emission feature. About 4% of the C stars show afeature that is shifted to - 11.6 Aim. Extraordinarily, three C stars (13M Gem, V778 Cyg, and C1003) areapparently surrounded by oxygen-rich dust shells characterized by strong silicate emission.
Subject headings: infrared: spectra - interstellar: grains - stars: carbon - stars: circumstellar shells
Many 8-22 Aim low-resolution spectra (LRS) with X/AX mum of the feature is found at 11.15 ± 0.10 Am with a50 obtained with IRAS show dust grain features of sili- FWHM of 1.6 + 0.15 jim. The shape and the maximum of
cates at 9.8 Am and of silicon carbide (SiC) at 11.2 Am which the excess emission presented in this Letter differ somewhatwill distinguish between materials with C < 0 or C > 0, from the average excess emission shown by Forrest, Gillett,respectively. Circumstellar shells have dust features in emis- and Stein (1975) from ground-based observations of C stars.sion if the shells are optically thin and relatively hot. The A few stars (Y CVn, UU Aur, RY Dra, V Aql, andspectrograph and calibrations are discussed by Raimond, IRC +10216) show an emission feature shifted to 11.6 AmBeintema, and Olnon (1985). (Fig. 2a). This feature was first seen in the spectrum of Y
CVn by Goebel et al. (1980). Whether this feature is also due1. CARBON AND M STARS to SiC is not known. The graphite resonance feature predicted
Carbon stars have photospheric compositions with C > 0 by Draine (1984) at 11.52 jm is too narrow to be the feature
and their circumstellar shells are known to contain SiC dust seen in these spectra. A downturn in the flux seen in many of
grains (Forrest, Gillett, and Stein 1975). Almost all of the 130 the C star spectra (Fig. 2a) at wavelengths < 8.2 Am is most
high-quality LRS of C stars show evidence of circumstellar likely due to the presence of a strong HCN and C2 H 2
dust shells usually characterized by the SiC emission feature. absorption feature at 7.1 jm first identified in the spectrum C'
Extraordinarily, three C stars with LRS show a very strong the C star V CrB by Goebel et al. (1981).
9.8 jm emission feature (Littlc-Marenin and Wilton 1985) In order to identify the carrier of the 9.8 jm feature seen in
(see § II, below). Figure 1 shows the spectrum of a typical C the three C stars mentioned above, I analyzed high-quality
star V Cyg matched to a 2000 K and 500 K blackbody energy LRS of M stars. Figure 3 shows the spectrum of the typical M
distribution. The 2000 K blackbody continuum matches best star TY Cas together with a 640 K blackbody energy distribu-
the 8-13 Am region, whereas the 500 K blackbody continuum tion and the resulting excess silicate emission feature. Figure
matches the 13-23 Am region better. In order to study the 2b shows an overplot of the normalized silicate emission
wavelength dependence of the SiC and silicate features, I have excess of eight M stars after subtracting a local blackbody
assumed that the 8-22 Aim emission is produced by (a) the continuum matched to either side of the feature. The shape of
stellar photosphere, (b) a continuum dust emission, and (c) a the excess is not as uniform as that due to SiC. The maximum
strongly wavelength-dependent dust grain emission. Assuming of the average silicate feature occurs at 9.8 ± 0.2 jm, but the
that the first two terms can be represented by blackbody exact shape of the feature, the width, and the shortest wave-
energy distributions, I subtracted them from the observed length of notable excess vary significantly from star to star
spectrum. I call the remaining strongly wavelength-dependent with the FWHM varying between 2 and 3 jm. In general I
dust grain emission term the excess SiC or silicate emission, find that the stronger the silicate feature the greater its width
This method does not measure the total infrared excess of a and the shorter the beginning wavelength of the emission
star usually defined as all the emission above the photospheric feature.
continuim. The excess SiC emission of V Cyg is plotted alongthe bottom axis of Figure 1. An overplot of the normalized Ii. CARBON STARS WITH STRONG SILICATE
excess SiC emission of many C stars shows that the shape of EMISSION FEATURESthe SiC feature does not depend on the strength of the feature Three stars classified as C stars (see Stephenson 1973) areand is quite uniform among these stars; however, for the sake found here to have the same 9.8 jm and 18 jm feature as Mof clarity only five stars are plotted in Figure 2a. The maxi- stars. These are BM Gem - IRC +30182 - C716 (C5,4J Lb),
V778 Cyg - C2919 (C5-, 5 Lb) and C1003 (the C + number= number in the Stephenson 11973] carbon star catalog). The
'Uni'l it, 1kcsidcnt Rcsearch Fellow. observed spectra of these three stars and their respective
L15
27

L16 LITTLE-MARENIN
Ii~ Tee=2000K
8-VCyg 0 8 -
C74e Miro P=21(O Y o
6 M6 Mi~o p= 6 18d
6 - E6-
4- ~ T 9 8 z640K
XT 9 g; 500 2 -i
6 o 1 4 1 6 2 208 10 2 14 16 18 20 22o - M
X (A.M )
Fir- I Fic. 3Fic. .- The LRS sp~'ctrurn of V Cyg. a Mira variablc carbon star, is matched to that of a 2000 K blackbody cncrgy distribution in the 9-13 41nf
region (normalized a: 9.8 Am) and to a 500 K blackbody energy distribution in the 13-22 Aim region (normalized at 13.9 Am) The SiC emission excess at11.15 Am is cle...y evident, and it is plotted as the observed spectrum minus the 2000 K blackbody energy distribution along the wavelength axis.
FiG. 3.-The LRS spectrum of TY Cas, a Mira variable M star, is matched to a 640 K blackbody energy distribution normalized at 7.8 Anm Thesilicate emission excess at 9.8 Arn is quite strong and is plotted as the observed spectrum minus the 640 K blackbody energy distribution along thewavelength axis.
blackbody energy distributions are shown in Figure 4a, 4b, feature of TY Cas but not with the SiC feature, I concludeand 4c. The 9.8 ;Lm emission excess is plotted along the that these three C stars are surrounded by material rich inwavelength axis for each star. The normalized emission excess silicate dust.of the three stars is plotted in Figure 5 as solid lines along It is difficult to interpret these observations. The circumstel-with the silicate feature of the M star T"Y Cas (dolled fine) lar shcll is assumed to be produced by mass loss from theand the SiC feature of the C star V Cyg (dashed line). Since central carbon star and should reflect the carbon-rich materialthe features of the three C stars agree well with the silicate of its photosphere. The transit time of material through the
(I (b)
sic SILICATE
1.0 11. 15;4m 4 9.8Mtm
Y CVn
0-
8 10 12 8 10 12 14
) (jm) X (,LM)
Fio. 2.-(a) The SiC emission excess of five carbon stars is overplotted (RV Aqr. V Cyg. T Dra, R Vol, C142). Each excess was normalized to 1.0 aftersubtracting a local blackbody continuum from each LRS spectrum. A few stars such as Y CVn have an emission excess that is shifted to longerwavelengths. A second emission feature at 8.4 gim is also visible in the spectrumn of Y CVn. (b) The normalized silicate entission excess of eight M stars isoverplotted (TY Cas. Z Eri. R Hior, U Men, SY Men. S Per, WV Per. TV Per). The silicate excoN shnws much greater star to sto, variation than doe% the SiCfeature.
28

10 0
80
BM GemI" C5, 4J Lb
b
2-
8 10 12 14 16 18 20 22
b
E 8-
V/778 Cyg
S6- C 55Lb
LA.
I-
.~2
CC
C
8-
C 1003
0
Ftc;. 4.-The LRS spectra for the three carbon stars withstrong 9.8 Am emission features are plotted. The excess emission
2 (observcd spectrum minus a local blackbody continuum) is plotted
"-'--t'.~ along thc wavelength axis for each star: (a) BM Gcm is matchedto a 600K blackbody energy distribution; (b) V778 Cyg to a 450Kblackbody energy distribution; (c) C1003 to a 380 K blackbody
0 energy distribution. All three blackbody continua are normalized
8 10 12 14 16 is 20 22 at 7.9 pm. A weak 18 pm emission feature also appears to beM~n) present.
29

L18 LITTLE-MARENIN Vol. 307
This scenario may be able to explain the emission features of
SILICATE SiC many of the S stars which appear to be a combination of
'---V Cyg relatively weak SiC and silicate emission (Little and Little-Marenin 1985). However, a different mechanism may be
% necessary to explain the very strong silicate features of BM
XGem, V778 Cyg, and C1003, since no C star appears to haveweak (or intermediate strength) silicate as well as SiC emis-
, sionffTY GaS Perhaps we are actually observing a binary system with an
M and a C star component. This scenario assumes that the
S0.5- visual and near-infrared light of the M star is absorbed b\ its.I .circumstellar shell (hence we were seeing the C star at these
I wavelengths), whereas the flux in the 8-22 Am region isdominated by the emission from the oxygen-rich shell. Asmall contribution (less than 15%) of SiC to the emission
0 feature would not be distinguishable in the LRS suggesting
A . that at 10 jim the circumstellar shell is at least 2 mag brighter
0 'than the C star. In fact, on the average C stars ar,- - 1 magbrighter than M stars of the same mass (Iben 1978). i'hereforethe 1 /im extinction by the circumstellar silicate shell must beat least 3 mag in order for the M star not to be observable at< I jim. To check for a binary companion, I suggest ((!)
8 t0 12 14 looking for orbital radial velocity variations (which may be(m) very difficult to disentangle from velocity variations related to
their light variability), (b) searching for spectral lines from
FIG. 5.-The normalized 9.8 Am emission excess of BM Gem. V778 both stars in the 2-10 Am region, and (c) observing theCyg. and C1003 are compared to the silicate excess of the M star TY Cas system at various phases to see if the M star is visible when(dashed line) and the SiC excess of C star V Cyg (dotted line), The the C star is at minimum light; however, the difference inagreement of the 9.8 Am excess with the silicate excess is excellent, maximum and minimum light of BM Gem is only - 0.6 mag.
Both components of a visual binary system with an S (or M)
circumstellar shell is only on the order of years to decades and a C star component (V633 Mon = IRC 00162; Bidelman
assuming that the grains form at distances < loll cm < 70 1980) have been observed photometrically (eight-color pho-
AU (Rowan-Robinson and Harris 1983; Dyck el cii. 1984) tometry) by R. F. Wing (private communication). The C star
and have outflow velocities of > 5 km s- 1. Outflow velocities is about - 1 mdg brighter in the red than the S or M star
for C stars are typically - 15 km s-I (Knapp and Morris component. The LRS spectrum of V633 Mon shows onlyweak SiC emission and no evidence of any silicate emission.
1985). V778 Cyg was classified as a carbon star over 40 yr Therefore the circumstellar material associated with V633
Yamashita (1972) classified BM Gem as C4,5J with strong Mon is quite different from that found near the three C stars
C2 and CN features, and eight-color photometry by Baumert discussed here. The probability of finding three out of 130(1972) in the 0.7-1.1 ,jim region shows that both BM Gem stars (i.e., almost 2.5%) on the AGB as binaries with verv
and V778 Cyg have the strong CN absorption features typical similar mass components is low.of Lb variable C stars. Hence it is unlikely that these two stars It is also possible, but not likely, that the oxygen-rich dustare misclassified, is part of the interstellar medium that finds itself close to the
It is unlikely that we are observing very recently produced carbon star (within about 10 stellar radii [!I) in order to be atcircumstellar material from a progenitor M star. The transfor- a temperature of about 350-600 K). No nebulosity near the Ccirmt t from a pS-Coccroentorim salTe t or stars is evident on the Palomar Sky Survey prints. Also, nomation from M -* S -. C occurs on a time scale of 10 yr brhtIA ponsuce(>3yat1 --/Ohefu
(Iben 1978; Iben and Renzini 1983) which is much longer bright IRAS point sources (> 3 Jy at 12 ju-1/10 the flux
than the transit time of material through the circumstellar of these three stars) are found within the field of view of the
shell. spectrograph.We may be observing an unusual chemical equilibrium in
the circumstellar shell. Thronson and Bally (1986) find thatthe dust/CO ratio in the carbon-rich planetary NGC 7027 is Ill. CONCLUSIONSthe sanie as that found in the oxygen-rich interstellar medium. The IRAS low-rcsolution spectra of idcntificd carbon starsThey speculate that it may be possible to produce an oxygen- show that almost all are surrounded by circun'stellar shellsrich environment out of carbon-rich gas if the region of usually characterized by the SiC dust emission, feature. Ingraphite and SiC grain formation overlaps that of CO. Graph- general the spectral shape of SiC at 11.15 j.m is ..,ite uniformite may remove so much carbon from the gas that after the from star to star irrespective of the strength of Lhe emission,shell becomes too cool to form CO, the remaining material Most variable M stars are surrounded by dust shells char-may actually be oxygen-rich. I suggest that the chemical acterized by silicate emission. However, the spectral shapereactions in the cooler regions of the shell may form silicates, shows considerable variation from star to star.
30

No. 1, 1986 CARBON STARS WITH SILICATE DUST L19
The three C stars BM Gem, V79 Cyg, and C1003 appear tively hot, oxygen-rich, optically thin silicate dust around, orto be surrounded by oxygen-rich shells characterized by strong in very close proximity to, three C stars. How this particularsilicate emission. These observations are difficult to interpret combination of star and circumstellar dust' shell has beenas these stars do not appear to be misclassified. They are produced is not clear.unlikely to be brand-new C stars since the transit time ofmaterial through the circumstellar shell is only on the order ofyears to decades, very short compared to the transition time I would like to thank L. Marcotte and C. Wilton for writingof an M star to a C star. It may be possible that the the computer programs used in this analysis and S. Price,temperature gradient in the shell allows for different chemical P. LeVan, and especially S. J. Little for many stimulating andequilibria to exist at different distances from the star. The informative discussions. This research is supported by a Uru-most likely explanation is that we arc observing a binary versity Resident Research Fellowship from the AFOSR tosystem with an M and a C star component. No corroborating AFGL and by the 1985 USAF-UES Summer Faculty Re-evidence for this exists, and I suggest searching for it. In search Program/Graduate Student Summer Support Programconclusion, the observations indicate the presence of rela- sponsored by the AFOSR and conducted by UES, Inc.
REFr.RENCESBaumert, 1. H. 1972. Ph.D. thesis, Ohio State Universit,. Little S. J., and Little-Marenin, I. R. 1985, in Proc. Fourth CambridgeBidelman. W. P. 1980. Pub. Warner and Swasey Ohs.. Vol. 2, No. 6. Stellar S'v.terns Workshop on Cool Stars and the Sun, in press.
p 185. Littlc-Marcnin, I. R., and Wilton, C. 1985, in Proc. Fourth CanibhrdgcDraine. B. T 1984. Ap. J. (Letters), 277. L71. Stellar Svstenis Workshop on Cool Stars and the Sun, in press.D'ck, H. M.. Zuckerman, B., Leinert. Ch.. and Beckwilh, S. 1984, Ap, J., Raimond. E.. Beintema, D. A., and Olnon. F. M. 1985, in Infrared
287. 801. Astronomical Satellite (IRAS)-Catalogs and Atlases-ExplanatoriyForrest. W. J.. Gillett. F. C., and Stein, W. A. 1975, Ap. J.. 195, 423. Supplement, ed. C. A. Beichman, G. Neugebauer, H. J. Habing, P. .Gocbel. 1. H.. er ti. 1980. Ap. J., 235, 104. Clegg. and T. J. Chester (Washington: US Government Printing Office)(icbel, J. H.. Bregnian. J. D.. Wittcborn. F C., TIlor,. I. J , and Chap. 9.
Willner. S. P. 1981. Ap. J,, 246. 455. Rowan-Robinson, M., and Harris, S. 1983, M.N,R.A.S., 202, 797.Iben. I. Jr. 1978. Ap. J., 220, 980. Stephenson, C. B. 1973, Pub. Warner and Swasey Obs., Vol. 1, No. 4.Ihcn. I., Jr., and Renzini. A. 1983, Ann. Rev. Astr. Ap., 21, 271. Thronson. H. A., and Bally, J. 1986, Ap. J, 300, 749.Knapp. G. R.. and Morris. M. 1985. Ap. J.. 292. 640. Yamashita. Y. 1972, Tokyo Astr. Obs. Ann., 13, 169.
IRENE R. LTrrLE-MARUNMN: AFGL/OPI, Hanscom AFB, MA 01731
31

Appendix C
A Water Maser Associated with EU Andromedae: A CarbonStar Near an Oxygen-Rich Circumstellar Shell
33

The U.S. Government Is authorized to reproduce and Sell this report.Permission for further reproduction by others must be obtained from
TilE ASTROI'HYSICAL JOIIRNAI.. 316:L37-L40. 19R7 May I the copyright owner.19K7 The Amcncarn Aitronnmmic.l S oley All rihts rcrcrvcd, Printed in U.S.A.
A WATER MASER ASSOCIATED WITH EU ANDROMEDAE: A CARBON STARNEAR AN OXYGEN-RICH CIRCUMSTELLAR SHELL
PRISCILLA J. BENSONWhitin Observatory, Wellesley College
AND
IRENE R. LiT-rLE-MARENIN'Whitin Observatory, Wellesley College; and Air Force Geophysics Laboratory. Hinscom AFB
Received 1987January 22. accepted 1987 February 13
ABSTRACT
An H20 maser emission line at 22.2 GHz has been detected toward the carbon star EU And, confirming theconclusion based on analysis of LRS IRAS spectra that this star is in the vicinity of an oxygen-richcircumstcllar shell. We interpret the 24 km s velocity diffcrence between the H20 maser, measured at - 29.4km s', and the carbon star absorption line velocity of -53 km s-1 to be due to th': orbital motion of the C starabout an M star with a relatively thick circumstcllar shell.Subject headings: masers - stars: carbon - stars: circumstcllar shells - stars: individual (EU And)
I. INTRODUCTION 11. OnSERVATIONS
Recently, Littlc-Marenin (1986) and Willems and de Jong Observations of the 61,-523 transition of H20 at 22,235.080(1986) have shown that at least three reliably classified carbon MHz were carried out with the 37 m Haystack Observatory2
stars, and three or four others with less reliable classifications, telescope during 1986 December 13-15 and 1987 January 23.arc near oxygen-rich circumstellar dust shells as deduced from The system temperature averaged about 90 K. The spectrathe presence of the 10 pm and 18 Am silicate emission were automatically corrertcd by the Haystack computer forfeatures in their IRAS low-resolution spectra (hereafter LRS) atmospheric attenuation and for variation in telescope gain(IRAS Science Team 1986). These three stars are EU And with elevation. We used an autocorrelator bandwidth or 13.33(C4,4: Dean 1976), T3M Gcm (C4,51 with strong C2 , '2 CN MHz with 512 channels for the 1986 December observations,and t' CN features: Yamashita 1972) and V778 Cyg (C4, 5': resulting in a velocity window of 180 km s- I and a resolutionYanmashita 1975). The three stars were first recognized as of 0.53 km s- '. In 1987 January, we used a bandwidth of 4.44carbon stars on the Dearborn Observatory's objective prism MHz with 1024 channels, resulting in a velocity resolution ofsurvey of red stars in the early 1940s. The location of the 0.09 km s-. The stars were observed in a total power modestars listed by Little-Marenin (1986) in color-color plots with three sets of 5 minutes on source and 5 minutes offbased on the IRAS point source fluxes at 12, 25. 60 and source.100 pm are also indicative of oxygen-rich circumstellar(hereafter CS) shells (Zuckerman and Dyck 1986). As an It. RESULTSindependent confirmation of the oxygen nature or the dust The 1986 December 15 maser detection toward EU And isshells, we decided to search the semiregular carbon stars EU shown in Figure 1. The observed line was well fitted by aAnd (R.A.[19501 - 23h77m4 1
6; d cl . [1950 1 - +465800" and Gaussian with the following parameters: TA* - 0.68 (0.05) K,BM or H 0 mission, si7e h 0 17asers are1 ofte VLSR - -29.40 (0.03) km s-t and AV(FWHM) - 0.67 (0.06)+25*05 5") for HC emission, since HM0 masers are often km s - '. The formal errors in the Gaussian fit are given inassociated with the CS shells around Mira or semirgular parentheses. The rms noise in the off-peak channels is 0.047(hereafter SR) variable M stars (Engels 1979; Reid and Moran K. Although the line width is only a little greater than one1981; Dickinson and Dinger 1982). resolution element, the line appears to be real since it showed
Neither star has a well-established period. The fourth edi- uion le thelinenapears t o bal sie it sedup on all three runs and is typical of many other HzlO masers.tion of the General Catalog of Variable Stars (Kholopov 1985) The integrated area of the feature is 0.62 K km s-'. Using alists EU And as a SR variable with a photographic magnitude conversion factor of 12 y per K, the line intensity is 8.2 Jy.range of 12.9-14.1. The classification for BM Gent in the No othe factr f 2 line is visible with flux > Jy (3 ).f'ourth edition was revised to SRb-286:d from Lb. Often SR EU And was rcobserved on 1987 January 23 with betterand Lb designations arc indicative of less well observed velocity resolution (0.09 Im s). The intensity appears to.%tL-r as.
2 Radio astronomy at Haystack Observatory of the Northeast RadioObservatory Corporation is supported by the National Science Founda-t University Resident Research Fellow, lion under grant AST-78-18227.
L37
35

L38 BENSON AND LITTLE-MARENIN Vol. 31(
8 . .. Hence, it is theoretically possible to still see the oxygcn-richEUAnd C4,4 material in the CS shell for a brief period after the photo-
sphere has already turned into a C star. However, the transitVRs=-29.4 time for material to move through the shell is so short that it
6 km s -I would be very difficult to observe this transition phase(Liltie-Marenin 1986). Theoretical models of CS oxygcn-richshells (Rowan-Robinson and Harris 1982, 1983a) indicatethat the majority of the silicate emission comes from a region
-4- around 10 R. in agreement with observations (Dyck et al1984). Based on typical outflow velocities of about 15 km s-
- obtained from CO observations of carbon stars (Knapp andX Morris 1985), the material will transit through the region of:D 2 strong silicate emission in 3-15 yr if a typical C star istL_ assumed to have a radius of 1-5 AU. Even a 2 km s- 1 outllow
velocity implies a transit time of only 15-45 yr, which ismarginally compatible with the time since EU And, BM Gem,
Y Mand V778 Cyg were classified as carbon stars.Dean (1976) determined a photospheric absorption-line
velocity for EU And of V,= -62 km s - ' (VLt,, - -53km s-'). This value is blueshifted by 24 km s -' relative tothat for the 1-120 maser. Theoretical models of H20 masersaround giant long-period variables (hereafter LPV) (Cookeand Elitzur 1985) show that typical outflow velocities in the
-60 -40 -20 0 H20 masing region are about 3-6 km s' when the terminalVELOCITY (n/see) velocity is about 10 km s- 1. The 1-120 emission lines may beeither blueshiftcd or redshifted relative to the stellar lires
FIG. t.-Spctrun or the H20 maser emission in EU And implying that the masing region can be either in the near orthe far side of the expanding envelope. Dickinson et at. (1978)point out that the photospheric absorption lines are often
have decreased to about 5.5 Jy. The unsmoothed spectrum redshifted by 0-8 km s-1 relative to systemic velocities de-has rms noise equal to 0.125 K and the Gaussian fit gives termined from thermal SiO lines. The same trend seems tovalues of T - 0.46 (0.04) K, VLst - -29.67 km s - (0.02), apply to the mean of the H20 maser lines if two componentsand AV(FWHM) - 0.52 (0.06) km s'. The FWHM is nar- are observed. Hence, if EU And is a usual type of LPV giant,row (on the order of the previnus resolution), which indicates the EU And water maser velocity would be (- 53 + 8) ± 6that the line probably was not fully resolved in December, km s -' or no greater than -39 km s - ' compared to theand we may have underestimated its intensity. The Hanning- observed velocity of -29.4 km s-t,smoOthed spectrum (with rms - 0.076) shows the possibility Typically I-12O masers are located in an expanding gas shellof a second feature with Gaussian parameters 7* - 0.16 between 1014_1015 cm (7-70 AU) from an exciting M star,(0.02), VLSR - -31.21 km s' (0.15), and AV(FWHM) - usually a Mira or a semiregular variable giant or supergiant1.83 (0.38) km s - t . The total integrated area for both features (Reid and Moran 1981; Bowers and Hagen 1984; Johnston,is 1.242 K km s - I. Spencer, and Bowers 1985). VLBI observations by Johnston,
BM Gem was observed 1986 December 14 with the velocity Spencer, and Bowers (1985) of four LPVs suggest that thewindow centered on the optically determined radial velocity H20 masing region is located outside the silicate emissionof 98 km s-I (Abt and Biggs 1972), covering velocities from 8 region. Although the OH emission measured by Bowers,km s-t to 188 km s'. No H20 lines were detected. The rms Johnston, and Spencer (1983) appears to come from sphcri-of the spectrum was 0.036 K, implying an upper limit of cally symmetric envelopes, such spherical symmetry is notabout 1 Jy (3 a). as well established in the H20 data. The distribution of
H20 maser emission is quite complex and highly variable intime-both in intensity and location (Gomez Balboa and
IV. DiscussioN¢ Lepine 1986; Johnston, Spencer, and Bowers 1985; BcrulisThe detection of the H20 maser emission line confirms the et at 1983). In general, the emission profiles show a greater
presence of oxygen-rich material in the vicinity of EU And degree of complexity around supergiants than giants.but leaves the physical relationship between the O-rich cir- Zuckerman (1980) indicates that C stars appear to havecumstellar shell and the C-rich photosphere unexplained. nonspherical envelopes more often than M stars and suggestsWillems and de Jong (1986) have argued that we are observ- that such geometry is influenced by a companion.ing the transition from an M to a C star while the star is on We interpret the H20 maser emission as coming from a CSthe asymptotic giant branch (AGB). During helium shell envelope around an M star which has at least a 10 km s-flashing for AGB3 stars carbon-rich material can be dredged redshift with respect to the C star companion. We suggestup, turning the oxygen-rich material of the M star into the that EU And is a binary system in wlich the visible light incarbon-rich material of a C star (lben and Renzini 1983). the 6000-7000 A rcgion is dominated by the C star, while the
36

No. 1, 1987 WATER MASER ASSOCIATED WITH EU AND L39
10 Am flux and H20 emission originates in the CS shell or the continuum (Noguchi et al. 1977). Hence, if the energy distri-M star. Thus, EU And may be the first radio spectroscopic bution of EU And is similar to BM Gcm in the 3 Am region,binary (Cohen 1987). we would expect the C component to be only about 0.5 mag
In order to check th, plausibility of this deduction, we plot or so brighter than the M star in this region. If we normalizein Figure 2 a CS dust shell model by Rowan-Robinson and the flux of WX Ser and HV Cas at 5 ptm (lower dashed curveHarris (1983b) for HV Cas (C4,3-C5,4; M.527d), a C star of for WXSer), we find that the M star is still brighter at 10 pAmsimilar spectral class to EU And, as well as the M star model by about 2 mag. The shaded area on the graph thcrcforcfor WX Ser (Mg; M-425(l). which has a 10 jim feature similar indicates the possible range of the M star fluxes compatiblein strength to EU And as observed by the [RAS LRS. A with the observations. The contribution of 11.2 pAm SiCrelatively thick CS shell (,, - 10) is predicted by the M star emission to the strong 10 p.m silicate emission feature wouldmodel which absorbs a large fraction of the visible light and not be observable. Therefore a model of a C star and a late Mrcradiates the energy in the infrared. The Rowan-Robinson star with a circumstcllar shell can explain the observed energyand Harris (1983b) C star models do not include the SiC distribution in the 0.6-0.7 j.m region, the 8-10 Azm region,emission which is observed at moderate strength in the LRS and 22 GHz H20 emission.of HV Cas. Rowan-Robinson et at. (1986) have modified their We expect M and C star components in a highly evolvedmodels slightly in order to improve the predicted 60 and binary system to have very similar masses and luminosities in100 pAm IRAS fluxes, but these differences are at wavelength order for both to be on the AGB. Since the more evolved C> 20 p.m and therefore will have little effect on the present star should be slightly more luminous, we conclude that theanalysis. We assume that the C star is at least two magnitudes lower curve for WX Ser, together with the solid curve for I-IVbrighter at 6000-7000 A since the M star is not visible in this Cas, is a more realistic representation of the relative energyregion. We accordingly normalize the two spectra at 0.9 Am distribution for the two stars. As can be seen in Figure 2, the(rupper dashed curmefor WX Ser). The circumstellar dust shell less luminous M star dominates the radiation in the infraredaround the M star is then approximately 5 mag brighter at 10 because a large fraction of its visible light is absorbed andAm as shown in Figure 2. Photometry of the 1.0-3.7 p.m reradiated by the CS shell.
-gion of BM Gem shows the typical 3 ,im HCN and C2 H2 A search through the LRS spectra shows that more thanabsorption feature of a carbon star (Noguchi et al. 1981). The half of the LPVs with strong silicate emission like EU Andtypical spectra of M stars in the 3 pm region show a smooth are Miras with fairly long periods (<P) = 4 0 0d), another
25%-30% are semiregular variables, and the rest arc eitherirregular variables or poorly observed stars. Only two short-
8 .. period Miras R Cet (P - 166' ) and Sv Pup (16 8d) show a
WX Ser (MB;M-425d) and HV Cos (C4,3;M-527d) very strong 10 Am silicate feature. An H 20 maser has re-cently been detected in R Cet (Benson et al. 1987). Hence, byanalogy the companion to EU And should be a SR or a Mirawith a period around 4 00 d.
D /-,WX/Ser About 10% of the LPVs with strong silicate emission are:_WX Ser classified as supergiants, with expansion velocities of around
20-50 km s- I in their CS shells as determined from O1-. SiO,and H20 observations. The difference between the absorption-
/ line velocities of the carbon star and the H20 maser velocityAcould then be due to the expansion of the CS shell around a
4 single supergiant carbon star. There are several arguments.A HV Cos which can be made against the latter interpretation. First, no
/supergiant C stars with large outflow velocities are known(anonymous referee 1987, private communication), in part
.. due to the fact that no spectroscopic luminosity criteria for Cz--- stars exist. Second, the silicate and H20 maser emission
regions are predicted to be located roughly a factor of 5-100 further from a supergiant than a giant (Rowan-Robinson and
4 Harris 1983a). However, the expansion velocities are largerby roughly the same factor (Bowers, Johnston, and Spencer
0 ,, ,,,, 1983; Gomez Balboa and Lepine 1986), making the transittime of material through a supergiant silicate emission region
10"1 I 10 102 less than about 50 yr, which is too short to be compatible withWAVELENGTH IN MICRONS the C star classification. Third, the galactic latitude of
EU And (b = 12') is larger than for most supergiants. Fourth,Fic. 2.-A possible model (or EU And: a C star (H-V Cas;. solid the I-I20 maser line is quite narrow and shows only one
crt'e) + an M star with a rclatively thick CS shell (WX Ser: dashed component which is more typical of CS shells around giantscurtes). The spectra of HV Cas and WX Set are normalized at 0.9 pim(upper dashed curve of WX Ser) and at 5 jtrn flower dathed ctroe of WX than supergiants. Of course none of these arguments is con-Ser). Thc shaded area indicate. ihe possihic range of relative flux or the elusive. As a better test for distinguishing between binaryKI %tar compatible with obscrvations. giants and a single supergiant, we suggest that EU And, as
37

L40 BENSON AND LITTLE-MARENIN
well as BM Gem and V778 Cyg, be searched for OH and SiO emission and at 22 GHz as an 1-120 maser line. We hypo-emission, since most CS shells with H 20 maser activity are thesize that EU And, along with the other carbon stars thatalso OH and SiO masers. Often the emission (especially in show strong silicate emission in their spectra (BM Gem, V77SOH) is double-peaked with the mean velocity corresponding Cyg) are H 20, as well as OH and SiO maser sources, and weto the systemic velocity and the velocity difference between plan to search them for periodic shifts in spectral line vcloci-the peaks corresponding to the expansion velocity. Observa- ties in order to establish or disprove the binary nature of thesetions of a doublc-peaked maser should immediately tell us the systems.systemic velocity.
This research is in part supported by a University ResidentV. CONCLUSION Research fellowship from the Air Force Office of Scientific
We observed 22 GHz H 20 maser emission toward the C Research to the Air Force Geophysics Laboratory (IRL-M)starEUAnd. The velocity of the line (VLSR - -29.4kms - ') and a Dudley Award from the Dudley Observatory, theis redshifted by about 24 km s- I relative to the photospheric William and Flora Hewlett Foundation Grant of the Re-absorption lines of the star (VLsR - -53 km s'). We inter- search Corporation, and the National Science Foundationpret EU And as the first detected radio spectroscopic binary under grant AST.8610467 (P. J. B.). We would like to thanksystem with C and M star components. The carbon star is the staff of the Haystack Observatory for their assistance, theseen and classified in the 6000-7000 A region, whereas the referee for very prompt and useful comments, and S. D. PriceO-rich CS shell around the M star is seen at 10 pm as silicate for helpful suggestions.
REFERENCESAbt, H. A., and Biggs. E. S. 1972, Bibliography of Stellar Radial Velocities Johnston, K. J., Spencer. J. H., and Bowers, P. F. 1985, Ap. J., 290, 660
(New York: Latham). Litile-Marcnin, I. R. 19X6, Ap. J. (Letters), 307, LIS.Benson, P. J., Little-Marenin, I. R., Dickinson, D. F., Turner, B. E., and Kholopov, P. N., ed. 1985, General Catalotgue of Variable Stars (4th cdJewelt, P. R. 1987. in preparation. Moscow: Nauka).
Ocrulis, 1. 1., LckhJit, E. E., Pashchcnko, M. J., and Pudnitskii, G. M. Knapp, G. R., and Morris, M. 1985, .4p. J., 292, 640.1983, Soviet Astr.. 97, 179. Noguchi, K., Kawara, K., Kobayashi, Y., Okuda. H., and Sato, S. 1981.Bowers, P. F., and Hagen, W. 1984, Ap. J., 285, 637. Pub. Asir. Soc. Japan, 33, 373.Bowers, P. F., Johnston, K. J., and Spencer, J. H. 1983, Ap. J., 274, 733. Noguchi, K., Maihara, T.. Okuda, H., and Sato. S. 1977, Pub. Astr. Soc.Cohen, N. L. 1987, nomenclature suggested in personal communication. Japan. 29, 511.Cooke, B., and Elitzur, M. 1985, Ap. J., 295, 175. Reid, M. J., and Moran, J. M. 1981, Ann,. Rev,. Asir. Ap., 19, 231.Dean, Ch. A. 1976, A.J., 81, 364. Rowan-Robinson, M., and Harris, S. 1982, M.N.R.A.S. 200, 197,Dickinson, D, F., and Dinger, A. S. 1982, Ap. J., 234, 136. -. 1983a, M.N.R.A.S., 202, 767.Dickinson, D. R., Reid, M. J., Morris, M., and Redman, R. 1978, Ap. J. -. 1983h, M.N.R.A.S., 202, 797.
(Letters), 220. L113. Ruwan-Robinson, M.. Lcck, T. D.. Walker, D. M.. and Flarris. S. 1986.Dyck, H. M., Zuckerman. B., Leinert, Ch., and leckwith, S. 1984, ,4p. J., Af.N.R.A.S., 222, 273.87, 801. Willems, F. J., and de Jong. T. 1986, Ap. J. ( Letters), 309, L39.Engels, D. 1979, Asir. Ap. Suppl., 36, 337. Yamashita, Y. 1972, Ann. Tokyo Asir. Ohs.. 13, 169.Gomez Balboa. A. M., and Lepine, J. R. D. 1986, Asir. Ap., 159, 166. - 1975. Ann. Tokyo Asir. Ohs., 15, 1.Iben, L., Jr., and Renzini, A. 1983. Ann. Rev. Asir. Ap., 21, 271. Zuckerman, B. 1980, Anan. Rev. Asir. Ap., 18, 263.IRAS Science Working Group. 1986, Atlas of Low-Resolution Spectra, Zuckerman, B., and Dyck, H. M. 1986, Ap. J., 311. 345.
Astr. Ap. Suppl., 65, 607.
PRJSCILLA J. BENSON: Whitin Observatory, Wellesley College, Wellesley, MA 02181
ItENE R. Lirt.-u-MAutNIN: AFGL/OPI, Hanscom AFB, MA 01731
38

Appendix D
New Carbon Stars Identified from Low-Resolution IRAS Spectra
39

THE ASTRONOMICAL JOLRNAL ',OLII 93, N('%113I1 N AR(-i
NEW CARBON STARS IDENTIFIED FROM LOW-RESOLUTION IRAS aPECTRA
I. R. Liri.-MARININAFGIL/OI'I, lHanscom A I, Mt , chti',etl'. O I 73)
andWhitin Observatory, Wellesley College, Wellesley, Massachusetts 021 8I
M. E. RAMSAYWhitin Observatory, Wellesley College, Wellesley, Massachusetts 02181
C. B. STEI'HENSONDepartment of Astronomy, Case Western Reserse Uni ersity, Cle% eland, Oho 44106
S. J. LIII.Department of Natural Sciences, Bintley College, Waltham, Mastachusetts 02254
S. D. PRICI£AFGL,'OPI, tanscom AFB. Massachusetts 01731
Received 14 October 1986; revised 18 Votember 1986
ABSTRACT
We have classified 176 IRAS sources as carbon stsrs based on the presence of the SiC emission featureat 11.2 pim in their low-resolution spectra.
The Infrared Astronomical Satellite (IRAS) obtained the usual C spectral classification and hence cannot give alow-resolution spectra (LRS); 15<3./AA<60) of about more precise subclass. Table I lists the 176 newly classified5000 IRAS point sources in the 8-22pm region (IRAS Ex- carbon stars, including five whose prior C classification isplanatory Supplement 1985). This region is particularly im- unpublished. Columns 4 and 5 list the 1950 right ascensionportant for the study ofcircumstellar shells since it contains and declination as listed in the LRS catalog and columns 2the dust-grain signatures of both silicate dust around 10 and and 3 their precessed 1900 coordintes. Column 6 gives the18 ,um arid silicon carbide (SiC) dust at 11.2.pm. The LRS LRS charae,ccization and column 7 the quality of the twohave been divided into ten major classes determined by the halves of .- ,(c LRS spectrum. The first number in column 7shape of the spectra. The classification details are given in refers to the 8-13 /m region and the second to the 1 1-22ptmchapter 9 of the IRAS Explanatory Supplement (1985). region with I = good, 2 = moderate, and 3 = poor. ColumnFive-hundred forty-two of the LRS are characterized as be- 8 gives associations with other catalogs as listed in th7 LRSlonging to class 4n. These objects have a stellar continuumenergy d;stribution and an I I pim emission feature presurn-ably due to OiC (4n: n = 1-9 is a measure of the strength ofthe 1 p tm feature). Eleven LRS are characterized as belong- t0
ing to class 04; these LRS do not fit any of the other classesbut appear to be related to the class 4n. Since three of these [RAS 01324+4907stars are known C stars, we have included the eight other 8objects in our analysis. Two-hundred twelve stars (38%) of ethe 4n and 04 objects can be identified with known carbon 'stars. Of the remainder, 41 objects are associated withknown M, MS, and S stars (these particular stars have an 6
unusual 10-11 /m emission feature (Little and Little- S .Marenin 1986)) and one with a CS star. We are attempting E -OBSERVED SPECTRUM
to classify the remaining 299 objects (54%). E S'CTUAn analysis of the LRS of known carbon stars shows
, Little-Marenin and Wilton 1986; Little-Marenin 1986) , T6B8 !60K
that almost all spectra contain a remarkably uniform emis- 2stn feature due to SiC dust. This feature extends from about sic10to 13pm with a maximum at 11.2pm. The new stars are OERVED /A
classified by matching a blackbody energy distribution to the TO0 °6001 ,,
continuum underlying the emission feature at 1 1 urn (Fig. o0 2- :6 8 20 221 ) and subtracting the blackbody curve from the observed
spectrum. Comparing the shape of the resulting normalized WAVELENGTt (,Mm)
emission features of an unclassified star to that of observed FIG. 1. The observed low-resolution spectrum of the new carbon star IRASSiC excesses of known carbon stars allows us to uniquely 01324 + 4907ismatchedtoablackbodyenergydistributionof1600K. Theassign a given object to the stellar carbon star class (Fig. 2 ). excess emission around I 1.2jim is clearly present The difference specrumWe have been unable to correlate the strength of the SiC il, c.ed - 1600 K blackbody enetgy distribuioi) , phlc Along tldgfeature with the temperature or compositio-i parameter of wavelength axis
(>3 ,\sI on J 93 3 . NI I T IXX 0X4 -6251,, /kUij(l.8110 1) c 19367 Ani AsiI on S'. ,The U.S. Governt nt Is authorized to reproduce and sell this report.
PerrpIsslon for further reproduction by others must be obtained fromthe copyright owner.

004 1III-ILE-MARIENIN E'AL.: NEW CARIBON S]ARS 004
catalog. An asterisk in the Note colunm (9) indicates thatOVER PLOT OF SiC FEATURES additional information for that object is given at the end of
the table. O1 the 176 stars, 148 are IRAS sources with noKNOWN C STAR catalog association, 16 are AFGL sources (Price and Mur-
1.0 RFG 23dock 1983), and 14 have an assortment of other associations.X NEW C STAR Three appear to be incorrectly classified as M stars.xN
) RIt is difficult to classify the remaining 124 LRS with 4n_J 0RAS and 04 characterizations because of their low signal-to-noisea ratio or unusual spectrum. However, 42 of these appear to
N.IJshow a weak 10tpm silicate absorption tcature, 26 show an-j 0.5 18,m emission feature with the 10,m feature partly in self-
absorption, and ten show the unusual 10-11 pm emissiono feature found in other M, MS, or S stars with 4n character-z izations. The remaining spectra are too unusual or too noisy
to classify reliably.0,-Of the 212 IRAS sources which are known carbon stars,0.0 147 were associated in the LRS catalog with stars listed in
0 12 14 Stephenson's (1973) Catalog of Cool Carbon Stars
(CCCS). For the sake of completeness, we list in Table 11 theremaining 65 IRAS sources characterized as 4n or 04 with
WAVELENGTH (M~m) whose C classification we agree. Coded references to theirspectral classification are given in the REF column. Table II
FIG. 2 The excess emission oflRAS 01324 + 4907 agrees well includes 12 CCCS stars with more realistic error bars fortith the SiC features of the known carbon star RAFGL 2232. their coordinates than assuniecd by the IRAS association
Hence this star is classified as a carbon star. search program. This table does not include RAFGL 5250
TABLE I. New carbon stars.
NO. RA (1900) DEC RA (1950) DEC LRS QUAL ASSOC. NOTE(1) (2) (3) (4) (5) (6) (7) (8) (9)
1 0 39 27.3 +52 53 58 0 42 16.7 +53 10 24 45 132 1 11 2.1 +62 50 23 1 14 16.6 +63 6 15 42 123 1 29 20.8 +48 51 57 1 32 24.1 +49 7 21 44 124 1 40 46.2 +64 2 54 1 44 19.6 +64 17 58 43 12 RAFGL 2485 2 55 16.1 +66 27 34 2 59 37.5 +66 39 30 44 136 3 12 36.9 +32 47 36 3 15 42.9 +32 58 40 43 127 3 15 23.3 +56 31 10 3 19 13.8 +56 42 3 44 128 3 19 47.6 +60 23 52 3 23 52.3 +60 34 30 43 12 RAFGL 4277S9 3 24 5.7 +51 9 45 3 27 44.5 +51 20 9 44 12
10 3 25 14.9 +60 28 1 3 29 21.6 +60 38 20 43 1111 3 26 17.0 +56 48 26 3 30 11.4 +56 58 42 43 2312 3 34 29.0 +59 17 43 3 38 34.1 +59 27 30 42 1113 3 52 13.4 +43 55 55 3 55 42.1 +44 4 39 43 12 RAFGL 511014 4 9 39.5 +39 10 42 4 13 1.7 +39 18 20 43 11 RAFGL 6312S15 4 13 41.9 +14 12 40 4 16 30.8 +14 20 3 47 2316 4 13 38.8 +59 44 23 4 17 55.6 +59 51 43 42 12 RAFGL 511817 4 14 30.1 +41 37 53 4 17 57.3 +41 45 11 44 2318 4 32 15.5 +43 17 33 4 35 47 .8 +43 23 40 42 2319 4 31 51.5 +63 43 4 4 36 31.3 +63 49 11 45 2220 4 33 19.1 +44 55 41 4 36 55.0 +45 1 44 43 2321 4 54 7.1 +49 51 27 4 57 57.0 +49 56 3 43 2322 5 7 27.5 +20 52 18 5 10 26.0 +20 55 59 42 12 X0510+209823 5 9 51.8 +47 9 11 5 13 36.0 +47 12 40 43 1224 5 28 45.0 +17 55 46 5 31 40.1 +17 57 56 45 1325 5 40 .4 -32 26 7 5 41 51.7 -32 24 44 43 1126 5 41 57.1 +13 20 23 5 44 46.6 +13 21 36 43 1327 5 56 4.0 +67 33 10 6 1 19.4 +67 33 16 44 2328 6 5 54.1 +19 9 36 6 8 50.9 +19 9 4 43 2229 6 6 31.3 -27 8 43 6 10 30.7 -27 9 25 45 2330 6 15 28.6 +46 5P 23 6 19 13.6 +46 57 7 42 1231 6 17 53.9 + 9 32 59 6 20 38.7 + 9 31 35 43 1232 6 19 34. 1 +17 3 6 6 22 28.1 +17 1 34 44 12 GN Ori33 6 21 8.7 + 9 5 44 6 23 53.0 + 9 4 6 43 12 RAFGL 94034 6 23 44.1 +20 35 4 6 26 42.7 +20 33 14 46 1335 6 24 7.1 + 8 51 10 6 26 51.1 + 8 49 19 42 11 V477 Mon36 6 29 6.8 +30 17 28 6 32 19.1 +30 15 14 45 1217 6 1t 17. 1 .11 16 i A "14 50. ) 31 14 23 42 13it) 1, I,. 2J. -) . 2 .1 2 0, .1 ) , J I .. 3 I 13 1139 6 46 4.4 + 5 54 36 6 48 44.8 + 5 51 10 43 1140 6 52 42.7 +28 56 57 6 55 52.2 +28 53 2 44 1341 6 53 .9.2 + 3 46 7 6 56 27.1 + 3 42 8 44 1242 6 56 40.3 -21 34 36 6 58 48.3 -21 38 46 44 12
42

665 LITTLE-MARENIN ETAL.: NEW CARBON STARS 665
TABLE 1. (continued)
NO. RA (1900) DEC RA (1950) DEC LRS QUAL ASSOC. NOTE(1) (2) (3) (4) '5) (6) (7) (8) (9)
43 7 5 30.1 - 1 1 39 7 8 2.5 - 1 6 27 42 1244 7 12 26.7 - 0 41 9 7 14 59.5 - 0 46 26 43 1245 7 13 33.8 - 1 5 58 7 16 6.2 - 1 11 19 42 12 *
46 7 14 22.0 + 7 26 57 7 17 3.9 + 7 21 32 44 1247 7 19 24.4 -12 40 47 7 21 43.9 -12 46 32 42 1148 7 19 54.4 -23 19 3 7 22 1.0 -23 24 50 42 12 RAFGL 5231
49 7 33 48.0 -35 42 38 7 35 37.6 -35 49 20 46 2350 7 34 49.8 -28 26 54 7 36 50.3 -28 33 41 43 1251 7 45 47.3 -71 4 53 7 45 25.7 -71 12 19 43 1152 7 51 21.8 -53 39 16 7 52 35.1 -53 47 6 46 23
53 7 51 26,3 + 9 58 36 7 54 10.2 + 9 50 42 45 23 *
54 7 52 31.9 -25 43 44 7 54 37.1 -25 51 41 44 2355 7 55 57.6 -40 46 51 7 57 40.8 -40 54 60 43 1156 7 55 59.8 -19 25 46 7 58 12.8 -19 33 56 44 11
57 8 2 15.3 -15 16 7 8 4 33.2 -15 24 41 44 2258 8 3 1.0 -28 30 18 8 5 3.4 -28 38 54 43 12 RAFGL 5240
59 8 10 3.5 -36 18 45 8 11 55.7 -36 27 47 43 1260 8 10 36.8 -12 27 2 8 12 58.0 -12 36 7 45 1261 8 17 14.1 -36 44 25 8 19 6.5 -36 53 53 42 1262 8 22 58.5 -25 55 49 8 25 5.8 -26 5 38 44 1263 8 32 6.0 -33 46 47 8 34 4.4 -33 57 8 42 11 RAFGL 5251
64 8 33 25.3 -34 13 46 8 35 23.3 -34 24 11 44 1265 8 43 28.4 -38 22 12 8 45 22.0 -38 33 11 42 2266 8 45 49.1 -56 59 14 8 47 5.6 -57 10 20 43 1367 8 51 53.4 -50 44 21 8 53 27.2 -50 55 47 42 1168 8 51 49.6 -47 13 0 8 53 30.4 -47 24 26 42 11 MRSL 267-01/1
69 8 54 22.5 -57 5 36 8 55 41.3 -57 17 9 44 1270 9 16 0.1 -51 35 3 9 17 38.5 -51 47 42 42 1271 9 40 53.2 -43 28 5 9 42 50.8 -43 41 51 43 1272 9 49 35.2 -53 10 37 9 51 20.8 -53 24 43 42 1173 9 51 49.1 -74 54 5 9 52 10.4 -75 8 15 43 11 RAFGL 4098
74 9 51 14.4 -54 51 52 9 52 57.5 -55 6 2 43 1275 9 51 48.3 -60 6 59 9 53 20.3 -60 21 10 42 2276 9 53 4.4 -55 8 40 9 54 47.7 -55 22 54 45 1377 9 56 55.6 -50 42 36 9 58 47.6 -50 56 59 43 1378 10 5 19.5 -63 26 39 10 6 49.0 -63 41 20 43 1279 10 6 38.3 -55 58 37 10 8 25.1 -56 13 21 45 2380 10 21 19.5 -58 8 42 10 23 8.4 -58 23 54 43 12 EMIS -582175
81 10 23 46.3 -40 28 46 20 25 56.8 -40 44 3 49 3382 10 35 25.9 -47 46 34 10 37 33.2 -48 2 10 43 1283 10 38 28.2 -58 10 12 10 40 24.6 -58 25 53 46 3384 10 53 56.7 -65 21 17 10 55 49.3 -65 37 19 44 13 *
85 11 5 16.4 -63 8 53 11 7 19.2 -63 25 8 43 1386 11 12 29.7 -65 18 12 11 14 33.9 -65 34 34 43 11
87 11 24 36.5 -64 21 25 11 26 49.3 -64 37 56 44 22 EMIS HEN 658 *
88 11 25 8.7 -68 45 7 11 27 16.9 -69 1 38 43 1289 11 28 20.3 -10 3 53 11 30 52.4 -10 20 26 44 11 *
90 11 48 55.6 -58 25 3 11 51 24.6 -58 41 44 41 1291 12 16 43.4 -59 50 59 12 19 26.2 -60 7 38 42 2192 12 18 52.3 -62 1 34 12 21 37.1 -62 18 12 42 11
93 12 20 1.1 -50 29 4 12 22 42.3 -50 45 42 43 1394 12 36 50.4 -64 30 45 12 39 47.5 -64 47 13 44 13 *
95 12 50 48.1 -68 29 24 12 54 .4 -68 45 40 42 11
96 13 0 6.4 -57 27 12 13 3 8.0 -57 43 18 45 13
97 13 6 8.5 -60 10 57 13 9 16.3 -60 26 56 44 2398 13 15 57.8 -65 12 59 13 19 19.8 -65 28 44 46 23
99 13 31 7.7 -57 52 34 13 34 23.5 -58 7 55 43 11100 13 44 8.4 -65 17 9 13 47 47.2 -65 32 6 04 11 RAFGL 4183
101 13 44 30.8 -67 1 12 13 48 15.4 -67 16 8 44 11102 13 47 21.2 -63 33 52 13 50 56.8 -63 48 43 42 11103 13 56 17.5 -52 39 50 13 59 34.4 -52 54 22 45 23104 13 57 32.0 -59 12 34 14 1 1.7 -59 27 3 46 23 *
105 14 27 33.1 -51 12 60 14 30 57.3 -51 26 17 44 22106 14 36 27.0 -63 7 53 14 40 25.1 -63 20 45 42 12107 14 44 29.3 -61 39 33 14 48 25.6 -61 52 2 42 i1 *108 14 48 11.4 -60 46 15 14 52 6.1 -60 58 33 44 22109 15 0 41.5 -54 26 44 15 4 22.2 -54 38 25 43 12110 15 4 45.3 -47 57 16 15 8 13.0 -48 8 44 42 11 RAFGL 4211111 15 15 50.2 -51 4 27 15 19 26.9 -51 15 19 04 21
112 15 16 28.1 -55 28 15 15 20 15.9 -55 39 5 43 13113 16 4 15.7 -48 4 11 16 7 54.9 -48 12 9 42 11114 16 8 43.2 -46 47 13 16 12 20.1 -46 54 54 44 12115 16 13 29.4 -47 52 22 16 17 9.5 -47 59 44 43 1111 6 16 19 0.7 -46 5 7 16 22 37.5 -46 12 7 44 22117 16 25 54.6 -53 43 7 16 29 52.2 -53 49 39 42 12 X1629-5381.8 16 31 16.9 - 3 11 20 16 33 54.1 - 3 17 33 46 23
43

666 LITTLE-MARENIN ETAL.: NEW CARBON STARS 666
TABLE 1. (continued)
NO. RA (1900) DEC RA (1950) DEC LRS QUAL ASSOC. NOTE(1) (2) (3) (4) (5) (6) (7) (8) (9)
119 16 50 9.6 -46 28 16 16 53 50.6 -46 33 9 45 22120 16 51 53.0 -44 51 40 16 55 30.5 -44 56 26 44 13121 16 52 20.6 -50 34 47 16 56 12.3 -50 39 :3 43 1212z 16 54 e4.o -43 33 43 16 57 59.4 -43 38 18 49 33123 17 1 37.2 -28 44 7 17 4 46.4 -28 48 13 42 12124 17 4 43.9 -32 39 37 17 7 59.3 -32 43 29 42 11 V463 SCO125 17 3 0.7 -65 50 37 17 7 59.3 -65 54 33 43 12126 17 9 38.1 -39 3 57 17 13 4.8 -39 7 28 44 22127 17 11 43.2 -49 14 11 17 15 32.8 -49 17 32 43 12128 17 18 18.4 -39 13 48 17 21 45.8 -39 16 42 42 11129 17 19 13.6 -23 25 18 17 22 15.8 -23 28 9 42 12130 17 55 16.3 -17 44 6 17 58 11.3 -17 44 20 44 11131 18 6 30.5 -22 29 45 18 9 31.8 -22 29 10 47 23132 18 7 14.6 -14 21 17 18 10 5.3 -14 20 39 43 12 X1809-143133 18 22 5.9 - 8 41 1 18 24 49.7 - 8 39 19 43 12134 18 24 9.0 -12 58 54 18 26 57.9 -12 57 2 43 12135 18 23 52.1 -47 19 40 18 27 37.7 -47 17 48 44 11136 18 39 50.8 +11 44 10 18 42 10.8 +11 47 8 44 11137 18 39 59.9 + 3 43 26 18 42 29.2 + 3 46 25 44 12138 18 40 28.4 - 0 35 28 18 43 2.7 - 0 32 26 45 13139 18 49 27.4 - 2 25 29 18 52 3.8 - 2 21 49 46 23140 19 8 32.9 +11 50 2 19 10 53.1 +11 55 2 44 12141 19 26 44.8 +19 25 34 19 28 56.5 +19 31 49 42 12142 19 32 18.6 +12 3 14 19 34 39.1 +12 9 52 43 12143 19 33 25.3 + 9 10 33 19 35 49.0 + 9 17 15 42 21144 19 40 0.7 +32 15 4 19 41 56.1 +32 22 11 44 12145 19 43 8.6 + 9 13 19 19 45 32.4 + 9 20 40 43 12 RAFGL 4253146 19 43 35.2 +23 39 36 19 45 42.5 +23 46 58 43 12147 19 50 14.8 +24 6 37 19 52 21.9 +24 14 25 43 13148 19 50 14.5 +21 22 49 19 52 24.9 +21 30 37 43 13149 19 51 37.8 +22 5 4 19 53 47.5 +22 12 57 44 11 RAFGL 2474150 19 53 16.2 +31 34 18 19 55 13.7 +31 42 17 42 12151 20 2 28.3 +35 0 5 20 4 21.7 +35 8 39 45 22152 20 6 15.0 +32 19 34 20 8 12.6 +32 28 22 42 12153 20 8 22.8 +41 14 52 20 10 6.8 +41 23 48 44 22154 20 8 26.8 +33 30 48 20 10 23.0 +33 39 44 47 33155 20 18 25.9 +29 4 28 20 20 29.0 +29 14 1 43 12156 20 26 17.4 +35 54 31 20 28 12.2 +36 4 31 45 22157 20 30 21.9 +31 43 0 20 32 22.8 +31 53 15 43 23158 20 31 28.6 +46 10 58 20 33 7.3 +46 21 16 42 12 MRSL 084+03/1159 20 41 36.8 +38 14 31 20 43 30.4 +38 25 24 42 11160 20 51 53.9 +55 42 41 20 53 15.8 +55 54 6 42 11161 20 53 43.8 +63 54 18 20 54 38.1 +64 5 48 44 13162 20 54 12.0 +18 45 44 20 56 29.2 +18 57 18 45 13163 20 57 40.5 +38 21 45 20 59 36.4 +38 33 29 42 22164 20 58 40.6 +47 49 16 21 0 21.8 +48 1 3 44 11 LDN 0962165 20 58 57.5 +47 8 24 21 0 40.0 +47 20 12 43 12166 21 20 40.9 +51 1 13 21 22 21.7 +51 14 5 42 12167 21 30 49.7 +55 24 36 21 32 24.7 +55 37 55 42 12 DO 39779168 21 35 24.8 +45 27 19 21 37 18.5 +45 40 51 43 11169 21 40 52.4 +58 8 12 21 42 24.7 +58 21 57 44 13170 21 43 6.6 +49 36 17 21 44 56.2 +49 50 8 42 11171 22 33 31.0 +58 56 7 22 35 24.0 +59 11 40 44 12 LDN 1198172 23 15 16.7 +59 25 29 23 17 28.8 +59 41 53 44 12173 23 15 27.5 +67 53 50 23 17 29.9 +68 10 14 44 22174 23 25 35.9 +53 20 2 23 27 56.5 +53 36 34 43 12175 23 46 42.2 +62 27 16 23 49 9.1 +62 43 57 43 11 EMIS 1+62 36176 23 46 55.1 +62 14 9 23 49 22.1 +62 30 50 44 23 DO 43734
Notes to TABLE I4 R.AFGL 248=DO 16793 (not M4; Price and Murdock 1983)
27 independently confirmed as C by C.B. Stephenson (CBS hereafter)32 GN OriRAFGL 5192 (not M7)35 V477 Mon=RAFGL 5196=EIC 135 (not M1)45 C by MacConnell, Baker and Landis (unpublished) (MBL hereafter)53 independently confirmed as C by CBS84 C by MBL (unpublished)87 C by-MBL (unpublished)89 11 micron emission characteristic of carbon stars (Hacking et al 1985)94 prob. CCCS 2026 (12:36:53, -64:27.3 (1900))
104 C by MBL (unpublished)107 C by MBL (unpublished)167 DO 39779mLDN 1083
44

667 LI1TLE-MARENIN El AL.: NEW CARBON STARS 667
Notes to TABLE I (continued)
References to the catalogs used for the association with IRAS sources:CCCS =Catalog of Cool Carbon Stars (Stephenson 1973)DO =Dearborn Observatory (Lee et al 1947)EIC =Equatorial Infra.. Catalog (Sweeney e' al 1979)GLOB =Globule List (Wesselius 1979 (unpublished))IRC =Two Micron Sky Survey (Neugebauer and Leighton 1969)LDN =Lynds (1962)MRSL =Marsalkova (1974)RAFGL = Revised Air Force Geophysics Lab (Price and Murdock 1973)
A X = IRAS Small Scale Structure Catalog (1986).
TABLE II. Previously known carbon stars.
'O. RA (19OO) 1EC RA (1950) DEC LRS Q REF ASSOCIATIONS
0 21 55.6 :69 5 37 0 24 47.2 :69 22 14 43 11 5 RAFGL 672 1 5 3.0 .53 11 38 I 8 2.3 .53 27 38 44 12 2 HV Cas=RAFGL 167=ZRC *50030=0O 241073 1 54 34.5 .57 49 4 I 58 0.0 .58 3 40 44 22 7 CCCS 90=EMIS IG 139 (Indsoercly confirmed by CBS)4 2 12 19.1 .28 9 3 2 15 12.5 .20 22 59 43 II 8
5 2 16 46.2 *48 16 16 2 20 2.6 .48 30 I 47 13 7 CCCS 97=DO 2S649G 2 25 43.9 *57 35 29 2 29 21.0 . 57 48 51 42 5 n IAFGL 3417 3 13 44 6 .70 5 23 3 18 38.5 -70 16 20 42 5 5 RAFGL 482
6 3 41 21.3 .44 23 27 3 44 49.2 .44 32 51 42 12 8 RAFGL 51029 3 45 33.6 39 34 45 3 48 53.6 .39 43 54 42 11 2 V414 Per-RAFGL 527-IRC 400700 4 26 16.0 +62 3 42 4 30 46.0 .62 10 11 45 11 10 RAFGL 595-IRC -60144-00 26389'' 4 49 29.7 .44 23 3 4 53 5.9 -44 27 59 42 11 1012 5 34 54.3 - 8 12 26 5 37 18.4 - 8 10 42 42 12 2 RAFGL 796-IRC -10095-SVS 6369 (tndependly ConFirmed by CBS)13 5 34 57.5 :13 45 10 5 37 47.4 -13 46 53 44 12 5 RAFGL 79914 5 35 35.4 "12 14 49 5 38 23.5 :12 16 29 44 13 7 CCCS 381RAFGL 801-IRC *10094SVS 255700 1241I5 5 37 16.8 *32 39 16 5 40 33.? *32 40 48 42 II 5 RAFGL 809.01.05 BARNARD 34
16 5 40 25.5 -43 10 31 5 44 1.7 *43 I1 49 44 11 2 RAFGL 815.IRC .40140-SVS 262917 6 20 15.6 - 9 3 58 6 22 38.6 - 9 5 32 43 II 2 V636 MOnRAFGL 933=IRC -1012219 6 20 42.3 - 9 28 43 6 23 4.8 - 9 30 19 44 21 5 RAFGL 93519 6 25 29.8 +43 21 27 6 29 6.0 -43 19 28 43 II 5 RAFGL 95420 6 31 38.7 - 3 30 29 6 34 16.4 * 3 28 5 43 11 S RAFGL 97121 7 0 32.8 -14 51 55 7 2 49.3 -14 56 21 43 12 5 RAFGL 1062 (confirmed by MOL)22 7 7 43.5 -20 7 21 7 9 53.7 -20 12 17 43 11 5 RAFGL 108523 7 52 36.9 - 0 24 59 7 55 10.0 - 0 32 57 44 23 7 CCCS 96124 9 9 27.9 -24 26 40 9 11 41.0 -24 39 1 42 I1 8 RAFGL 525425 9 42 31.5 -13 44 31 9 45 14.2 *13 30 40 43 11 2 CW LeoRAFGLI381-IRC -10216-X 0945.135
26 16 25 26.0 -44 57 21 1 29 1.1 -45 3 56 45 12 627 17 I 51.6 -24 36 36 17 4 55.0 -24 40 41 42 I1 5 RAFGL 192228 17 36 50.9 -78 8 28 17 44 41.9 -78 9 52 43 I1 7 CCCS 2476 (at 17:36:38.3. -78,07:0 (1900))29 18 I 20.0 - 9 41 52 18 4 5.1 - 9 41 40 44 II 9 FX Ser=RAFGL 2067-IRC -1039630 18 0 52.7 -33 17 II 18 4 10.2 -33 17 0 45 It 431 18 I 40.2 -15 25 46 I8 4 32.3 -15 25 32 45 12 6 LON 0347
32 18 4 55.3 -20 23 17 IS 7 53.8 -20 22 49 43 12 5 RAFCL 208533 18 12 55.3 - 6 54 8 IA 15 37.0 - 6 53 6 45 II 5 RAFGL 211834 18 16 18.6 -27 9 19 18 19 26.4 -27 8 1 43 21 3 RAFGL 213535 18 20 34.8 * 5 42 43 18 23 1.8 . 5 44 18 44 11 5 RAFGL 2150EIC 652
36 10 20 27.0 -22 7 43 18 23 27.7 -22 6 7 45 21 2 V2548 S9=RAFGL 2151=1RC -20462
37 10 21 15.6 - 6 57 33 18 23 57.3 - 6 55 54 43 I 5 PAFGL 2154
38 18 21 56.3 -23 25 13 18 24 1.1 .23 26 53 42 11 5 RAFGL 215539 18 37 29.3 -17 35 22 18 39 42.0 -17 38 10 43 it 2 RAFGL 2232=[RC 20370=SVS 1122540 18 45 8.9 9 23 13 18 47 31.7 * 9 26 34 42 11 5 RAFGL 225941 19 0 47.4 *20 12 59 19 2 57.3 -20 17 26 43 12 5 RAFGL 2318
42 19 14 52.3 - 8 13 20 19 17 35,0 - 8 7 53 43 21 2 RAFGL 2368-IRC -10502-EIC 759-SVS 1191243 19 22 22.3 * 6 52 6 19 24 48.4 + 5 58 3 45 12 5 RAFGL 2392-EIC 76844 19 30 7.6 -27 50 60 19 32 8.8 .27 57 28 43 II 2 V1129 Cyg-RAFGL 2417-IRC .30374-SVS 1216545 19 36 13.0 -33 8 31 19 38 6.8 *33 IS 23 44 12 5 RAFGL 2428
46 19 45 12.4 +29 16 30 19 47 12.4 .29 23 58 49 23 7 CCCS 2806
47 19 57 41,4 .40 38 58 19 59 25.1 .40 47 14 42 It 5 RAFGL 249448 20 5 16.0 -31 8 8 20 7 15.2 .31 16 53 43 It 5 RAFGL 2513
49 20 8 33.2 -39 18 48 20 10 20.5 .39 27 44 45 23 1 Baldone 58
50 20 22 10.0 +69 25 19 20 22 18.2 .69 35 2 44 13 7 CCCS 2903 (indepandly confirmed by Dean (tesils) ano CBS)51 20 24 37.9 .42 35 11 20 26 22.0 42 45 5 49 33 7 CCCS 2905 (at 20,24.9. +42:30 (1900))52 20 32 42.6 +53 28 32 20 34 5.3 -53 38 54 42 II 5 RAFOL 261353 20 54 51.4 +27 3 19 20 57 .4 +27 14 55 42 11 5 RAFGL 268654 21 1 11.9 -52 57 9 21 2 43,3 +53 9 4 44 12 5 RAFGL 2699 (indpendendly confirmed by CBS)
55 21 14 36.7 -55 34 23 21 16 5.9 -55 46 57 43 12 7 CCCS 3017 (tndependendly confirmed by CBS)56 21 25 35.1 *69 47 7 21 26 15.1 .70 0 11 45 12 2 AX CepzRAFGL 2768-IRC .70170-D0 39655 (conflrmed by CBS)57 21 36 24.0 -45 0 6 21 38 18.5 -45 13 40 44 It 2 v644 Cy9gCCCS 3054-IRC .5038858 21 47 13.7 -52 47 22 21 48 59.2 .53 1 23 42 II 859 22 10 44.8 -55 53 25 22 12 33.3 +56 8 17 43 13 7 CCCS 312150 22 14 26.2 -43 16 38 22 16 32.0 .43 31 39 42 11 7 CCCS 3125-RAFGL 288161 22 22 20.8 .59 50 17 22 24 7.1 +60 5 31 41 11 5 RAFGL 290162 22 41 12.3 .74 16 8 22 42 25.9 -74 31 50 45 12 7 CCCS 3157-RAFGL 2949.00 4194163 22 50 2.9 *65 44 57 22 51 52.3 -66 0 54 44 I 5 RAFGL 298564 22 56 35.1 *63 46 29 22 59 32.0 .64 2 34 43 11 5 RAFGL 301165 23 29 35.9 .42 59 53 23 32 1.6 .43 16 27 42 11 10 RAFGL 3116-IRC +40540 (not MB)
References: 6. MecConnell (1979)1 AlkSne end ozollna (1974) 7. Stephenson (1973)2 B4Oel1en (1980) 8. Zuckerman and Dyck (1986s)3. Ofguchl. Cleussen, and Goldsmith (1986) 9. Zuckerman end Oyck (1986b)4. Fuemaeyor (1981) 10. 2uckerman. Dyck end Cleussen5. Al'aman. Gllett. end Joyce (19811 (1986)
45

668 LITTLE-MARENIN ETAL.: NEW CARBON STARS 668
and RAFGL 2102. These two stars are classified as C stars We would like to thank P. LeVan for helpful and stimulat-by Zuckcrman anid Dyck ( 1986a, b) based on their location ing discussions. This work has been supported by a UniNversi-in an IRAS color-color plot and the presence of a strong ty Resident Research Fellowship from the AFOSR to theHCN line in the spectrum of RAFGL 5250. The LRS of Air Force Geophysics Laboratory. One of us (M.ER.) wasRAFGL 5250 shows an unusual emission or absorption fea- supported by Wellesley College as a Dana Foundation Sum-ture which is neither due to SiC nor to silicate, and RAFGL rner Research Fellow.210? may show the 10,pm feature partly in self-absorption.
REFERENCES
Alksne, Z., and Olina, V. (1976). Investigations of the Sun and Red Stars, Lynds, 13.T. (1960). Astrophvs. J. Suppl. 7, 1.edited by A. Balklays (Zinatne, Riga), Vol. 4, p. 5. MacConnell, D. J. (1982). Astron. Asirophys. Suppl. 38, 335.
Beichinan, C.A., Neugebauer, G., Habing, H. J., Clegg, P. E., and Chester, Marsalkova, P1. ( 1974). Astrophys. Space Sci. 27, 3.T,.T., editors (1985). IRAS Catalog and References, Explanatory Supple- Neugebauer, G., and Leighton. R. B. (1969). Two-5'1.'ron Sk'- Surtey.,nert (U.S. GPO, Washington, DC). NASA SP-3047 (NASA, Washington, DC)
Bidelman, W. P. (1980). Pub!. Warner and Swasey Obs. 2, No. 6. Price. S. D., and Murdock, T. L. ( 1983). The Revised AFGL Infrared SkyDeguchi, S., Claussen, M. J., and Goldsmith, P. F. (1986). Ascrophys. J. Survey Catalog, AFGL-TR-0208 (Air Force Geophysics Laborator.y,
303. 810. Hanscoms AFB, MA).Fuenmayor, F. J. (1981). Rev. Mex. Astron. Astrofis. 6, 83. Stephenson, C. B. (1973). PubI. WVarner and Swasey Ohs. 1, No. 4.Hacking, P'., el a/. (1985). Pubi. Asiron. Soc. Puac. 97, 616. Swceney, L. H., Heinslicirner, T. F., Yate, r. F., Nlaran, S. P., Lesh, J. R.Helou, G., and Walker, D., preparers (1986). IRAS Small Scale Structure and Nagy, T. A. (1978). Interim Equarorial Infrared Catalogue, TR-
Catalog (U.S. GPO, Washington, DC). 0078(3409-20)-l (The Aeiospace Corporation, Los Angeles).Kleinman, S. G., Gillett, F. C., and Joyce, R. R. (1981). Annu. Rev. As- Wackcrling, L. R. ( 1970). Mern. R. Astron. Soc. 73, 153.
t im. A..ropliy.. 19, 411. WcVssetiii. It. 11, (09). Unpip::blislicd.
Lee. 0. J., Gore, G. D., and Bartlett, T. J1. (1947). Ann. Dearborn Obs. V. Zuckerman, B3., and Dyck, H. M, ( 1986). Astrophys. 3. 304, 394.part IC. Zuckerman, 13., and Dyck, H. M. (1986). Astrophys. J. 311, 345.
Little, S.I., and Little-Marenin, 1. R. (1986). Lect. Not. in Phays. 254, 423. Zuckerman, B3., Dyck, H. MI., and Claussen, M. J. (1986). Astrophys. 3.Litte-Marenin, 1. R. (1986). Astrophys. J. Lett. 307, LI5. 304, 401.Little-Marenin, 1. R., and Wilton, C. ( 1986). Lect. Not. Phys. 254, 420.
46

Appendix E
A Search for Technetium (Tc II) in Barium Stars
47

The U.S. Government Is authorized to reproduce and sell this report.Perrplssion for further reproduction by others must be obtained fromthe cooyrlght owner.
THE ASTRONOMICAL JOURNAL VOLUME 93, NUMBER 6 JUNE i987
A SEARCH FOR TECHNETIUM (Tc i) IN BARIUM STARS
IRENE R. LiTTLE-MARENINu)AFGL/OPC, Hanscom AFB, Massachusetts 01731
andWhitin Obsevatory, Wellesley College, Wellesley, Massachusetts 02181
STEPHEN J. LITTLEDepartment of Natural Sciences, Bentley College, Waltham, Massachusetts 02754
Received 14 January 1987; revised 3 March 1987
ABSTRACT
We searched without success for the lines of Tc ii at 2647.02, 2610.00 and 2543.24 A in JUE spectra ofthe barium stars HR 5058, o Vir, and " Cap. The lack of Tc ii implies that the observed s-processenhancements were produced more than half a million years ago and supports the suggestion that thespectral peculiarities of barium stars are probably related to the binary nature of the stars.
I. INTRODUCTION percent of duplicity (McClure 1985). Hence it is assumedthat the varying amount of s-process enhancement of all
Barium stars are, in general, old disk giants or bright gi- these stars is related to their binary nature, even though theants that have enhanced spectral lines of the s-process ele- mechanism for producing the excesses is not agreed upon.ments Ba ii and Sr ii, as well as enhanced features of CH, A number of scenarios have been suggested to explain theCN, and sometimes C2. On the strength of the Ba II line at abundance anomalies (McClure 1984; Bbhm-Vitense, Ne-4554 A, astronomers divide the barium stars into classical mec and Profitt 1984; Lambert 1985). The most common(Ba2-Ba5) and mild (Bal) barium stars. For recent re- scenario assumes that mass was transferred from the pres-views, see McClure (1984) and Lambert (1985). Recent ent-day low-mass companion (white dwarf) when it was anabundance analyses of barium stars (Tomkin and Lambert AGB star. Lambert (1985) has pointed out that the trend1986; Lambert 1985; Smith and Lambert 1984; Smith 1984; from mild to classical barium star can be explained by as-Pinsonneault, Sneden, and Lambert 1984; Kovacs 1983; suming that an increasing amount of material from a "typi-Tomkin and Lambert 1983; Sneden, Lambert, and Pila- cal" cool carbon star is mixed with the atmosphere of a nor-chowski 1981; Smith, Sneden, and Pilachowski 1980) have mal G and K giant. Cool carbon stars are produced from Mshown that for classical barium stars the enhancements of s- stars while on the AGB (Iben and Renzini 1983) and haveprocess elements (Y, Zr, Ba, La, etc.) are typically about 4- C/O ratios usually between 1.05 and 1.1 (Lambert et al.10 times solar, with a C/O ratio ranging from 0.6 to 1.02. In 1986). However, the assumption that barium stars are pro-mild barium stars, on the other hand, s-process enhance- duced by mass transfer does not account for the absence ofments are typically only about 2 times solar, and their C/O the lithium line in most mild barium stars and its presence inratios are similar to those of normal G and K giants (about classical barium stars with strength similar to that found0.3). Our understanding of stellar evolution is such that the among K giants (Pinsonneault, Sneden, and Lambertmixing of s-processed material with surface layers is only 1985).expected to occur during the helium shell flashing phase It has also been suggested that the companion is and/orwhile the stars are on the asymptotic giant branch (AGB). has produced mixing in the barium star due to tidal interac-However, barium stars are too hot and have too low a lumi- tions. If the s-process enhancements are indigenous to thenosity to be at the AGB stage of evolution, barium star and are still increasing, then we might detect the
A clue to our understanding of the observed abundance signature of this process in the outer layers. Nature has pro-anomalies comes from the discovery that all classical and vided us with a unique tracer of recent s-processing in theprobably all mild barium stars are members of a binary sys- isotopes of technetium (Tc). All its isotopes are radioactive,tem (McClure, Fletcher, and Nemec 1980; McClure 1983; with "9Tc, the isotope produced in the s-process, having aBohm-Vitense, Nemec, and Proffitt 1984; McClure 1985). halflife of about 2X 10' yr below 10' K. However, at theOrbital solutions give separations that are typically about 2 temperatures found in the intershell region of high massAU, with low-mass secondaries. Several low-mass compan- (> AGB stars (T> 2X 10' K), the halflife falls toions (white dwarfs) have been observed directly with 1UE about 40 yr (Cosner and Truran 1981; Schatz 1983). The(Bohm-Vitense 1980; Schindler et al. 1983; Bohm-Vitense, mere detection of To is enough to establish unambiguouslyNemec, and Proffitt 1984; Bohm-Vitense and Johnson those stars in which s-processing and mixing has occurred1985). Radial-velocity measurements of other late-type gi- recently. The detection of neutral To in S, some C, MS, andants with peculiar abundances, such as R, CN, CH, subgiant M long-period variables has shown that s-processing andCH and semibarium stars, appear to show a positive correla- mixing does indeed occur (see Little-Marenin and Littletion between the amount of s-process enhancement and the 1978; and Little etal. 1987 for a complete list of references).
In order to distinguish between continuing (or recently"Research Fellow, Joint Institute for Laboratory Astrophysics (1983- stopped) s-processing and some other mechanism for en.
1984), IUE Guest O' Aerver, University Resident Research Fellow, AFOL hancing the abundances, we have analyzed IUE spectra of(1986-1987). 49 three different kinds of barium stars: (a) the classical bari-
1539 Astron. J. 93 (6), June 1987 0004-6256/87/061539.03$00.90 @ 1987 Am. Astron. Soc. 1539

1540 I. R. LITTLE-MARENIN AND S. J. LITTLE: Tc IN BARIUM STARS 1540
um star HR 5058 (HD 116713; KO. 5 III-Ba3) with s-pro- 10"cess enhancements of about 4 and C/O = 0.74 (Sneden, r HR 5058(K0.5M-8a3)LWP 3730
Smith, and Pilachowski 1981); (b) the mild barium star o ., P Vr = 67 kn/seVir (HR 4608 HD 104979; G8 IIIaCN-1BalCH1) with E -C/O = 0.34, typical of G and K giants (Sneden, Smith, and 264702Pilachowski 1981), but with an s-process enhancement of !2 Vabout 5 (Tomkin and Lambert 1986), similar to HR 5058; '0 4 Zr iland (c) the classical supergiant barium star " Cap (FIR x 2643.408204=HD 204075; 04 Ib (KO-Ba3)) with C/O = 1.02 x FeI,TiI(the largest value determined for a barium star) and s-pro- "j MgI 2646.206cess enhancements of about 6 (Smith, Sneden, and Pila- 2644 264.6 2648 2650chowski 1980). " Cap is the most luminous and hence the X (A)most massive (3-5 ,..4% ) of the known barium stars.
FIG. I. The 2647 A region of HR 5058 (LWP 3730). Several photo-II. OBSERVATIONS AND REDUCTIONS spheric absorption lines are indicated, as well as the position of the
Tc in line at 2647.02 A. The radial velocity for the star is + 67 km/s.A number of searches for Tc I and Tc n lines have been
made in the visible wavelength region, primarily by Warner(1965), but also by Burbidge and Burbidge (1957), Tech - 24 + 10km/s for o Vir and HR 5058, respectively, using(1971), Boesgaard and Fesen (1974), and Smith (1984) thelUEabsolute-wavelength calibration. These values agreewith negative results. However, To, with an ionization po- well with the published values of + 67 km/s and - 30km/stential of 7.3 eV, is primarily in its ionized form in barium (Bright Star Catalog, Hofit and Jaschck 1982). We werestars (5200 > T> 4500 and 3.0 > log g > 1.5), and its stron- unable to identify any Ton lines in any of the spectra, andgest lines at 2647.02, 2610.00, and 2543.24 A are not observ- estimate the equivalent widths of the 2647 Tc u line to beable with ground-based equipment. We obtained high-dis- <30 mh ( Cap), <25 m (HR 5058), and < 20 mA (opersion LWP spectra of HR 5058 and o Vir with JUE Vir).TheabsenceoftheTc x lines in the spectrum of " Cap(International Ultraviolet Explorer satellite) on 1984 July 6 confirms our earlier analysis based on the LWR 4602 andand 7. The LWP camera covers the 2000-3000 A region with LWR 4618 spectra (Little-Marenin et al. 1980). Evena resolution of about 0.2 A. For details of the JUE satellite, though all three Tc ii lines lie close to other photosphericsee Boggessetal (1978). Wealso analyzed five LWR spec- absorption lines (Fei (6): 2647.558 A; MnIni (19):tra of " Cap from the IUE archives. The LWR and LWP 2610.202 A and Feii (204) 2609.859 A; Fein (159):cameras have very similar spectral characteristics but differ- 2543.382 A), the Tc n lines should be displaced enough to beent intensity transfer functions. The observational data are detectable. Figure I shows the 2647 , region of the spectrumsummarized in Table I. The spectra were calibrated in abso- of HR 5058. The positions and wavelengths of several photo-lute-flux units at Earth using the standard IUE calibration spheric lines are indicated, as well as the predicted positionfactors and were analyzed at the UE Regional Data Analy- for the Tc 112647.02 line. The lack of evidence for the twosis Facility (RDAF) at the University of Colarado. Since other Tc n lines at 2610.00 and 2543.24 . is very similar.the absolute-wavelength calibration for the earlier (4" Cap)spectra are uncertain due to possible thermal flexing of the Ill. DISCUSSIONspectrograph (Leckrone 1980; Turnrose, Thompson, and The fact that technetium is not observed in two classicalBohlin 1982), we measured the wavelength of all the Tc I barium stars and one mild one implies that the episode thatlines relative to other photospheric absorption lines. How- produced the enhancement of the other s-process elementsever, we obtained radial velocities of + 64 ± 10 km/s and occurred at least halfa million years ago. Smith and Lambert
TABLE I. UE observational data.
Image No. Star Spectral Class Year/Day Expos Vr Comments(min)
LWP 3727 o Vir C8111aCN-1Ba1CHI1 1984/189 133 -30 ux < 2500 A
LWP 3730 IR 5058 KO.5III-Ba3 1984/190 420 +67 ux < 2600 A
LWR 4602 C Cap G4b (KO-Ba3) 1979/146 120 + 3 ox > 2600 A
LWR 4604 1979/146 40
LWR 4618 1979/148 40
LWR 6282 1979/340 30
LWR 7559 .. 1980/112 30
50 ux - underexposed; ox - overexposed

1541 1. R. LITTLE-MARENIN AND S. J. LITTLE: Tc IN1 BARIUM STARS 1541
(1984) reached a similar conclusion for ' Cap based on the We would like to thank the staff of' the MUE Observatoryabundance of 93Nb, which is produced from the decay or and thle staff (especially T. Armitage) of' the RDAF at the93Zr after the s-process ceased. The abundance of Nb implies University of Colorado, which is operated under grant NAGthat the s-process stopped more than 3 X 10⁶ yr ago. Hence 5-26409, for their greatly appreciated help. I. R.L.-M. wouldthe observed abundance anomalies were not produced re- like to thank J. Linsky and the Joint Institute of Laboratorycently in either the supergiant, classical, or mild barium Astrophysics for their support and hospitality during herstars. The lack of Tc iand Tc ii lines lends support to the year as a Research Fellow. This work is in part supported bysuggestion that all barium stars (supergiant, classical, and Grant NAG 5-438 and by a University Resident R~esearchmild) are produced by the same mechanism, such as mass Fellowship from the AFOSR to the Air Force Geophysicstransfer from the companion when it was an AGB star or Laboratory.some other mechanism which produced the enhancementsin the distant past.
REFERENCES
Boesgaard, A. M. and Fesen, R. A. ( 1974). Pub!. Astron. Soc. Pac. 86, 76. McClure, R. D. (1984). Publ. Astron. Soc. Pac. 96, 117.Boggess, A., et al. ( 1978). Nature 275, 7. McClure, R. D. (1985). In Cool Stars with Excesses of Heavy E1lments,Bbhm-Vitense, E. (1980). Astrophys. J. Lett. 239, L79. edited by M. Jaschek and P. C. Keenan (Reidel, Dordrecht), p). 2 15.Ildhmr-Vitense, E., Nemec J., and Profitt, C. (1994). Astrophys. J1. 278, McClure, R. D., Fletcher, .1. M., and Nemec. J1. M. (1980). Astrophys. J..
726. Lett. 238, L35.Bohm-Vitense, E., and Johnson, H. R. ( 1985). Astrophys. J. 293, 288. Pinsonneault, M. H., Sneden, C., and Smith, V. V. 11984). Publ. Astron.
Burbidge, E. M., and Burbidge, G. R. (1957). Astrophys. J. 126, 357. Soc. Pac. 96, 239.Cosner, K., and Truran, W. (1981). Astrophys. Space Sci. 78, 85. Schatz, G. ( 1983). Astron. Astrophys. 122, 327.Hoffleit, D., znd Jaschek, C. (1982). The Bright Star Catalog (Yale Univer- Schindler, M., Stencel, R. E., lBasri, E., and Helfand, D. J. (1981). As-
sity, New Haven). trophys. J. 263, 269.lben, I., airl Renzini, A. ( 1983). Annu. Rev. Astron. Astrophys. 21, 27 1. Smith, V. V. (1984). Astron. Astrophys. 132, 326.Kovacs, N. (i083). Astron. Astrophys. 124, 63. Smith, V. V., and Lambert, D. L. (1984). PubI. Astron. Soc. Pac. 96, 326.Lambert, D. L. (1985). In Cool Stars with Excesses of Heavy Elements, Smith, V. V., Sneden, C., and Pilachowski, C. A. (1980). Publ. Astron. Soc.
edited by M. Jaschek and P. C. Keenan (Reidel, Dordrecht), p. 191. Pac. 92, 809.Lambert, D. L., Gustaf'sson, B., Eriksson, K., and Hinkle, K. H. (1986). Sneden, C., Smith, V. V., and Pilachowski, C. A. (1981). Astrophys. J. 247.
Astrophys. 1. Suppl. 62, 373. 1052.Leckrone, D. S. (1980). NASA IUE News!. No. 10, p. 25. Tech, J. (1971). Natl. B~ur. Stand. Monogr. No. 119.Little,S. L., Little-Marenin, L, Hagen, W.,and Lewis, L. (1986). Bull. Am. Tomkin, ., and Lambert, D. L. (1983). Astrophys. J. 273, 722.
Astron. Soc. 18, 669. Tomkin, 3., and Lambert, D. L. (1986). Astrophys. J. 311, 819.Little-Marenin, 1. R., and Little, S.3., (1978). Astron. J. 84, 1374. Tiirnrose, B. E., Thompson, R., and Bohlin, R. (1982). NASA IUE Newsl.Little-Marenin, 1. R., Little, S ., Wing, R. F., Carpenter, K. G., and Wal- No. 18, p. 2 1.
lerstein, G. (1980). Bull. Am. Astron. Soc. 12, 827. Warner, B3. (1985). Mon. Not. R. Astron. Soc. 129, 263.McClure, R. D. (1983). Astrophys. J1. 268, 264.
51

Appendix F
Additional Late-Type Stars with Technetium
53
u I ! ! ! I I

.... ,.,. ,~,t auti orlZed to reproduce and sell this report.Permission for further reproduction by others must be obtained fromthe copyright owner.
THE ASTRONOMICAL JOURNAL VOLUME 94, NUMBER 4 OCTOBER 1987
ADDITIONAL LATE-TYPE STARS WITH TECHNETIUM
STEPHEN J. LITI'LE" )
Department of Natural Sciences, Bentley College, Waltham, Massachusetts 02254
IRENE R. LITTLE-MARENIN"'b )
AFGL/OPC, Hanscom AFB, Massachusetts 01731and
Whitin Observatory, Wellesley College, Wellesley, Massachusetts 02181
WENDY HAGEN BAUERa). b )
Whitin Observatory, Wellesley College, Wellesley, Massachusetts 02181Received 22 May 1987; revised 29 June 1987
ABSTRACT
We present the results of a survey of 279 late-type giants and supergiants for the spectral lines of theradioactive element technetium (Te i, at 4297, 4262, and 4238 X. We reach the following conclusions:(a) the presence of Tc correlates very strongly with the existence of light variability-nonvariable, low-amplitude semiregular and irregular M stars and M supergiants do not show Tc, whereas M star Miravariables tend to show Tc if P> 300 days; (b) evolutionary MS stars show Tc and spectroscopic MSstars do not show Tc; (c) single S stars show Tc; (d) SC stars show Tc; (e) about 75% of the C starsshow Tc; (f) Ba it stars do not show Tc. Our findings are compatible with the predictions from stellarevolution theory that Tc, along with other s-process elements and carbon, is mixed with the surfacematerials after helium shell flashing episodes even though we observe Tc in stars not predicted toexperience the third dredge-up. The presence of Tc is a very sensitive indicator of the third dredge-upand can be detected in the spectrum before enhancements of other s-process elements are measurable.
I. INTRODUCTION affected. It has also been suggested that Tc may be produced
Merrill (1952) first identified the resonance lines of the by surface nuclear reactions, most recently by Akopyan and
radioactive element technetium (Tc) in several S stars at Melik-Alaverdyan (1983), but there is little observational
4297, 4262, and 4238 A. Since then, Tc has been discovered and theoretical support for this process.4297 422, nd 438/.. inc the, T ha bee dicovred Stars experiencing the third dredge-up should show anin other evolved stars such as cool carbon stars (N stars) incre ing t fc r d of sosd elemen(Peery 197 1), and MS and M stars (Little-Marenin and Lit- in .creasing amount of carbon and of s-processed elements(eer 197), and Merences ahin , s tar e reno and Lr with successive helium flashes and should evolve from M totle 1979 and references therein, hereafter referred to as Paper C stars. The location of stars on the AGB of Magellanic
I). Cloud intermediate-age globular clusters bears out the pre-The presence of Tc in the atmospheres oflate-type stars is diction that the M-. MS-- S-. (SC) - C stars form, unam-
an unambiguous tracer ofrecents-process nuclear reactions biguously, an evolutionary sequence of stars evolving toin stellar interiors. All the isotopes of Tc are radioactive, and higher luminosities up the AGB (Wood 1985). The SC starsthe isotope 99Tc has a halflife of about 2X 10⁵ yr. In stars, are enclosed in parentheses in order to indicate that not all99Tc is assumed to be produced by the s-process and mixed to stars may go through the SC phase.the surface during the late stages of stellar evolution in Abundance analyses of galactic AGB stars also show anasymptotic giant-branch (AGB) stars (see Iben and Ren- increase in the C/O ratio and s-process enhancement alongzini 1983). Theoretical evolutionary models predict that the the M- C sequence. M giants show only marginal, if any, s-production and mixing of s-process elements and helium- process enhancements (Smith and Lambert 1985); MS starsburning products (primarily 12C) into the outer envelope show enhancements from about a factor of 2 to about 5occurs during helium shell flashing at the end of the AGB (Smith and Lambert 1985, 1986); four S stars are enhancedevolution of stars (a process called the third dredge-up). At by a factor of 3-8 (Smith and Wallerstein 1983; Smith andthe temperatures that occur in the intershell region of these Lambert 1986); in four SC stars Zr and Nb are enhanced bystars (about 2-3 X 10' K), it has been found that the halflife about a factor of 5-10 with Mo and Ru showing enhance-of 9 Tc decreases to <40 yr (Schatz 1983; Cosner and mentsofabout50-100(Dominyand Wallerstein 1983);andTruran 1981). However, Mathews etal. (1986) have shown the cool C stars show enhancements in the 10-100 rangethat the shorter decay rates for Tc are almost completely (Utsumi 1985). The C/O ratio increases from about 0.4 incompensated by the larger neutron fluxes that occur at the M stars, to -0.64 in MS stars (Smith and Lambert 1985,higher temperatures, leaving the Tc abundances almost un- 1986), to -0.8 in S stars (if the C/O ratio is corrected for a
likely overestimate in the 0 abundance) (Smith and Lam-bei t 1980), to valucs very closc to unity in SC stars (Kccnan
VisitingAstronomer, KittPeak National Observatory, NationalOptical and Boeshaar 1980; Dominy, Wallerstein, and SuntzeffAstronomy Observatories, which is operated by the Association of Utiver- IOR . : t 1 to i t, (- cl;'r: s, jigs rrL,, ni.,.it 1 "1 io I-twi q r,r | ¢¢l rI P iie l i ,, ,t A . . .... . ,, I . ......I , 1" $ , ;01, It,- t 1hIt;,,
1, '., ' I it l.h %%,llt v ll c111 ;1 1: 1 11 ). , o l I t%lilt N l [linVIllp-. ( ' ( . I I). ti [ 1 1
" isi iiig Astronomer, Cello "o l , ,lr-Aicricnii Observatory, Na- ber t et al. 1986). Ti carly I slars apparicnily do Iot belottgtional Optical Astronomy Oiicrvatorics, which i%
, owratctl by ihc A..'ci- to I Iis SC(liiCiIce. They are iiot Ittitt itotis c ottlgh o be oil italioti of Universities for tlscarch in Astroiomy, Ic.. ,,,oicr cmtlact wilt AG Biand show ino.s-process entiialctises ( Doniny 1984).the National Science Foundation. Thcir carbon enrichment, in order to produce C/O > 1,
55981 Astron. 1. 94 (4k, October 1987 0004-6256/87/04098l-15S00.90 © 1987 Am. Astron. Soc. 981

982 LITTLE EJ'AL.: STARS WITI TECIINETIUM ),I
must have been produced during a different evolutionary warmer NI stars we attributed a 4297.06 X feature to Cr 1phase, possibly the He core flash (Dominy 1984). (64) after checking for the other lines of the multiplet when
In order to define more closely the onset and continuation we observed no corresponding features at the positions of theofthes-process and dredge-up phase in stars on the AGB, we two weaker Tc lines. Despite the blending problems, wehave conducted a systematic search of evolved stars, primar- found the 4297 line to be our best indicator of Tc since theily variable M stars, for the presence of the neutral Tc lines. Cr 1 (64) line could be eliminated as a contributor relativelyOur survey contains 227 stars, which are listed in Table I easily and the 4262 line is badly blended in the cooler stars.along with 52 stars analyzed by other investigators. Table 1 For a complete list of blending agents that affect the "c lines,includes the stars published in Paper I. see Table III of Paper I.
Our analysis proceeded by fitting a dispersion solutionIt. OBSERVATIONS AND REDUCTIONS through up to 30 photospheric absorption lines in the 4150-
The spectra for the present study were obtained over the 4350 A region. This allowed us to calculate the wavelengthlast decade, primarily with the 0.9 m feed telescope to the of any feature with a typical accuracy of -- 0,05 A. We thencoud6 spectrograph of the 2.1 m telescope at Kitt Peak Na- calculated the line centers of features near the Tc lines,tional Observatory (KPNO). A few 4 m echelle spectra checked all possible blending contributors, checked the rela-were also obtained at KPNO and CTIO (Cerro Tololo Inter- tive intensities of all three Tc lines, and assigned a likelihoodAmerican Observatory) and from the KPNO archives. The for the presence of Tc in the spectrum, which is listed incharacteristics of the echelle spectra are discussed in greater column 12 of Table I. The definitions are the same as indetail by Hagen, Stencel, and Dickinson (1983). At the cou- Paper I, as follows.d& feed, we have used since 1981 camera 5 with a cooled ( I ) yes. All three Tc lines are strong, in the correct inten-RCA two-stage S-20 image tube and grating C with the small sity ratio, and a negligible shift in the central wavelength ofcollimator. This combination gives a dispersion of about 8 the features is observed.,/mm in the blue. Spectra ofstars brighter than -9 mag in (2) probable (abbreviated as prob). The 4297 Tc line is
the blue were obtained on IIIa-J plates (baked in forming blended with an approximately equally strong feature ofgas) or, if fainter than -9 mag, on baked IIa-O plates. The Sin 1, Ce it (and Zr u) so that the central wavelength of thestars we observed were selected to be brighter than -9.5 observed feature is around 4296.90 ± 0.1 A. The 4262 andmag in the blue, which meant that, in general, variable stars 4238 lines are also blended and/or too weak to make thewere observed near maximum light. The strongest lines of identification definite. In a few cases, the observed centralTc Ilie in the4200-4300A region and are difficult to observe wavelength is around 4296.7 A, but the observed feature issince these red stars emit relatively little light in the blue. distinctly asymmetric with a contributor estimated to be atSince typical exposure times are 2-4 hr, we found it imprac- -4297.06. These cases are listed in the Remarks (columntical to try to obtain higher-dispersion spectra with the cou- 14).d6 feed. The effective resolution for camera 5 is about 0.2 A. (3) possible (poss). The Tc lines are weak and badlyfor the IIIa-J plates and 0.25 A for the IIa-O plates. The blended, but features are located near all three Te lines. Inspectra obtained before 1978 have been described in Paper I. our judgment the evidence favors the presence of Tc.We traced the spectra using the PDS microdensitometer at (4) doubtful (dbfl). Any lines present at the Tc i posi-KPNO, reduced them with a standard H-D curve derived tions are too weak or too badly blended to be identified withfrom spot plates, and obtained intensity tracings for each Tc even though features are present near the Tc lines. In ourspectrum. The differences in the H-D curves of plates from judgment the evidence favors the absence of Tc.different batches and with different exposure times is small (5) no. No features are present that can be attributed toso that one H-D curve for the IIIa-J and one for the IIa-O Tc.plates was deemed adequate for most of the spectra for the Table I summarizes the results of the present survey, ofpurpose of identifying the presence of the Tc lines. Paper I, and of other investigators. The stars are listed inl
alphabetical order by the abbreviated name of the constella-III. ANALYSIS tion. Column 3 gives the spectral class as listed in the fourth
edition ( Kholopov 1985) of the General Catalog of VariablcThe resonance lines of Tc are located at 4297.06, Stars (GCVS) for the constellations Andromeda through
4262.27, and 4238.19 A, with intensity ratios of5:4:3. Dueto Orion, and from the third edition (Kukarkin 1969) forthe crowding of the lines in late-type spectra, we find the Pegasus through Vulpecula for which the fourth edition isspectral resolution we used to be marginal for separating not yet available. The Remarks column (14) lists the spec-weak Tc lines from the nearby blends, except for our 4 m tral class from the lriht Star Catalogue (I3SC) (1-loffleitI1Ia-J echelle plates. Each of the Tc lines is near other blend- and Jaschek 1982) ifdifferent from the GCVS. In a few casesing features. In particular, the strongest line (4297) tends to we list other spectral classes inl the R cmarks if we felt theybe blended with a combination of a Ce it line, the Raic UI- were especially relevant to our analysis. Column 4 lisis 0wtime ofSm i and a weak Zr II line. This "blend" has an aver- average spectral class observed at maximum ( Keenan, Gar-age wavelength of about 4296.7 A. Since the s-process cle- rison, and Deutsch 1974). Columns 5, 6, and 7 list the sari-ments Ce, Sn, and Zr strengthen as Te slreigtleins, we tlil(l :1l'lily vtyp, lie pcriod. :;id the :is-,V II V ill tIle light ('1nl\ t,to find the central wavelength ofthe 4297 line to be shifted to (delined as titlie of I( nxinnMiii --- 1111011t11.n)/'] , 1(0)approximately 4296.0 A for a roughlv cqiial contritlicio) to from I it, (VS. whrre a valli rf q( inS0 tdic;o ;1 ,vc rictihe obsel ved IC1 ile of Itic I c line ind tie Iilei'd. 4 )i } in .u h ill %c, ( . 11,11 Ii ,, i ill 1. .11 %cth, 1, , Ilc .1. .,
few cases istheTc line sostrong as todominate the feature so given by Kecian, Garrison, and l)cutsch (1974), Abt ,mithat only a negligible shift from the 4297.06 A position is Biggs (1972), Wilson (1953), Wallerstein and Fawleyobserved. The observed wavelength minimum of the 4297 (1980), or Barbier-Brossat and Petit (1986). Column 9 con-feature is listed in column II of Table I. In a few of t c tains coded information about 11,0, 011, and SiO stellar

983 LITTLE ETAL.: STARS WITH TECHNETIUM 983
0) L) C ).
>~L MI:J .. X, N :
0.3 3)-0 -E0 AuqL cfl). ,A 'A. 0) 3
m3).m u 0 Ln L Ln *- E~f A) -3 --11 M m Inm A 3)- ,0 ,
> -) -c C ) 0 . 4 NOn M. CO 0',. Lo 0c3).- -I 1
m L .0.? V-) - N V3) 3)- 1.1 03 0 r C-)-E -A- L) E L AO . -0 03)
0)m ) Z: w 0) -0 co *AA cc
cc it a)3 'A V) a 000. A 3
11 CII . 10z 1 00 10: z 10 0~ >0- 0 ( 003o00LL)w 00D nL. onDWLf 0 .- 0- 0 DT J 0 1- D W
C > C1 30c .a' Ic ) CL 'a CC1 Dc :0 10 0 N, CL' la. 3).3 c 1c1 o>
Wl 10 ; .n , q 0 pW NC C r. a3) 0 N OC n0 AoW M0. M) .0 M '- qA)MC 0 n>3 0 1,c 0 fl 1-'-. CID co mC 1t ) 0 M)Nc el 00 - 0oa mm mWc C, 0 m
L.. to C W.- -N' A WA IIA L. w31 N01OW(D WI( -0( DI CU OD
3)A U3 00 N1 -C l~3)L I * I- +)0 . -A
7- N) r)C'
4-) X3L 0 VI V1 0 0 X0 X LA X -0V 1
-L -- wA Nn- -n N co- -
m 3 CON' C N' N t, -10 N )1C N -CD ; m LCNO NO ~ A I 3)-C' a)) 0I3) 0 Wv mq I In
.3In 3- q U) CIC(10.C L 1010m N 0010)011Cq0)C)NN)01 CID U) 10 1010 10101J N>0 00 m M N M ) L 0)0 M 0) N))0 0)0)0)0 C. Nm1 1,C1 0) T C' I 10
C'-~ A M 0..q)3 M M ' 7C4() M N-NN q m -14N C ) m N M)
I'.N 11! (A A A A U)A) 0A X )) f~) l Xl I) to I A A X X Al) )( Xl
17 c0 XX) 001 -0 1 ( In I P XXXX IX XX )X U')I XI )C I CX( 4 I n oL
LA'ACLN 0 N0A 'ON0 3CO 0'1C'NN I) I-N-) C130N'0
0-- N -'~)0 N ))- .- N Ac' '- A -)'N )- -) N
-~ ~ ~ ~ ~ ~~~~~~U z0'~~) ll -I 4++Jl) II I + N I* I . + I
>.
0 f0 O )N C N Iv M m O Nwo - -A10) u t N o NCAAD LN 3) I'))N3c Mt ) WZI
A .LL t 0 0 0 00 0 > L L 0 3)u 0 CCaaa a
M0
C)
z IA3
A N3) . 57

984 LITTLE ETA4L.: STARS WITH TECIINETLUNI 9~
ID
CDa 0o
M AN
A.L. A- a)1 a)U-I'- L 10 - - '
~~u to(1 a
EIU EL -. A d±10 '-A > -.
).-, E' In- co.A (D V In
it 5 04 qd *c V )V)I
0 C" C:0 Ao 100 IA N 0 2 m to00 A T a). CD 0 LA A l 10 AnlI 11 L
*-.%'* CO a3 -t C If') It c o a)0oc I N 0 wnL . 1 1 0 It I 1 10 l N lA
O0 L ' GN n n2' L 'A ' I /I 1 l I
~~~~~m 0lAC011 ~ l I l1 No 410 E 2 a)
muda in AlL A~~ L 0N
0 JD n I m 111 1 JO InE n l0 i
(0) 12 In 2 0A 0 V) 2 z ALA.I0"-' )L )0 D )0' o0 0n0L0wLLL L0W DD. 2jo4 01114
ul Afl c m m mn Nnm c mcmmC > L c> > l 1 1 L 'o a C a a a a a a d . c >,>.,a v 3,c Ea >,dv ddNo dc c c E d
to 11 -N cA - 12 In22-l M- 11 N- N to - :1-0U o D N qWI ,c l N
31'. NW mo w 0I11 Nmom 01 0 N0Nd ~ m In0 -01m00100 m 0 1010101 mmommomId dl 0-m
InU)V
L1 L ( 0 x 0
I x IXI IIxI , XXIX IX XIv AX IXXX IXXXIXXI I X x X I : x XXI.j Lo X,- 10 IXXXXXXXI X xIOOI <(0 x xx ) x xx x x: x xx Ix 1<<1<1<2<1 X I Xxx
N10 - IcciN N IN N q- 1,11 t-M Nq N --- N'-- N2 N I- 0m T o N00q0m0 : N ;nD~ '2n. 'N N
L 4- 41+ 1+ + 4 4+ 4 +4 4+1 + I I I I 1 + 01 I 7, 7A (I + + "1 7 1 IAN +> co
to wIn N00 III1N 10 0100 111 0 10 - 20 11110 to in -00 w 1 00 1 0 00I
I o m 1 W- U c 0 m m0 m2 11o~ 12 0 00 m"2 '20 N q0 '0 m 0n0 1 0 M In
cn MC ton'10 NIdl 10Idl NCINO W W Mr N nn 0 NWTNOOW-m NTO q000wT Lnm
mn Inco C) mn 4 l l m NrN qnNn7N mn)'. r22-2 n q ON In N- N N 'NN
L - c12 > u (Y IXz > (Z1 a a jo a1 a 0 a
> 11 N , 11 -1111000 In In NV0 0 '0 n
to r- ul to1 w~I U, Al 0 All Al -I All(AL L I
LAliv
c + 1 ) 0 a) UoIZ
o) 00 IA r- N .'.o'. M0 CO LA I -o , )a
> 1 .- 4)1) - .0N4 ,- N)- - 0101mA 4u -n ..l~ IA - am 40 d AlA
4 I 01.'j u uu 0 m .>-01 cc01 +0' 0 m0 0 m M .1m0 nM I m" E1ECEZ L ..'0 00 In I- N11111'lI >141.1-NNN> >'-w 11 4411 L' L L 41 AldrI
A un L,0 411 '-0 NZ 12JU u-0001N Iuu I 10..-0 I 10'-InCUIIANuu uuu asm00000 L -- . coo
A00K0 UUIUOI 000 0Um00U> wU>UUUmUaUmOU(L)UUUU0O0O00O14w
an- 00U 00040 Eo 0( o0 W N NNN w m1mo1cmo m a camc o)D cZ 0-- -- 0 -1 - - - - -
58

985 LITTLE ETAL.: STARS WITH TECHNETIUM9S
c 0
-- 0 u
Oc'~c.,e.n :, .,A 1 * 0 -
001uUL U u a: M0 .~ U 14- U 0,AAL) L~ A, '10 4) LA 0 '1 AC L 'Ao
M q) L00 co t'A at Z 0
41 0 .110 "o0 0:. t 4 0N l+. . .-0 to N (0 aN01~ (D40'1 U)C)OA -O to 0 A 0'
N N N N CD CO O L 0 0D0 I -1 11 .1 '.. L 0 Ac
M' AA A wAA 0AA (A m q L A A 'AL-o Ln A Ln LA V) A 0 00
E t 1ii itit i it [0 11111 1 .i 11 1 11. c
LL L
D 0. 'L 0 z . -.o 0 -
Cn0D l Z WDD 4, .0 D1D .04L 0 0 a w L , w L n w L 0 q) 0 4 .0 0 D4l41ff1 04M4D0Z)40 n 41401o 4 0 1a141414c .C'1' 0 CCC> - o> o1 0 C , JCLcc ' 11 0 > 0' 0 LC Lc LC L C l cM-0 1 )c C l C Lc
u 4 - - - - o --n.0 0 1- - - - 1- 0 ~ -,l
0 .1c oif f 4I ' )U ~ 144 44400 In -. 4- 140410 In (7 (D4 (DITt t - M CO ;; 10 .01' M M 1404-C00) 1, 41l n a)c, c LLO o! lLO o04ILa!oL01L.0 a a .9L6!a,1!000 flOff~l~0O0 1.fNl0a;0.00 l - l 1 D D1 ID1 1( W( D1 D1 DI I 1 Ov 0. .0 cW W0. 0C .0 0.D..0 >.Df on n v . a0 1' oII' o' . ' o 0, w
4--c T 7 l TM M M O MI M M M I M O
3'-
01 ~+ 4 ..1, - 4 P.N *- 4N Al- - N q -0 - -
0V I x I x x I 14 x LA II (I 'XI AInx x InI I x ~I 0 LM x IAXA I Ix xI xA xL. X x I O xI I I I 10xX x XIx0Ox ,OOIxO(: 1 0 XXI XX x O.( XXI3 1. xX I I X lxxzxxxxxx lxiIxI xzl Xxx r~)<l ZX IXXXIXI xx >x " XxxX
- . N-N4 C4 CO' N-'4 -0 NLO'4 N0- r~' 4 - 1 N- -
> CIa)P ,0 )q t ()O q'4 w041 040 M N 10 10('4 w MO -, r K N M) 10-
1N I') N ODOn D ) C)OD (3)N N1 (D 0 o0)10M 01M40 NO NO0 I p- M. N q c 01 0 1 N-0M
N. IN q 1 14 N14('N ) M44 AN' 'N ' M' NNN M'4N M M 'M .((-)
L 24 *.f fi _jlUf 014 0J )E / 0 0 0 2 'A 2U X14 1j 2'
A 222 A AA A
- InI I U
'A
> .11 1 4 0!~- - 41 41 .-
t!o :: A A v) 'D - a. M ~ a] 4) 4 -f ! --
12 Z. 2 M ( to NOOI I W- M Z4A 0 .- 2,AM OW -
11) O2 0 1 1 r-I I I I I I U) IOI NI 1 NI f I A0 .-. ' A>.- I.-.w 1'.. . . . 10400 4 10*4.4.11- 414 10 A 1 0044
AA14A)I~0A14A7N10100A10A.-0014AA410A10'410NN) -00N4) 0 004N40 e10A14 40A)
E4 E- E E1 E .LI ( 0U0a QC . -I
Z 0>0oN 0 0 410(1-- :MIIIII :xIrII rr1 41>>L0. 7:-0 -1 .1-1 AIJ -. 1 j j- > -. 01V WZ01030A-400AA4..O( Nl..-4100l I0 N-.0A.A0> 0- 0
ON)40O-A0N0OCN1N01.r~~1N E4N441N00A1A0
59

986 LITTLE ETA4L.: STARS WITH TECHNETIUM 986
L A n
- CD-01Cto- 0 P.-U m4 L M-3IN CL C) cc
41 0 0 C C)01- CL A1 L
41. . V) u 01 U
- a)0 0 CU) 0 >-Z
UN -1 .0 m 140 c- 0LA > C) C A3 0 0 0N E 10 L, m4 m
+ 0) .1 L- 0 E D )0 EC
11 ;0 In C. L. . > >.I L) E. I
~+l m ~ I a.~- co. 0 0 v. 1-02 .- -N.. .C. L.h- ~ .
2 V D 2 A r~C E- .. 2. E-E.0)U 3.C InC. C) C,) 4 C
00 l1 00, 3. ; *. .0 CU >Ic- AU V VI/I - CC) w0 U u0) > L 0 EC.a) 0) (o u0
It I. 0o u10 C)- ,/I A > 0 0A0 A L/ A nco- 4- 41 A0 N A u .C)
flN )..*o c V).- *a co * o.03 4I 11 InIC .1 N.0 ) co03 m00 V0)0 mN( 11- IT 11 N C)C 110) 0 11 I 0
0 C 0 U) E C) a41 (D N CU) 01 co N- 1 Q) 01L 1V N ; N -0 N O.11 0) - N NN 011 AD 0(0Ma)61
E O00 0(A r-LA'41 l A 0 A0Otjin c 02c co00C 0 M 'D CD M 000 L ) A tt
II. I113c C EI 11 to ra (n co U)I A , . I
E
fll nan cl mf n 2
.A - - -~ 0 D -n D 4 In -- f Dl) - - 0 -- :in ,,U).0) V)- 4U 1 0 0 -0J0 U)UU00 I.I. 00 - 00..4. zI.0Uz41zI 00 DO Z 0 001. 40 0400 ~ ~ ~ ~ 0' fif3n 410 flo1Wnfn0~lfffff nfw 0 0001 OfCO1IfUI C 0 0. 0D ) LO. Q 4).CCL) VO C . . . O C0 .0 00 m00 own LL.0 (D.0 00CO) . D CC)0.wC.L0n
1010 00 0 . '0CLc ,AL L ( C)NC 0)0) ON0 0 N'D0 TN ) ic) 10-C N 1 (1 CC70 . 0N C IDN C N C -c )Na
oi -t0( LONOOLO I 0) M ))10 ONO0)0)0 CN 0 00)rW MM M ; W 01-r- N M 10 M000-N N - N 0)00N
w0w 0 - 0N 101w0 w01DN P O t o Dr otoL Dt to01N 10N 0' t 1 0 ( D 101 (D101 I o wIO DtoN o ( 1001 (100 IO 1a)) )0 ))) a)0)a))al1m0)0 C))CC0)))CCC)))CC 0)0m 0)0m c) ) c)) 0 )1c) in in a1)0 )
C3 1- + +. .. I.8 :: N - - I ) I I N m - 'nC 0 N N N m1- N
L Lm 0h K 1 i I Al/ l XiI Al I I ) XI I IX XX II X I X'AI 1 A0XAIAx 0 I X X X X A ,) x x Xl) X X 0 : XI Xl<xI0I XXC x I xOx Y ,XXI < X XC 0XI x xIII XI X0xX) x I IX X XI xz x xXXI IT XXI x I t X xI I X I CX I I x x II X X
Nr- r0(1U)N N IN0 IN10 tv-11N C) (-) 1)C)O-qIT M -10-I N In M10)N) -I C -ON-AC
+11 11 +1 4+ +1 I1 + 1+4 +I N~ 14+ + + m 1
_ n LAI 0101(D0000 ra)0)C000C q0( C)C)q ) co CO A1 -0 N to M I
LA. INI TIImqq1 L Tq1
N) 0 NOC)V IND 0)t-AC)01 N1 C; 0 0 0 C) 0 0A00C)1110 0o C) N0 )0ON IT C) LO- to 1 M -N;ONMM0NA A NC) NN O An q 'I DC) - )10 -N IN 00)ICmIN.IN INN. M N NNINICImI0 M MNN)N IN A l -NN--I N N m q (n m c
Ufi X) UU 0 fl M 41lOLA J V)l 0 f i C)IU) Ofl j CJVl ) 0o L jz>
A U LAL "! LA A AL1 wAI IC.) q P t C0 'IN N LM1 Ao A 1) 10 qC ) CI10
LA
0 > > + > A'0)4 ~ 4 N 0 4N C, .41 A Uf 4 '- 1-0.- 0o I L" zLA I4 -- A A-)- + 41 - .-. L AC
CILN N 41 12 Ni 10 1. 4 1 1 I 4 z 1 U, In 11 10 4 41 1 1 .- 1 M, 41 II 4 4 IW111) '- ((P )4NA 4 l )I AV (0 A N -. IfV' W Ia D ( D..C1 10-'.1 d-U - M w1 d 01-
33 In41 m..N. m3333i 0t (4o( 01ft 4q(WtomN Lq mm W N.-.Mto-33 U I MN40- J-..- N33 - 1..q 413 .33'A x.10 aNI 2 111 2 21 u.. 2 t3-NAl 22 aN 0N-- 1.N a 2 1-I2z I 240 'A0-0-ILAI
41zr41C E : -41 14 .[ (70 M (1 1 1) 1 1 1 1 0 3)(7 M 14 L 'Lt1 L L I- L U CL .4 Q CL4- .1- 01 01 0 41t.LL4La, L L ;0
a- 00 000 00 0 00C 0 M 0 0.0MM 0. .m . .0. 0. a L . .0. . 0. 0.(10. 0 0.AAAA ) AA AV A0 AAAA A AV
z 1ix-. cr: 0 N 41- ix > -r Z0m'
a 0o ) 0-NN M LA(W N 00)O.NNVLA(0N00)0.NNVL 0 M 0 0 0-N MNIL10V 0 -NIC)A0 MC)(0( 1!.N mma -N0000000 0 0))))) ))0 0000000-------------
---------------- NNN NN NNNNr NNNNNNNNNNN
60

987 LITTLE ETAL.: STARS WITH TECHNETIUM 987
0n D c
IA - o
0) l' L -
Li V) 4 .MEi (A0 ;: 41 0 0U0. 0 U 0E
E. M 0 ) I mm
E 0 al* 4 I
M V No " 'o m ED0 L c ,x 1-10z - Ul u) L> n mL
L(A 0- N (D >T L U) .. .. .. 6
0 0 a - ) m I I - u I.E - (A0 2( 110 V 4v A l U ,V
0-10 L NO (4 ca 1:1 0o (Ao m m
(. mA 1.N n4 m aA (A E (LMLaMDMM1 DmA I> >x > >
D11 Liz D) z~ U D01.. 0 0 (o J3 z (A o
r,0 N 1, -O D( D t I01 .Y a) 0) 4m (3 ) 0 )0 Mm( I )( ) 0 )
w- 1 (A D C 10 ION M03 N C')NN0)c 1 (DI 0 q I ') L 0, -lq1.0m IL4 ... 2I.......IqN N m-. NN II I ID 'DD 4 + IDI+INDN+D+D+ID+D+IIIDII+ + I IID
I (A.5 a )r - o 0
al T IA41) qA qCX q U 0 q .)
0 NO~ ~ 0 qN 0 'l to tor, ko too 0 O ID 0 rO C' N0 - (A-0 r)0 a)(n aA toN1m.- 1'3' N ') m D - 0(4)0 to0 *- -Lo -N !D r.- N ( -n -n -M m
an M I. N r') 0 ( )N ft )
A 0DN( InN '-! 00 "!C)L)0.10~~~ v'0 C'N In. N(a)') ID rNOAt1or
C')-C)NC') aN mixC' I'2e)'e)'
Lo (A IL(A1
0.
4) CD 0)0 4 b I ", TT- aM+ I1
LA L 2 4 2N 0 41 (AXQb I A UX 0 'X4 4 (A
m vA Io N(( w1- N N to~( CI IV(oP NNwA )m '7q IL.L t ' U1 4 0f X (0n132L -l'1' .4 tor L oN0 omc .0 P. F011f4 m 0 m
N V I (A ( v) 0-- z.( D D0 -m - A D n ni. > >> > NC-)U)1,00 0-0m oo~o I00 4 -I-00000
a (AA'0Aui boo 410AN>>M Na 0C' (AN tAC' (0O'-0.'LAO0 000000N000-00 0 C CO 00 a00 ao
(')V O N N NID O (AID N N OID( I')N O t; Gqa Oc(- 4 N NI N) M r) In M M( M M 1411 M''- V . L LI LI. IDN o(AOIN(o(A (aO "00" N. -N1
EN -0(00 ID) 001 0N(D N NO1010C61

988 LITTLE ETAL: STARS WITH TECHNETIUM 988
U,
01
L
Goe
0 0E L L. L
o,..O W
q 10
wn cCC C C -,
M M u E E E E aCL 4'
U 0)
oo 0)C
L
M- in L
C; ., 140
,j 0 L L:i CLL L L L n
0n in
c Lq
WJ) -- LA -0) m
EUCOLLto C
(a L 0-E oa(D ~ ~ (U cI
61 014 Vv 'o10 ; 0
oq - --
M 0 1 .( 0 0C V -
62 ~

989 LITTLE ETAL.: STARS WITH TECHNETIUM 989
masers found in the literature. A number of our stars weresearched for H 2 0 emission by Benson et al. (1987). A posi-tive detection of a maser is indicated as H (first position) for TABLE II. Cross reference between BS numbers and variable star names.water, 0 (second position) for OH, and S (third position)for SiO. A dash (-) in the appropriate position means the BS Star namestar has not been searched, and X indicates that the star has 85 T Cetbeen searched but has not been detected. A positive detec- 103 TV Psction is listed in preference to a negative result ifboth cases are 257 DQ Tuc
587 AR Cetfound in the literature. Column 10 lists our estimate of the 681 a Cetdepth of the 4297 line relative to the local continuum on a 868 R Hotrscale of I to 10. This is a very crude estimate of the intensity 911 a Cet
921 p Perand should be interpreted with caution. Estimates in paren- 1105 DD Camtheses are from density tracings and do not have the same 1451 DV Eri = 47 Eriquality as those from intensity tracings. Column I I gives the 1556 o' Ori
1693 RX Leocentral wavelength of the observed 4297 feature. For XY 1845 CE Tau - 119 TauLyr and X Peg we list the wavelength of the 4262 feature as 1939 NO Aur
2061 a Onimeasured on 4 m archival echelle plates since the 4297 A line 2061 U Ori2063 U Oniwas off the end of the order. Column 12 gives the likelihood 2190 TV Gemfor the presence of Tc. Column 13 gives references to Tc 2197 BV Gem2216 17 Gemsearches: (a) refers to stars analyzed for the present study, 2286 'U Gem(b) to Paper I. Other references are keyed to a list at the end 2289 0' Aurof the table. In the Remarks (column 14) we give the BS 2646 o CMa
2748 L' Pupnumber (Hoffleit and Jaschek 1982) and the spectral class if 2902 KQ Pupdifferent from the GCVS and other comments; SB indicates 2967 NZ Gema spectroscopic binary and VB a visual binary as listed in the 3541 X Cnc3639 RS CncBSC. Since the variable star designation for a number of low- 3882 R Leoamplitude variables is not yet well established in the litera- 4088 DE Leo = 44 Leo
4195 VY UMature, we have listed in Table II all the stars with BS numbers 4231 6 Chaand their corresponding variable star names. 4666 2 CVn
4763 V Cru5080 R Hya
IV. DISCUSSION 5192 V806 Cen = 2 Cen5226 CU Dna = 10 DraTable I lists the 279 stars that have been searched for Tc. 5261 e Aps
The Ba Ii stars (25) show s-process enhancements that ap- 5299 BY Boopear to be derived from the binary natur, of the stars 5300 CF Boo
5301 ET Vir(McClure 1984). No Tc I lines have been .ected in any 5490 W BooBa iI star. However, Tc is expected to be prinmarily iotiized in 5589 RR UMithese higher-temperature stars. A search for the resonance 5603 a Lib
5644 X TrAlines of Tc n (2647, 2610, and 2543 A) in " Cap, o Vir, and 5802 16 SerBS 5058 in JUE (International Ultraviolet Explorer satel- 5894 R Ser
5932 2 Henlite) spectra has also proved negative (Little-Marenin and 6010 72 Ser 47 SenLittle 1987), implying that the s-process episode producing 6039 LQ Her = 10 Herthe observed enhancements occurred more than 106 yr ago, 6134 a Sco6146 Hr3 emost likely by mass transfer from a companion. A subgiant, 6406 a1Her = 30 Her
two A stars, and three K stars are excluded from. the rest of 6702 OP Her7001 a Lyr
the discussion since they do not show Tc lines and are not 7002 X OphAGB stars. The remaining stars include 190 M stars (108 7009 XY Lyrare Mira variables), 17 MS stars (five Miras), 24 S stars ( 15 7139 62 Lyr
7157 R LyrMiras), three SC stars (two Miras), and 16 C stars (five 7509 V1351 CygMiras). We reach the following 12 general conclusions (ex- 7523 V973 Cygceptions will be discussed in subsec c). 7536 6 Sge
75647886 EU DelCY
a) General Conclusions 8145 T Ind8204 W Cap
1) M stars 8262 W Cyg8292 V460 Cyg8383 VV Cep
(I) Nonvariable (NV) M stars do not show Tc. 8416 MO Cep = 18 Cep(2) M supergiants do not show To. 8521 7r& Gru
8560 62 Gru(3) Irregular variable (Lb) M giants do not show Tc. In 8562 NU Tucgeneral, these are low-amplitude variables (mean Am -0.2 8636 /13 Gru
8714 HR Pegmag). 8775 6 Peg
(4) M star Mira variables tend to show the Tc I lines if 8815 GZ Peg - 57 Pegtheir period is longer than 300 days. This confirms the main 9004 TX Psc = 19 Pscconclusion of Paper I. Subsection b contains a longer discus-sion of the Mira variables and the exceptions.
(5) The semiregular (SRb) M giants do not show Tc if 63

990 LITTLE ETAL.: STARS WITH TECHNETIUM 990
P < 100 days or P > 150 days (except for TU CVn-50 days, 5) C starsRT Hya-290 days, and T Mic-347 days). Only seven ( 11 ) Twelve out of the 16 C stars (75 %) show Tc. All fourSRa's have been observed. In general the longer-period Lb C stars show Tc. The C star Lb's have larger amplitudesSRa's show Tc and the shorter-period ones do not (see Fig. (Ain - 1 mag) than the M star Lb's mentioned in (3). The3). SRc variables are estimated to be supergiants and do not four C stars, SS Vir, UU Aur, X Cnc, and Y CVn, that do notshow Tc (see discussion on MS supergiants in subsec c).c.
(6) M stars with Tc have spectral types later than M2.
6) Masers2) MS stars
(12) Maser emission from H2 0, OH, and SiO shows no(7) Evolutionary MS stars, as defined in subsec c, show correlhtion with the presence of Tc.
Tc.(8) Spectroscopic MS stars, as defined in subsec c, do not b) Tie M Star Miras and Semiregular Variables
show Tc. The main conclusion reached from this analysis is that theonset of the third dredge-up occurs in M stars on the AGB
3)Sstars (as predicted by theory) and is accompanied by the onset(9) Single S stars show Tc (usually quite strongly). The and the continu.tion of variability. Nonvariable stars do not
five stars, BS 363, iD 35155, HD 165774, BD Cam (BS show Tc (with the exception of the S star BS 8062 (S4,1 ));1105) and V Cnc, that do not show Tc are discussed in sub- even the small-amplitude irregular (Lb, Lc) variables do notsec C. show Tc. For Miras the third dredge-up appears to correlate
very strongly with period (Fig. 1 ).4)SCstars In Figs. 1 (b) and (c) we plot histograms of the Miras
listed as having Tc-no or Tc-doubtful (b) and those with Tc-(10) The three SC stars listed in Table I show the reso- yes, Tc-probable, and Tc-possible (c). The periods are
nance lines ofTc. Tab!e I does not include the two SC stars binned in 15 day intervals. Usually, only Miras withFU Mon and GP Oni, which do not show the Tc i intercom- P > - 300 days show Tc (Fig. 1 (c)). There are three excep-bination line at 5924 A (Dominy and Wallerstein 1986). tions: V Cas-229 days, U Ser-238 days and X Gem-264This line is much weaker than the resonance lines we ob- days (Fig. 1 (c)). However, all three are listed as Tc-possible,served, and its absence does not preclude the presence of the meaning that their Tc lines tended to be weak and blended.resonance lines. Clearly, more SC stars should be searched We will assume for the rest of the discussion that P> 300for the Tci resonance lines in order to establish whether all days is the most realistic division for Miras with Tc.SC stars show the Tc i lines. We are not making a distinction The onset of the detectability of s-process products on thebetween SC and CS stars in this paper. surface appears to be quite sharp, and the percent of stars
M STAR MIRA VARIABLES
100- PERCENT OF STARS WITH r. (a)
o50LU
8 T -NO OR DOUBTFUL (b) Fio. 1. Histogram of theM Mira variables
t 6 versus period binned in 15 day intervals.I,. The bottom panel (c) shows the stars with4h Tc present (Tc-yes or probably present)
indicated is hatched areas and stars with2 Z Pup R Cen Tc possibly prescit indicated as opeti
0 areas. The middle panel (b) shows thestars with Tc-ro or -douhtful. The top
10Paneil (a) plotile percenit of stilrs otl'0 TO-YES, PROBABLE ( Cc) Tc. Ascan hesci,,tars withTcingecr,,8 AND POSSIBLE E haep> 30 daos
Z 22z
2
40 100 160 220 280 340 400 460 520
PERIOD (days) 64

991 LITTLE ETAL.: STARS WITH TECHNETIUM 991
with Tc rises rapidly for stars with P> 300 days, reaching the galactic P-L relationship implies that Miras with ob-100% for Miras with periods between 370 and 400 days (Fig. served Tc lines (i.e., P between 300 and 500 days) should1 (a)). We have been able to observe only 13 Miras with have M., between - 4.4 and - 4.9, Hence our data seemP> 400 days. Even though the statistics are poor, the trends to indicate that stars showing Tc i are Pop. I starsare suggestive. Four out of the six stars with 400 <P<415 (Z = 0.01-0.02) that have experienced the third dredge-updays (U CMi-414 days, S Ori-414 days, U Aur-408 with masses in the 1.5-2.5._4. range and luminosities in thedays, U Hr-406 days) do not have Tc, whereas the five 5-6X 10' L. range. Current evolutionary models do notstars with 415 < P < 490 days (RU Her--485 days, R Aur- predict the third dredge-up in this mass, luminosity, and458 days, T Cas--445 days, R Cas--420 days, Z Sgr-420 metallicity range (Iben 1983; Iben and Renzini 1983; Lat-days) do show Tc. ThetwostarswithP> 500days (R Cen- tanzio 1986, 1987).546 days, Z Pup-5 10 days) do not show Tc. R Cen, with The Mira sequence can be extended to longer-periodalternating deep and shallow minima, may actually have a (500-1500 days) objects by including the Type II OH/IRperiod of -275 days as suggested previously. However, the sources. Since the mass-loss rates also increase towards thelight curve for Z Pup shows no such double structure longer period, we find that these objects are heavily en-(American Association of Variable Star Observers shrouded in dust shells. The Type II OH/IR sources are(AAVSO) 1983). If the true period of both stars were half strongly concentrated towards the galactic plane, and theirtheir published value, then the lack of Tc would agree with masses are estimated to be > 4 ._' 0 . Theory predicts thatthe other stars we observed in the 260-280 day period range. they should be experiencing the third dredge-up. Unfortu-
Miras form a fairly well-defined group. Kinematic studies nately, the thick dust shells make it impossible to observeof Miras have shown that the shorter-period Miras these stars for Te. In general, we were able to observe only(P- 150-200 days) tend to be old (Pop. 11), low-mass ob- stars with optically thin dust shells, as estimated from IRASjects with masses around 1 , whereas the longer-period low-resolution spectra and IRAS point-source fluxes for theMiras (P- 300-400 days) are somewhat younger (interme- stars in Table I. We find no correlation between the strengthdiate Pop. I) with masses between 1.5 and 2.5 ,,* (Feast of the 10gum silicate emission observed in the IRAS low-1963; Clayton and Feast 1969). The kinematic studies of C resolution spectra and the presence of Tc. With a few excep-stars by Dean (1974) show that most C stars have F5 main- tions, such as R Cet, we were able to obtain spectra only ofsequence progenitors with masses around 1.2...k. This stars with relatively weak emission features in the 8-22,amagrees with the kinematic studies of the Pop. I Miras since M region, i.e., from optically thin shells.type AGB stars are predicted to develop into C stars. Theory predicts that 2C is brought to the surface duringIn a given globular cluster, Miras tend to have a very limit- the third dredge-up with an accompanying increase in the
ed range of periods, and the mean period increases with me- 12C/ 13C ratio. Comparing our Tc data for Mira variablestallicity. This implies that Pop. II Miras of a given period with the 1
2C/' 3 C ratios determined from the second over-form a homogeneous set of mass, age, and composition tone of CO (Hinkle, unpublished), we find that '2C/' 3C-8(Feast 1980). Not enough data are available about the Pop, I for the Miras with Tc-doubtful or Tc-no (only three stars),Miras to establish whether these stars also form a homogen- - 13 for the Miras with Tc-yes, Tc-probable, or Tc-possibleeous set for a given period. The fact that both R Hya (12 stars), - 33 for four MS Miras and -55 for two S Miras.(P = 388 days Tc-yes) and RR Sco (P = 280 days, Tc-no) We included T Cas, T Cep, and X" Cyg among the MS starsprobably belong to the Hyades Supercluster (i.e., relatively (see discussion in subsec c). The difference in the ' 2C/' 3Cyoung), and R Leo (P = 312 days, Tc-dbfl) and S Scl ratio between the M Miras with and without Tc is small, but(P = 366 days, Tc-prob) are assigned to the old-disk mov- appears tobe real (Fig. 2). Smith and Lambert (1985, 1986)ing groups Wolf 630 and 61 Cyg, respectively (Eggen 1970, found a similar trend in the '2C/'C ratio for their non-Mira1975), argues against the same-age Pop. I stars having simi- M, MS, and S stars. However, their average ratio for the Mlar characteristics. Our data seem to indicate that Tc (and stars with no s-process enhancements is about 14, similar toothers-process elements) is mixed with the outer layers, pre- the value Hinkle obtains for the M Miras with Tc. Moresumably during the third dredge-up in the 1.5- 2.5:.€'# Pop. '2C/"C ratios for Miras without Tc would be very useful.I stars and not in older, lower-mass objects. The lack of Tc in An exception to the trend in the 2C/IPC ratios is S Ori, a 414V 1 (47 Tuc) lends support to this conclusion. Our data do day M star Mira with Tc-doubtful and a 12C/13C ratio of 40,
show that mixing occurs in higher-mass stars. For example, typical of the MS stars.the carbon star UV Aur (Tc-yes) has a B8.5 V companion The intensity of the 4297 A Tc line does not correlate withand hence should have a mass > 4.4%. However, very few period. Neither does the presence of Tc correlate with thestars have individually determined masses, asymmetry in the light curve (listed in Table I, column 7).
Miras define a period-luminosity (P-L) relationship that Vardya (1985) suggests that the asymmetry is a measure ofis given by Glass and Lloyd Evans (1981) for the LMC the strength of the shock and that the intensity ofthe 4297 AMiras as line as listed in Paper I (marginally) correlates with theMb = 0.56 - 2.09 log P. light-curve asymmetry for S stars. If the shock strength is
Using the slope of their LMC P-L relation, Glass and Lloyd related to thermal shell flashing, one might expect that Te isEvans fit the galactic Mira data of Robertson and Feast more likely to be observed in stars with a more asymmetric(1981) with light curve. However, the marginal correlation disappearsM,= 0.76( ±0.11 ) -2.09 log P with the addition of a few new S stars. For example, T Gem
' =07(011-20lhas a symmetric light curve (f= 50) and an intensity 4 Tc iThere is a difference of 0.2 mag between the two P-L rela- line.tionships which may be related to differences in metallicity Figure 3 shows the distribution of the scmiregular vari-between the LMC and the Milky Way and/or to uncertain- ables with known periods.as a function of Tc. Two out of thetiesin the distance modulus ofthe LMC (Feast 1984). Using three M star SRb's with periods between 130 and 141 days
65

992 LITTLE ETAL: STARS WITH TECHNETIUM 992
MIRAS WITH '2C/ 3 C RATIOS 290 days; T Mic-347 days) show Tc and may be related toso I I I the Miras, i.e, pulsating in the fundamental mode. However,
as the light curve of RT Hya shows the small amplitude varia-70 - MS tions typical of the semiregular variables (AAVSO 1983)9 M WITH Tc and hence it is not a misclassified Mira. No light curve ofT60 - o M Tc POSS Mic has been published by the AAVSO.
M WITHOUT Tc
50 - S STARS C) Exceptions
1) AfS star.s
Y40 Among the 17 MS stars listed in Table I, we were sur-_MS STARS prised to find seven that do not show the Tc lines: RT Aq
30- (M-327 days); X Cet (M-177 days); DE (44) Leo(SRb-P = ?); NZ Gem (BS 2967) (SR-P = ?); GZ (57)
20 . Peg (Lb); NO Aur (Lc); and BS 7442 (var?). Smith andM STARS WITH Tc Lambert (1985, '986) determined abundances for nine out
of the II MS stars listed by Yamashita (1967) and found1. M STARS WITHOUT that four (DE Leo, BS 7442, CU (10) Dra, and BS 2508)
0 Tc showed no enhancements of the s-process elements whereas200 300 400 500 600 the five others did (RS Cnc, HR Her, OP Her, o'Ori, and BS
PERIOD (days) 8062). (CU Dra and BS 2508, although classified asFIG. 2. The '2C/"3 C ratio (Hinkle, private communication) ofM stars with- M3 IIaSby Yamashita (1967), are not included among ourout Tc (crosses), M stars with Tc-probable and Tc-yes (dark circles), M 17 MS stars since they are not listed with an MS classifica-stars with Tc-possible (light circles), MS stars (triangles), and S stars tion in either the GCVS or BSC.)(squares). MS stars were originally defined by Keenan (1954) as
stars that show weak ZrO bands and enhanced lines of Ba nand Sr xi in the blue spectral region. It appears to us that the
show Tc (Fig. 3(b)). These two may be stars equivalent to MS stars should be divided into two classes which we shallMiras but pulsating in the first overtone rather than in the call evolutionary MS stars and spectroscopic MS stars. Wefundamental mode (Willson 1982). As can be seen in Fig. define evolutionary MS stars as those stars in the intermedi-3 (b), the semiregular MS stars with Tc are also located in ate evolutionary phase between the M and the S stars. Thesethis region of the histogram and are also likely to be first- evolutionary MS stars show the same spectroscopic charac-overtone pulsators. Two long-period SRb stars (RT Hya- teristics as the MS stars defined by Keenan, but in addition
SEMI-REGULAR VARIABLES
4 - Tc-NO, DOUBTFUL (a)
Y CVn X Cnc UU Aur C STARS
4 CEISRa 0 SRb2 M STARS
FIG. 3. (a), (b) Histograms for the semiregularz 0- variables binned in 15 day intervals. The bottom40 100 160 220 280 340 400 460 panel (b) shows the stars with To. The N1 and MS
PERIOD (days) stars, C, and S stars are plotted on separate lines.SRb variables are indicated as hatched areas,SRa's as open areas and MS scmiregular variablesas double-cross-hatched areas. The top panel (a)shows the stars wth Tc-no or -doubtful. The three
4 Tc-YES, PROB, POSSIBLE (b) SRb C stars airc plotted on a separate line. NotXDm V460 O T Ind RSC U Hyo C STARS semiregular S or MS stars without Tc are known.
0Z , um 1 1" S STARS
0 [- [- , M, MSSTARS40 100 160 220 280 340 400 460
PERIOD (days)

993 LITTLE ETAL.: STARS WITH TECHNETIUM 993
they have abundances of the s-process elements (including Miras. Neither shows Te, and Keenan, Garrison, andTc) and C/O ratios intermediate between the M and the S Deutsch (1974) observe no ZrO in RT Aql. However, theirstars, e.g., RS Cnc and OP Her. (Smith and Lambert (1986) spectrum of X Cet was too underexposed for ZrO to be ob-call our evolutionary MS stars true MS stars.) servable. X Cet should be reobserved at classification disper-
It seems that atmospheric conditions in certain stars are sion and should be reanalyzed for Tc. Two M Miras, T Casalso able to produce enhanced strengths of Sr and Ba lines, and T Cep. should probably be classified as evolutionary MSi.e., enhancements not due to increased abundances, for ex- stars. They show fairly strong Tc lines and definitely showample, DE Leo and CU Dra (Smith and Lambert 1985, ZrO bands around 9300 A (Spinradetal. 1966). RSerprob-1986). The Smith and Lambert abundance analyses point ably shows the 9300 A ZrO bands (Spinrad and Newburnout the difficulty in interpreting classification criteria in 1965) and weakly ZrO in the blue at two out of four phasesterms of abundances. It is also likely that some MS stars will (Keenan. Garrison, and Deutsch 1974) and strong Tc.be found with s-process enhancements and no Tc. A possible Ilowever, its '2C/'"C ratio of 15 + 3 (Hinkle, unpublishcd)example is g Her, which shows mild s-process enhancements is more typical of M stars with Tc and we will not include itby about a factor of 2 but no Te. These types of objects may among the evolutionary MS stars until its s-process abun-be cooler analogs of barium stars whose enhancements are dances can be determined. A comparison of the intensity oflikely to be produced by mass transfer from a companion. the ZrO band as listed by Keenan, Garrison, and DeutschWe postulate the existence of these types of objects among (1974) and our Tc data show that stars with Tc have ZrOthe S and the C stars. We will refer to the MS stars with intensities of > I or have intensities of about 0.5 at severalobserved enhanced s-process lines and no Tc as spectroscopic phases. An occasionally weakly visible ZrO band does notMS stars. The presence of Tc will distinguish between the indicate the presence of Tc and may relate to unusual atmos-evolutionary and the spectroscopic MS stars, but only a corn- pheric conditions.plete abundance analysis will distinguish between atmos- Summarizing, we find that evolutionary MS stars showpheric enhancements and real s-process enhancements pro- Tc, whereas spectroscopic MS stars do not. This is a some-duced in the past. what circular argument in that we have excluded from the
ST Her and NZ Gem (BS 2967) are listed in Table I as MS evolutionary MS group those stars that do not show Tc. Thestars and are also among the MS stars ofYamashita (1967). value of the distinction between the two groups lies in theST Her shows strong Tc lines and Smith and Lambert fact that we are able to distinguish between unusual atmos-(1986) did notice enhanced s-process lines on its spectrum pheric conditions (or possible mass transfer from a compan-(although they derived no abundances). We will consider it ion) and real abundance anomalies produced very recentlyto be an evolutionary MS star. NZ Gem shows neither Tc in AGB stars. The presence of Tc establishes a star as belong-(present study) nor enhanced s-process lines (Smith and ing to the evolutionary MS category without having to per-Lambert 1986) and may be either a spectroscopic MS star or form complex abundance analyses, especially for the Miraan ordinary M star. variables for which good atmospheric models are not yet
NO Aur and GZ Peg, listed as MS stars in Table I, are low- available.amplitude irregular variables that do not show Tc i lines. GZPeg should be examined for s-process abundance enhance- 2)Sstarsments. We include it among the spectroscopic MS stars.
NO Aur is listed as M2 Slab in the GCVS and as M2 IIIS The S stars BS 363, HD 35155, HD 165774, BD Cam (BSin the BSC. However, our 4 m echelle spectrogram is more 1105)-Lb and V Cnc (M-272 days) that do not show Tcconsistent with its supergiant classification. The IRAS low- are of particular interest since their spectral classificationresolution spectrum of NO Aur shows an emission feature in implies that the other s-process elements are enhanced. BDthe 9 to 13 pm that is typical of many S stars (Little and Cam ( = BS 1105) is a low-amplitude Lb variable in a bina-Little-Marenin 1986). Supergiants in general do not show ry system (Griffin 1984), and its s-process enhancementsthe Tc lines (subsec a, conclusion no. 2). Red supergiants (Smith and Lambert 1986) may be due to mass transfer(usually irregular or semiregular variables) are estimated to from a companion analogous to the enhancements observedbe in the beginning stages of core helium burning (Stothers in Ba it stars. Peery (1985) reports the possible detection ofand Leung 1970). The lack of Tc in any M supergiants an underluminous (white dwarf?) companion to BD Cam inagrees with this conclusion. However, three MS stars, classi- an IUE spectrum and Johnson and Ake (1984) interpret thefled as supergiants or bright giants, do show strong Tc lines very strong C iv and N v lines in an IUE spectrum of HD(RS Cnc (M6e lb-II(S)), Y Lyn (M6S lb-II) and T Cet 35115 as possibly being produced in an interacting binary(M5-6S Ile)). Their luminosity class may be suspect since system. Hence the s-process enhancements in both theseluminosity criteria such as the Sr lines are also enhanced by stars may be related to mass transfer. BS 363 may be similarthe s-process and as the conflicting classification for RS Cnc since it is listed as a probable spectroscopic binary in theshows: M6e Ib-II(S) in the GCVS and as M6 IllaSe in the BSC. However, no white dwarfcompanion with M. brighterBSC. Until we are certain about the supergiant classification than 11.1 has been detected with JUE (Johnson and Akeof these MS stars, we will believe that no supergiants show 1986). It should be searched for radial-velocity variations.Tc. Hence we reach two contradictory conclusions for NO No extra information on HD 165774 is available. V Cnc isAur. Its supergiant characteristics and its low amplitude arc the only S type Mira with no Tc lines, and it definitely needsconsistent with no Tc lines in its spectrum. On the other to be reobserved. We observed it near maximum when it ishand, its IRAS spectrum argues for NO Aur having S star quite warm (SO) and Tc is somewhat ionized. It would becharacteristics and as such it should show Tc. An abundance most unexpected to find an S star Mira without Tc lines sinceanalysis is needed in order to clarify its status. this type of star is a prime candidate for the third dredge-up.
The two MS Miras, RT Aql and X Cet, may be classified V Cnc is also a visual binary; however, the secondary is tooincorrectly as MS stars and should be considered M star 67bright (rk = 13.5 mag) to be a white dwarf and the separa-
i ! •67

994 LITTLE ETAL.: STARS WITH TECHNETIUM 994
tion is too large (10") for the companion to have exchanged spectrum is a very sensitive indicator of the mixing of s-pro-mass with V Cnc. We conclude that all single S stars show cesscd elements. At times, we can detect the presence of an s-the products of recent s-processing in their atmospheres. The process product (i.e., Tc) more readily than can abundancefew S stars without Tc are nonvariable or low-amplitude analyses of others-process elements since the detection of Tcbinaries (V Cnc may be an exception). The only nonvariable is more easily accomplished than the determination of abun-star to show Tc is BS 8062 (S4,1). It may be temporarily in a dance enhancements. We find a significant number of Mquiet evolutionary phase since all other Tc stars are relative- stars with Tc even when no s-process enhancements havely large-amplitude variables. It is of interest to point out that been determined by spectroscopic abundance analyses. Spe-a white dwarf companion can be present and Tc be observed cifically, the pure M star o Cet (Mira) shows the Tc I linesin the atmosphere of a star. For example, the MS star o' Ori and no apparent enhancement of Zr and Nb (Dominy andshows Tc and has a white dwarf companion (Johnson and Wallerstein 1986), R Ser shows a strong Te line but ZrOAke 1986). appears to be present only occasionally and then very weakly
(Dominy and Wallerstein 1986; Keenan, Garrison, and3) Carbon stars Deutsch 1974; Spinrad and Newburn 1965), and no ZrO has
The four C stars that do not show the Tc lines are SS Vir been observed in Mira. The detection of Tc in a large number(M-355 days), UU Aur (SRb-234 days), X Cnc (SRb- of stars allows us to delineate those stars in which s-process195 days), and Y CVn (SRb-157 days). Utsumi (1970, products have recently been mixed with surface materials.1985) has found that C stars rich in 3C (type J) such as Y The percent of stars with Tc rises from 0% for nonvariable
CVn do not show s-process enhancements. Hence it is not M stars to probably 100% in the MS, S, and SC stars.
surprising that Y CVn does not show Tc. No other J type The onset of the third dredge-up is accompanied by light
stars have yet been searched for Tc. Lambert et al. (1986) variability in these stars. The nonvariable and low-ampli-determined a C/O ratio of 1.087 for Y CVn. Its greater-than- tude variables do not show Tc, whereas larger-amplitude
unity C/O ratio together with its low '2C/' 3C ratio of 3.5 semiregular (SR) and Mira variables do show Tc. In Miraimplies a compositional change during an earlier evolution- variables the presence of Tc is a very strong function of their
ary phase and not the third dredge-up. On the other hand, period and Tc is not usually detected in stars with P < 300
UU Aur and X Cnc show the typical s-process enhance- days. Some of the semiregular M stars in the 130-150 dayments (Utsumi 1985) and C/O ratios of Cstars (Lambert et period range also show Tc and may be first-overtone pulsa-al. 1986) (SS Vir was not analyzed by Utsumi and no C/-O tors corresponding to the longer-period fundamental-moderatio was determined by Lambert etal. 1986). The lack of Tc Mira pulsators.in these two stars is difficult to understand unless the third We argue that the MS stars should be divided into twodredge-up has ceased in these stars more than 106 yr ago so categories: (a) the evolutionary MS stars, which representthat Tc has had time to decay away. However, the AG3 and have the intermediate abundance characteristicslifetime of low-mass stars is only a few times 106 yr (Iben between the twospectral classes (including Tc); and (b) the1983). The cutoff for the third dredge-up would have to be btentetoseta lse icuigT) n b h1983) Te cutodin fordher thr dlloworege-upowouldihaveoto spectroscopic MS stars in which unusual atmospheric condi-very finely tuned in order to allow for the formation of a C tions or possibly enhancements due to mass transfer from astar and the decay of Tc before the star ends its AGB evolu- companion produce enhanced Sr and Ba lines but notion with the ejection of a planetary nebula. Another possi- Tc p lines.bility is that these particular stars are cooler analogs to the The fw S stars that do not show Tc niay have companions
barium stars (i.e., unidentified binary stars). More C stars and their s-process enhancements may be related to a mass-should be searched for Tc and binary companions. It is, how- transfer process as suggested for the barium stars.
ever, very difficult to observe carbon stars for the Tc i reso- Supergiants do not appear to be in a third dredge-up phase
nance lines since their ultraviolet depression makes most of se t do not howaTctandeprobablyiaredlikely to beainthem quite faint in the 4200-4300 A region. since they do not show Tc and probably are likely to be in
their core-helium-burning phase. The supergiant classifica-
V. CONCLUSIONS tion of the MS stars is suspect because of the difficulty infinding luminosity criteria that are independent of s-processDuring the late stages of evolution, stars on the upper part elements. Holweger and Kovacs (1984) observed several K
of the AGB can experience helium shell flashing and the giants and supergiants with apparent abundance enhance-third dredge-up which mixes carbon (a product of helium ments of Sr and Ba which they attribute to a weak s-process.burning) and s-process elements with the atmosphere. Dur- However, Smith and Lambert (1986) point out that the ap-ing this phase, M stars progressively evolve from parent enhancements are likely to be related to non-LTEM - MS- S- (SC) - C stars. Abundance analyses of stars effects in the Sr lines and not a weak s-process. The lack of Tcalong this sequence confirm an increase in the C/O ratio and in our three K stars lends support to the suggestion by Smithin the amount of s-processed elements in their atmospheres, and Lambert.The detection of Tc in our much larger sample of stars agreesvery well with the increasing amounts of s-process elements We would like to acknowledge the cheerful and helpfulobserved in the sequence from M- C stars. We find that all assistance ofthe staff at Kitt Peak National Observatory andevolutionary MS, probably all single S stars, and all SC stars Cerro Tololo Inter-American Observatory. We would likeshow Tc. However, among the C stars, we find a significant to thank K. Hinkle for the 2C/ 3 C ratios of Mira variablespercentage of stars that do not show Tc even if other s-pro- prior to publication. This research has been supported incess elements are enhanced. Whether the decrease in theper- part by a University Resident Research Fellowship of thecent of C stars with Tc is related to undiscovered binary Air Force Office of Scientific Research to the Air Force Gco-systems is not yet known. physics Laboratory (I.R.L.-M.). S. J. L. would like to thank
In M stars we find that the presence of the Tc lines in the Bentley College for an Assigned Time Research grant. We68

995 LITTLE ETAL.: STARS WITH TECHNETIUM 995
would also like to thank P. Gaeta, L. Lewis, and C. Leslie for Association of Variable Star Observers without whose obser-their help with the analysis of the spectra. We especially vations it would have been difficult to predict maximumwould like to thank the many members of the American brightness for the variables on our observing program.
REFERENCES
Abt, H. A., and Biggs, E. S. (1972). Bibliography qfStellar Radial Velocities Kipper, T. A., and Kipper M. A. (1984). Soy. Astron. Lett. 10, No. 6, 363.(Latham Process Corporation, New York). Kukarkin, 13. V., ctia. ( 1969). General Catalog of Variable Stars, 3rd ed.
Akopyan, A. A., and Melik-Alaverdyan, Yu. K. (1983). Soy. Astrophys. (Nauka, Moscow).19, No. 2, 273. Lambert, D. L., Gustafsson, B., Eriksson K., and Hinkle, K. H. ( 1986).
American Association of Variable Star Observers (AAVSO) (1983). Ob- Astrophys. J. Suppl. 62, 373.servations of Long Period Variables, Rep. No. 38 (AAVSO, Cambridge, Lattavzio, J. C. (1986). Astrophys 1. 311, 708.MA). Lattanzio, 3. C. (1987). Astrophys. 3. Lett. 313, LI15.
Barbier-Brossat, M., and Petit, M. ( 1986). Astron Astrophys. Suppl. 65, Little-Marenin, 1. R., and Little, S. J. (1979). Astron. J. 84, 1374.59. Little-Marenin, 1. R., and Little, S. J. ( 1986). Lect. Not. Phys. 254, 423.
Benson, P. J., Little-Marenin, 1. R., Dickinson, D. F., Turner, B. E., and Little-Marenin, 1. R., and Little, S.]1. (1987). Astron. J. 93, 1539.Jewell, P. R. (1987). In preparation. Maelhara, H. (1971). Pub]. Astron. Soc. Jpn. 23. 313.
Boesgaard, A., and Fesen, R. (1974). Pub). Astron. Soc. Pac. 86, 76. Mathews, G. J., Takahashi, K., Ward, R. A., and Howard, W. H. (1986).Boesgaard, A. M. (1969). Pub!. Astron. Soc. Pac. 81, 365. Astrophys. J. 302, 410.Bond, H. (1974). Astrophys. 1. 194, 95. McClure, It. D. (1984). PubI. Astron. Soc. Pac. 96. 117.Boyarchuk, A. A., and Snow, T. P. (1978). Astrophys. J. 219, 515. Merrill, P1. (1952). Astropltys. 3. 116, 21.Burbidge, E. M., and Burbidge, G. R. ( 1957). Astrophys. J. 126, 357. Merrill, P. ( 1956). PubI. Astron. Soc. Pac. 68, 70.Clayton. M. L., and Feast, M. W. (1969). Mon. Not. R. Astron. Soc. 146, Mikaki, T. (1978). Ann. Tokyo Astron. Obs. 11 17. 1.
411. Ostlie, D. A., and Cox A. N. (1996). Astrophys. 3. 311, .64.Cohen, J. (1973). Publ. Astron. Soc. Pac. 85, 187. Peery, B. F. (1971). PubI. Astron. Soc. Pac. 83, 162.Cosner, K., and Truran, W. (1981). Astrophys. Space Sci. 78, 85. Peery, B. F. (1985). In Cool Stars withI Excesses of flea vy Elements, Astro.Davis, D. N. (1968). Astrophys. J. Lett. 152, L13. physics and Space Science Library, Vol. 114, edited by M. Jaschek and P.Dean, Ch. A. ( 1974). Astron. J. 81, 364. C. Keenan (Reidel, Dordrecht), p. 333.Dorniny, J. F. (1984). Astrophys. J. Suppl. 55, 27. Peery, B. F., Keenan, P. C., and Maren in, 1. R. (1971). PubI. Astron. Soc.Dominy, J. F., and Wallerstein, G. (1986). Astrophys. J. 310, 371. Pac. 83, 496.Dominy, J. F., Wallerstein, G., and Suntzef, N. B. (1986). Astrophys. J. Robertson, B. S. C., and Feast, M. W. ( 198 1). Mon. Not. R. Astron. Soc.
300, 325. 196, 111.Eggen, 0.3J. (1970). Astrophys. J. Suppl. 22, 289. Sanner, F. ( 1977). PubI. Astron. Soc. Pac. 89, 768.Eggen, 0. 1. (1975). Astrophys. J. 195, 661. Sanner, F. ( 1978). Astrophys. J. 219, 538.Feast, M. W. (1963). Mon. Not. R. Astron. Soc. 125, 367. Schatz, G. ( 1983). Astron. Astrophys. 122, 327.Feast, M. W, (1980). In Physical Processes in Red Gian is, Astrophysics and Smith, V. V. ( 1984). Astron. Astrophys. 132, 326.
Space Library, Vol. 88. edited by 1. Ibeii, Jr. and A. Rcnzini (Rcidel, Sinith, V. V., and Lamibert, D. L. ( 1985). Astropliys. 3. 294, 326.Dordrecht), p. 193. Smith, V. V., and Lamnbert, D. L. (1986). Astrophys. 3. 311, 843.
Feast, M. W. (1984). Mon. Not. R. Astron. Soc. 211, 5SIp. Smith, V. V., and Wallerstein, G. (1983). Astrophys. J. 273, 742.Ilackos, W. ( 1974). PubI. Astron. Soc. Pac. 86, 78. Spinrad, H., and Newburn, R. L., Jr. (1965). Astrophys .3141, 965.Hagen, W., Stencel, R. E., and Dickinson, D. F. (1983). Astrophys. J. 274, Spinrad, H., Pyper, D. M., Newburn, R. L., Jr., and Younkin, R. L. (1966).
286. Astrophys. J. 143, 291.Hoffleit, D., andlJaschek, C. ( 1982). Bright Siar Catalogue (Yale Universi- Stothers, R., and Leung, K.C. ( 1970). Astron. Astrophys. 10, 290.
ty, New Haven), Tech, 3. ( 1971). Natl. Bur. Stand. Monogr. No. 119.Holweger, H., and Kovacs, N. (1984). Astron. Astrophys. 132, L5. Utaumi, K. (1970). Pub!. Astron. Soc. Jpn. 22, 93.Humphreys, R. M. (1974). Astrophys. J. 188, 75. Utsuini, K. (1985). Ini Cool Stars ith/ Excesses of Hecavy Elements, Astro-Humphreys, R. M., and Ney, E. P. ([974). Astrophys. J. 194, 623. physics and Space Science Library, Vol. 114, edited M Jaschek and P.C.Glass, L. S., and Lloyd Evans, T. (1981). Nature 291, 303. Keenan (Reidel, Dordrecht), p. 243.Griffin, R. F. (1984). The Observatory 104, 224. Vardya, M. S. (1985). In Cool Stars wiith Excesses of Heavy Elemenis, As-[ben, I., Jr. (1983). Astrophys. J. Lett. 275, L63. trophysics and Space Science Library, Vol. 114, edited M. Jasclick and P.Iben, I., Jr., and Renzini, A. (1983). Annu. Rev. Astron. Astrophys. 21, C. Keenan (Reidel, Dordrecht), p. 105.
271. Wallerstein, G., and Fawley, W. M. ( 1980). Pub!. Astroit. Soc. Pac. 92.Johnson, H. R., and Ake, T. B. (1984). In Third C'ambridge Workshop on [83.
Cool Stars, Stellar Systems, and the Sun, edited S. L Baliunas and L. WVarner, 13. (1965). Mon. Not. R. Astron. Soc. 129, 26).Hartmann (Springer, New York), p. 362. Willson, L. A. (1982). In Pulsations iti Classical and Cataclysmnic Variable
Johnson, H. R., and Ake, T. B. (1986). In New Insights in Astrophysics- Stars, edited 3. P. Cox and Carl J. Hansen (JrLA, Boulder, CO). p. 269Eight Years of UVAstronmny thl IUE. ESA-51'-263. edited by E. Roulfe WiON01, It. E. ( 1953). General Catalogue of Stelar Rudiul V~lCiiiC 11 (Ci.(European Space Agency, Noordwijk), p. 395. negie Institution of Washington Pub!. No. 601 (Carnegie Insitution of
Keenaii, P. C. ( 1954). Astrophys. J, 120, 484. Washmingtoni, \Vaslington, DC).Keenan, P. C., and Boeshaar, P. C. (1980). Astrophys. J. Suppl. 43, 379. Wood, 1). R. (1985). In Cool Stars wit/h Excesses of Ileavy Elemnents, Astro-Keenan, P. C., Garrison, R. F., and Deutsch, A. 3. ( 1974). Astrophys. J. physics and Space Scietnce Library, Vol. 114, edited by M. Jaschiek and P'
Suppl. 28, 271. C. Keenan (Reidel, Dordrecht), p. 357.Kholopov, P. N.. editor ( 1985). General C'atalog of Variable Stars, 4th cd. Yamashita, Y. ( 1967). 1'ub]. Dom. Astrophys. Obs., Victoria, B3. C 13,47.
(Nauka, Moscow).
69

Appendix G
Maser Associated with Two Carbon Stars: V778 Cygni and EU Andromedae
71

accepted for publication by theAstrophysical Journal July 15, 1988 330:828-834
MASERS ASSOCIATED WITH TWO CARBON STARS: V778 CYGNI and EU ANDROMEDAE
Irene R. LITTLE-MARENIN
AFGL/OPC, Hanscom AFB and whitin Observatory, Wellesley college
Priscilla J. BENSON1
whitin observatory, Wellesley college and
Smithonian Astrophysical observatory
Dale F. DICKINSON
Lockheed Palo Alto Research Laboratory
Received: November 14, 1987
1 visiting scientist, Smithonian Astrophysical observatory, Center for
Astrophysics
73

ABSTRACT We present several observations of the 22.2 GlIz 1120 maser
line from two C stars, V778 Cyg and EU And, and the 1665/67 MHz O11
maser lines from V778 Cyg. For both sources the intensity of the
H20 line has varied by more than a factor of 5 over several months.
We interpret the systems as being binaries, each with an M star
component with a thick shell and a C ar cor-ponent.
Subject Headings: masers: water - masers: OH - stars: carbon - stars:
individual (EU And, V778 Gyg) -
2
74

Seven carbon stars are associated with oxygen-rich circumstellar material
(Little-Marenin 1986; Willems and de Jong 1986) as deduced from the presence
of strong 10 um and 18 pm emission features in their IRAS low resolution
spectra (Joint IRAS Science Working Group 1986). These stars are EU And
(C4,4), V778 Cyg (C5-,5), BM Gem (N), IRAS 08002-3803 (=CCCSl003=star 1003 in
Catalog of Cool Carbon Stars, Stephenson (1973)), IRAS 08577-6035 (=MaC79#11=
star 11, Table 2, MacConnell (1979)), IRAS 18006-3213 (=FJF270=star 270 of
Fuenmayor (1981), erroneously labeled FJF272 in Fig. 1 of Willems and de
Jong), and IRAS 19139+5412 (=NC#83=star 83 of Stephenson (1985))). We exclude
from the list two other stars mentioned by Willems and de Jong (1986). IRAS
10091-7049 =CCCS1633 maybe an S or MS star as mentioned by Stephenson (1973).
Also its 10-11 pm emission feature is more typical of MS stars rather than M
stars (Little , Little-Marenin and Price 1987). IRAS 13442-6109 (maybe
=CCCS2123) has an uncertain C position and Stephenson (1973) could not confirm
its C classification.
To better understand the unexpected phenomena of an oxygen-rich
circumstellar shell near a carbon-rich photosphere, we searched the four C
stars visible to the Haystack Observatory2 37 m telescope for H20 emission.
2Radio astronomy at Haystack Observatory of the Northeast Radio Observatory
Corporation is supported by the National Science Foundation under grant AST78-
18227.
The 616-523 1120 maser emission line 22,235.080 MHz wa detected towards EU
And (Benson and Little-Marenin 1987) and V778 Cyg (Littl-Marenin, Benson and
3
75

Little 1987; Nakada et al. 1987). We also searched LU And and V778 Cyg for Oil
maser emission with the NRAO 3 300'; the mainline 1665 and 1667 MHz OH maser
3 The National Radio Astronomy Observatory is operated by Associated
Universities, Inc., under contract with the National Science Foundation.
lines were seen towards V778 Cyg but not EU And (<0.07 Jy (3 a)).
I. OBSERVATIONS and RESULTS
Since March 1987 we have monitored EU And and V778 Cyg at Haystack
Observatory for H 20 maser emission. The spectra were automatically corrected
by the Haystack computer for atmospheric attenuation and for variation in
telescope gain with elevation. We observed the stars in total power mode with
5 minutes on and 5 minutes off source. The first detections of EU And
(12/15/86) and V778 Cyg (3/23/87) were obtained with an autocorrelator
bandwidth of 16.67 MHz with 512 channels, resulting in a resolution of 0.53 km
s- 1 which only marginally resolved the H 20 lines. Later observations were
usually made with a bandwidth of 5.55 MHz with 102 4 channels, resulting in a
velocity resolution of 0.09 km s- 1 . Pointing was checked twice daily with
observations of 3C84 and 3C374. We used a conversion factor of 12 Jy per
degree K (Haschick 1986).
H2 0 maser emission from V778 Cyg (R=20:35:07; Dec=+59:54:48 (1950)) was
first detected 1987 March 23 with a flux of 1.9 (.5) Jy at VLSR=-l 6 .8 (.1) km
s- . The formal errors of the Gaussian fits are in parenthesis. Since then
the intensity of the maser has increased to a value of 11 Jy on 1987 June 9.
Figure !a displays the temporal sequence of the V778 Cyg spectra. At times
the line has shown two additional components which are weaker by about a
14
76

factor of 3 to 5 at -20.5 km s-1 and -15.1 km s-1 . Figure 2a plots the peak
flux and integrated area for the three components as a function of Julian
date. The intensity of the weaker components tend to vary in phase with the
main water line. The parameters of the Gaussian fits to the observed lines
are summarized in Table 1; for weak lines we estimated the peak flux only.
Upper limits to the flux are estimated as being < 3 a. Table 1 and Figure 2a
include the data from the independent detection of V778 Cyg by Nakada et a!.
(1987) on 1987 April 30 with a peak flux of 7 Jy.
The 1665 and 1667 MHz OH observations of V778 Cyg were made at the 300
foot NRAO Greenbank telescope on 1987 July 13. The spectra were taken
simultaneously in two different polarizations for each line using the 384
channel autocorrelator split into four 92 channel sections. Standard
calibrations were used and the two polarizations were avcraged. The system
temperature averaged about 20 K. The bandwidth of 625 kHz for each segment
provided a velocity window of 113 km s- I and a resolution of about 1.5 km s 1 .
We detected the 1665 and 1667 MHz lines at about the same velocity as the H20
line. The intensity of the 1667 line of 0.26 K=0.195 Jy at -15.3 +/-1 km s "I
is almost twice as intense as the 1665 line of 0.15 K=0.113 Jy at -16.5 +/- 1
km s-1 see Fig. Ic.
The 22 GHz flux of EU And (RA=23:17:41; Dec=+46:58:00 (1950)) has varied
by at least a. factor of 8 between 1986 December and 1987 June (Figure Ib) with
the main component being below the detection limit of about 1.5 Jy on 1987
March 22 and very weak (-2 Jy) on 1987 May 19. On 1987 May 22 Nakada et al.
were unable to detect EU And at the 1.5 Jy level. At times EU And has shown
at least one other component at -31 km s- 1, once possibly another at -26 km s-
1 and on 1987 October 20 a possible component at -12.4 km s-1 EU And shows
5
77

greater temporal variations than V778 Cyg in the intensity of the main
component as can be seen in Figure 2b. The integrated flux has primarily been
decreasing for EU And (Fig. 2b) and primarily been increasing for V778 Cyg
(Fig. 2a) since we have been observing these sources. The water maser
receiver was unavailable at Haystack Observatory from 1987 mid-June until 1987
early October. Optically, both stars are quite faint with mP12-13. Their
optical variability types are only poorly established with EU And being
classified as SR and V778 Cyg as Lb. It is not known if their maser
variability correlates with optical variability.
BM Gem (RA=07:17:56; Dec=+25:05:03 (1950)) has been searched over a
velocity range of 10 to 190 km s-1 three times and IRAS 19139+5412
(RA=19:13:55; Dec=+54:12:06 (1950)) over a velocity of -180 to +180 km s-i
three times with negative results. Considering the variability of the H20
emission from EU And and V778 Cyg and the fact that both were detected during
our first try, we expect that both BM Gem and IRAS 19139 5412 have a very high
probability of being detected as maser sources if observed often enough.
II. DISCUSSION
Stellar wa~er masers are located in expanding circumstellar shells around
M Miras or semi-regular variables (Kleinmann, Dickinson and Sargent 1978; Reid
and Moran 1981; Dickinson and Dinger 1982; Bowers and Hagen 1984). H20
emission is highly variable in intensity both in space and in time (Gomez
Balboa and Lepine 1986; Johnston, Spencer and Bowers 1985) with the various
velocity components of the masers being located in different parts of the
circumstellar shell. Interferometric observations of the spatial distribution
of H20 maser spots indicate that the maser regions range from <9 - 100 AU
6
78

(average about 50 AU) in total extent around giants and from 300 -720 AU
around supergiants and show elongated structures as well as spherical symmetry
(Lane et al 1987). Assuming that the masers in V778 Cyg and EU And are
located in expanding shells, then half of our observed maser velocity range of
about 3 km s-1 should be the lower limit to the expansion velocity of the
shell in the masing region. Theoretical models of H20 masing regions around
giants (Cooke and Elitzur 1985) predict expansion velocities of about 3 to 6
km s-1 which correspond to a terminal velocity of about 10 km s"I in agreement
with our observations. The relatively simple structure and small velocity
difference between the H20 maser components argues strongly for the masers
being located around giants rather than supergiants. The galactic latitudes
of V778 Cyg and EU And (b=120 and -130, respectively) also support these stars
being giants since, in general, supergiant OH/IR stars tend to be strongly
concentrated towards the galactic plane with b<40 .
The mapping of the 1665/67 MHz OH and 22 GHz H20 masei; around the
supergiant VX Sgr shows that the two maser sources are at very similar
distances and have very similar outflow velocities (Chapman and Cohen 1986)
unlike the 1612 MHz OH emission which is about a factor of 10 further out.
Although we estimate that the H20 and OH masers for V778 Cyg are located
around a giant rather than a supergiant, we interpret the agreement between
our observed H20 and OH velocities for V778 Cyg as indicating that both types
of masers are located at roughly the same distance from the central star.
Other OH velocity components which correspond to the weaYcr H20 components are
not detectable at the OH velocity resolution of 1.17 km s-1.
If V778 Cyg and EU And are giants, then the material outflowing from the
central star will transit through the H20 and OH masing region (about 50/2=25
7
79

AU, (Lane et al. 1987)) in about 40 years if a conservative estimate of 3
km/sec for the expansion velocity in the masing region is assumed
(t(yr)-D(AU))*(4.74/v(km s-1 )). The transit time of material through the
silicate emitting region is estimated to be about 20-30 years for a similar
expansion velocity since circumstellar shell (hereafter CS) models predict
that the 10 wm emission comes primarily from a distance of, about 10 R, or
about 15-20 AU for M star Miras (Rowan-Robinson and Harris 1983a; Dyck et al.
1984).
There are two principle interpretations possible for the extraordinary
situation of having an oxygen-rich CS associated with a carbon-rich
photosphere.
A) We are observing a binary systems with a C star and an M star
companion with a relatively thick CS. The CS of the M star produces the 10
and 18 pm emission, and the H20 and OH maser lines. However, the CS absorbz
the visible light of the M star so that only light from the carbon star is
seen in the visible and near infrared region.
B) We are observing the transition of an M star to a C star so that we
still observe the O-rich material in the CS for .a brief time after the central
star has already become C-rich.
We favor (A), the binary system hypothesis, since the time scales for
hypothesis (B) to be correct are not compatible with the observations of the
outflow velocities and of the evolutionary time scales available to transform
M to C stars. First, V778 Cyg (=MSB38) and EU And (=D042999) were first
recognized as a carbon star in 1933 (Merrill, Sanford and Burwell 1933) and
before 1947 (Lee, Gore and Bartlett 1947), respectively. The outflowing
material at 3 km s-1 has traveled at least 30 AU since then and should have
8
80

passed through the silicate emission region by the time t',e IRAS observations
were made and is likely to have passed through the H20 and OH maser region.
Only in the very unlikely situation that both stars in 1933 and 1940 were
observed at the instance when the photosphere became carbon-rich without going
through an S and SC phase would we still see the remnant oxygen-rich shell in
the IRAS and maser data.
Second, the IRAS low resolution spectra of V778 Cyg and EU And are
indistinguishable from other M star spectra which show strong silicate
emission and are also H20 and OH maser e.g. R Cet and WX Ser. On the other
hand, S and SC star spectra are significantly different from M star spectra
(Little, Little-Marenin and Price 1987) suggesting very strrnly that we are
observing the 8-22 wm spectrum of an M star and not an S or SC star. Third,
abundance analyses of S and SC stars (Dominy and Wallerstein 1983; Smith and
Wallerstein 1983; Smith and Lambert 1986, Mathews et al. 1986; Winters and
Macklin 1987; Wallerstein and Dominy 1988) show that the distribution of the
observed s-process photospheric abundances imply several dredge-up episodes
during the asymptotic giant branch (AGB) lifetime of these stars which takes
on the order of 105-106 years. Similarly, since the observed s-process
enhancements in C stars are produced during several dredge-up episodes, it
would take longer than the transit time of material through the CS to produce
a C star from an M star. The location in an H-R diagram of Magellanic Cloud
AGB stars of intermediate-age globular clusters indicate a progression with
increasing luminosities of M->MS->S->(SC)->C (Wood 1985) i.e. there is no
evidence for a direct transition from M to C. Hence, we consider the scenario
of an instantaneous transition from an M to C star highly unlikely. This does
not mean that the scenario could not happen only that there is no evidence
9
81
• I II I I I I I

that it has happened either from evolutionary considerations or transit times
of material through the CS.
Fourth, Willems and de Jong (1986) argue that all C stars with strong 10
wm emission are J type C stars. i.e. stars with low 12C/13C ratios. However,
Utsumi (1985) finds that galactic C stars rich in 1 3C show no s-process
enhancements nor does the J type star Y CVn show lines of the radioactive
element technetium (Peery 1971). This suggests very strongly that the carbon
enrichment needed to produce J type C stars must have occurred before the
stars reached their AGB phase of evolution and that it occurred more than
5x10 5 years ago so that 9 9Tc had time to decay away. Hence, no C-rich shell
should yet be observable around J type stars.
We find support for the binary star hypothesis in the observed flux of
V778 Cyg at 1, 12, 25 and 60 wm. V778 Cyg shows the typical strong CN
absorption features of an Lb C star in the 0.8 - 1.08 pm region (Baumert
1972). The observed flux of about 11 Jy at 1.08 pm and 8 Jy at .78 Wm
(triangles in Fig. 3) and the IRAS color corrected fluxes of 26 Jy at 12 Wm,
14 Jy at 25 jm and about 1.5: Jy at 60 wm (open circles fn Fig. 3) can be
modeled quite well with a composite M and C star spectrum as can be seen in
Figure 3. Using the Rowan-Robinson and Harris dust shell models (1983a,b) for
a typical J type carbon star (Y CVn) and a typical M star Mira (WX Ser) with
strong 10 and 18 om silicate and H20 and OH maser emission, we find t.oit the C
star will dominate the emission shortward of about 5 Wm and the M star with
its shell will dominate longward of 5 um. The 100 jm flux of 9.8 Jy
(uncorrected) may be contaminated by infrared cirrus. No compo!:il¢e rnrvlpl c:rl
be calculated for EU And since no information on the near infrared spectrum of
EU And is available.
10
82

The binary hypothesis is also supported by the observed VLSR of the EU
And maser emission which differs from that of the C star by 24 km s- . We
interpret this as due partly to the orbital velocity of te two components.
Benson and Little-Marenin (1987) estimate the minimum orbital velocity
difference in the EU And system is 10 km s- 1. However, for V778 Cyg the water
maser velocity agrees with the velocity of the C star and may indicate that
the orbital plane of the system is more highly inclined and/or that the M and
C star components are presently moving across our line of sight and/or that
the two components are more widely separated. Deguchi et al. (1987) have
confirmed that the position of the water maser source around V778 Cyg agrees
with the photographic position of the C star within 0."5, implying that the
two components of V778 Cyg could be separately seen if less than 50-500 AU
apart at a distance of 102-103 pc. Peery's (1975) estimate of a 1.4 Kpc
distance for V778 Cyg makes it even less likely that the binary components
could have been separately reen. Assuming typical C and M star iira masses of
< 3 Mo (Ml+M2 <6 Mo) (Willson 1982) and a separation of around 2 x 30 AU (so
that the water masing region will be gravitationally bound to the M star), we
estimate Porb > 200 years. This value is reasonably con:Lstent with Porb <
about 190 years for EU And if we assume a Vorb > 10/2 km s- I and a=30 AU in a
circular orbit.
IRAS. color-color plots separate O-rich from C-rich circumstellar
material. The IRAS colors defined by Olnon et al. (see Table 2) place the
four C stars among those with O-rich CS; specifically they lie on the blueward
extension of the newly discovered OH masers with similar colors (Lewis, Eder
and Terzian 1985) close to or within the location of the optical Miras with
periods usually <5 0 0d . This suggests that the M stars as-ociated with the
11
83

water masers in the V778 Cyg and EU And systems are likely to be Mira
variables with periods in the 4 0 0-5 0 0d range. A similar conclusion was reached
by Benson and Little-Marenin (1987) from an analysis of other stars with
similar strong 10 and 18 pm emission features as V778 Cyg and EU And.
Deguchi et al. (1987) suggest that V778 Cyg is probably not a binary
system because companions may perturb the CS enough to inhibit maser emission.
The examples they give, o Cet and R Aqr, have (probably) hot white dwarf
companions and their weak H20 and SiO maser emission is likely to be due to
their hot companions. However, we note that H20 and OH masing regions are
found around some binary M Miras e.g. X Oph, R Hya and W Hya (Proust,
Ochsenbein and Pettersen 1981) and we suggest that EU And and V778 Cyg are
systems more like the binary M Miras.
III. SUMTARY
The presence of H20 maser emission and strong 10 and 18 pm silicate
emission features towards EU And and V778 Cyg and 1665/67 MHz OH maser
emission towards V778 Cyg indicate the presence of oxygen-rich material in the
vicinity of a carbon-rich photosphere. We interpret the observations as being
due to a binary system with a C star and an M star compornnt. The CS of the M
star absorbs the visible light of the star and allows the detection of the C
star in the optical and near infrared region. This interpretation is aided by
the observed 1, 12, 25 and 60 pm fluxes of V778 Cyg, which successfully fit a
composite M and C star spectrum, and the >10 km s-1 difference between the
radial velocity of EU And and the H20 maser velocity. We find the suggestion
that we are observing the transition from an M star to a C star to be unlikely
since the time scales of material in transit through the silicate and maser
emission region is too short for oxygen-rich material still to be found in
12
84

this region. This scenario also assumes that the MS, S and SC stages of
stellar evolution are by-passed in these stars. Abundance analyses of these
types of stars suggest the contrary.
The arguments presented above are suggestive but do noL constitute a
definite proof of the binary hypothesis over the M->C tra:isition model. We
suggest two observations which could help to resolve this issue: 1) The
detection of SiO maser emission from any of these C stars would greatly weaken
the M->C transition model because SiO masers are located in the closer warmer
part of the CS shell, usually within 2 R, (<10 AU). Material would transit
through this region in about 10 years, which is incompatible with the 40 years
since classification. SiO emission has been searched for with negative
results in EU And, V778 Cyg and BM Gem by us and Nakada et al. (1987).
However, considering the variability of maser emission from these sources, we
suggest that they be monitored. 2)Spectroscopic observations in the 3 and 4
wm region should show evidence for the presence of an M star companion, since
we estimate that the cross-over in flux between an M and a C star should occur
between 2 and 5 .m (Figure 3). Around 4 wm, photospheric absorption bands of
SiO are observed in oxygen-rich M stars but not in C and SC stars (Rinsland
and Wing 1982) whereas absorption bands due to C2H2 and HCN are found around
3.1 wm in C stars and not in M stars (Noguchi et al. 1981). The detection of
the 3.1 wm absorption bands e.g. in BM Gem, does not exclude the presence of
an M star since in this region M stars show featureless continua. Even if an
M star contributes a large amount to the total flux (say <50%), we should
still detect the absorption features from the C star.
We would like to gratefully acknowledge helpful discussions with A.
Haschick, the assistance of the telescope operators at Haystack Observatory
13
85

and NRAO. IRL-M would like to thank the Air Force Office of Scientific
Research for a University Resident Research Fellowship to the Air Force
Geophysics Laboratory. PJB thanks the Smithonian Astrophysical Observatory
for hospitality during her leave year and the NSF for support of this work
under grant AST-86104.
14
86

TABLE IObservations of the 22 GHz H20 maser line
JD+ Vmain V Flux Vl)luT Flux Vred Flux Area RMSDate 2400000 km s-I FWHM Jy km s- Jy km s-1 Jy W/m2x0 -2 2 Ty
EU And1 2/1 5/8 6a 46778 -29.40 0.67 8.2 53 0.61/23/87 46819 -29.67 0.52 5.6 -31.2 3.0 -26.0 3.0 57 0.93/22/87 46877 ---- -- <1.5 -31.4 2.0 10 0.54/16/87 46908 -29.79 0.49 6.4 -31.0 3.5 23 0.85/ 4/87 46920 -29.82 0.45 5.5 24 0.85/19/87 46935 -29.8: -- 3.6: 12 0.75/22/87b 46938 -- <1.5 --- --
6/ 9/87 46955 -29.87 0.46 3.1 -30.9 2.2: 7 0.610/20/87 47089 -29.96 0.65 2.5 -31.0 1.9 -12.4 2.6 28 0.6
V778 Cyg3/23/87 a 46878 -16.82 1.1 1.9 18 0.54/16/87 46908 -16.93 0.63 7.9 -20.5 1.2: -15.1 1.2 43 0.74/3 0/8 7b 46916 -16.9 1.0 7.0 -2 0 .5b 1 .9c -15.1 c 2.3c ... ..5/ 4/87 46920 -17.01 .76 7.9 -20.6 2.9 -15.1 2.4 73 0.65/19/89 46935 -16.91 .64 7.5 -20.9: 1.6 -15: 1.6 35 1.26/ 9/87 46955 -16.94 .66 10.9 -20.7 3.6 -15.1 2.7: 124 0.6
err+/-5
no H20 emission detected
BM Gem IRAS 19 139+5 4 1 2d
3/23/87 < 2.7 Jy 3/23/87 < 1.3 Jy4/16/87 < 2.6 Jy 4/16/87 < 1.5 Jy4/30/87b < 2.1 Jy (=3xRMS) 10/20/87 < 1.2 Jy10/20/87 < 1.5 Jy
colons are used to indicate uncertain measurements
velocity resolution = 0.09 km s" I unless otherwise indicated
a) velocity resolution = 0.53 km s-1
b) observations by Nakada et al. (1987)
c) data read from Figure 1 of Nakada et al. (1987)
d) = NC#83 (Stephenson 1985)
87

TABLE 2IRAS colors
log -vS,(60)Ilog vS,(25) log vS,(25)/log vS,(12)
EU And -1.337 -0.417V778 Gyg -1.336 -0.543
BM Gem -1.220 -0.57119139+5412 -1.327 -0.560
88

17
REFERENCES
Baumert, J.H. 1972, Ph.D. thesis (Ohio State University).
Benson, P.J., and Little-Marenin, I.R. 1987, Ap.J. (Letters), 316, L37.
Bowers, P.F., and Hagen, W. 1984, Ap.J., 285, 637.
Chapman, J.M., and Cohen, R.J. 1986, M.N.R.A.S., 220, 513.
Cooke, B., and Elitzur, M. 1985, Ap.J.,295,175
Deguchi, S., Kawabe, R., Ukita, N., Nakada, Y., Onaka, T., Izumiura, H., and
Okamura, S. 1987 (preprint)
Dickinson, D.F., and Dinger, St. Clair A. 1982, Ap. J., 254, 136.
Dominy, J.F., and Wallerstein, G. 1986, Ap.J., 310, 371.
Dyck, H.M., Zuckerman, B., Leinert, Ch., and Beckwith, S. 1984, Ap.J., 287,
801.
Fuenayor, F.J. 1981, Rev. Mex. Astron. Astrof., 6, 83.
Gomez Balboa, A.M., and Lepine, J.R.D. 1986, Astr Ap., 159, 166.
Haschick, A. D. 1986, personal communication.
Johnston, K. J., Spencer, J. H., and Bowers, P. F. 1985, Ap. J. 290, 660.
Joint IRAS Science Working Group, Atlas of Low Resolution Spectra, Astr. AD.
(Suppl), 65, 607.
Kleinmann, S.G., Dickinson, D.F., and Sargent, D.G. 1978, Ao.s 83, 1206.
Lane, A.P., Johnston,K.L., Bowers, P.F., Spencer, J.H., and Diamond, P.J.
1987, (submitted to Ap.J.)
Lee, O.J. Gore, G.D., and Bartlett, T.J. 1947, Annals Dearborn Obs., 5, pt 1c.
Lewis, B.M., Eder, J., and Terzian, Y. 1985, Nature, 313, 200.
Little, S.J., Little-Marenin, T.R., and Price, S.D. 1987, Cool Stats, Stellar
Systems and the Sun, Fifth Cambridge Workshop (in
press).
89

18
Little-Marenin, I.R. 1986, Ap.J. (Letters), 307, L15.
Little-Marenin, I.R., Benson, P.J., and Little, S.J. 1987, Cool Stars, Stellar
Systems and the Sun, Fifth Cambridge Workshop (in press).
MacConnell, D.J. 1979, Astr. Ap. (Suppl), 38, 335.
Mathews, G.J., Takahashi, K., Ward, R.A., and Howard, W.H. 1986, Ap.J.,
302, 410.
Merrill, P.W., Sanford, R.F., and Burwell, C.G. 1933, Publ. A.S.P., 45, 3C6.
Nakada, Y., Izumiura, H., Onaka, T., lashimoto, 0., Ukitp, N., Deguchi, S.,
and Tanabe, T. 1987 (preprint).
Noguchi, K., Kawara, K., Kobavashi, Y. i)ii Li, I!., Sil iLo, s. 1J 1 IV.
Astr. Soc. Japan, 33, 373.
Olnon, F.M., Baud, B., flab'ng, H.J. , De Jong, D., Harris, S. , Pottasch, S.2.
1984, Ap.J. (Letters), 278, L41.
Peery, B.F. 1971, Ap.J., 163, Li.
Peery, B.F. 1975, Ap.J., 199, 135.
Proust, D., Ochsenbein, F., and Pettersen, B.R. 1981, Astr. AT. (SuDpl.), /44
179.
Reid, M. J., and Moran, J. M. 1981, Ann. Rev. Astr. Ap., 19, 231.
Rinsland, C.P., and Wing, R.F. 1982, Ap.J., 262, 201.
Rowan-Robinson, M., and Harris, S. 1983a, M.N.R.A.S., 202, 767.
Rowan-Robinson, M., and Harris, S. 1983b, M.N.R.A.S., 202, 797.
Smith, V.V. and Lambert, D.L. 1986, Ap.J., 311, 843.
Smith, V.V., and Wallerstein, G. 1983, Ap.J., 27 , 742.
Stephenson, C.B. 1973, Pub. Warner & Swasev Ohs.q, Vol Io. 1.
----------- 1985, A.J., 90, 784.
(y)

19
Utsumi, K. 1985, Cool Stars with Excesses of Heavy Elements, Ap. Space Sc.
Library, Vol 114., (eds M.Jaschek and P.C. Keeran)
(Reidel:Dordrecht), p. 243.
Wallerstein, G., and Dominy, J.F., 1988 (in press).
Willems, F.J., and de Jong, T. 1986, Ap.J. (Letters), 309, L39.
Willson, L.A. 1982, in Pulsations in Classical and Cataclysmic Variable Stars,
ed. J.P. Cox and Carl J. Hansen (Boulder, CO:JILA), p. 269.
Winters, R.R., and Macklin, R.L., 1987, Ap.J., 313, 808.
Wood, P.R. 1985, Cool Stars with Excesses of Heavy Eleme ts, Ap. Space Sc.
Library, Vol 114., (eds M.Jaschek and P.C. Keenan)
(Reidel:Dordrecht), p.357.
91

20
FIGURE CAPTIONS
Figure 1. The temporal sequence of maser spectra. la) The 22 GHz spectra of
V778 Cyg between 23 March and 9 June 1987. ib) The 22 GHz spectra of EU And
between 15 December 1986 and 9 June 1987. ic) The 1665 and 1667 MHz OH spectra
of V778 Cyg.
Figure 2. The variation of the 22 GHz maser flux as a function of Julian Date.
2a) (top panel) The integrated area of the V778 Cyg 22 GHz line from 3/23/87-
6/9/87. (bottom panel) Solid circle - peak flux of mai-i component at -16.9
km s-1 (solid line). Open Circles - the peak flux of the blueshifted component
at -20.5 km s- I (dotted line). Triangles - peak flux of the redshifted
component at -15.1 km s-1. 2b) (top panel) The integrated area of the EU And
22 GHz lines from 12/15/86-10/20/87. (bottom panel) Solid circle -peak flux at
-29.7 km s-1. Open circle-blueshifted component at -31.1 km s- . Triangle -
redshifted component at -26.0 km s-1 .
Figure 3. Composite flux calculated from the dustshell models for Y CVn and WX
Ser. Triangles -- the observed 0.78 pm and 1.08 pm flux (Baumert 1972); Solid
Circles -- the IRAS fluxes at 12, 25 and 60 wm of V778 Cyg.
92

21
ADRESSES:
Dr. Priscilla J. Benson, Whitin Observatory, Wellesley College, Wellesley, MA
02181
Dr. Dale F. Dickinson, Org. 92-20-205, Lockheed Palo Alto Research Lab., 3251
Hanover St, Palo Alto, CA 94304
Dr. Irene R. Little-Marenin, Whitin Observatory, Wellesley College, Wellesley,
MA 02181
93

0
Lii
0
(0
ZLJN co
I toI
DOC
0 0
c
0
Ir 0
0o0 000 0 00 0 0o C R ~0 MOX( ~
(?,Zqlxz~wM) V38V (Amr xnm
94

EU And (b)
8 22 GHz
6-1
4 12/15/86
2
V778 Cyg (022 GHz 1/23/87
In -i43/2/22/87
wlI I~' - I 1665'l
5 4/16/87 005 Cy-0.2
~0
5 - 4 - -4 16 8
5/4/8 C 2 0105
10 r 0 . 67
5/98 5 /4/87 0 ~-~
00 02 2 -5
5 95

0
c'J
DJ(.
o- 0~
00
C(\J
(Ar) xrnm
96,

Appendix H
Emission Features in IRAS LRS Spectra of MS, S and SC Stars
97

submitted to the Astrophysical Journal 333:305-315
EMISSION FEATURES IN IRAS LRS SPECTRA OF MS, S AND SC STARS
Irene R. LITTLE-MARENIN
Air Force Geophysics Laboratory/Optical Physics Division,
Celestial Background, Hanscom AFB, MA 01731 and
whitin Observatory, Wellesley College, Wellesley, MA 02181
Stephen J. LITTLE
Department of Natural Sciences, Bentley College, Waltham, MA 02254
Received: January 14, 1988
99
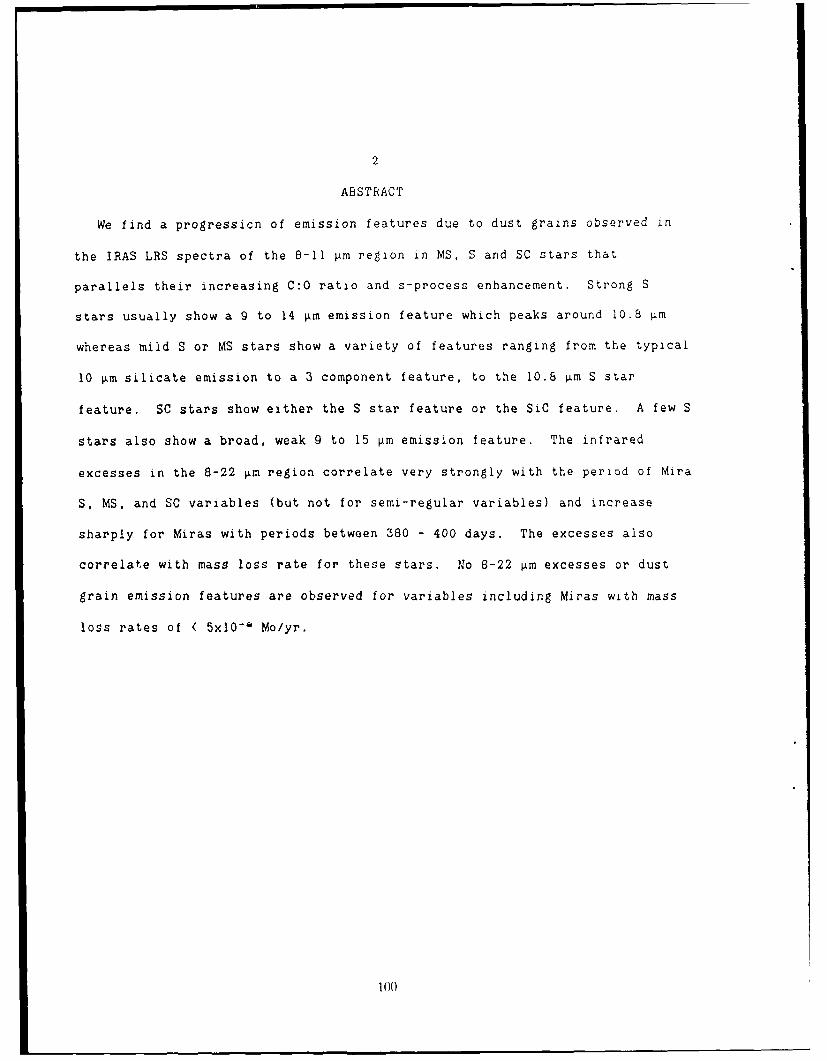
2
ABSTRACT
We find a progression of emission features due to dust grains observed in
the IRAS LRS spectra of the 8-11 tm region in MS, S and SC stars that
parallels their increasing C:O ratio and s-process enhancement. Strong S
stars usually show a 9 to 14 Vm emission feature which peaks around 10.8 Im
whereas mild S or MS stars show a variety of features ranging from the typical
10 Vm silicate emission to a 3 component feature, to the 10.6 ±m S star
feature. SC stars show either the S star feature or the SiC feature. A few S
stars also show a broad, weak 9 to 15 im emission feature. The infrared
excesses in the 8-22 tm region correlate very strongly with the period of Mira
S, MS, and SC variables (but not for semi-regular variables) and increase
sharply for Miras with periods between 380 - 400 days. The excesses also
correlate with mass loss rate for these stars. No 8-22 km excesses or dust
grain emission features are observed for variables including Miras with mass
loss rates of < 5x10l ' Mo/yr.
100

3
I. INTRODUCTION
Stellar evolution theory predicts (Iben and Renzini 1983) and observations
confirm that M stars evolve to MS-> S-> (SC)->C stars during the late stages
of AGB evolution (Wood 1985) when helium shell flashing occurs and helium-
burning products, primarily "=C, s-process elements and technetium are mixed
with the outer envelope during the third dredge-up phase. The C:O ratio of
stars during the transition changes from -0.4 (M stars) to -0.6 (MS stars)
(Smith and Lambert 1985, 1986) to -0.8 (S stars) (Smith and Lambert 1986) to
-1.0 (SC stars) (Keenan and Boeshaar 1980; Dominy, Wallerstein and Suntzeff
1986) and finally to -1.05-1.1 (C stars) (Lambert et al. 1986). At the same
time the s-process elements are enhanced from solar abundances to as much as
10-100 times soiar in the carbon stars ISmith and Lambert 1985, 1986; Smith
and Wallerstein 1983; Dominy and Wallerstein 1986; Utsumi 1985). It is
estimated that about 4-15 helium shell flashing episodes with subsequent
mixing are necessary to change an M star into an S star or SC star (Smith and
Lambert 1986; Mathews et al. 1986; Winters and Macklin 1987; Wallerstein and
Dominy 19.88) although some stars may skip over the SC evolutionary phase.
Many late AGB stars lose mass rapidly and develop extensive circumstellar
dust shells (CDS). The changing photospheric composition of the AGE stars
should be reflected in the composition of the dust grains found in the CDS
(Little, Little-Marenin and Price 1987) since their lost photospheric material
passes through the CDS on a time scale of <1000 years -- a short time compared
to the time of 104-10" years between He shell flashes (Iben and Renzini 1983).
101
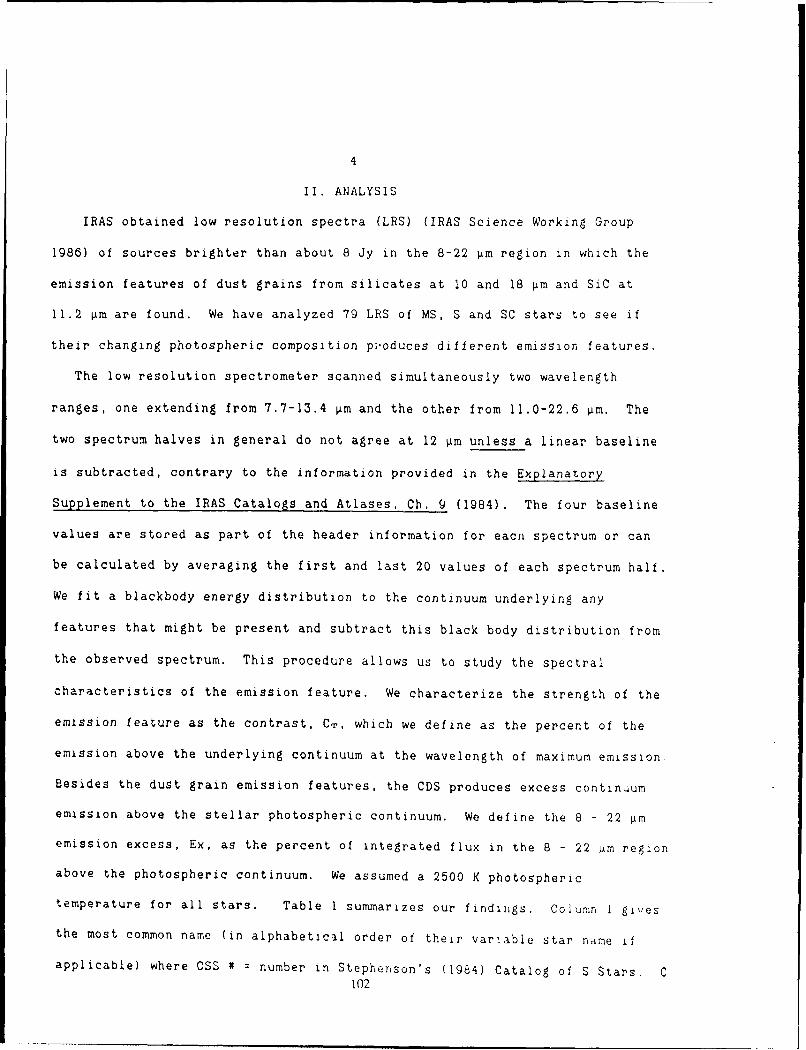
4
II. ANALYSIS
IRAS obtained low resolution spectra (LRS) (IRAS Science Working Group
1986) of sources brighter than about 8 Jy in the 8-22 urm region in which the
emission features of dust grains from silicates at 10 and 18 m and SiC at
11.2 Vm are found. We have analyzed 79 LRS of MS, S and SC stars to see if
their changing photospheric composition p.oduces different emission features.
The low resolution spectrometer scanned simultaneously two wavelength
ranges, one extending from 7.7-13.4 .im and the other from 11.0-22.6 Vm. The
two spectrum halves in general do not agree at 12 urm unless a linear baseline
is subtracted, contrary to the information provided in the Explanatory
Supplement to the IRAS Catalogs and Atlases, Ch. 9 (1984). The four baseline
values are stored as part of the header information for eacn spectrum or can
be calculated by averaging the first and last 20 values of each spectrum half.
We fit a blackbody energy distribution to the continuum underlying any
features that might be present and subtract this black body distribution from
the observed spectrum. This procedure allows us to study the spectral
characteristics of the emission feature. We characterize the strength of the
emission feature as the contrast, CT, which we define as the percent of the
emission above the underlying continuum at the wavelength of maximum emission.
Besides the dust grain emission features, the CDS produces excess continium
emission above the stellar photospheric continuum. We define the 8 - 22 im
emission excess, Ex, as the percent of integrated flux in the 8 - 22 4m region
above the photospheric continuum. We assumed a 2500 K photospheric
temperature for all stars. Table I summarizes our findings. Column I gives
the most common name (in alphabeticil order of their variable star name if
applicable) where CSS # number in Stephenson's (1984) Catalog of S Stars. C102

1633 is listed in Stephenson's (1973) catalog of carbon srt's; however, its
LRS spectrum does not show an SiC feature but instead a comprient featur,
and we assume it to be an MS star. Columns 2 and 3 give the spectral type,
variability class and period as listed in the General Catalog of Va-iable
Stars (GCVS) (Kholopov 1985), Wing and Yorka (1977) or the Yale Bright Star
Catalog (Hoffleit and Jaschek 1982). Column 4 lists the derived temperature
of the underlying continuum in the 9-14 im region. For abuut 80% of the stars
with emission features the temperature lies between 600-1000 K. At times more
than one temperature is needed to characterize the CDS which produces the 8-22
Lm emission excesses, a hotter temperature (T>1500 K) for .he 8-9 sim region
and a cooler temperature (T(500 K) for the 14-22 Vm region. Column 5 lists
the contrast, CT, of any emission feature and column 6 gives the type of
feature observed and, in parenthesis, the wavelength of peak emission. The
various types of emission features, such as "S" for the most common S star
feature, the 3 component feature and a broad (br) 9-15 pm emissi-n feature are
discussed in greater detail below. "Sil" refers to the 10 Vm silicate emission
feature observed in the LRS of M stars and SiC to the 11.2 vm feature observed
in C stars. Dashes in column 5 and 6 indicate no emission f-ature is observed
and a question mark (M) an emission feature that is difficult to c!,aract rize.
Column 7 lists the emission excess, Ex, above the photospheric cortinuum .n
the 8-22 Am region. In column 8 we list the flux in Janskyz at im as
measured in the LRS since Gal et. al (1987) suggest that the strength of the
10 um silicate emission feature in M variables correlates with the flux a* t
im, i.e. that the more distant stars (lower F(B Vm)) selectively show the
stronger emission features. No such correlator appears to exist for the S,
MS and SC stars except that, as expected at low flux levels, FiB um)< 2U y,
103

only the stronger emission features with CT> 20% are detectable above the
noise. Column 9 lists the wass loss rates as calculated by Jura (1987);
column 10 gives the percent of 10 Vm silicate emission needed to match the
observed S star dust grain feature (discussed below). An asterisk in column 11
indicates a remark at the end of Table 1.
We will exclude from the rest of the discussion .e 6 stars listed in Table
1 as spectroscopic MS stars as defined in Little, Little-Marenin I!d Bauer
(1987). These stars show neither enhanced s-process abundances n,-r Tc (Smith
and Lambert 1986; Little, Little-Marenin and Bauer 1)87). They are likely to
be misclassified M stars, or their MS classification, if correct, is most
likely produced by unusual atmospheric conditions. Their LRS are typical of
non-variable or low-amplitude early (<M4) M stars with no indication of a CDS,
i.e. no emission features are visible and their 8-22 pm fluxes are extensions
of their photospheric fluxes (T - 2000-4000 K). RT Aql is also excluded from
the discussion since it is most likely a misclassified M star and not an MS
star. It has no Tc and Keenan, Garrison and Deutsch (1974) observed no ZrO.
Its LRS shows the typical 10 and 18 m silicate emission features found in
many variable M stars.
About one third of the remaining 72 spectra show only a smooth 8-22 pm
continuum which can, for most stars, be matched with a 2000K to 3000K
blackbody energy distribution representative of the photospheric temperatures
of these stars. The other two-thirds of the spectra show emission features of
weak to moderate strength. As expected from the studies of M stars, we find
that 7 out of the 8 non-variable S and MS stars have featureless photospheric
continua. Only BD-380 4770 shows a definite emission feature probably due to
SiC. It is the only known S star with a pure SiC emission feature and needs
104

7
to be investigated further to see whether it is a misclassified C or SC star.
It also may be an unrecognized variable star even though IRAS estimated only a
12% probability of it being variable in the infrared, similar to the
probabilities observed for the other non-variable stars. Unexpectedly, four
out of 23 (17%) S, MS and SC Mira variables show no emLssion features and no
8-22 Lm excess. These are V865 Aql (S7,5e:, P=365"), T Cam (S4,7e, P=373'), U
Cas (S3,5e, P=2771) and S Her (M6(S) P=307'). A few other stars show a
cooler, featureless continuum including the two Miras, X And (S3,9 P=3 46"
T=1200 K) and R Gem (S3,6 P=370' T=800 K), in which a small infrared excess is
present but no dust grain emission feature is observed. Hence stars wi,.'
featureless continua include all types of stars from the non-variables to the
Miras.
III DISCUSSION
The S, MS and SC stars can be divided into three groups: a) 20 stars with
featureless 2000 - 4000 K photospheric continua in the 8-22 jim region
(discussed above); b) a few stars with featureless continua and cooler than
photospheric temperatures (T between 1200 K and 700 K) in the 8-22 Vm region;
and c) 45 stars with emission features. A few stars defy the above
classification scheme and are discussed in the remarks to Table 1.
The IRAS low resolution spectra are characterized according to the shape of
their energy distribution and type of emission and absorption features
observed in the 8-22 vm region. Spectra with typical oxygen-rich silicate
dust grain emission features extending from 8-14 m with a maximum around 10
gm are characterized as 2n where n=l-g measures the strength of the 10 Im
emission. Many also show the 18 Vm emission due to the bending mode of
silicates. Spectra with a carbon-rich, SiC dust grain emission features
105

8
extending from 10-14 Itm and a maximum at 11.2 lim are characterized as 4n where
nl-g measures the strength of the SiC feature. No other dust grain emission
features were recognized in the LRS characterization since none were known;
see the Explanatory Supplement to the IRAS Catalogs and Atlases, 1984, chaptpr
9, for a complete discussion of the 10 different classes. Among the S, MS and
SC stars, we find three additional types of weak emission features 1) an
emission feature extending from 9-14 im that peaks in general around 10.8 am
but the maximum can vary from 10.3 to 11 am, 2) a three component feature
extending from 9-14 mn, with peaks at 10 m, 11 am and 13.1 am (Little-Marenin,
Little and Price 1986), and 3) a broad, weak 9-15 m emission feature with a
poorly defined maximum around 11.4 Vm. None of these three features match the
narrower (smaller FWHM) spectral characteristics of the typical silicate or
SiC emission.
1) The 10.8 m S star feature
The emission features found in the spectra of S stars in general are weak
with an average contrast, CT, of about 27%. In strong S stars, those with
abundance classes between 4 and 9 (i.e. Sx,4 to Sx,9), emicsion features peak
between 10.3-11 urm and have a FWHM value of about 2.4 pm. We will refer to
this feature as the S star feature, and we list its wavelength peak in column
6, Table 1. Thomas, Robinson and Hyland (1976) noted this type of feature in
the spectrum of pi* Gru. The LRS of S Cas (S4,6) (Figure 1) illustrates a
typical spectrum of this type. The top panel shows the observed spectrum, a
550 K black body energy distribution fitted to the continuum underlying the
emission feature, and the difference spectrum (observed - black body) plotted
along the wavelength axis. We know of no laboratory spectrum of grains that
produces the S star emission feature. However, Gehrz et al. (1984) noted an
106

9
emission feature in Nova Aquilae 1982 with a peak at 10.5 pm. The shape of
the Nova Aquilae emission feature appears to be similar to that of S stars.
The high abundances of heavier elements in the Nova (Snijders et al. 1984)
suggests that both the S star and the Nova Aauilae feature are Droduced under
similar conditions in CDS and/or by the same carrier. We find it unlikely that
the feature is due to SiC as suggested by Gehrz et al. (1984) or due to
silicates as suggested by Bode et al. (1984) since the wavelength dependence of
the Nova Aquilae emission feature agrees with neither (see Figure 5 and 6 in
Gehrz et al.). It is possible that silicates combined with an s-process
element such as Ba, Zr etc may be responsible for the feature in both the S
stars and Nova Aquilae. Unfortunately no s-process elemental abundances could
be determined for Nova Aquilae. On the other hand, we find that the feature
observed in S star LRS spectra can be modeled reasonably well by a co-addition
of the 10 pm silicate feature and the 11.2 gm SiC feature. The percentage of
silicate emission necessary to produce the co-added feature varies from star
to star, but tends to lie in the 50/-70% range and is listed in Table 1,
column 10. The percent of SiC equals 100 minus the percent of silicate. This
simple co-added model fits the width of the feature reasonably well, but is
less able to reproduce the smooth emission peak observed in S stars as can be
seen in the bottom panel of Figure I where the normalized emission feature of
S Cas is well modeled with a combined feature of 55% silicate and 45% SiC. It
is unclear whether the co-addition of silicate and SiC emission is a valid
characterization of the S star feature; it is usually assumed that SiC and
silicate dust grains cannot co-exist in chemical equilibrium in CDS.
Wing and Yorka (1977) argue that surveys of S stare and MS stars are
incomplete based on their analysis of IRC (Neugebauer and Leighton 1969) S
107

10
stars. It is possible ZrO bands were absent on the date of observation or
were missed on objective prism plates. Hence, we have collected in Table 2,
twenty-six variable stars with show the 10.8 Vm 6 star feature but are
classified as M stars. These stars should be re-investigated in order to see
if the presence of the 10.8 gm feature can be used as a classification
criteria for S stars.
2) the 3 component feature
Some of the S stars with emission features and abundance classes of I to
2, the Sx,l class is also referred to as MS stars, show a 3 component feature
with peaks at 10 ±m, 11 Lm and weakly at 13.1 m and in some cases a longer
wavelength feature that peaks around 19 Vm. The intensities of the components
relative to each other vary, but in general the ratio of the 10 to 11 Vm
feature lies between 1.0 and 1.4. These features are clearly different from
the 10 and 18 Vm silicate emission feature found in many M star spectra. The
short wavelength side of the 3 component feature is similar to the M star 10
im emission but shows considerably more emission longward of 10.5 im with a
r.,K-TM (3 comp.)=2.7 Vm as compared to a FWHM (10 lm)= 2 tm. In contrast, the
18 gm silicate feature is broader (FWHM=5.4 Vm) than the 19 Vm feature
(FWHM=4.4 1m), but it is possible that we underestimate the width of the 19 Vm
emission since the feature is weak and the LRS do not extend beyond 22 Vm. If
the 3 component and the 19 Vm feature are produced by a dust grain of
differing composition and/or a different size distribution is not yet known.
MgSiO annealed in vacuo can show structure around 10 jim at times with
additional components at 9.2 and 11.2 Vm (Nuth, Donn and Nelson 1986). Since
the 3 component feature shows no peak at 9.2 gm we are probably not observing
annealed MgSiO. However, it is possible that a similar process operating on a108

11
different compound produces the 3 component feature. Figure 2 shows the 3
component feature in the LRS spectrum of RT Sco (S7,2) matched with a 700K
blackbody energy distribution. The difference spectrum is plotted along the
wavelength axis. The bottom panel of Figure 2 shows the comoosite 3 component
feature of several Sx,l and Sx,2 sta.,s. It is very similar to the 3 cu..p"inent
feature found in about 15% of the M stars with emission features (Little-
Marenin, Little, and Price 1986). Since weak ZrO bands in MS stars can be
missed on objecti,e prism spectra, it is possible that all M stars with 3
component features are unrecognized MS stars.
3) The broad 9-15 im feature
The three S stars, Z Ant, V635 Sco, and CSS 975, show a broad 9-15 Lm
emission feature. The poorly defined peak tends to have a maximum around 11.4
vm and features are identified as "br" in Table 1, column 6 with the
wavelength peak enclosed in square brackets. Roughly 30%-40% of variable
stars with an LRS characterization of 14, 15, and 16 show this broad, weak
type of emission. (An LRS characterization of In is supposed to indicate a
blue featureless spectrum with n=1-9 being two times the spectral index. Only
spectra characterized as 18 or 17 show, with few exceptions, no emission
features. Over 50% of all the other spectra characterized as In tend to show
weak, broad emission features.)
VI. MS STARS and SC STARS
Of the 26 MS stars listed in Table 1, only RS Cnc has a pure 10 i.m silicate
emission feature. Four other stars show various versions of the 3 component
feature, five show the star feature and three the broad 9-15 m feature.
Most of the rest of the stars have featureless continua which are matched with
109

12
photospheric temperatures with the exception of T Cet. Its spectrum shows an
excess longward of 9 tm, but no distinct emission feature.
It appears that the dust grain emission features found in MS stars span the
range of features found among the M and S stars. Since M stars evolving to MS
and S stars are estimated to be AGB stars experiencing the third dredge-up,
which produces an increase in s-process elements and carbon, we suspect that
the observed range of dust grain emission features in MS stars is related to
the change in the photospheric composition of the parent star.
Among the 7 SC stars listed in Table 1, we find 3 (FU Mon, GP Ori and CSS
788) which show a photospheric continuum and the other four show emission
features. In figure 3 we plot the observed LRS of S Lyr, UY Cen and R CMi
along with blackbody energy distributions representative of their underlying
continua and their difference spectra. The normalized difference spectra of
the three SC stars are overplotted with different C star emission features
(bottom panels). S Lyr and UY Cen show the 10.8 .m S star feature which can
be matched by a 45 % and 35 % silicate plus 55 % and 65 % SiC feature,
respectively (Figure 3a and 3b, bottom panels). In addition the spectrum of
UY Cen is best understood as also having an absorption feature around 14 Lm
(Figure 3b) attributed in some C stars to C2 H2 and HCN by Willems (1987).
Similarly, FU Mon appears to show the C2H2 and HCN absorption feature but no
emission feature. The apparent 8-9 Vm emission feature seen in S Lyr (Figure
3a bottom panel) is an artifact because we assumed a single temperature for
the CDS in the 8 - 22 vm region. A temperature of 2500 K is needed to fit the
8-9 vm region and a temperature of 640 K to fit the 10-22 vm region. S Lyr
appears to be more closely related to the S stars since no obvious C star
characteristics are present and Catchpole and Feast (1971) find that ZrO is
110

13
stronger in the spectrum of S Lyr than in UY Cen. UY Cen shows both S star
and C star characteristics. R CMi may have a nearly pure SiC emission feature
(Figure 3c bottom panel) seen in C star LRS, but its spectrum is very noisy
and it is difficult to be certain. R CMi also has been classified as a
marginai carbon star. A weak emission feature is present in the LRS of AM
Cen, but the feature is too weak to classify accurately.
As found for the MS stars, the emission features observed in SC star
spectra may reflect the changing photospheric composition of stars evolving to
C stars. We have not distinguished between SC and CS stars.
V. STARS STRONG 10 im EMISSION
TT CMa, CSS 1146 and CSS 1259 have very strong 10 m silicate emission
features. atypical of the other S stars, with a contrast CT Of 100%, 140% and
100% respectively. CSS 1146 appears to be incorrectly listed as an S star in
Stephenson's (1984) catalog. Its spectrum appears to be late M (Allen et al.
1977; Pesch private communication). Nothing unusual is known about the two
other stars; both TT CMa and CSS 1259 show LaO bands on objective prism
plates. It is possible that the latter two objects are binary stars with
components close in mass, as has been suggested for the C stars which show
very strong 10 and 18 Vm emission features in their LRS (Benson and Little-
Marenin 1987; Little-Marenin, Benson and Little 1987; Little-Marenin, Benson
and Dickinson 1987). The silicate emission is hypothesized to come from an M
star with a CDS which depresses its visible light so that the S star is
predominant in the visible and near infrared region. Since the spectra of M
and S stars are very similar in the 2-5 Vm region, it will be very difficult
tcd s ctroscopically di -zti -.uish between an M and S star component in 2-5 .Im
spectral range where the cross-over in flux between the S star and the M star111

14
component is estimated to lie. In IRAS color-color plots (see for example
Zuckerman and Dyck 1986), TT CMa and CSS 1250 are located among the M stars
and not among the other S stars suggesting that their CDS are more
characteristic of the oxygen rich material of M stars than of the material
located around S stars.
VI. PERIOD VERSUS 8 - 22 pm EXCESS
We searched for a correlation between the infrared 8-22 jim excess of S, MS
and SC Miras and their period. We defined the 8-22 i.m excess as the percent
of integrated flux in the 8-22 ptm region that lies above the estimated
photospheric continuum and is listed in Table 1, column 8. We assumed a 2500
K photospheric temperature for all the stars since in the 8-22 pm region the
shape of the black body energy distribution varies very little for T>2000 K.
We normalized the black body energy distribution to the observed spectrum at 8
.im, i.e. we are assuming that at 8 Vm we are observing emission from the
photosphere only. This is a reasonable approximation for spectra with weak
EMIssion features but it underestimates the excess for spectra with strong
emission features since models for these have shown that the CDS can
contribute significantly to the flux at 8 Vm. Varying the adopted
photospheric temperature from 2000K to 3000K produced an uncertainty in the
derived 8-22 Vm excess by about 10%. However, the uncertainties in the
excesses are as much as 20% - 30% for stars with low S/N LRS (those with 8 pkm
fluxes of (15 Jy) since it is difficult to determine the continuum
temperature. It is also difficult to define weak emission features in these
noisy spectra.
Figure 4 shows the 8-22 pim excess plotted against the period f-', Mira,
(open circles) and SR variables (crosses). A clear trend can be seen. S, MS
112

15
and SC Miras with P) 400' have excesses that are larger than 40. and Miras
with P< 3 7 0 1 have excesses usually less than about 15%. In the 370-4001 range
the amount of excess for Miras rises sharply. No trend with period is
observed for the SR variables except that the few SR's with periods between
300-3904 show the same amount of excess as the Miras in this period range
suggesting a fundamental similarity between these stars and the Miras. The
major anomaly is TT CMa which has a strong 10 m silicate emission feature and
a very large excess and may be part of a binary system. Jura (1987), who
correlated the ratio of the 2 lim IRC flux to the 25 1m IRAS flux versus
period, reached a similar conclusion that the 25 im excess for all S stars
increa~es sharply for stars with P)-360 days.
Figure 5 shows that our 8-22 im excesses correiate fairly well with the
mass loss rates for S stars as calculated by Jura (i987) for all types of
st'rc - Mira, SR, Lb variables and non-variables. On the other hand only for
Miras do we find that the mass loss rate correlates with period (Figure 6).
For mass loss rates < 5x10-a M./yr no dust grain emission features are
observed and only W Cet and V441 Cyg show a very weak 8-22 .im excess.
However, the presence and strength of dust drain emission features in the 8-22
im region do not appear to correlate with mass loss rate. Whereas the mass
loss rate varies by a factor of a hundred among the Mira MS and S stars, the
contrast of the emission feature varies, seemingly randomly, by only a factor
of two. For example, W Aql, the star with the largast mass loss rate of
4.5xl0O" Mo/yr has one cf the weakest emission features (CT=16). Hence it
appears that the amount of material emitting continuum radiation in 'he CDS is
related to the mass loss rate (as expected) whereas the presence and strength
113

I b
of grain emission features appear not to be driven directly by the :nass loss
rate.
Jura (1986) found that C star Miras with P> 4 001 tend to have larger rass
loss rates. Hence, it appears that mass outflow increases significartly for
S, MS, SC and C Miras with P > 370 days. On the other hand DeGicla-E 'cc
et al. (1981) observed an increase in the infrared excess for M star Miras
with P ) 200 days, i.e. for significantly shorter periods than for 1".e more
evolved stars. Whether or not the same correlation between period and mass
loss rate exists for M Miras as for the more evolved stars should be
investigated. Also, the radioactive element technetium, as a tracer of the
third dredge-up, is found predominately in M Miras with P > 200O "Lttie,
Little-Marenin and Bauer 1987). It is likely that the onset of t e ,hrd
dredge-up should produce an increase in massloss rate and infrared excess and
should be observed for M Miras with P ) 3 0 0" rather than for P 2C&' as
suggested by DeGiola-Eastwood et al. (1981).
Whereas 4 out of 23 (17 %) of S, MS and SC Miras have no B-22 ,.m excesses
or Omission features, we find that less than 2. of the ordinary Nl Miras have
featureless photospheric continua. These M Miras (VX Aur, S Car. V581 CrA, S
Gem, X Gem. RU Lib and RW Pup) as well as the MS and S Miras without emission
features have P( 4001 except for V581 CrA which has a very uncertain 1100 day
period (Kholopov 1985). The significantly smaller percentage of M star Miras
with featureless continua may indicate that for M Miras the mass Ios. rate or
the transparency of CDS or some other factor differs significantly from that
of MS, S. and SC Miras.
VII. CONCLUSIONS
We find that the emission features of the MS, S, and SC stars show a114

17
progression of features with spectral class. Features in NS star_ rc,8e
the 10 m silicate emission and 3 component feature found in M star spectra,
to the 10.8 ;m S star feature. Strong S stars show a character~s':. ,
ieature which peaks in the 10.3-11 pm range and SC stars show featur,:
characteristic of S and C stars. A few MS and S stars show a weak, -
,m emission feature often found in M star LRS spectra. The exact ,tre
the carrier of the 3 component, the lC.5-1l n feature dnd the Lr'od -5
feature remains unidentified. However, the different emission features are
likely to be related to the changes in photospheric composition observed in
stars that evolve from M stars with C/O ( I to C stars with C/O ) 1
accompanied by a dramatic increase in s-process abundances. Since more arc
more of the available oxygen is tied up in CO as stars evolve from M->S stars
and s-process elements become more available, we propose that dust grains with
different compositions are produced in the CDS. The 3-component feature and
the typical 10.8 jim S star feature are also found in a few stars classified as
M stars. Whether or not these stars are related in their photospheric
composition to the MS and S stars needs to be investigated.
The 8-22 vm emission excess correlates with the period of pulsation for the
Miras in our sample showing a dramatic increase in emission excess for periods
between 370-400 days. No correlation between the period and 8-22 pm excess of
SR variables is found. The excess emission all types of variables (Mira, SR
and Lb) and non-variables correlates fairly well with their mass lo s rates.
IRL-M would like to thank the Air Force Systems Command for a University
Resident Research Fellowship to Air Force Geophysics Laboratory, OPC. SJL
thanks Bentley College for ao Assigned Time grant for research.

TABLE I
MS, S and SC Stars
No. Name Sp. Class Var P Temp CT feature Ex Flx(8) Mo/yr % Sil Note
(1) (2) (3) (4) (5) (6) (7) (8) (9) (10) (11)
STRONG S STARS1 X And S 3,9e M 346 1200 -- -- 15 18 2.1(-7)2 BI And S 8,8 SR 160 2500 -- -- <1 13 4.0(-8)3 Z Ant S 5,4 SR 104 520 53 br[11.2] 75 224 W Aqi S 3,9e M 490 650 16 S(10.8) 57 732 4.5(-6) 705 V865 Aqi S 7,5e: M 365 2500 -- < 2 30 4.7(-8)6 T Cam S 4,7e M 373 2500 .. .. < 2 61 5.0(-8)7 WX Cam S 5,8 Lb 2500 .. .. <10 7 1.7(-7)8 BD Cam S 5,3 Lb 2500 .. .. < 1 64 1.7(-8)9 S Cas S 4,6e M 612 550 25 S(13.5) >80 270 2.2(-6) 6510 U Cas S 5,5e M 277 2500: -- -- < 8 8 4.6(-8)11 WY Cas S 6.5pe M 477 600 30 S(10.8) 55 44 7.5(-7) 5012 IW Cas S 4.5,9e M 396 650 20 S(10.8) 49 45 5013 TT CMa S M 314 650 100 sil. >97 1314 VX Cen S 8,5e SR 308 2500 wk ? 5 6815 R Cyg S 4,9e M 426 750 24 S(10.4) 47 109 6.2(-8) 5516 AA Cyg S 7,5 SRb 213 1q00 wk wk 10: 50 8.1(-8)17 V441 Cyg 4,6 SRa 375 1200 wk? -- 13 12 4.2(-8)18 R Gem S 5,9e M 370 800 -- 20 29 1.4(-7)19 DY Gem S 8,5 SRaI145 700 34 S(11:) 42 22 1.1(-7) 45:20 pi1 Gru S 5,7e SRb 150: 750 28 S(10.7) 43 993 50:21 R Lyn S ',7e M 379 2000 27 S(10.5) 10 26 6.2(-8) --22 SU Mon S 3,6 SRb 2500: 23 S(10.9) 9 24 6.3(-8) 3023 V521 Oph S 5,4 SRb 320 3500 -- < 8 51 4.5(-8)24 RZ Sgr S 4,4ep SRb 223 700 wk -- 35 4125 ST Sgr S 5,5e M 395 1000 23 S(10.8) 30 58 9.5(-8) 6026 ST Sco S 4,6 SRa 195 800 24 brtll.6] 30 57 6.6(-8)27 V635 Sco S 7,6 Lb 2500 -- -- < 3 1828 UU Vel S 7,8e M 409 1500 60: S(11:) 20: 14 35:29 EP Vul S 6,5 Lb 900 25 11.2 20 37 0.5(-8)30 HD 191630 S 4,4 ------- 2500 -- -- < 2 1531 BD-380 4770 S 4,6 1000 22 SiC 20 15 *
MILD S and MS STARS32 W And S 6,1e M 39u 950 23 3 comp 31 187 2.7(-7)33 RW And S 6,2e M 430 750 ? ? 53 3 2.3(-7)34 NO Aur M2SIab Lc 800 37 S(10.8) 39 1 5035 RS Cnc M6111aSe SRc 120: 1000 30 sil. 32 41536 V365 Cas S 7,2 SRb 136 1200 28: S(10.5) 20 24 7.9(-8) 60:37 T Cep M 6.5e M 388 800 11 br[ll.3] 32 86938 T Cet M5-6SIIe SRc 159 700 wk? -- 22 22039 W Cet S6 ,3 -9,2e M 351 1000 -- 7 16 3.3(-8)40 TV Dra M6p(S) Lb 800 9 br[ll.3] 27 66 7.1(-8)41 S Her M6(S)e M 307 2500 -- -- < 3 45
116

19
42 ST Her M6-7IIIaS SRb 148 650 14 S:(11:) 33 209 35:
43 OP Her M511b(S) SRc 121 3500 -- -- < 1 80
44 R Hya M6.5(S)e M 389 760 11 br[11.4] 35 2068
z45 Y Lyn M6SIb-II SRc 110 950 37 S:(10.3) 40 135 90
46 RR Mon S 7,2e M 393 800 30: 3 comp 41 19 l.-'-(-7)
47 4o I Ori M3.2IIIaS SRb 30: 2500 -- -- < 1 113
48 HT Per M6(S) SR: 128: 600 27 S(10.5) 50 17 50:
49 SU Pup S 4,2e M 340 800 30 3 comp 43 15
50 RT Sco S 7,2 M 449 700 20 3 comp 52 174
51 DK Vul S 4,2 SRa 370 800 ? ? 16 19 1.6(-7)
52 HD 35155 S 4,1 2500 .. .. < 6 10 2.9(-8)
53 HD 49683 M4S 3000 .. .. < 6 8 3.0(-8)
54 HD 92681 S 5,2 2500 .. .. < 1 13
55 HD 110994 S 5,1 3500 .. .. < 3 21
56 HD 118685 S 6,2 2500 .. .. < 2 34
57 BD-36 04827 S 5,2 3500 .. .. < 2 12
SC STARS58 R Clii SC5/10=C5,1 M 338 3500 50: SiC: 15: 16
59 UY Cen SC6/8 SR 115 1200 23 S(11:) 9 63 35
60 AM Cen SC Lb 2500 v.wk ? 2 2061 S Lyr SCe M 438 630 20 S(10.9) 42 54 45
62 FU Mon C8,OJ;CS SR 310 4000 -- < 1 21
63 GP Ori C8,OJ,SC SRb 370: 2500 .. .. <10 12
64 CSS 788 SC;S5,8 3500 .. .. < 3 24
S STARS WITH LITTLE INFORMATION65 CSS 861 S 5!,0 57 non S 52 1566 CSS 929 Se 600 22 S(10.8) 51 60 5067 CSS 975 S 2500 45: br[ll.41 20: 1568 CSS 1011 S var 800 30: S:(10.9) 26: 8 40:69 CSS 1043 Se 1000 28 3 comp: 26 21
70 CSS 1146 S 380 140 sil >290 3271 CSS 1259 S 375 97 sil >210: 672 C 1633 850 25 3 comp 36 45
SPECTROSCOPIC MS STARS
73 CU Dra M3III Lb: 3000 -- 0 92 =BS 5226
74 NZ Gem M3I-IIIS SR 3500 .. .. 0 36 =BS 2967
75 DE Leo M2IIIabS SRb 4000 .. .. <12 25 =BS 4088
76 GZ Peg M4IIIS Lb? 3500 .. .. 0 124 =BS 8815
77 BS 2508 M2IIIS 3000 .. .. 0 42
78 BS 7442 M51IIaS 3000 .. .. 0 31
M STAR79 RT Aql M6eS M 327 620 24 sil 42 83
Notes:
3 Z Ant: noisy; broad feat., max at 11.2 pm and weak peaks at 10 and 13 pm
8 BD Cam = BS 1105, excess shortward of 9.5 pm
117
. . .. .... = =.H . m mi l l I~ a IH IHN I Ii I I

13 TT CMa: no 18 Pm emission feature
14 VX Cen: weak broad 9.5 - 16 pm emission feature
16 AA Cyg: weak, broad emission feature
26 ST Sco: broad 9.5 - 15 pm emission feature
29 EP Vul: emission feature with peaks at 11.3 and 13 pm; not SiC
31 BD-3804770: emission matches 11.3 pm SiC feature; maybe C star?
33 RW And: possible self-absorption at 10.5 pm
43 OP Her = BS 6702
47 4o1 Ori: emission excess shortward of 9.5 pm
51 DK Vul: possible 9.5 - 15 pm emission or possible 9.5 pm absorption feature
56 HD 118685: emission excess shortward of 9.5 Pm
59 UY Cen: absorption feature at 14 pm, probably due to C2H2 and HCN
60 AM Cen: very weak emission feature is present
61 S Lyr: LaO absorption at .74 and .79 pm; possibly an S star.
62 FU Mon: possible C2H2 and HCN absorption feature at 14 pm
65 CSS 861: asymmetric 9-14 pm emission feature with peak at 10.4 pm
67 CSS 975: broad 9.5 - 15 pm emission feature
70 CSS 1146: late M not S
72 C 1633: classified as C star; emission feature more typical of MS stars
75 DE Leo: emission excess shortward of 9.5 pm
79 RT Aql: no ZrO, no Tc (Little-Marenin, Little and Bauer 1987); prob. M
zolon (:) indicates uncertain value; wk = weak feature;
column 6: sil=10 pm silicate ft.; br=broad 9-15 pm ft.; S=10.8 pm S star ft.
118
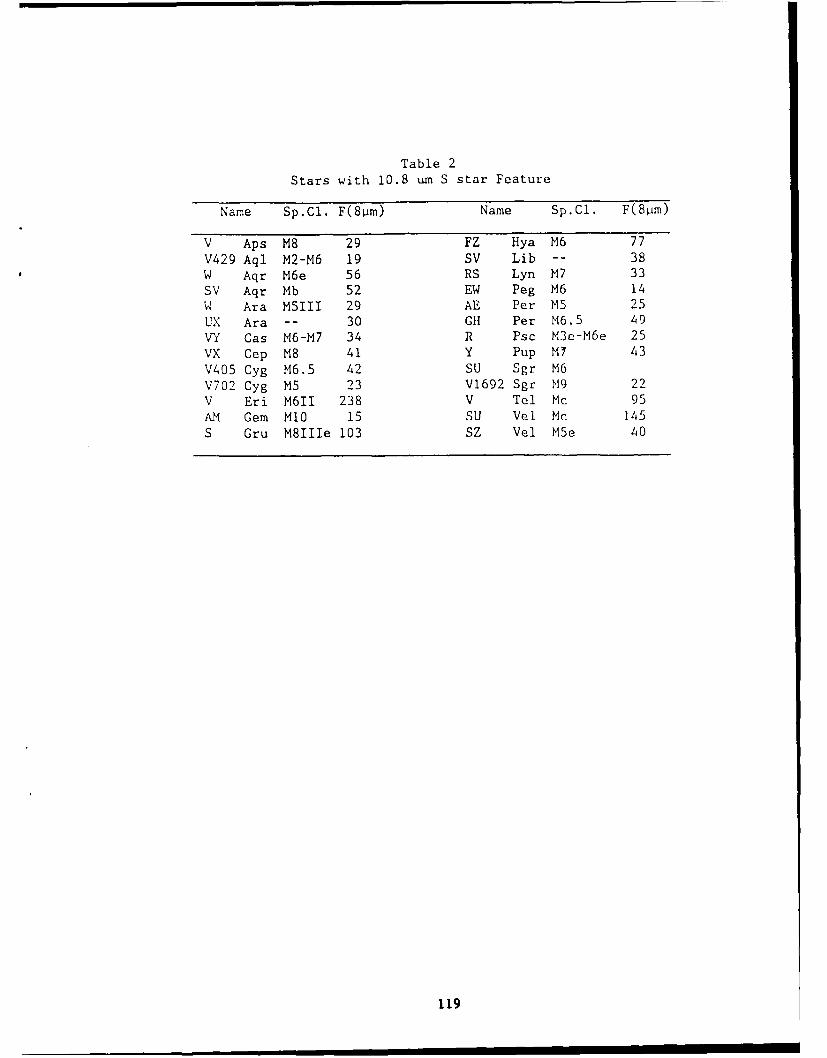
Table 2
Stars with 10.8 um S star Feature
Name Sp.Cl. F(8pm) Name Sp.Cl. F(8pm)
V Aps M8 29 FZ Hya M6 77
V429 Aql M2-M6 19 SV Lib -- 38
W Aqr M6e 56 RS Lyn M7 33
SV Aqr Mb 52 EW Peg M6 14
W Ara M5II 29 AE Per MS 25
UX Ara -- 30 GH Per M6.5 49
VY Cas M6-M7 34 R Psc M3e-M6e 25
VX Cep M8 41 Y Pup MI 43
V405 Cyg M6.5 42 SU Sgr M6
V702 Cyg M5 23 V1692 Sgr M9 22
V Eri M6I 238 V Tel Mc 95
AM Gem M10 15 SU Vel Mc 145
S Gru M8IIIe 103 SZ Vel M5e 40
119

22
REFERENCES
Allen, D.S., Hyland, A.R., Longmore, A.J., Caswell, J.L., Goss, W.M., and
Haynes, R.F. 1977, Ap.J.. 217, 108.
Benson, P.J., and Little-Marenin, I.R. 1987, Ap.J. (Lett) 316, L37.
Bode, M.F., Evans, A., Whittet, D.C.B., Aitken, D.K., Roche, P.R., and
Whitmore, B. 1984, M.N.R.A.S., 207, 897.
Catchpole, R.M. and Feast, M.W. 1971, M.N.R.A.S., 154, 197.
DeGiola-Eastwood, K., Uackwell, J.A., Grasdalen, G.L., and Gehrz, R.D. 1981,
ApLJ a 5.
Dominy, J.F., and Wallerstein, G. 1986, Astrophys.J., _ 0. 371.
Dominy, J.F., Wallerstein, G., and Suntzeff, N.B. 1986, Astrophys.J., .QQ
325.
Explanatory Supplement to the IRAS Catalogs and Atlases, 1984, Ed. C.A.
Beichman, G. Neugebauer, H.J. Habing, T.E. Clegg, T.J. Chester.
Washington, DC: US Govt. Print. Office.
Gal, 0., de Muizon, M., Papoular, R., and Pegourie, B. 1987, Astron. Ap.,
183., 29.
Gehrz, R.D., Key, E.P., Grasdalen, G.L., Hackwell, J.A., Thronson Jr, H.A.
1984, Ap.J., 281. 303.
Hoffileit, D., and Jaschek, C. 1982, Bright Star Catalogue, (Yale University
Press: New Haven).
Iben, I., Jr., and Renzini, A. 1983, Annu. Rev. Astron. Astrophys., 21, 271.
IRAS Science Working Group. 1986, Atlas of Low Resolution Spectra, Astr. Ap.,
Suppl .)8 607.
Jura, M. 1986, ApJ., _9 , 327. 120

23
Jura, M. 1987, (submitted for publication).
Keenan, P.C., and Boeshaar, P.C. 1980, Astrophys.J.Suppl., 43, 379.
Keenan, P.C., Garrison, R.F., and Deutsch, A.J. 1974, Ap.J. (Suppl.), 28, 271.
Kholopov, P.N., ed. 1985, General Catalog of Variable Stars (4th ed., Moscow:
Nauka).
Lambert, D.L., Gustafsson, B., Eriksson K., and Hinkle, K.H. 1986,
Astrophys.J. Suppl., 92, 373.
Little, S.J., Little-Marenin, I.R., and Bauer, W.H. 1987, Astron.J., qZ qqj.
Little, S.J., Little-Marenin, I.R., and Price, S.D. 1987, Cool Stars, Stellar
Systems, and the Sun, Fifth Cambridge Workshop (in press).
Little-Marenin, I.R., Benson, P.J., and Dickinson, S.J. 1988, Ap.J. (accepted
for publication)
Little-Marenin, I.R., Benson, P.J., and Little, S.J. 1987, Cool Stars, Stellar
Systems and the Su.,, Fifth Cambridge Workshop (in press),
Little-Marenin, I.R., Little, S.J., and Price, S.D. 1986, NASA, Tech. Mem.
88342, p. 137.
Mathews, G.J., Takahashi, K., Ward, R.A., and Howard, W.H. 1986, Astrophys.J.,
302 410.
Neugebauer, G., and Leighton, R.B. 1969, Two Micron Sky Survey-a preliminary
catalog, NASA SP-3047.
Nuth III, J.A., Donn, B., and Nelson, R. 1986, Ap.J., J0Q, L83.
Smith, V.V. and Lambert D.L. 1985. Astrophy s.J. 294, 326.
------------- ------- 1986, Astrophys.J., 31],1 843.
Smith, V.V., and Wallerstein, G. 1983, Astrophys.J., 27 , 742.
Snijders, M.A.J., Batt, T.J., Seaton, M.J., Blades, J.C., and Morton, D.C.
1084, M.N.R.A.S., 211, 7p. 2

24
Stephenson, C.B. 1973, Publ. Warner & Swasey Obs., 1, No.4.
1984, Publ. Warner & Swasey Obs., 3, No. 1.
Thomas, J.A., Robinson, G., and Hyland, A.R. 1976, M.N.R.A.S., 174, 711.
Utsumi, K. 1985, Cool Stars with Excesses of Heavy Elements, Ap. Space Sc.
Library, Vol 114., (eds M.Jaschek and P.C. Keenan) (I eidel:Dordrecht),
p. 243.
Wallerstein, G., and Dominy, J. F. 1988, Ap.J. (in press).
Willems, F.J. 1987, (Ph.D. thesis, University of Amsterdam).
Wing, R.F., and Yorka, S.B. 1977, M.N.R.A.S.. 178, 383.
Winters, R.R., Macklin, R.L. 1987, Ap.J., 3 1 3 , 808.
Wood, P.R. 1985, Cool Stars with Excesses of Heavy Elements, Ap. Space Sc.
Library, Vol 114. , eds M.Jaschek and P.C. Keenan (Ruidel:Do'drucht) , p.
357.
Zuckerman, B. and Dyck, M.H. 1986, Ap.J 311, 345.
122

25
FIGURE CAPTIONS
Figure 1. The observed spectrum of S Cas is matched with a 550 K blackbody
energy distribution (top panel). The difference spectrum (observed-black body
distribution) is plotted along the wavelength axis. The emission feature is
typical of the S stars. The normalized difference spectrum is matched with a
blend of 55% silicate T 45% SiC (bottom panel).
Figure 2. The observed spectrum of RT Sco is matched with a 700 K blackbody
energy distribution (top panel). The difference spectrum (observed -
blackbody energy distribution) is plotted along the wavelength axis. In the
bottom panel the average 3 component feature with peaks at 10, 11 and 13.1 pm
observed in some M stars can be compared to the very similar 3 component
feature observed in mld S and MS stars.
Figure 3a. The observed spectrum of the SC star, S Lyr, is matched with a 640
K blackbody temperature (top panel). The difference spectrum is plotted along
the wavelength axis. The normalized difference spectrum is overplotted with
the spectrum of the C star C 2976 (Stephenson 1973). The long wavelength end
of the emission feature of the two stars matches quite well. However; the
short wavelength side of the feature can matched by the co-adding a silicate
and an SiC feature.
3b. The observed spectrum of UY Cen is matched to an 1800 K blackbody energy
distribution (top panel). the difference spectrum is plotted along the
wavelength axis. The normalized difference spectrum of UY Cen is overplotted
with the difference spectrum of W Ori. A contribution of possible silicate
emission to the spectrum of UY Cen at the short wavelength side can be seen.123

26
An additional absorption feature around 14 Vm, attributed to C2H2 and HCN can
be seen in both spectra.
3c. The observed spectrum of R CMi (smoothed over 5 points) is matched with a
3500 K blackbody energy distribution. The difference spectrum is plotted
along the wavelength axis, The difference spectrum (smoothed over 3 points)
is overplotted with an average SiC feature calculated from many C stars
spectra. The two features match reasonably well. Uo additional emission at
the short wavelength side of the feature (as is observed for the S stars)
appears to be present.
Figure 4. The 8 - 22 pm excess is plotted versus the period of MrS, S and SC
Miras (open circles) and SR variables (crosses). The rapid onset of excess
emission for Miras with periods ) 370 days can be seen. Arrows on the data
points indicate upper and lower limits.
Figure 5. The mass loss rate of Miras (o) and SR and Lb variables (x) iq
plotted versus their 8 - 22 gm excess. Stars with mass loss rates of ( 5xlO -
M./yr show no emission features in their spectra and only W Cet and V441 Cyg
show a weak excess. Arrows on the data points indicate upper and lower limits.
Figure 6. The mass loss rates of Miras (dots) and SR variables (x are plotted
versus their period. The mass loss rate increases with period for Miras but
shows no correlation with puriod for the SR variables.
124

27
Addresses:
I.R. Little-Marenin, Whitin Observatory, Wellesley College, Wellesley, IMA
02181
Stephen J. Little, Department of Natural Sciences, bentley College, Waltham,
MA, 02254
125

10- S Cas S4,6 Mira P=612d i
6-,OBSERVED SPECTRUM
x ~TB61=550K
LL2 (OBSERVED-TBB)
1.0 - (OBSERVED-TB3) Normalized
I N ---55% SILICATE+45% SIC
0.5-
0.01 10 14 18 22
),Cmr)
Figure 1
126

10
RT Sco S7,2 Mria P=449d
8
6
4
2-
1.0-
0.5 1-5 1 .
0
10 14 18 22
Figure 2
127

10
8
S Lyr SC MIRA - 438d
4
- 2 TBB=640K
1.0-C Star #2976
0.5 -S Lyr SC
010 14 18 22
,AXPm)
Figure 3a
128

10
8
6 UY Cen SC6/8 SRb-115d
4
X
-JU 2 TBB= 1800K
1 .0 -- W O i C ,I -UY Cen SC6/8
0.5
Figure 3b
129

10
8
6 R CMi SC6/1O=C6,1
Mira P=338d
4
Z) TBB =3500Ku-. 2
1.0-- COMPOSITE SiC
-R OMi SC6110
0.5I
0 r 'k-...,
N10 14 18 22
Figure 3c
130

U) 0 0
0 00C: 0
2 000C)0 0 0 Q
00
<-O 0
00
0 LU
xxx x
xx
C C0 C0 C) 0 C C0 0 0 0)C0 0) 00 N co m0 :: co (N
ss~ioxg Lwl n

cio
U')
co CfDI LU
0 0 wC)
I C\jC: 0 C\4
(1)(
0 0
o )C.X(- 0
00
11 11 I I I I -T -0
(iA/OA~) sso-ssvA
132

00
0 -0
(0
-0
CD 0
CD~
0
0
1331

Appendix I
Papers Published as Part of a Conference Proceeding
135
Edtdby I-. Araki, Kyoto, J1. Ehlers, Mflnchen, K.'Hp 'Zrfch a.
Jnd. Zettartz,* Kblri H l
4, ' .
I I~*?.I 'w,
II
I- .j. J I.,
.1 . .'d ...I~ .'~~. .~l.I ....a ~ I
C ..~ . ...........
.~;.a'a~a', ~ '.''''Y''- a II0
'~ '.x .137

Cool Stars, Stellar Systems and the Sun, Lecture Notes in Physics No. 254, eds. M. Zeii;'.and R.M. Gibson, 1986
AN ANALYSIS OF IRAS LOW RESOLUTION SPECTRA LRS) OFCARBON AND M VARIABLE STARS
Irene R. Little-MareninWellesley CollegeWellesley, MA 02181
Charles WiltonUniversity of WyomingLaramie, WY 82071
IRAS, measured.250,000 point sources at 12, 25, 60 and 100 pmwhile simultaneously obtaining abodi 5000 low resolution spectra inthe 8 to 22 pm region of point sources brighter than 20 Jy at 12 and25 um with a resolution of 0.1 and 0.25 pm. This region contains thespectral signature of silcate dust (around 10 and 18 jm) and of sili-
con carbide dust (around 11 Am). indicative of oxygen-rich and carbon-rich circumstellar shells produced by mass loss from their central stars.
These dust grain features are in emission from optically thin relative-
ly hot shells.
CARBON STARS
Hfigh and low quality LRS spectra of 269 known carbon stars exist.
85% of the high quality spectra show SiC dust in emission indicating
that they are surrounded by circumstellar shells. The remaining 15%
of the spectra show only a smooth continuum. We determined the wave-
length dupendence of the emission feature by subtracting the local back-
ground continuum. This background is best matched with multi-tempera-
ture black body curves ranging in temperature from 3000K (in the 8-10pm region) to 450K (in the 13-22 jum region). This multi-component black
body continuum can also be approximated by a fourth or sixth order poly-
nomial fit in wavelength and was used in estimating the emission pro-file. The average excess emission above the local continuum is about
20% and ranges'from less than 51 to about 401. It does not appear to
correlate with other photospheric parameters such as the color tempera-ture, CN strength, the strength of the Merrill-Sanford bands due to SiC;
in the blue region of the spectrum and the period of variability.
Overplotting the normalized SiC emission features of many carbonstars (Fig. la) shows that the shape of the SiC emission is very uni-
form among the carbon stars studied independent of the strength of theemissiot;. The maximum emission occurs at 11.2 +/- 0.15 jam but minor
420
138

differences in the SiC profile do exist e.g. Y CVn. In 75% of the Cstare spectra with SiC emission, we find a second emission feature a-
round 8.2 ;im (see Fig. la). If this emission is an artifact of the IRASdata or 1s real, is not known at this point. A feature around 8.7 jmhas been observed previously and does appear to exist strongly in the
spectrum of SS Vir and T Lyr.
S la. lb.
8 10 12 14 16 18 8 10 12 14 16 18 20 22
pm Pm
Figure la. The normalized SiC emission features of C stars are over-plotted. The width of 0.15 um on the short wavelength side is rep-resentative .of the uncertainty in wavelength. The greater width of.0.4 pm on the long wavelength side occors in the overlap region ofthe two cameras and represents the greater flux errors in this re-gion.
Figure lb. The normalized silicate emission features seen in M starsare overplotted. The emission profiles show greater variation thanthe SiC profiles.
H STARS
About 60% out of the 571 high quality LRS spectra of variable Hstars (SR, Hira and Lb variables) show the silicate dust emission fea-tures above the continuum background around 10 and 18 jm. As for the
C stars we could match the continuum with two different black bodycurvesg about BOOK in the 8 to 10 jim region and about 400K in the 13to 22 jim region (cooler than for the carbon stars):
Overplotting the normalized emission (with the local continuumsubtracted) shows thatthere does appear to exist a fundamental sili-cate shape with a maximum around 9.9 pm but significant deviations fromthis shape occur (Fig. lb) in the wavelength and shape of maximum emis-
sion as well as in the onset and ending wavelengths of the emission pro-file. In general the emission profile extends to shorter wavelength asthe strength of the emission feature increased, starting shortward of
8 um for very strong emission features.The average excess emission ratio for H stars is about 30% and ran-
ges from about 5% to greater than 701. The large raL!os are less re-
421
139

liably determined since the 10 pm emission correlates somewhat with the
18 pm emission making it difficult to establish the continuum background,
Only 3% of the high quality M star spectra which show a smooth con-
tinuum can be matched with black body temperatures representative of
the stellar photospheres (2000K to 3000K). The rest show continua that
can only be matched with multi-temperature black body curves ranging
from 2000K to 800K in the 8 to 10 um region to BOOK to 400K in the 13
to 22 jum reqion indicating that we are receiving. radiation from the cir-
cumstellar shell as well. The two temperature model is only an approx-
imation to the real continuously decreasing temperature structure of
the shell. To match the background and emission features correctly,we will need to integrate the equation ot transfer through the circum-
stellar shell.
CARBON STARS WITH STRONG SILICATE EMISSION FEATURES
Four stars classified as carbon stars show the same strong 10 jim.
(and 19 jm) silicate emission feature as the H stars. These stars are
BM Gem, V778 Cyg, RV Cen and Stephenson star number 1003. It is diffi-
cult to interpret these observations since: the lifetime of material in
transit through the circumstellar shell is on the order of years to
decades. Hence material indicative of a c/o ratio less than one (sili-
cate dust emission from the shell) should not simultaneously exist with
photospheric material indicative of a C/O ratio greater than one asirplied by the carbon star classification. There are several interore-
tations possible: a) the stars have been misclassified, b) we are ob-
serving a binary system with an M and C star component, c) the observed
feature is not due to silicates despite the similarity in the profile,
and d) we are actually observing very newly formed carbon stars stillsurrounded by oxygen-rich circumstellar shells.
This research was supported by the 1985 USAF-UES Summer FacultyResearch Program/Graduate Student Summer Support Program sponsored by
the Air Force Office of Scientific Research conducted by Universal En-
ergy Systems, Inc. We would like to thank the Air Force Geophysics
Laboratory and Dr. :Stephan Price for making this opportunity available
-to us.
422
140

Proceedings of Cool Stars, Stellar Systems and the Sun, Lecture Notes in Physics, No. 25,eds. M. Zeilik And D.M. Gibson, 1986
AN ANALYSIS OF IRAS LOW RESOLUTION SPECTRA OF S STARS
Stephen J. LittleBentley CollegeWaltham, [A 02154
Irene R. little-MareninWellesley CollegeWellesley, HA 02181
The Infrared Astronomical Satellite (IRAS) carried a low resolu-
tion spectrometer (LRS) with a wavelength response covering the 8 to 22micrometer region. About 5000 LRS spectra exist of point sources bright-
er than 10 Jy at 12 and 25 micrometers. Spectra of 67 known S stars
were identified by the IRAS catalogue search.
We have analyzed the 32 highest quality S 'star spectra and find
that 19 show measurable emission features in the 9 to 13 micrometer re-gion. Most of the emission features were relatively weak, the strongestbeing about 30% of the strength of the underlying continuum and the
weakest about 10%. Four stars, Y Lyn, RS Cnc, W And, and RAFGL-2425,
show emission features resembling the silicate features of M stars. One
star, UY Can, shows a nearly pure SiC feature. Most (14) S Star emis-
sion features were centered near 10.5 micrometers, intermediate between
the silicate emission features of H stars and the silicon carbide (SiC)
features of C stars'(see the paper by Little-flarenin and Wilton at this
conference).
The identification of the intermediate wavelength feature is at
present unknown, but two possible interpretations may be suggested:
1) A previously unknown molecular species may occur in circum-
stellar shells only when stars are progressing from M to S to C by stel-
lar evolution on the asymptotic giant branch, and while the photospheric
ratio of C/O changes respectively from <1 to approximately I to 1. Webelieve that the H to S to C change occurs on a time scale of greater
than thousands of years, and that the circumstellar shell, with a life-
time of 10 to IP0 years, should represent the chemical abundances in the
photosphere. It'has been suggested at this conference (see followingremarks) that the unknown molecular species may be a form of polycyclichydrocarbon. Our intermediate wavelength feature is similar to that ob-served by Cehrz, et al. (Ap. J., 281, 303, 1984) in Nova Aql 1982 as itevolved during its dust shell development phase.
2) The intermediate wavelength feature shown by our 14 S starsmay be a blend of SiC and silicate emission. We are able to model theintermediate wavelength features of our 14 S stars with mixtures ranging
423
141

from silicate/SiC ratios of 80/20 to 50/50, see Table and Figure 1.
This explanation is a difficult one to believe if one believes molecu-
lar equili',rium calculations which preclude simultaneous formation of
silicate and SiC grains. The timescale of change for photospheric CIO
ratios is much longer than the lifetime of material in the circumstel-
lar shell.
We would like to thank the Air Force Geophysics Laboratory for
their assistance during this research. One of: us (IRL-M) would like
to acknowledge support from the USAF-UES Summer Faculty Research Pro-
gram, sponsored by the Air Force Office of Scientific Research, con-
ducted by Universal Energy Systems Inc.
TABLE I. A LIST OF THE STARS WE [AVE ANALYZED INCLUDING TIE CLASSIFI-CATION OF THEIR SPECTRA AS A COMPOSITE OF SILICATE AND SILI-CON CARBIDE EMISSION
STEPHEN- COMPOSITESON CAT. NAME SP. CL. LRS* Si0/SiC GCVS..
21 S Cas S3,4-S5,9e 22 60/40 M-61136 W And S6,le(M7) 22 100/0 M-307110 - M2S 43 50/50 -156 DY Gem $8,5(M) 42 compos. SRa-1145
230 Y Lyn M5 Ib-II(M6S) .43 100/0 Snc-110351 RS Cnc M6e Ib-II(M6S) 22 100/0 SRc?-120414 Z Ant S5,4 42 compos.F SR-104463 UY Cen SC 43 10/90 SR-115496 ST Her M6-7S 41 50/50 SRb-148
505 - Se 42 50/50514 RT Sco M6e-M7e(S) 22 70/30 M-449586 ST Sgr S5,5e 21 50/50: M-395594 S Lyr SC 41 compos.: M-438597 W Aq1 $4,9e 22 60/40 M-490
612 %AFGL-2425 - 29 100/0 -616 R Cyg $3.5,9-$6,9e 22 60/40: M-426702 Pio Gru S5,7s 42 60/40 Lb739 WY Cas Se 42 50/50 M-477741 1W Can S4.5,9e 21 compos.: M-396
LRS CLASS: FIRST DIGIT 2 - SILICATE EMISSION4 - SILICON CARBIDE E14ISSIOII
SECOND DIGITs INCREASING STRENGTH OF EMISSION (1-9)
424
142

* 0*WWAnd 100/0
A
0
:: 7T1Gru 60/40
8 10 12 14 16 18 20 22ILI 1.2pum Jim
Figure 1. Normialized profiles of the emission feature in five S stars.The dotted linox ire the m~odeled profiles for mixtures of silicate and
SiC. The proportion to the right of the star hama is the adopted mix-
tur. for each star.
425
143

Proceedings of Cool Stars, Stellar Systems and the Sun. Lecture Notes in Physics, ',co. 15-
eds. M. Zeilik and D,M. Gibson, 1986
HR 5110: AN ALGOL SYSTEM WITH RS CVn CRARACTERISTICS
I. R. Little-Plarenin,1
Jeffrey I.. Linsky2,3
Joint Institute for Laboratory Astrophysics, University of Colorado and NationalBureau of Standards, Boulder, CO 80309-0440
Theodore Simon3
Institute for Astronomy, University of Hawaii
IJILA Research Fellow 1983-84; on leave from Wellesley College.2Staff Member, Quantum Physics Division, National Bureau of Standards.3Guest Observer, International Ultraviolet Explorer.
HR 5110 (HO0 118216-811 CVn) is a close binary system (P-216) which to viewed nearly
pole-on (L-13*). A comparison of the characteristics of Algol and RS CVn systems to
those of HR 5110 shows that 11R 5110 can also be consider4d an Algol system. Because
the primary star is relatively cool (F2 IV) snd there is no apparent emission from
an accretion disk, we are able to detect In IUE spectra the emission of an active
chromosphere and transition region of the cooler secondary. HR 5110 is the only
known Algol system for which the properties of the secondary star can be studied
in detail. For a more complete discussion see Little-Harenin et al. (1986).An interpretation of HR 5110 depends critically on knowing the spectral type
and luminosity class of the two stars in the system. To accomplish this we obtained
near-infrared J11KLM photometry of H1R 5110 on the 1.3-m telescope of the Kitt Peak
National Observatory in 1980 February and June and also 1981 May. The beat fit to
the observed colors of HiR 5110 for different types of primaries (F2 V to CO V) and
secondaries (G5 IV to KI IV) is a F2 IV primary similar to a Boo and a KO IV second-
ary (V5-Vp.ITBB) for which spots cover 35-40% of the surface. The determination
that the KO IV star is spotted comes from the infrared excess (from J to H'), which
is fairly well matched with a blackbody curve of ji00 k and therefore is too hot
to be produced by dust and has the wrong wavelength dependence to be produced by
free-free emission. Our spectral synthesis differs from that of Shore and Adelman
(1984), but is in agreement with the statistics found for Algol systems by Ciuricin,
at al. (1983); every F primary has a K secondary. We obtain from the Barnes-Evans
relationship (Barnes and Evans 1976) an angular diameter of 0.47 milliarceec for
the spotted KO IV star, corresponding to a radius of 1.9-2.7 R0 for a parallax of
0:0.27 Z v 2 070.19. We conclude that the secondary fills its Roche lobe radius of
2.6 R@, as originally suggested by Conti (1967).
We obtained IUE spectra during the latter (plateau) phases of the rndio flares
of 1979 May 29-31 and 1981 April 6, 56 hours after the first major event (Simon et
sl. 1980) and 26 hours after the second. We also observed HR 5110 In 1980 February
and in 1983 August. The IUE archives yielded two additional spectra presumably
taken when the system was quiescent. Unless an unobserved flare occurred on 1981
February, the IUE data appear to show correlations with phase with maximum flux
247
144

occurring near phase of 0.5, i.e. when we observed the side of the secondary star
that faces the F star. The phnes were calculated from an ephemeris having nn epoch
of JO 2445079.478 ard period of 2.61328 days, obtained from the reanalysis of the
orbit by Lyons, et al. (1984); we have adjusted the epoch so that an orbital phase
of 0.0 corresponds to conjunction (KO star in front).
To understand and model the variations in the emission correctly we must deter-
mine which star has the activity associated with it. Conti (1967) showed that the
radial velocity variations of the Ca It emission are out of phase with those of the
F star. This emission therefore defines the orbit of the secondary star. To estah-
lish from which star the upper chromospheric and TR emission originate, we analyzed
a hIgh-dispersion short wavelength spectrum SWP 13669 taken near quadrature centered
on phase 0.27. This spectrum shown the lie It, C IV, C ii lines and, very wenKly,
the 0 1 and Si IV lines in emission. We determined the shift in wavelength of the
emission lines relative to the photospheric absorption lines of the F star by align-
ing the absorption lines of IlK 5110 with those of Procyon (F5 IV-V). The two pho-
tospheric spectra match very well. Measuring next the wavelengths of the emission
lines of 11R 5110 relative to those of Procyon as a template, we determined an ave-
rage velocity difference of +4010 a sIa .
At phase 0.27 the difference in radial
velocity between the secondary and primary in IR 5110 is about +45 ks a-
, 4.n agree-
ment with the velocity of the emission lines. The measured absolute velocity shifts
of the emission lines, corrected for orbital motion of the Earth and the spacecraft.
gave similar results. Hence this analysis shows unambiguously that the active chro-
mosphere and TR phenomena in 11R 5110 are located on the cooler KO IV star and are
not associated with the F star or with an accretion disk around the F star as in
Algol systems. No emission lines are at the velocity of the P star.
Table ' '.ats the average surface line fluxes on the assumption that all the
flux in th:! binaries originates on their cooler components. UX Ari (P-614; KO IV +
G5 V) and 11R 1099 (P-218; KO IV + G5 IV) are both known as very active RS CVn bi-
naries. The surface fluxes for H1R 5110 and the two KS CVn stars are comparable and
are much larger than the corresponding fluxes for the quiet Sun. It seems plausible
to attribute the large surface fluxes for the secondary star in the HR 5110 srypten,
like those for UX Ar and HR 1099, to rapid rotation. From the data presented by
Vilhu and Rucinski (1983, their Table 3), we estimate that for stars with rotation
periods of -3 days the difference in UV line flux between an F8 star (0 Ora) and a K
star (R 1099) is about a factor of 10. This difference at a given rotational ve-
locity in the strength of chromospheric and TR emission must be related to another
parameter, e.g. the shallower depth of the convection zone in the F stars, and hence
it is not surprising that in HR 5110 we find no evidence of emission from an active
TR associated with the F2 IV primary even though the radii of both components are
nearly the same so that their rotational velocities are nearly Identical given syn-
chronous rotation,
240
145
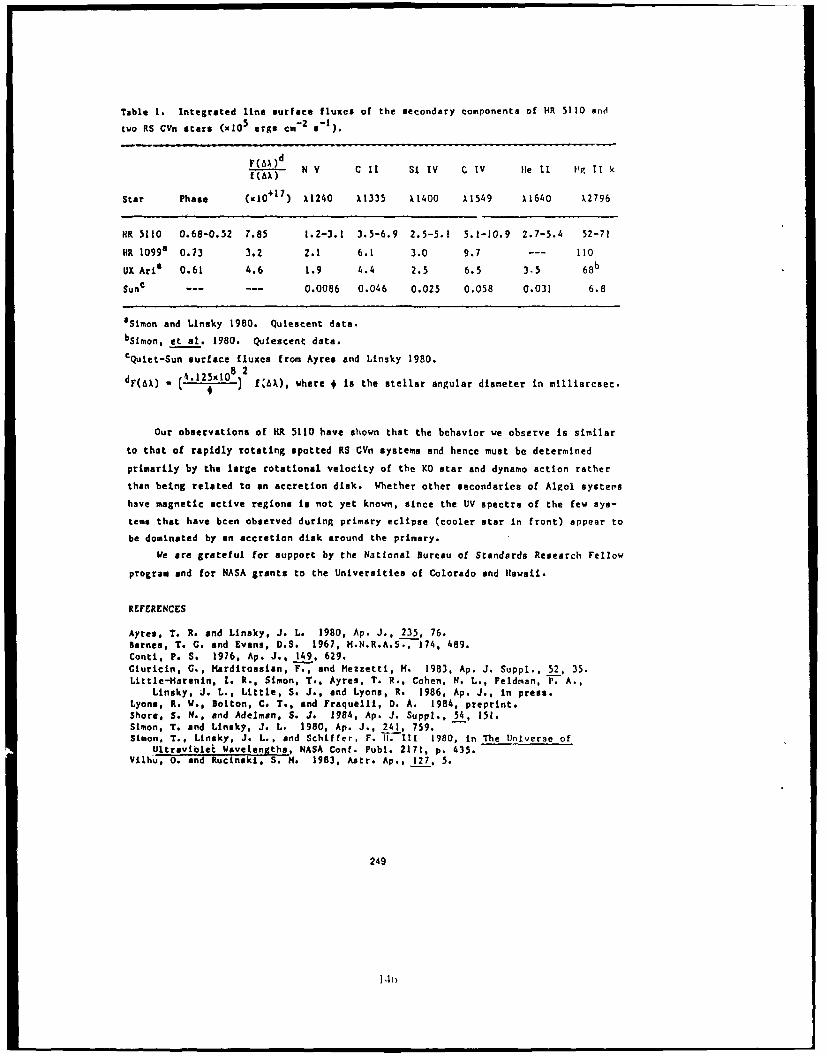
Table 1. Integrated line surface fluxes of the secondary components of HR 5110 and
two RS CV" stats (K10 5 ergs cm-2 a- ).-
FO)d N V C 11 Si IV C IV Ile 11 Mg. 11 k
Star Phase (.10* 7 ) A1240 X1335 11400 X1549 x1640 2X2796
HR 5110 0.68-0.52 7.85 1.2-3.1 3.5-6.9 2.5-5.1 5.1-10.9 2.7-5.4 52-71
HR 10998 0.73 3.2 2.1 6.1 3.0 9.7 -- 110
UX Aria 0.61 4.6 1.9 4.4 2.5 6.5 3.5 68 b
Sun c -- --- 0.0086 0.046 0.025 0.058 0.031 6.8
S5imon and Linsky 1980. Quiescent data.bSimon, et al. 1980. Quiescent data.
cQuiet-Sun surface fluxes from Ayres and Linsky 1980.
-F6X (.2i 8 ) 2f AX), where # is the stellar angular diameter in milliaresec.
Our observations of HR 5110 have shown that the behavior we observe is similar
to that of rapidly rotating spotted RS CVn systems and hence must be determined
primarily by the large rotational velocity of the KO0 star and dynamo action rather
than being related to an secretion disk. Whether other secondaries of Algol systems
have magnetic active regions Is not yet known, since the UV spectra of the few Sys-
tems that have bcen observed during primary eclipse (cooler star in front) appear to
be dominated by an accretion disk around the primary.
We ore grateful for support by the National Bureau of Standards Research Fellow
program and for NASA grants to the Universities of Colorado end Hawaii.
REFERENCES
Ayres. T. R. and Linaky, J1. L. 1980, Ap. J., 235, 76.Barnes. T. G. and Evans, D.S. 1967, H.N.R.A.S-.174, 489.Conti, P. S. 1976, Ap. J., 149, 629.Giuricin, G.. Hardirossian, F.-, and Hezzetti, M. 1983, Ap. J. Suppl.. 52, 35.Littlc-marenin, 1. Rt., Simon. T., Ayres, T. R., Cohen, N. L., Feldman. 17. A.,
Linaky, J. L.. Little, S. J., and Lyons, R. 1986, Ap. J., in press.Lyons, R. W., Bolton. C. T., and Fraquelli, D. A. 1984, preprint.Shore, S. N., and Adelman, S. J1. 1984, Ap. J1. Suppi., 54, 151.Simon, T. and Linsky, J1. L. 1980, Ap. J., 241, 759.Simon, T., Linsky, J1. L., and Schiffer, F. gi. 111 1980, in The Universe of
Uitrsviblet Wavelengths NASA Conf. Pubi. 2171, p. 435.Vilhu, 0. -a _Rucinaki, S1. M. 1983, Astr. Ap., 227, 5.
249
14o

Appendix J
Summer School on Interstellar Processes: Abstracts of Contributed Papers
147

NAbA Tectinical rvemoranaumn88
Summer School on InterstellarProcesses: Abstracts ofContributed Papers
n(II)
:4i 33
October 1986
Proceedings of a Workshop.Held atGrand Teton National Park, WyomingJuly 3 -7, 1986
NVASANational Aeronautics andSpace Administration
149

Summer School on Interstellar Processes, NASA Technical Memorandum 88342, p. 137. 1986.
THE SHAPES OF THE CIRCUMSTELLAR "SILICATE" FEATURES
Irene R. Little-Marenin (AFGL and Wellesley C.)Stephan D. Price (AFGL)
Around oxygen-rich stars we find that the spectra of most long-period variables (LPV) show an excess infrared emission which isattributed to circumstellar silicate dust grains. These grains pro-duce emission features at about 10 and 18 Pm due to bending andstretching modes of SiO respectively. It has been known (Forrest,Gillett and Stein 1975) that the spectral energy distribution of thelm emission shows variations from star to star. With the availabi-li yof many IRAS Low Resolution Spectra (LRS) in the 8-22 pm regionof H stars, we can now study the 10 pm feature to determine itsuniformity (or lack thereof). For this analysis we assume that the 8-22um emission from these stars is produced by a) the stellar photo-sphere, b) a continuum emission from the dust grains and c) a stronglywavelength dependent dust grain emission term. By representing thefirst two terms with blackbody energy distributions and subtractingthem from the observed spectrum, we are left with a remaining stronglywavelength dependent emission feature which we call the excess sili-cate or 10/im emission.
I'>M -. 137d.y.
I i 4 TU-44SK"'4
S 10 23 14 is Is 0 22 a to ig 14 Is Is 20 nA(UM)A(um)
Fig. 1. Two M star LRS spectra (V Cam and W Hor) are plottedtogether with black body energy distributiono fitted to olthor aide ofthe emission feature. The 10pim excess (observed - local black bodycontinuum) is plotted above the wavelength axis. The difference inthe shape of the excess between the two stars is obvious.
The excess silicate emissions from about 130 LPVs can be dividedinto three groups characterized by similiar spectral shapes. Allthree shapes are shown in Figure 2. The average silicate feature ofsemiregular (SRa,b,c) and irregular (Lb) variables is shown as a solidline. This feature extends from 8.4 to -14.5 um with a peak at19+9.95 pm. The FWHM is 2.1+o.15 pm but the feature is asymmetricwith the ratio of the widths-of the short wavelength (rising) branchcompared to the long wavelength (falling) branch of 0.6:1.5 at halfintensity. The rising branch shows only minor variations in wave-length from star to star whereas the wavelength at the FWHM point ofthe falling branch varies by +0.15 um. The average silicate excess ofMira variables is shown as a dashed line in Figure 2. The averagefeature extends from a to 14.5 pm with a peak at 9.75 pm and a FWHM of2.3 Um. The feature is asymmetric but on the average has a less
137
150

steeply rising branch than the other LPVs giving a ratio of the risingwidth to the falling width of 0.75:1.5 at half intensity. However,the spectral shape of the silicate emission feature among the Mirasshows much greater variation from star to star thanthat of the otherLPVs. The shape of the emission from Miras ranges from one identicalto the SRs and Lbs to a much broader one, extending from <8 pm (thelimit of the LRS detectors) to -14.5 pm with a corresponding shift inpeak emission from 10 to 9.6 um and an increase in the FWHM from 2.1to 2.4 pm. The long wavelength edge of the feature appears to varyvery little among these Miras. Hence the difference in spectral shapebetween the Miras and the other LPVs is primarily due to the fact thatin Miras the rising branch varies in wavelengths accompanied by ashift in the peak emission to shorter wavelengths. This shift toshorter wavelength correlates with the strength of the silicate ex-cess. In general the greater the strength of the feature the shorterthe wavelength of the rising branch. Unlike the results of DeGioia-Eastwood et al (1981), we find that the strength correlates only veryweakly with period. This corroborates the conclusion reached byVardya, De Jong and Willems (1981). At a given period the excess canvaryby a factor of 4. The i8,m emission feature'is very similiar inboth types 6f profiles and extends from about 15 to >22 pm. Boththese -10 pm and 18 pm features have been attribu.ted to silicates.
The most interesting 10 pm emission occurs in stars which tend toshow weak excesses but includes a few stars which have excessescomparable in strength to the stars with the other types of features(see Fig. la and ib). There are relatively few stars in this group,but they constitute almost half of the stars with weak emission ir-respective of their variability type. The feature has three com-ponents (dotted line Figure 2) with peaks at 10, 11 and 13.1 um. The1gpm peak is strongest in M stars and agrees in wavelength with thesilicate peak of the SRs but it is narrower. The intensities of the11 and 13.1 pm peaks vary greatly being at times quite weak. Thesestars show an emission excess at long wavelength which is sigificantlydifferent from the 18 pm emission. It appears to extend from about 16to 22 pm with a peak at about 19.5,pm. If the 3 component feature isalso due to silicates is not yet known. The peak at R pm seen inFigure 2 appcars to be an artifactof our method of analysis. It dis- A,, * EE,
appears if photospheric temperatures , ,,
are used to fit the shortest wave- e , -A ,lengths of the LRS. This research A A .
is supported in part by a University i, -Resident Research Fellowship fromthe Air Force Office of Scientific NResearch to the Air Force Geophysics .." "Laboratory. A "
Fig 2. The three types of i0,im excess.
REFERENCES
DeGioia-Eastwood, K., Hackwell, J.A., Grasdalen, G.L., and Gehrz,R.D. 1981, Ap.J., 245, L75.
Forrest, W.J., Gillett, F.C., and Stein, W.A. 1975, A . L 175, 423.Vardya, M.S., De Jong, T., and Willems, F.J. 1986, A , 304, L29.
138
151

Appendix K
Conference Digest: Second Haystack Observatory Meeting,Paper Entitled Water Masers Around Two Short Period Miras:
R. Ceti and RZ Scorpii
153

NORTH4EAST RADIO OBSERVATORY CORPORATION
HAYSTACK OBSERVATORY
WESTFORD, MASSACHUSETTS 01886
CONFERENCE DIGEST
Second Haystack Observatory Meeting
INTERSTELLAR MATTER
A Symposium on Interstellar Mo7rculesand Grains
in Honor of Alan 11. Barrett
OPERATED lANDF.R AGREEMENT WI'ITMASSACIIUSEITIS INSTITUT'- 0F TIECIINOLOGY
155

WATER MASERS AROUND TWO SHORT PERIOD HIRAS: R CETIand RZ RCORPTI
IRENE R. LITTLE-MARENINAFGL/OPC, Hanscom AFB, MA 01731
PRISCILLA J. BENSONWhitin Observatory, Wellesley College, Wellesley, MA02181
DALE F. DICKINSONLockheed Palo Alto Research Lab, Palo Alto, CA 94304
ABSTRACT The 22 GHz water maser line of R Cet variesin phase with the infrared lightcurve but with a phaselag of 0.1 phase. The water maser emission of RZ Scoalso appears to vary in phase.
We report the first detections of the water maser emission
line at 22,235.080 MHz from two short period M star Mira vari-
ables: R Cet (M4e-M9, P=166d) and RZ Sco (M3e-M4e, pc160d) with
the 37m Haystack Observatory' radio telescope. The intensity
of the R Cet maser line has varied by about a factor of 10 from
4.2 Jy (1/23/85; phase=0.01) to 40.8 Jy (6/9/86; phase=0.21;
TA*=3.40 (0.09) K, VLRS=+31 .20 and AV=0.64) in phase with the
visual lightcurve but with a phase lag of about 0.28 phase (Fig.
la) corresponding to a phase lag of about 0.1 phase with respect
to the K magnitude lightcurve. No other water maser lines are
visible with flux > 1 Jy (3 a). The phase lag of 0.1 phase
(about 16 days) with respect to the infrared suggests a collision-
ally pumped maser as proposed by Cooke and Elitzur I . A maser
pumped by the stellar radiation field should experience a neglig-
ible phase lag since the stellar radiation should transit through
lRadio astronomy at Haystack Observatory of the iortheastRadio Observatory Corporation is supported by the National ScienceFoundation under grant AST78-18227.
156

WArER IASER EIISSION AROUND R CET AND RZ SCO
the water masing region (less than 70 AU) in less than I light
day.
The intensity of the water maser line from RZ Sco also
appears to vary in phase being below the detection limit of 1
Jy at phase=0.98 (5/19/87) and having an intensity of 7.2 Jy at
phase=0.62 (3/23/87) (Fig. Ib). The line observed Pt phase-
=0.62 (3/23/1987) shows three components separated by 1.5 km s"
The strongest component is well fitted with a Gaussian: TA*
0.60 (0.05) K, VLRS=-1 63 .87 km s-I and AV=0.56 km s- 1.
Despite the suggestion by Feast et al. 2 that water masers
are preferentially detected from apparent bolometrically bright
(i.e. close-by Miras), we find that neither R Cet nor RZ Sco
are exceptionally bright; mbol=5. 6 mag (R Cet, d=800pc) and
mbol= 7 mag (RZ Sco, d=1600pc). The infrared colors of both
stars are typical of other maser stars. However, both Hiras
have very asymmetric lightcurves and R Cet shows strong 10 and
18 pm silicate emission features (IRAS low resolution spectrum)
indicative of a fairly optically thick circunstellar shell and
a large J, H and K amplitude. These are characteristics of
longer period Miras.
REFERENCES
I. Cooke, B., and Elitzur, M. 1985, Ap.J., 295, 1752. Feast, H. W. et al. 1982, Mon. Not., 201, 439.
R CET Mira P-166days RZ SCO Mira P-160days
o 00
S 22.2GHz0
0
-0.50 0.00 PAE0.50 1.00 -0.50 0.00 PA E0.50 1.00
Figure la~b. Thu variation of water inaser flux withj phjase
157
Appendix L
Emission Features in IRAS LRS Spectra of MS, S and SC Stars
159

Fifth Cambridge Workshop on Cool Stars,S tellar Systems and the Sun
University of Colorado at Boulder, July 8-11, 1987
161

Proceedings of the Fifth Cambridge Worksh,.p on Cool Stars, Stellar Systems and the Sun,eds. J.L. Linsky and R. Stencel, (Sringer Verlag: Heidelberg), 1987, p. 377.
EMISSION FEATURES IN IRAS LRS SPECTRA OF MS, S AND SC STARS
Stephen J. Little (Bentley College)
Irene R. LITTLE-MARENIN (AFGL/OPC and Wellesley College)
Stephan D. PRICE (AFGL/OPC)
ABSTRACT We observe a progression of emission features in the 8-11 un regionin MS, S and SC stars that parallels their increasing C:O ratio and s-process enhancements.
Stellar evolution theory predicts that M stars evolve to MS-> S-> (SC)->C stars
during the late stages of AGB evolution when helium shell flashing occurs and
helium-burning products (primarily 12C and s-process elements) are dredged up and
mixed with the outer envelope. The C:O ratio of stars during the transition changes
from -0.4 (H stars) to -0.6 (MS stars) to -0.8 (S stars) to -1.0 (SC stars) and
finally to -1.1 (C stars). At the same time the s-process elements are enhanced
from solar abundances to as much as 10-100 times solar in the carbon stars. Smith
and Lambert (1985 Ap.J.,294, 326; 1986 Ap.J.. 311, 843) estimate that 4-6 flashes
are necessary to change an M star into an S star. Many late AGB stars lose mass and
develop extensive circumstellar dust shells (CDS). The cl"Inging photospheric
composition of these stars may be reflected in the composition of the dust grains
since the lost photospheric material passes through the CDS on a time scale of 10-
100 years -- a very short time compared to the time of 104-105 years between He
shell flashes.
IRAS obtained low resolution spectra (LRS) of bright sources in the 8-22 m
region where the emission features of silicates (at 10 and 18 jam) aon of SiC (at
11.2 )im) are found. We analyzed about 70 LRS of MS, S and SC stars in order to see
if the changing photospheric composition produces unusual emission features in the
8-22 pm region. About one third of the spectra show only a smooth continuum which
can (for most stars) be matched with a 2000K to 3000K blackbody energy distribution
representative of the photospheric temperatures of these stars. These include,
unexpectedly, a number of Mira variables with periods in the 250-400 day range such
as T Cam, U Cas and V865 Aql.
Among the S stars, we generally find those with emission to have weak features
with the exceptions of TT CHa, Stephl 612 and Stephl 674 which show very strong 10
and 18 pm emission. In general, S stars with abundance classes between 4 and 9
(i.e. Sx,4 to Sx,9) show an emission feature which peaks around 10.5-11 pm, i.e it
is neither due to the usual silicate emission observed in H stars nor due to SiC.
We find this S star emission can be modeled reasonably well by co-adding the 10 un
silicate feature and the 11.2 pm SiC feature. The percentage of silicate emission
contributed to the co-added feature varies from star to stnr, but tends to lie in
the 50%-70% range. This simple co-added model produces a fit to the spectra that
162

reproduces the width of the feature well, but not the wavelergth of peak emission.
Figure 1 shows the observed LRS of S Cas (S4,6), a 640K blaclhody energy distribut-
ion matched to the underlying continuum and the difference spectrum (observqd-TBB).
The normalized difference spectrum of S Cas (bottom panel) is reasonably well
modeled with a combined feature of 55% silicate and 45% SiC. It is unclear whether
the co-addition of silicate and SiC emission is a valid description of the S star
feature, or whether a dust grain of differing composition, e.g. an s-process element
such as Zr, Y, Ba etc in combination with oxygen, may be responsible for the feat-
ure. We know of no laboratory spectrum of grains that have the emission feature
shown by many S stars.
The S stars with emission features and abundance classes of I to 2 (Sx,1 class
is also referred to as MS stars) usually show a three component feature with peaks
at 10 pm, 11 Jm and weakly at 13.1 pm. Figure 2 shows the observed LRS of RT Sco
(S7,2) matched with a 700K blackbody energy distribution and the difference spectrum
plotted along the wavelength axis. The bottom panel of Figure 2 shows the composite
three component feature of eight Sx,l and Sx,2 stars. It is very similar to the
three component feature found in about 15% of the H stars with emission features
except the 13.1 ,mfeature appears to be weaker in MS stars.
We interpret the three S stars with very strong 10 and 18 um silicate emissionfeatures as probable binary systems. This is based on our similar attribution of
silicate features found in C stars to a probable H star companion (Benson and
Little-Marenin, Ap.J.(Lett), 316, L37 and Little-Marenin, Benson and Little this
volume). The 10 and 18 pm emission is hypothesized to come from an M star with aCDS which depresses the visible light so that the S star is predominant in the
visible and near infrared region.
Of the 14 MS stars, we find 2 (Y Lyn and RS Cnc) with pure M star silicate
emission and 5 with various versions of the three component feature. -Only the MSsupergiant NO Aur appears to show the typical 10.5-11 pm S star emission. hence,
the features found in MS stars appears to span the range of features found among the
M and S stars as would be expected from stars in transition from M to S. We have
excluded from the discussion 6 stars which we call "spectroscopic" MS stars (Little,
Little-Marenin and Bauer 1987 A.J. (submitted)) because their stronger than normalSr and Ba lines are apparently produced by atmospheric efferts and not due to real
s-process enhancements. All 6 stars show only a photospheric continuum. Among the 7
SC stars, we find 3 (FU Mon, GP Ori and Stephl 442) which show only a photospheric
continuum and 4 with emission features. Of these four, two (S Lyr and UY Cen) havethe typical 10.5-11 pm S star feature and R CHi may have a nearly pure SiC feature.
The emission of AM Cen is too weak to classify accurately. In figure 3 we plot the
observed LRS of S Lyr, UY Cen and R CMI along with blackbody energy distributions
representative of their underlying continua and their difference spectra. The
normalized difference spectra of the three SC stars are overplotted wilhi differont C
163

star features (bottom panels). S Lyr and UY Cen have similar feaLures LD L; L
typical 10.5-11 pum S star feature, but the one for UY Cen h.:; its peak emissicn
shifted more towards a longer wavelength. S Lyr shows an u-identified 8-9 ;-
emission feature seen in some C stars, and UY Ceti shows an ahsorptlon feature at
pm probably due to C2H2 ' 11CN seen in some C stars (Willoms, 1987 rh.D thesis).R
CHi shows a feature close to a pure SiC spectrum, but the spectrum is noisy and hard
to interpret. R C~i has been classified as a mild carbon star, and its emissicn
appears to be more typical of many C stars than S stars.
In conclusion, we find that the emission features of the MS, S, and SC stars
span the range from the 10 and 18 pm silicate emission found in pure M star spectra,
to the 10.5-11 pm S star emission, to the 11.2 p.m SiC emission of C stars as might
be expected from stars in transition from an 0-rich to a C-rich environment with
increasing s-process abundances while on the AGO. The exact nature of the carrier
of the three component and the 10.5-11 rum feature remains unidentified. The 3-
component feature and the typical 10.5-11 pm S star feature are also found in a few
stars classified as H stars (about 15%). If these stars are related in composition
to the HS And S stars needs to be investigated further.10 1 . 10
6 Ca 84. Mra -612d <- Figure 1 8 RT Sco S7.2 Mira P-4490
6 C6 46M
-12OBSERVED SPECTRUM'
-TS,35&K Figure 2 - 4 TB-7
(OBSERVED.T 8 )
Cj 5E0.T)No~~ji~ 1.03cOMPONE4TFigure 3a,b,c 05 1.131FEATURE M STAIRS
I 00.0 0 1 MS. (Sx1,2
18 UM4 10 14 18 22
S Lf C Mra-43d Y Cen 558/18 SRb-.1 5d R CMI 556/1 0-CO. 1X 4
Mira P- 3 38d
2 TBB640K-'T T T88135Oo
-W111S%3 -COMPOSITESC0.5 ', -SLrSc ,-WINsci - -CMI SC8/10
0 S
10 14 18 22 ,10 14'18 2 10 4 18 2A(pm) A(pm) A Cum)'
164

Fifcl Cambridge Workshop on Cool Stars, Stellar Systems and the Sun, eds. J.L. Linsky andR. Stencel, (Sringer Verlag: Heidelberg) 1987, p. 396
WATER MASERS ASSOCIATED WITH TWO CARBON STARS: EU ANDROMEDAE and V778 CYGNI
Irene R. LITTLE-MARENIN
AFGL/OPC and Whitin Observatory, Wellesley College
Priscilla J. BENSONWhitin Observatory, Wellpsley College
Stephen J. LITTLEDepartment of Natural
Sciences, Bentley College, Waltham, MA
ABSTRACT We observed the 22.2 GHz H20 maser line from the two C stars EU Andand V778 Cyg. The intensity of the line has varied by more than a factor of5 over several month and the line has shown additional weaker components.We interpret the system as being binary with a C and an M star componentwith a thick shell.
Seven carbon stars are associated with oxygen-rich circumtellar shells (CS) as
deduced from the presence of strong 10 pm and 18 }m emission features in their IRAS
low resolution spectra (LRS). Only four of these carbon stars are visible with the
37 m Haystack Observatory1
radio telescope and a search for the 616-523 H20 maser
emission line at 22,235.080 MHz has proven successful for EU And and V778 Cyg. EU
And (RA-23:17:41; Dec-+46:58:00 (1950)) was detected first on 13 December, 1986 with
a flux of 8.2 Jy at VLSR--29
.4 km s
-1 (Benson and Little-Marenin 1987). The intens-
ity of the water emission has fluctuated by at least a factor of 8 over the last six
month (Figure la) and at times has shown at least one other components at -31 km s- 1
(Fig 2a) and once possibly another at -26 km s-1. V778 Cyg (11A-20:35:07; Dec=
+59:54:&8 (1950)) was first (weakly) detected on 23 March, 1937 with a flux of 1.9
Jy at'VtsR--16.8 km s-1. Since then the intensity of the maser has increased by at
least a factor of 5 to a value of 10.9 Jy on 6/9/87 (Figure lb). At times the line
has shown two components (weaker in intensity by about a factor of 3 to 4) at -20.6
km s-1
and -16.9 km s- 1
(Figure 2b). The weaker components also vary in intensity,
but not necessarily in phase with the main water line. BM Gem (RA=07:17:56; Dec=-
+25:05:03 (1950)) has been searched over a velocity range of +98+/-90 km s-1 and
NC83 (RA"19:13:55; Decm+54:12:06 (1950)) over a velocity of -180 to +180 km s-i
with negative results.
The water masers are estimated to be located in spherically expanding circum-
stellar shells with weaker components arising from masers located in the near and
far side of the shell. Half the velocity difference (i.e. about 2 - 2.5 km s-1)
should then represent the expansion velocity of the shell. Theoretical models of
H20 masing regions (Cooke and Elitzur 1985) prediCL expansion velocities of about 3-
iRadio astronomy at Haystack Observatory of the Northeast Radio ObservatoryCorporation is supported by the National Science Foundation under grant AST78-18227.
165

6 km s I (corresponding to a terminal velocity of about 10 km s-1 ) in agreement with
our observations. The water masing region is estimated to be located from 7 to 70 AU
from the central star. Hence the material outflowing from the central star will
transit through the masing region in 6 to 120 years. The transit time of materi,l
through the silicate emitting region is estimated to be between 15-20 years (ass,:,!ing
an expansion velocity of 5 km s-1 ) since models predict that the 10 pm emission
comes primarily from a distance of about 10 R* which corresponis for H star Hiras to
a distance of about 15-20 AU.
It is highly unusual to find an oxygen-rich CS (as indicated by the water maser
and 10 and 18 Pm silicate emission), around a carbon rich photosphere. There are two
main interpretations possible for the data:
A) We are observing a binary systems with a C star and an M star component with
a relatively thick circumstellar shell. The CS of the M star produces the 10 and 18
pm emission and the H20 maser line. However, the CS absorbs the visible light of
the M star so that only light from the carbon star is seen in the visible and near
infrared region.
B) We are observing the transition of an H star to a C star so that we still
observe the O-rich material in the CS for a brief time after the central star has
already become C-rich.
We favor (A), the binary system hypothesis. First, EU And was recognized as a
carbon star in the 1940's and is now classified as C4,4 (SR) and V778 Cyg was
recognized as such in 1933 and is now classified as C5",5 (Lb). The outflowing
material has traveled about 45 to 50 AU's since first being classified and should
have passed through the silicate emission region over 20-30 years ago, assuming that
we observed both stars at the instance of transition from H to C without going
through and S and SC phase. We consider this scenario highly unlikely. Only if the
water masing region is > 50 AU could we still observe O-rich material in the CS.
Secondly, for EU And, we find that the observed VLSR of the maser emission differs
from that of the C star by more than 10 km s- 1 which we interpret as being due to the
orbital velocity of the two'components. However, for V778 Cyg the water maser
velocity agrees with the velocity of the C star and may indicate that the orbital
plane of the system is more highly inclined and/or that the H and C star components
are presently moving across our line of sight and/or that the two components are more
widely separated. Assuming typical C and M star Mira masses of < 3 He (MI+M2 <6 He)
and a separation of around 2 x 30 AU (so that the water masing region will be
graviationally bound to the M star), we estimate Porb > 200 years. This value is
reasonably consistent with Porb < about 190 years for EU And if we assume an vorb >
10/2 km s"i and a-30 AU in a circular orbit.
V778 Cyg shows the typical strong CN absorption features of an Lb C star in the
0.8 - 1.08 pm region (Baumert 1972) implying that the H star is at least a magnitude
fainter in this spectral region. No information on the near infrared spectrum of EU
166
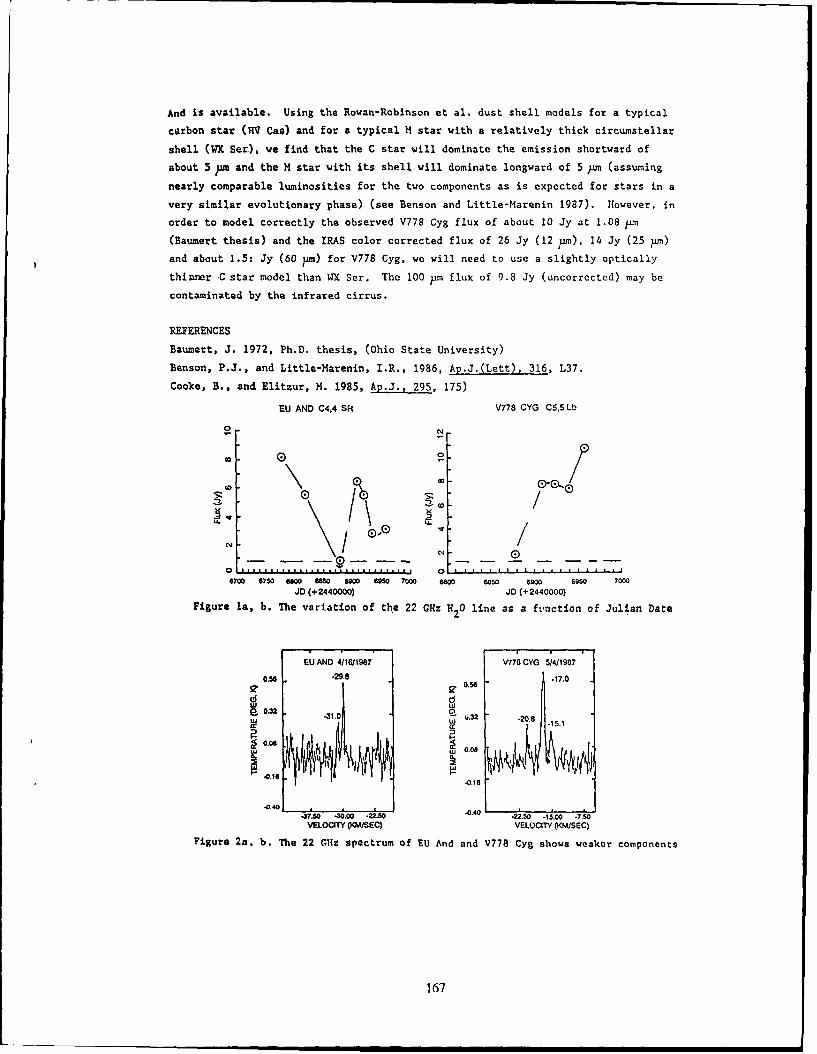
And is available. Using the Rowan-Robinson et al. dust shell models for a typical
carbon star (XV Cas) and for a typical H star with a relatively thick circumstellar
shell (WX Ser), we find that the C star will dominate the emission shortward of
about 5 um and the M star with its shell will dominate longward of 5 um (assuming
nearly comparable luminosities for the two components as is expected for stars in a
very similar evolutionary phase) (see Benson and Little-Marenin 1987). However, in
order to model correctly the observed V778 Cyg flux of about 10 Jy at 1.08 pm
(Baumert thesis) and the IRAS color corrected flux of 26 Jy (12 pm), 14 Jy (25 pm)
and about 1.5: Jy (60 pm) for V778 Cyg, we will need to use a slightly optically
thinner C star model than WX Ser. The 100 pm flux of 9.8 Jy (uncorrected) may be
contaminated by the infrared cirrus.
REFERENCES
Baumert, J. 1972, Ph.D. thesis, (Ohio State University)
Benson, P.J., and Little-Marenin, I.R., 1986, Ap.J.(Lett), 316, L37.
Cooke, B., and Elitzur, M. 1985, Ap.J., 295, 175)
EU AND C4,4 SH V778 CYG C5,5 Lb
CON N
6700 6750 680 60 60 6950 7000 6600 6850 6900 6950 7000JD (+2440000) JD (+2440000)
Figure la, b. The variation of the 22 GHz H2 0 line as a function of Julian Date
EU AND 4/1611987' V778 CYG 514/1987
o.5 -29.8 .17.0I0,2 fI1
2. 0.32 -3. q 132 - -2.
0.088
.0.16
.37.50 .30.00 22"250 -0.410 2.0 -50 .. 0VELOCITY ( MISEC) VELOCITY (KM/SEC)
Figure 2a. b. The 22 G14z spectrum of EU And and V778 Cyg shows weaker components
167

Appendix M
New Late-Type Stars with Technetium, and Missing LRS Spectra ofIRAS C and S Stars, Pub. as Poster Paper Abstracts in Bull. AAAS
169
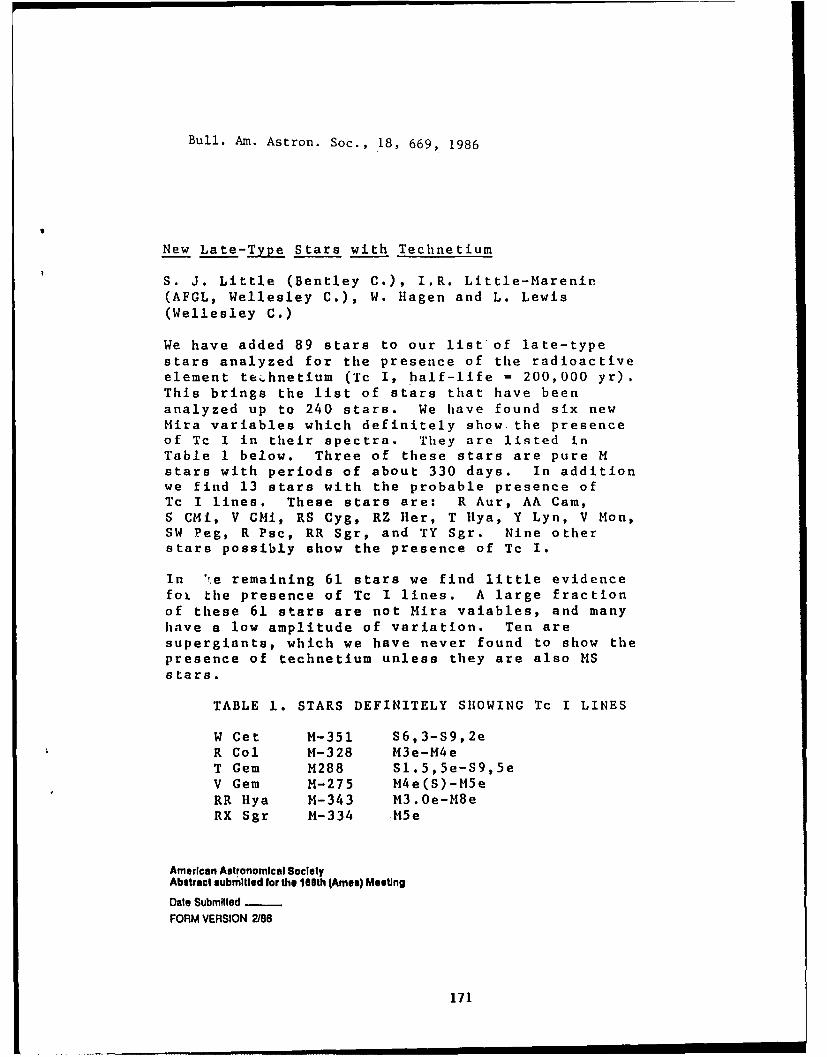
Bull. Am. Astron. Soc., 18, 669, 1986
New Late-Type Stars with Technetium
S. J. Little (Bentley C.), I.R. Little-Marenin(AFGL, Wellesley C.), W. Hagen and L. Lewis(Wellesley C.)
We have added 89 stars to our list of late-typestars analyzed for the presence of the radioactiveelement te;chnetium (Tc I, half-life - 200,000 yr).This brings the list of stars that have beenanalyzed up to 240 stars. We have found six newMira variables which definitely show. the presenceof Tc I in their spectra. They are listed inTable I below. Three of these stars are pure Mstars with periods of about 330 days. In additionwe find 13 stars with the probable presence ofTc I lines. These stars are: R Aur, AA Cam,S CHi, V Cli, RS Cyg, RZ Her, T Ilya, Y Lyn, V Mon,SW Peg, R Psc, RR Sgr, and TY Sgr. Nine otherstars possibly show the presence of Tc I.
In 'ye remaining 61 stars we find little evidencefoL the presence of Tc I lines. A large fractionof these 61 stars are not Mira vaiables, and manyhave a low amplitude of variation. Ten aresupergiants, which we have never found to show thepresence of technetium unless they are also MSstars.
TABLE 1. STARS DEFINITELY SHOWING Tc I LINES
W Cet M-351 S6,3-$9,2eR Col M-328 M3e-M4eT Gem M288 Sl.5,5e-S9,5eV Gem M-275 M4e(S)-M5eRR Ilya M-343 M3.0e-M8eRX Sgr M-334 M5e
American Astronomical SocietyAbstract submitted for the 160th (Ames) MesUng
Date SubmiliedFORM VERSION 2J86
171

Bull. Am. Astron. Soc., 18, 669, 1986
Missing LRS Spectra of IRAS C and S Stars
R.B. Culver (Colorado St. U.), I.R. Little-Marenin(AFGL, Wellesley C.), S.J. Little (Bentley C.),E.R. Craine (E/ERG)
We have made a study of IRAS low-resolution spec-tra (LRS) of both carbon and S type stars and havenoticed that some of the brightest C and S starshave no LRS. In order to make an assessment ofthe number of missing spectra, we instituted asearch of the IRAS point source and LRS Eatalog.
CARBON STARS: 337 identified carbon stars arelisted in the point source catalog with fluxdensities >8 Jy at either 12 jim or 25 pm. Ofthese 79 are riot found in the LRS catalog with 59having galactic latitudes b>/2/ and thereforefreer from the clutter with galactic place sources.
S Stars: 94 identified S stars are listed in thepoint source catalog with flux densities >8 Jy ate'ither 12 pm or 25 pm. Of these 28 have no LRSwith 18 having b>/2/.
The percentage of missing spectra for stars in theIRAS point source catalog with b>/2°/ is 19% forthe carbon stars and 17% for the S stars. Thesepercentages are far greater than the number ex-pected to be rejected by source confusion (2-3%).All but one of the point sources were observed atleast twice (most of them three times or more).The reason for the missing spectra remains unknbwn.
Aniciucnn Astronomtcul Society
Abstract submitted for the l0th (Ames) Meeling
DnIo SuhbinflodFOI IM VEI I!SION 2186
21991-500-000/40000
172